Kelly Position Size CalculatorThis position sizing calculator implements the Kelly Criterion, developed by John L. Kelly Jr. at Bell Laboratories in 1956, to determine mathematically optimal position sizes for maximizing long-term wealth growth. Unlike arbitrary position sizing methods, this tool provides a scientifically solution based on your strategy's actual performance statistics and incorporates modern refinements from over six decades of academic research.
The Kelly Criterion addresses a fundamental question in capital allocation: "What fraction of capital should be allocated to each opportunity to maximize growth while avoiding ruin?" This question has profound implications for financial markets, where traders and investors constantly face decisions about optimal capital allocation (Van Tharp, 2007).
Theoretical Foundation
The Kelly Criterion for binary outcomes is expressed as f* = (bp - q) / b, where f* represents the optimal fraction of capital to allocate, b denotes the risk-reward ratio, p indicates the probability of success, and q represents the probability of loss (Kelly, 1956). This formula maximizes the expected logarithm of wealth, ensuring maximum long-term growth rate while avoiding the risk of ruin.
The mathematical elegance of Kelly's approach lies in its derivation from information theory. Kelly's original work was motivated by Claude Shannon's information theory (Shannon, 1948), recognizing that maximizing the logarithm of wealth is equivalent to maximizing the rate of information transmission. This connection between information theory and wealth accumulation provides a deep theoretical foundation for optimal position sizing.
The logarithmic utility function underlying the Kelly Criterion naturally embodies several desirable properties for capital management. It exhibits decreasing marginal utility, penalizes large losses more severely than it rewards equivalent gains, and focuses on geometric rather than arithmetic mean returns, which is appropriate for compounding scenarios (Thorp, 2006).
Scientific Implementation
This calculator extends beyond basic Kelly implementation by incorporating state of the art refinements from academic research:
Parameter Uncertainty Adjustment: Following Michaud (1989), the implementation applies Bayesian shrinkage to account for parameter estimation error inherent in small sample sizes. The adjustment formula f_adjusted = f_kelly × confidence_factor + f_conservative × (1 - confidence_factor) addresses the overconfidence bias documented by Baker and McHale (2012), where the confidence factor increases with sample size and the conservative estimate equals 0.25 (quarter Kelly).
Sample Size Confidence: The reliability of Kelly calculations depends critically on sample size. Research by Browne and Whitt (1996) provides theoretical guidance on minimum sample requirements, suggesting that at least 30 independent observations are necessary for meaningful parameter estimates, with 100 or more trades providing reliable estimates for most trading strategies.
Universal Asset Compatibility: The calculator employs intelligent asset detection using TradingView's built-in symbol information, automatically adapting calculations for different asset classes without manual configuration.
ASSET SPECIFIC IMPLEMENTATION
Equity Markets: For stocks and ETFs, position sizing follows the calculation Shares = floor(Kelly Fraction × Account Size / Share Price). This straightforward approach reflects whole share constraints while accommodating fractional share trading capabilities.
Foreign Exchange Markets: Forex markets require lot-based calculations following Lot Size = Kelly Fraction × Account Size / (100,000 × Base Currency Value). The calculator automatically handles major currency pairs with appropriate pip value calculations, following industry standards described by Archer (2010).
Futures Markets: Futures position sizing accounts for leverage and margin requirements through Contracts = floor(Kelly Fraction × Account Size / Margin Requirement). The calculator estimates margin requirements as a percentage of contract notional value, with specific adjustments for micro-futures contracts that have smaller sizes and reduced margin requirements (Kaufman, 2013).
Index and Commodity Markets: These markets combine characteristics of both equity and futures markets. The calculator automatically detects whether instruments are cash-settled or futures-based, applying appropriate sizing methodologies with correct point value calculations.
Risk Management Integration
The calculator integrates sophisticated risk assessment through two primary modes:
Stop Loss Integration: When fixed stop-loss levels are defined, risk calculation follows Risk per Trade = Position Size × Stop Loss Distance. This ensures that the Kelly fraction accounts for actual risk exposure rather than theoretical maximum loss, with stop-loss distance measured in appropriate units for each asset class.
Strategy Drawdown Assessment: For discretionary exit strategies, risk estimation uses maximum historical drawdown through Risk per Trade = Position Value × (Maximum Drawdown / 100). This approach assumes that individual trade losses will not exceed the strategy's historical maximum drawdown, providing a reasonable estimate for strategies with well-defined risk characteristics.
Fractional Kelly Approaches
Pure Kelly sizing can produce substantial volatility, leading many practitioners to adopt fractional Kelly approaches. MacLean, Sanegre, Zhao, and Ziemba (2004) analyze the trade-offs between growth rate and volatility, demonstrating that half-Kelly typically reduces volatility by approximately 75% while sacrificing only 25% of the growth rate.
The calculator provides three primary Kelly modes to accommodate different risk preferences and experience levels. Full Kelly maximizes growth rate while accepting higher volatility, making it suitable for experienced practitioners with strong risk tolerance and robust capital bases. Half Kelly offers a balanced approach popular among professional traders, providing optimal risk-return balance by reducing volatility significantly while maintaining substantial growth potential. Quarter Kelly implements a conservative approach with low volatility, recommended for risk-averse traders or those new to Kelly methodology who prefer gradual introduction to optimal position sizing principles.
Empirical Validation and Performance
Extensive academic research supports the theoretical advantages of Kelly sizing. Hakansson and Ziemba (1995) provide a comprehensive review of Kelly applications in finance, documenting superior long-term performance across various market conditions and asset classes. Estrada (2008) analyzes Kelly performance in international equity markets, finding that Kelly-based strategies consistently outperform fixed position sizing approaches over extended periods across 19 developed markets over a 30-year period.
Several prominent investment firms have successfully implemented Kelly-based position sizing. Pabrai (2007) documents the application of Kelly principles at Berkshire Hathaway, noting Warren Buffett's concentrated portfolio approach aligns closely with Kelly optimal sizing for high-conviction investments. Quantitative hedge funds, including Renaissance Technologies and AQR, have incorporated Kelly-based risk management into their systematic trading strategies.
Practical Implementation Guidelines
Successful Kelly implementation requires systematic application with attention to several critical factors:
Parameter Estimation: Accurate parameter estimation represents the greatest challenge in practical Kelly implementation. Brown (1976) notes that small errors in probability estimates can lead to significant deviations from optimal performance. The calculator addresses this through Bayesian adjustments and confidence measures.
Sample Size Requirements: Users should begin with conservative fractional Kelly approaches until achieving sufficient historical data. Strategies with fewer than 30 trades may produce unreliable Kelly estimates, regardless of adjustments. Full confidence typically requires 100 or more independent trade observations.
Market Regime Considerations: Parameters that accurately describe historical performance may not reflect future market conditions. Ziemba (2003) recommends regular parameter updates and conservative adjustments when market conditions change significantly.
Professional Features and Customization
The calculator provides comprehensive customization options for professional applications:
Multiple Color Schemes: Eight professional color themes (Gold, EdgeTools, Behavioral, Quant, Ocean, Fire, Matrix, Arctic) with dark and light theme compatibility ensure optimal visibility across different trading environments.
Flexible Display Options: Adjustable table size and position accommodate various chart layouts and user preferences, while maintaining analytical depth and clarity.
Comprehensive Results: The results table presents essential information including asset specifications, strategy statistics, Kelly calculations, sample confidence measures, position values, risk assessments, and final position sizes in appropriate units for each asset class.
Limitations and Considerations
Like any analytical tool, the Kelly Criterion has important limitations that users must understand:
Stationarity Assumption: The Kelly Criterion assumes that historical strategy statistics represent future performance characteristics. Non-stationary market conditions may invalidate this assumption, as noted by Lo and MacKinlay (1999).
Independence Requirement: Each trade should be independent to avoid correlation effects. Many trading strategies exhibit serial correlation in returns, which can affect optimal position sizing and may require adjustments for portfolio applications.
Parameter Sensitivity: Kelly calculations are sensitive to parameter accuracy. Regular calibration and conservative approaches are essential when parameter uncertainty is high.
Transaction Costs: The implementation incorporates user-defined transaction costs but assumes these remain constant across different position sizes and market conditions, following Ziemba (2003).
Advanced Applications and Extensions
Multi-Asset Portfolio Considerations: While this calculator optimizes individual position sizes, portfolio-level applications require additional considerations for correlation effects and aggregate risk management. Simplified portfolio approaches include treating positions independently with correlation adjustments.
Behavioral Factors: Behavioral finance research reveals systematic biases that can interfere with Kelly implementation. Kahneman and Tversky (1979) document loss aversion, overconfidence, and other cognitive biases that lead traders to deviate from optimal strategies. Successful implementation requires disciplined adherence to calculated recommendations.
Time-Varying Parameters: Advanced implementations may incorporate time-varying parameter models that adjust Kelly recommendations based on changing market conditions, though these require sophisticated econometric techniques and substantial computational resources.
Comprehensive Usage Instructions and Practical Examples
Implementation begins with loading the calculator on your desired trading instrument's chart. The system automatically detects asset type across stocks, forex, futures, and cryptocurrency markets while extracting current price information. Navigation to the indicator settings allows input of your specific strategy parameters.
Strategy statistics configuration requires careful attention to several key metrics. The win rate should be calculated from your backtest results using the formula of winning trades divided by total trades multiplied by 100. Average win represents the sum of all profitable trades divided by the number of winning trades, while average loss calculates the sum of all losing trades divided by the number of losing trades, entered as a positive number. The total historical trades parameter requires the complete number of trades in your backtest, with a minimum of 30 trades recommended for basic functionality and 100 or more trades optimal for statistical reliability. Account size should reflect your available trading capital, specifically the risk capital allocated for trading rather than total net worth.
Risk management configuration adapts to your specific trading approach. The stop loss setting should be enabled if you employ fixed stop-loss exits, with the stop loss distance specified in appropriate units depending on the asset class. For stocks, this distance is measured in dollars, for forex in pips, and for futures in ticks. When stop losses are not used, the maximum strategy drawdown percentage from your backtest provides the risk assessment baseline. Kelly mode selection offers three primary approaches: Full Kelly for aggressive growth with higher volatility suitable for experienced practitioners, Half Kelly for balanced risk-return optimization popular among professional traders, and Quarter Kelly for conservative approaches with reduced volatility.
Display customization ensures optimal integration with your trading environment. Eight professional color themes provide optimization for different chart backgrounds and personal preferences. Table position selection allows optimal placement within your chart layout, while table size adjustment ensures readability across different screen resolutions and viewing preferences.
Detailed Practical Examples
Example 1: SPY Swing Trading Strategy
Consider a professionally developed swing trading strategy for SPY (S&P 500 ETF) with backtesting results spanning 166 total trades. The strategy achieved 110 winning trades, representing a 66.3% win rate, with an average winning trade of $2,200 and average losing trade of $862. The maximum drawdown reached 31.4% during the testing period, and the available trading capital amounts to $25,000. This strategy employs discretionary exits without fixed stop losses.
Implementation requires loading the calculator on the SPY daily chart and configuring the parameters accordingly. The win rate input receives 66.3, while average win and loss inputs receive 2200 and 862 respectively. Total historical trades input requires 166, with account size set to 25000. The stop loss function remains disabled due to the discretionary exit approach, with maximum strategy drawdown set to 31.4%. Half Kelly mode provides the optimal balance between growth and risk management for this application.
The calculator generates several key outputs for this scenario. The risk-reward ratio calculates automatically to 2.55, while the Kelly fraction reaches approximately 53% before scientific adjustments. Sample confidence achieves 100% given the 166 trades providing high statistical confidence. The recommended position settles at approximately 27% after Half Kelly and Bayesian adjustment factors. Position value reaches approximately $6,750, translating to 16 shares at a $420 SPY price. Risk per trade amounts to approximately $2,110, representing 31.4% of position value, with expected value per trade reaching approximately $1,466. This recommendation represents the mathematically optimal balance between growth potential and risk management for this specific strategy profile.
Example 2: EURUSD Day Trading with Stop Losses
A high-frequency EURUSD day trading strategy demonstrates different parameter requirements compared to swing trading approaches. This strategy encompasses 89 total trades with a 58% win rate, generating an average winning trade of $180 and average losing trade of $95. The maximum drawdown reached 12% during testing, with available capital of $10,000. The strategy employs fixed stop losses at 25 pips and take profit targets at 45 pips, providing clear risk-reward parameters.
Implementation begins with loading the calculator on the EURUSD 1-hour chart for appropriate timeframe alignment. Parameter configuration includes win rate at 58, average win at 180, and average loss at 95. Total historical trades input receives 89, with account size set to 10000. The stop loss function is enabled with distance set to 25 pips, reflecting the fixed exit strategy. Quarter Kelly mode provides conservative positioning due to the smaller sample size compared to the previous example.
Results demonstrate the impact of smaller sample sizes on Kelly calculations. The risk-reward ratio calculates to 1.89, while the Kelly fraction reaches approximately 32% before adjustments. Sample confidence achieves 89%, providing moderate statistical confidence given the 89 trades. The recommended position settles at approximately 7% after Quarter Kelly application and Bayesian shrinkage adjustment for the smaller sample. Position value amounts to approximately $700, translating to 0.07 standard lots. Risk per trade reaches approximately $175, calculated as 25 pips multiplied by lot size and pip value, with expected value per trade at approximately $49. This conservative position sizing reflects the smaller sample size, with position sizes expected to increase as trade count surpasses 100 and statistical confidence improves.
Example 3: ES1! Futures Systematic Strategy
Systematic futures trading presents unique considerations for Kelly criterion application, as demonstrated by an E-mini S&P 500 futures strategy encompassing 234 total trades. This systematic approach achieved a 45% win rate with an average winning trade of $1,850 and average losing trade of $720. The maximum drawdown reached 18% during the testing period, with available capital of $50,000. The strategy employs 15-tick stop losses with contract specifications of $50 per tick, providing precise risk control mechanisms.
Implementation involves loading the calculator on the ES1! 15-minute chart to align with the systematic trading timeframe. Parameter configuration includes win rate at 45, average win at 1850, and average loss at 720. Total historical trades receives 234, providing robust statistical foundation, with account size set to 50000. The stop loss function is enabled with distance set to 15 ticks, reflecting the systematic exit methodology. Half Kelly mode balances growth potential with appropriate risk management for futures trading.
Results illustrate how favorable risk-reward ratios can support meaningful position sizing despite lower win rates. The risk-reward ratio calculates to 2.57, while the Kelly fraction reaches approximately 16%, lower than previous examples due to the sub-50% win rate. Sample confidence achieves 100% given the 234 trades providing high statistical confidence. The recommended position settles at approximately 8% after Half Kelly adjustment. Estimated margin per contract amounts to approximately $2,500, resulting in a single contract allocation. Position value reaches approximately $2,500, with risk per trade at $750, calculated as 15 ticks multiplied by $50 per tick. Expected value per trade amounts to approximately $508. Despite the lower win rate, the favorable risk-reward ratio supports meaningful position sizing, with single contract allocation reflecting appropriate leverage management for futures trading.
Example 4: MES1! Micro-Futures for Smaller Accounts
Micro-futures contracts provide enhanced accessibility for smaller trading accounts while maintaining identical strategy characteristics. Using the same systematic strategy statistics from the previous example but with available capital of $15,000 and micro-futures specifications of $5 per tick with reduced margin requirements, the implementation demonstrates improved position sizing granularity.
Kelly calculations remain identical to the full-sized contract example, maintaining the same risk-reward dynamics and statistical foundations. However, estimated margin per contract reduces to approximately $250 for micro-contracts, enabling allocation of 4-5 micro-contracts. Position value reaches approximately $1,200, while risk per trade calculates to $75, derived from 15 ticks multiplied by $5 per tick. This granularity advantage provides better position size precision for smaller accounts, enabling more accurate Kelly implementation without requiring large capital commitments.
Example 5: Bitcoin Swing Trading
Cryptocurrency markets present unique challenges requiring modified Kelly application approaches. A Bitcoin swing trading strategy on BTCUSD encompasses 67 total trades with a 71% win rate, generating average winning trades of $3,200 and average losing trades of $1,400. Maximum drawdown reached 28% during testing, with available capital of $30,000. The strategy employs technical analysis for exits without fixed stop losses, relying on price action and momentum indicators.
Implementation requires conservative approaches due to cryptocurrency volatility characteristics. Quarter Kelly mode is recommended despite the high win rate to account for crypto market unpredictability. Expected position sizing remains reduced due to the limited sample size of 67 trades, requiring additional caution until statistical confidence improves. Regular parameter updates are strongly recommended due to cryptocurrency market evolution and changing volatility patterns that can significantly impact strategy performance characteristics.
Advanced Usage Scenarios
Portfolio position sizing requires sophisticated consideration when running multiple strategies simultaneously. Each strategy should have its Kelly fraction calculated independently to maintain mathematical integrity. However, correlation adjustments become necessary when strategies exhibit related performance patterns. Moderately correlated strategies should receive individual position size reductions of 10-20% to account for overlapping risk exposure. Aggregate portfolio risk monitoring ensures total exposure remains within acceptable limits across all active strategies. Professional practitioners often consider using lower fractional Kelly approaches, such as Quarter Kelly, when running multiple strategies simultaneously to provide additional safety margins.
Parameter sensitivity analysis forms a critical component of professional Kelly implementation. Regular validation procedures should include monthly parameter updates using rolling 100-trade windows to capture evolving market conditions while maintaining statistical relevance. Sensitivity testing involves varying win rates by ±5% and average win/loss ratios by ±10% to assess recommendation stability under different parameter assumptions. Out-of-sample validation reserves 20% of historical data for parameter verification, ensuring that optimization doesn't create curve-fitted results. Regime change detection monitors actual performance against expected metrics, triggering parameter reassessment when significant deviations occur.
Risk management integration requires professional overlay considerations beyond pure Kelly calculations. Daily loss limits should cease trading when daily losses exceed twice the calculated risk per trade, preventing emotional decision-making during adverse periods. Maximum position limits should never exceed 25% of account value in any single position regardless of Kelly recommendations, maintaining diversification principles. Correlation monitoring reduces position sizes when holding multiple correlated positions that move together during market stress. Volatility adjustments consider reducing position sizes during periods of elevated VIX above 25 for equity strategies, adapting to changing market conditions.
Troubleshooting and Optimization
Professional implementation often encounters specific challenges requiring systematic troubleshooting approaches. Zero position size displays typically result from insufficient capital for minimum position sizes, negative expected values, or extremely conservative Kelly calculations. Solutions include increasing account size, verifying strategy statistics for accuracy, considering Quarter Kelly mode for conservative approaches, or reassessing overall strategy viability when fundamental issues exist.
Extremely high Kelly fractions exceeding 50% usually indicate underlying problems with parameter estimation. Common causes include unrealistic win rates, inflated risk-reward ratios, or curve-fitted backtest results that don't reflect genuine trading conditions. Solutions require verifying backtest methodology, including all transaction costs in calculations, testing strategies on out-of-sample data, and using conservative fractional Kelly approaches until parameter reliability improves.
Low sample confidence below 50% reflects insufficient historical trades for reliable parameter estimation. This situation demands gathering additional trading data, using Quarter Kelly approaches until reaching 100 or more trades, applying extra conservatism in position sizing, and considering paper trading to build statistical foundations without capital risk.
Inconsistent results across similar strategies often stem from parameter estimation differences, market regime changes, or strategy degradation over time. Professional solutions include standardizing backtest methodology across all strategies, updating parameters regularly to reflect current conditions, and monitoring live performance against expectations to identify deteriorating strategies.
Position sizes that appear inappropriately large or small require careful validation against traditional risk management principles. Professional standards recommend never risking more than 2-3% per trade regardless of Kelly calculations. Calibration should begin with Quarter Kelly approaches, gradually increasing as comfort and confidence develop. Most institutional traders utilize 25-50% of full Kelly recommendations to balance growth with prudent risk management.
Market condition adjustments require dynamic approaches to Kelly implementation. Trending markets may support full Kelly recommendations when directional momentum provides favorable conditions. Ranging or volatile markets typically warrant reducing to Half or Quarter Kelly to account for increased uncertainty. High correlation periods demand reducing individual position sizes when multiple positions move together, concentrating risk exposure. News and event periods often justify temporary position size reductions during high-impact releases that can create unpredictable market movements.
Performance monitoring requires systematic protocols to ensure Kelly implementation remains effective over time. Weekly reviews should compare actual versus expected win rates and average win/loss ratios to identify parameter drift or strategy degradation. Position size efficiency and execution quality monitoring ensures that calculated recommendations translate effectively into actual trading results. Tracking correlation between calculated and realized risk helps identify discrepancies between theoretical and practical risk exposure.
Monthly calibration provides more comprehensive parameter assessment using the most recent 100 trades to maintain statistical relevance while capturing current market conditions. Kelly mode appropriateness requires reassessment based on recent market volatility and performance characteristics, potentially shifting between Full, Half, and Quarter Kelly approaches as conditions change. Transaction cost evaluation ensures that commission structures, spreads, and slippage estimates remain accurate and current.
Quarterly strategic reviews encompass comprehensive strategy performance analysis comparing long-term results against expectations and identifying trends in effectiveness. Market regime assessment evaluates parameter stability across different market conditions, determining whether strategy characteristics remain consistent or require fundamental adjustments. Strategic modifications to position sizing methodology may become necessary as markets evolve or trading approaches mature, ensuring that Kelly implementation continues supporting optimal capital allocation objectives.
Professional Applications
This calculator serves diverse professional applications across the financial industry. Quantitative hedge funds utilize the implementation for systematic position sizing within algorithmic trading frameworks, where mathematical precision and consistent application prove essential for institutional capital management. Professional discretionary traders benefit from optimized position management that removes emotional bias while maintaining flexibility for market-specific adjustments. Portfolio managers employ the calculator for developing risk-adjusted allocation strategies that enhance returns while maintaining prudent risk controls across diverse asset classes and investment strategies.
Individual traders seeking mathematical optimization of capital allocation find the calculator provides institutional-grade methodology previously available only to professional money managers. The Kelly Criterion establishes theoretical foundation for optimal capital allocation across both single strategies and multiple trading systems, offering significant advantages over arbitrary position sizing methods that rely on intuition or fixed percentage approaches. Professional implementation ensures consistent application of mathematically sound principles while adapting to changing market conditions and strategy performance characteristics.
Conclusion
The Kelly Criterion represents one of the few mathematically optimal solutions to fundamental investment problems. When properly understood and carefully implemented, it provides significant competitive advantage in financial markets. This calculator implements modern refinements to Kelly's original formula while maintaining accessibility for practical trading applications.
Success with Kelly requires ongoing learning, systematic application, and continuous refinement based on market feedback and evolving research. Users who master Kelly principles and implement them systematically can expect superior risk-adjusted returns and more consistent capital growth over extended periods.
The extensive academic literature provides rich resources for deeper study, while practical experience builds the intuition necessary for effective implementation. Regular parameter updates, conservative approaches with limited data, and disciplined adherence to calculated recommendations are essential for optimal results.
References
Archer, M. D. (2010). Getting Started in Currency Trading: Winning in Today's Forex Market (3rd ed.). John Wiley & Sons.
Baker, R. D., & McHale, I. G. (2012). An empirical Bayes approach to optimising betting strategies. Journal of the Royal Statistical Society: Series D (The Statistician), 61(1), 75-92.
Breiman, L. (1961). Optimal gambling systems for favorable games. In J. Neyman (Ed.), Proceedings of the Fourth Berkeley Symposium on Mathematical Statistics and Probability (pp. 65-78). University of California Press.
Brown, D. B. (1976). Optimal portfolio growth: Logarithmic utility and the Kelly criterion. In W. T. Ziemba & R. G. Vickson (Eds.), Stochastic Optimization Models in Finance (pp. 1-23). Academic Press.
Browne, S., & Whitt, W. (1996). Portfolio choice and the Bayesian Kelly criterion. Advances in Applied Probability, 28(4), 1145-1176.
Estrada, J. (2008). Geometric mean maximization: An overlooked portfolio approach? The Journal of Investing, 17(4), 134-147.
Hakansson, N. H., & Ziemba, W. T. (1995). Capital growth theory. In R. A. Jarrow, V. Maksimovic, & W. T. Ziemba (Eds.), Handbooks in Operations Research and Management Science (Vol. 9, pp. 65-86). Elsevier.
Kahneman, D., & Tversky, A. (1979). Prospect theory: An analysis of decision under risk. Econometrica, 47(2), 263-291.
Kaufman, P. J. (2013). Trading Systems and Methods (5th ed.). John Wiley & Sons.
Kelly Jr, J. L. (1956). A new interpretation of information rate. Bell System Technical Journal, 35(4), 917-926.
Lo, A. W., & MacKinlay, A. C. (1999). A Non-Random Walk Down Wall Street. Princeton University Press.
MacLean, L. C., Sanegre, E. O., Zhao, Y., & Ziemba, W. T. (2004). Capital growth with security. Journal of Economic Dynamics and Control, 28(4), 937-954.
MacLean, L. C., Thorp, E. O., & Ziemba, W. T. (2011). The Kelly Capital Growth Investment Criterion: Theory and Practice. World Scientific.
Michaud, R. O. (1989). The Markowitz optimization enigma: Is 'optimized' optimal? Financial Analysts Journal, 45(1), 31-42.
Pabrai, M. (2007). The Dhandho Investor: The Low-Risk Value Method to High Returns. John Wiley & Sons.
Shannon, C. E. (1948). A mathematical theory of communication. Bell System Technical Journal, 27(3), 379-423.
Tharp, V. K. (2007). Trade Your Way to Financial Freedom (2nd ed.). McGraw-Hill.
Thorp, E. O. (2006). The Kelly criterion in blackjack sports betting, and the stock market. In L. C. MacLean, E. O. Thorp, & W. T. Ziemba (Eds.), The Kelly Capital Growth Investment Criterion: Theory and Practice (pp. 789-832). World Scientific.
Van Tharp, K. (2007). Trade Your Way to Financial Freedom (2nd ed.). McGraw-Hill Education.
Vince, R. (1992). The Mathematics of Money Management: Risk Analysis Techniques for Traders. John Wiley & Sons.
Vince, R., & Zhu, H. (2015). Optimal betting under parameter uncertainty. Journal of Statistical Planning and Inference, 161, 19-31.
Ziemba, W. T. (2003). The Stochastic Programming Approach to Asset, Liability, and Wealth Management. The Research Foundation of AIMR.
Further Reading
For comprehensive understanding of Kelly Criterion applications and advanced implementations:
MacLean, L. C., Thorp, E. O., & Ziemba, W. T. (2011). The Kelly Capital Growth Investment Criterion: Theory and Practice. World Scientific.
Vince, R. (1992). The Mathematics of Money Management: Risk Analysis Techniques for Traders. John Wiley & Sons.
Thorp, E. O. (2017). A Man for All Markets: From Las Vegas to Wall Street. Random House.
Cover, T. M., & Thomas, J. A. (2006). Elements of Information Theory (2nd ed.). John Wiley & Sons.
Ziemba, W. T., & Vickson, R. G. (Eds.). (2006). Stochastic Optimization Models in Finance. World Scientific.
Pesquisar nos scripts por "stop loss"

Alpha - Combined BreakoutThis Pine Script indicator, "Alpha - Combined Breakout," is a combination between Smart Money Breakout Signals and UT Bot Alert, The UT Bot Alert indicator was initially developer by Yo_adriiiiaan
The idea of original code belongs HPotter.
This Indicator helps you identify potential trading opportunities by combining two distinct strategies: Smart Money Breakout and a modified UT Bot (likely a variation of the Ultimate Trend Bot). It provides visual signals, draws lines for potential take profit (TP) and stop loss (SL) levels, and includes a dashboard to track performance metrics.
Tutorial:
Understanding and Using the "Alpha - Combined Breakout" Indicator
This indicator is designed for traders looking for confirmation of market direction and potential entry/exit points by blending structural analysis with a trend-following oscillator.
How it Works (General Concept)
The indicator combines two main components:
Smart Money Breakout: This part identifies significant breaks in market structure, which "smart money" traders often use to gauge shifts in supply and demand. It looks for higher highs/lows or lower highs/lows and flags when these structural points are broken.
UT Bot: This is a trend-following component that generates buy and sell signals based on price action relative to an Average True Range (ATR) based trailing stop.
You can choose to use these signals independently or combined to generate trading alerts and visual cues on your chart. The dashboard provides a quick overview of how well the signals are performing based on your chosen settings and display mode.
Parameters and What They Do
Let's break down each input parameter:
1. Smart Money Inputs
These settings control how the indicator identifies market structure and breakouts.
swingSize (Market Structure Time-Horizon):
What it does: This integer value defines the number of candles used to identify significant "swing" (pivot) points—highs and lows.
Effect: A larger swingSize creates a smoother market structure, focusing on longer-term trends. This means signals might appear less frequently and with some delay but could be more reliable for higher timeframes or broader market movements. A smaller swingSize will pick up more minor market structure changes, leading to more frequent but potentially noisier signals, suitable for lower timeframes or scalping.
Analogy: Think of it like a zoom level on your market structure map. Higher values zoom out, showing only major mountain ranges. Lower values zoom in, showing every hill and bump.
bosConfType (BOS Confirmation Type):
What it does: This string input determines how a Break of Structure (BOS) is confirmed. You have two options:
'Candle Close': A breakout is confirmed only if a candle's closing price surpasses the previous swing high (for bullish) or swing low (for bearish).
'Wicks': A breakout is confirmed if any part of the candle (including its wick) surpasses the previous swing high or low.
Effect: 'Candle Close' provides stronger, more conservative confirmation, as it implies sustained price movement beyond the structure. 'Wicks' provides earlier, more aggressive signals, as it captures momentary breaches of the structure.
Analogy: Imagine a wall. 'Candle Close' means the whole person must get over the wall. 'Wicks' means even a finger touching over the top counts as a breach.
choch (Show CHoCH):
What it does: A boolean (true/false) input to enable or disable the display of "Change of Character" (CHoCH) labels. CHoCH indicates the first structural break against the current dominant trend.
Effect: When true, it helps identify early signs of a potential trend reversal, as it marks where the market's "character" (its tendency to make higher highs/lows or lower lows/highs) first changes.
BULL (Bullish Color) & BEAR (Bearish Color):
What they do: These color inputs allow you to customize the visual appearance of bullish and bearish signals and lines drawn by the Smart Money component.
Effect: Purely cosmetic, helps with visual identification on the chart.
sm_tp_sl_multiplier (SM TP/SL Multiplier (ATR)):
What it does: A float value that acts as a multiplier for the Average True Range (ATR) to calculate the Take Profit (TP) and Stop Loss (SL) levels specifically when you're in "Smart Money Only" mode. It uses the ATR calculated by the UT Bot's nLoss_ut as its base.
Effect: A higher multiplier creates wider TP/SL levels, potentially leading to fewer trades but larger wins/losses. A lower multiplier creates tighter TP/SL levels, potentially leading to more frequent but smaller wins/losses.
2. UT Bot Alerts Inputs
These parameters control the behavior and sensitivity of the UT Bot component.
a_ut (UT Key Value (Sensitivity)):
What it does: This integer value adjusts the sensitivity of the UT Bot.
Effect: A higher value makes the UT Bot less sensitive to price fluctuations, resulting in fewer and potentially more reliable signals. A lower value makes it more sensitive, generating more signals, which can include more false signals.
Analogy: Like a noise filter. Higher values filter out more noise, keeping only strong signals.
c_ut (UT ATR Period):
What it does: This integer sets the look-back period for the Average True Range (ATR) calculation used by the UT Bot. ATR measures market volatility.
Effect: This period directly influences the calculation of the nLoss_ut (which is a_ut * xATR_ut), thus defining the distance of the trailing stop loss and take profit levels. A longer period makes the ATR smoother and less reactive to sudden price spikes. A shorter period makes it more responsive.
h_ut (UT Signals from Heikin Ashi Candles):
What it does: A boolean (true/false) input to determine if the UT Bot calculations should use standard candlestick data or Heikin Ashi candlestick data.
Effect: Heikin Ashi candles smooth out price action, often making trends clearer and reducing noise. Using them for UT Bot signals can lead to smoother, potentially delayed signals that stay with a trend longer. Standard candles are more reactive to raw price changes.
3. Line Drawing Control Buttons
These crucial boolean inputs determine which type of signals will trigger the drawing of TP/SL/Entry lines and flags on your chart. They act as a priority system.
drawLinesUtOnly (Draw Lines: UT Only):
What it does: If checked (true), lines and flags will only be drawn when the UT Bot generates a buy/sell signal.
Effect: Isolates UT Bot signals for visual analysis.
drawLinesSmartMoneyOnly (Draw Lines: Smart Money Only):
What it does: If checked (true), lines and flags will only be drawn when the Smart Money Breakout logic generates a bullish/bearish breakout.
Effect: Overrides drawLinesUtOnly if both are checked. Isolates Smart Money signals.
drawLinesCombined (Draw Lines: UT & Smart Money (Combined)):
What it does: If checked (true), lines and flags will only be drawn when both a UT Bot signal AND a Smart Money Breakout signal occur on the same bar.
Effect: Overrides both drawLinesUtOnly and drawLinesSmartMoneyOnly if checked. Provides the strictest entry criteria for line drawing, looking for strong confluence.
Dashboard Metrics Explained
The dashboard provides performance statistics based on the lines drawing control button selected. For example, if "Draw Lines: UT Only" is active, the dashboard will show stats only for UT Bot signals.
Total Signals: The total number of buy or sell signals generated by the selected drawing mode.
TP1 Win Rate: The percentage of signals where the price reached Take Profit 1 (TP1) before hitting the Stop Loss.
TP2 Win Rate: The percentage of signals where the price reached Take Profit 2 (TP2) before hitting the Stop Loss.
TP3 Win Rate: The percentage of signals where the price reached Take Profit 3 (TP3) before hitting the Stop Loss. (Note: TP1, TP2, TP3 are in order of distance from entry, with TP3 being furthest.)
SL before any TP rate: This crucial metric shows the number of times the Stop Loss was hit / the percentage of total signals where the stop loss was triggered before any of the three Take Profit levels were reached. This gives you a clear picture of how often a trade resulted in a loss without ever moving into profit target territory.
Short Tutorial: How to Use the Indicator
Add to Chart: Open your TradingView chart, go to "Indicators," search for "Alpha - Combined Breakout," and add it to your chart.
Access Settings: Once added, click the gear icon next to the indicator name on your chart to open its settings.
Choose Your Signal Mode:
For UT Bot only: Uncheck "Draw Lines: Smart Money Only" and "Draw Lines: UT & Smart Money (Combined)". Ensure "Draw Lines: UT Only" is checked.
For Smart Money only: Uncheck "Draw Lines: UT Only" and "Draw Lines: UT & Smart Money (Combined)". Ensure "Draw Lines: Smart Money Only" is checked.
For Combined Signals: Check "Draw Lines: UT & Smart Money (Combined)". This will override the other two.
Adjust Parameters:
Start with default settings. Observe how the signals appear on your chosen asset and timeframe.
Refine Smart Money: If you see too many "noisy" market structure breaks, increase swingSize. If you want earlier breakouts, try "Wicks" for bosConfType.
Refine UT Bot: Adjust a_ut (Sensitivity) to get more or fewer UT Bot signals. Change c_ut (ATR Period) if you want larger or smaller TP/SL distances. Experiment with h_ut to see if Heikin Ashi smoothing suits your trading style.
Adjust TP/SL Multiplier: If using "Smart Money Only" mode, fine-tune sm_tp_sl_multiplier to set appropriate risk/reward levels.
Interpret Signals & Lines:
Buy/Sell Flags: These indicate the presence of a signal based on your selected drawing mode.
Entry Line (Blue Solid): This is where the signal was generated (usually the close price of the signal candle).
SL Line (Red/Green Solid): Your calculated stop loss level.
TP Lines (Dashed): Your three calculated take profit levels (TP1, TP2, TP3, where TP3 is the furthest target).
Smart Money Lines (BOS/CHoCH): These lines indicate horizontal levels where market structure breaks occurred. CHoCH labels might appear at the first structural break against the prior trend.
Monitor Dashboard: Pay attention to the dashboard in the top right corner. This dynamically updates to show the win rates for each TP and, crucially, the "SL before any TP rate." Use these statistics to evaluate the effectiveness of the indicator's signals under your current settings and chosen mode.
*
Set Alerts (Optional): You can set up alerts for any of the specific signals (UT Bot Long/Short, Smart Money Bullish/Bearish, or the "Line Draw" combined signals) to notify you when they occur, even if you're not actively watching the chart.
By following this tutorial, you'll be able to effectively use and customize the "Alpha - Combined Breakout" indicator to suit your trading strategy.

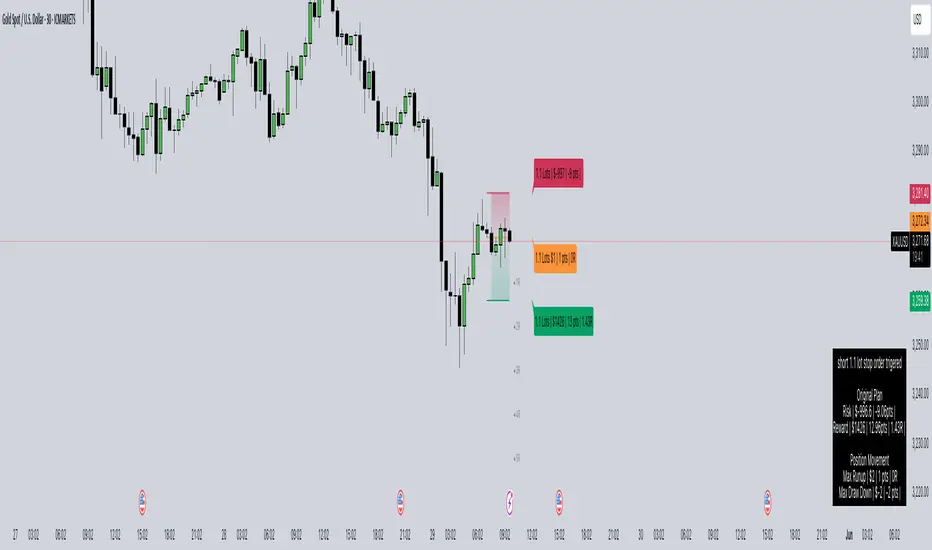
LotSize CalculatorLotSize Calculator Documentation
Overview
The LotSize Calculator is a powerful TradingView indicator designed to help traders calculate optimal position sizes based on risk management principles. It provides a visual representation of trade setups, including entry points, stop losses, and take profits, while calculating the appropriate lot size based on your risk preferences.
Key Features
Automatic lot size calculation based on risk amount
Support for multiple asset classes (forex, commodities, indices, etc.)
Visual R-multiple levels (1R to 5R)
Real-time position tracking with drawdown and run-up statistics
Customizable visual elements and display options
Input Parameters
Risk Management Settings
Risk Amount Type: Choose between risking a fixed amount in dollars ($) or a specific lot size.
Risk Amount: The amount you want to risk on the trade (in dollars if Risk Amount Type is set to $, or in lots if set to Lots).
Overwrite TP: Optional setting to automatically set take profit at a specific R-multiple (1R, 2R, 3R, 4R, or 5R).
Table Comments: Optional field to add personal notes to the position table.
Trade Setup Levels
Trigger Price: The price at which your trade will be entered.
Stop Loss: Your predetermined exit price to limit losses.
Take Profit: Your target price to secure profits.
Time Of Setup Start Bar: The starting time for your trade setup window.
Display Settings
Plot Position Labels: Toggle to show/hide position information labels on the chart.
Plot Position Table: Toggle to show/hide the position information table.
Show Money: Toggle to display monetary values ($) in the labels and table.
Show Points: Toggle to display point values in the labels and table.
Show Ticks: Toggle to display tick values in the labels and table.
Visual Appearance
Entry Color: Color for entry level line and labels.
Take Profit Color: Color for take profit level line and labels.
Stop Loss Color: Color for stop loss level line and labels.
Label Text Color: Color for text in the position labels.
Table Background: Background color for the position information table.
Table Text: Text color for the position information table.
R Labels: Color for the R-multiple level labels.
Table Position: Position of the information table on the chart (options: Bottom Right, Bottom Left, Bottom Middle, Top Right, Top Middle).
How to Use
Basic Setup
Set your entry price in the "Trigger Price" field.
Set your stop loss level in the "Stop Loss" field.
Set your take profit level in the "Take Profit" field.
Choose your risk amount type ($ or Lots) and enter the risk amount.
Optionally, select an R-multiple for automatic take profit calculation.
Understanding the Display
The indicator will show:
Horizontal lines for entry, stop loss, and take profit levels
Colored zones between entry and take profit (potential profit zone) and between entry and stop loss (potential loss zone)
R-multiple levels based on your risk (1R, 2R, 3R, 4R, 5R)
A table displaying:
Position type (long/short) and size
Original risk and reward figures
Maximum run-up and drawdown during the trade
Trade Monitoring
Once a trade is triggered (either by price crossing a stop entry or reaching a limit entry), the indicator tracks:
Current position value
Maximum run-up (highest profit seen)
Maximum drawdown (largest loss seen)
Trade outcome when take profit or stop loss is hit
Advanced Features
Asset Type Detection
The LotSize Calculator automatically detects the type of asset being traded (forex, commodity, index, etc.) and adjusts calculations accordingly to ensure accurate position sizing.
R-Multiple Visualization
R-multiples help visualize potential reward relative to risk. For example, 2R means the potential reward is twice the amount risked. The indicator displays these levels directly on your chart for easy reference.
Adaptive Position Labels
Position labels adjust their display based on trade direction (long or short) and include relevant information about risk, reward, and current position status.
Best Practices
Always confirm your risk is appropriate for your account size (typically 1-2% of account per trade).
Use the R-multiple visualization to ensure your trades offer favorable risk-to-reward ratios.
The indicator works best when used alongside your existing strategy for entry and exit signals.
Customize the visual appearance to match your chart theme for better visibility.
Troubleshooting
If position calculations seem incorrect, verify that the indicator is detecting the correct instrument type.
For forex pairs, ensure your broker's lot size conventions match those used by the indicator.
The indicator may need adjustment for certain exotic instruments or markets with unusual tick sizes.
Flux Charts - SFX Screener💎 GENERAL OVERVIEW
The SFX Screener by Flux Charts is a multi-timeframe market scanner that extracts and visually organizes key conditions detected by the SFX Algo indicator across multiple assets in real-time. It does not perform independent analysis or generate new signals—instead, it pulls data directly from the SFX Algo’s calculations to ensure full alignment across different timeframes and tickers.
The SFX Algo is a multi-factor trading indicator that integrates trend analysis, signal generation, market overlays, and take-profit/stop-loss levels into a single system. It evaluates multiple trend components, including EMA direction, momentum shifts, and volatility cycles, to determine market conditions. Signal generation is based on an Adjusted Weighted Majority Algorithm, filtering out weaker signals by prioritizing the most reliable market indicators. Market overlays, such as Volatility Bands and the Retracement Wave, provide dynamic support, resistance, exit points, and entry points. Its adaptable structure allows traders to customize settings based on strategy preferences, making it effective for scalping, swing trading, and long-term trend analysis.
The SFX Screener’s purpose is to give traders a dashboard view of these SFX Algo signals across multiple tickers and timeframes in real-time.
📌 HOW DOES IT WORK ?
The SFX Algo indicator employs an Adjusted Weighted Majority algorithm to generate "buy" and "sell" signals. It evaluates multiple market indicators ("experts"), including momentum, ATR trends, and EMA trends, and assigns weights based on their recent performance. The "Time Weighting" setting allows users to balance between using more historical data or prioritizing recent trends. Unlike traditional weighted majority methods, SFX also dynamically penalizes larger losses. Signals are confirmed based on the consensus of the most successful indicators within the selected time period, filtering out weaker signals during underperforming phases.
The SFX Screener extracts these calculated outputs and visually organizes them into a real-time dashboard. Each signal, status, and volatility condition displayed in the screener is a direct output from the SFX Algo indicator.
🚩 UNIQUENESS
Unlike traditional screeners that rely on preset filters or static conditions, the SFX Screener dynamically updates its dashboard based on live outputs from the SFX Algo’s adaptive algorithm.
Traditional Screeners → Use predefined filters like “price above EMA” or “RSI overbought.” They do not adjust to market dynamics.
SFX Screener → Displays outputs directly from an adaptive algorithm that continuously evaluates trends, volatility, and momentum changes.
The SFX Screener can show SFX Algo's status on 8 different tickers on different timeframes. Key factors that make it unique include:
✅ Real-time sync with SFX Algo → Displays live conditions, not static filters.
✅ Comprehensive Dashboard – This screener provides a complete and customizable dashboard designed to enhance traders' decision-making by consolidating crucial SFX Algo insights into one user-friendly interface.
✅ Multi-Ticker & Multi-Timeframe Analysis – With support for up to 8 tickers and timeframes, traders can effortlessly analyze the bigger market picture, identifying trends and opportunities across different assets and timeframes.
By combining multiple analytical elements in a single view, this screener empowers traders with the insights needed to navigate the market more effectively.
🎯 SFX SCREENER FEATURES:
SFX Algo Signals : This tool can detect SFX Algo signals across different tickers & timeframes.
Volatility Bands : Detection of Volatility Bands Status & Retests.
Retracement Wave : Detection of Retracement Wave Status & Retests.
Highly Configurable : Offers multiple parameters for fine-tuning detection settings.
Up to 8 Tickers : Allows traders to analyze multiple tickers & timeframes simultaneously for enhanced accuracy.
📊 SFX SCREENER DATA BREAKDOWN
Signal ->
Buy -> The latest signal is a buy signal.
Sell -> The latest signal is a sell signal.
The rating of the signal is shown after the signal type.
Δ⭐ ->
Shows the rating change (delta) after the signal is triggered. Positive values mean that the rating is increased after the signal is given, negative values mean that it's decreased.
Status ->
Displays the amount of time passed after the signal is given.
TP Targets ->
Shows the Take-Profit targets of the signal, if a target was achieved, there is a ✅ symbol near it and the next target it displayed.
V. Bands ->
The Volatility Bands dynamically adjust to market conditions, expanding during high volatility and contracting during low volatility. When the volatility bands are tight, or the upper and lower bands are close to each other, the market is not volatile. During periods of low volatility, it’s common for price to consolidate or move sideways. An early indication of a large price move can occur when the bands widen or open up after being tight. When the volatility bands are wide, it reflects a period of increased volatility, typically during strong price trends or after a breakout. The volatility bands can also act as support and resistance areas. The upper band acts as resistance while the lower band acts as support. These mark out good areas for potential reversals. Breakouts can also occur when price moves beyond the bands, signaling a potential trend in the breakout direction.
Outside -> The price is currently outside of the Volatility Bands.
Inside | Upper -> The price is currently inside the Upper Volatility Band.
Inside | Lower -> The price is currently inside the Lower Volatility Band.
R. Wave ->
The Retracement Wave is used to identify entry points during pullbacks in trending markets. It can also be used to find exit points for open trades. The wave is bullish when price is above it and bearish when the price is below it. The retracement wave can be used as an area to enter during a pullback in a trending market. The wave can also be helpful for managing risk and closing out positions.
Outside | Bullish -> The Retracement Wave is currently Bullish, and the price is outside of it.
Outside | Bearish -> The Retracement Wave is currently Bearish, and the price is outside of it.
Inside | Bullish -> The Retracement Wave is currently Bullish, and the price is inside of it.
Inside | Bearish -> The Retracement Wave is currently Bearish, and the price is inside of it.
Profit & Loss (P&L) ->
Shows the amount of profit or loss the position is currently in. All values are shown in terms of percentage, and positive values mean the position is in profit while negative values mean that the position is in loss.
⚠ Timeframe Restriction : The selected timeframes for analysis cannot be lower than the chart’s current timeframe to ensure proper data alignment.
⏰ ALERTS
This screener supports alerts, so you never miss a key market move. You can choose to receive alerts when a buy or sell signal is given, helping you spot potential trading opportunities. Additionally, you can enable alerts for take-profit or stop-loss levels, which notify you when the price achieves those levels. The alerts will work for each enabled ticker in the settings. You can also toggle webhook format for alerts, and choose to include ticker metadata in it.
⚙️ SETTINGS
1. Algorithm Settings
Sensitivity: The sensitivity setting is a key parameter that influences the frequency of signals the SFX Algo generates. By adjusting this parameter, you can control the frequency of signals produced by the algorithm. Using a lower sensitivity setting generates more frequent signals that are highly responsive to minor price fluctuations. Using a higher sensitivity setting reduces the frequency of signals, focusing on more significant price movements and filtering out minor fluctuations.
Signal Strength: The Signal Strength setting filters signals based on their quality, allowing traders to focus on the most reliable opportunities. This feature helps traders balance the quantity and reliability of the algorithm’s signals to suit their trading strategy. Using a lower signal strength will display more signals, including those with lower signal ratings, for broader market coverage. Using a higher signal strength will display fewer signals by prioritizing those with higher signal ratings, reducing market noise.
Time Weighting: The Time Weighting setting in the SFX Algo determines how historical market data is analyzed to generate signals.
a) Recent Trends
Focuses on the most recent movements for short-term analysis. This setting is good for scalpers and intraday traders who need to react quickly to market changes.
b) Mixed Trends
Balances recent and historical price movements for a comprehensive market view. This setting is well-suited for swing traders and those who want to capture medium-term opportunities by combining the benefits of short-term responsiveness with the reliability of long-term trends.
c) Long-term Trends
Relies on extended historical market data to identify broader market trends, making it an excellent choice for traders focused on long-term strategies.
Minimum Star Rating : The Minimum Star Rating setting allows you to filter signals based on their strength, showing only those that meet or exceed your chosen threshold. For instance, setting the minimum star rating to 3 ensures you only receive signals with a rating of 3 stars or higher.
2. Take Profit / Stop Loss Methods
Key Levels
The Key Levels method uses pivot points to set take profit and stop-loss levels. The TP and SL levels are shown when a new signal is generated.
Volatility Bands
This TP/SL method uses the Volatility Bands overlay to set dynamic TP and SL levels. These levels are not predetermined so they will not be shown in advance when a signal is generated.
Signal Rating
Sets take profit and stop-loss levels based on changes in a signal's rating strength. These levels are not predetermined so they will not be shown in advance when a signal is generated.
Auto Stop-Loss
The auto method can only be applied to the SL. The auto method allows the algorithm to detect SL automatically when a momentum shift is detected. You can adjust the risk tolerance of the Auto SL by adjusting the ‘Auto Risk Tolerance’ setting. You can choose between Low, Medium, and High. A high-risk tolerance will result in stop losses being triggered less often.
3. Tickers
You can set, then enable or disable up to 8 tickers in this section to get informed about their latest SFX Algo signal.
‼️ Important Notes
TradingView has limitations when running advanced screeners, resulting in the following restrictions:
Computation Errors:
The computation of using MTF features and viewing several tickers is very intensive on TradingView. This can sometimes cause calculation timeouts. When this occurs simply force the recalculation by modifying one indicator’s settings or by removing the indicator and adding it to your chart again.
Inconsistencies:
You may notice inconsistencies when viewing the screener on a chart with a specific symbol because screener tickers originate from different markets. Since the cryptocurrency market operates 24/7, while stock markets have defined opening and closing hours, the screener may return varying information depending on whether you're currently viewing a cryptocurrency, stock, or currency pair.

(Early Test) Weekly Seasonality with Dynamic Kelly Criterion# Enhancing Trading Strategies with the Weekly Seasonality Dynamic Kelly Criterion Indicator
Amidst this pursuit to chase price, a common pitfall emerges: an overemphasis on price movements without adequate attention to risk management, probabilistic analysis, and strategic position sizing. To address these challenges, I developed the **Weekly Seasonality with Dynamic Kelly Criterion Indicator**. It is designed to refocus traders on essential aspects of trading, such as risk management and probabilistic returns, thereby catering to both short-term swing traders and long-term investors aiming for tax-efficient positions.
## The Motivation Behind the Indicator
### Overemphasis on Price: A Common Trading Pitfall
Many traders concentrate heavily on price charts and technical indicators, often neglecting the underlying principles of risk management and probabilistic analysis. This overemphasis on price can lead to:
- **Overtrading:** Making frequent trades based solely on price movements without considering the associated risks.
- **Poor Risk Management:** Failing to set appropriate stop-loss levels or position sizes, increasing the potential for significant losses.
- **Emotional Trading:** Letting emotions drive trading decisions rather than objective analysis, which can result in impulsive and irrational trades.
### The Need for Balanced Focus
To achieve sustained trading success, it is crucial to balance price analysis with robust risk management and probabilistic strategies. Key areas of focus include:
1. **Risk Management:** Implementing strategies to protect capital, such as setting stop-loss orders and determining appropriate position sizes based on risk tolerance.
2. **Probabilistic Analysis:** Assessing the likelihood of various market outcomes to make informed trading decisions.
3. **Swing Trading Percent Returns:** Capitalizing on short- to medium-term price movements by buying assets below their average return and selling them above.
## Introducing the Weekly Seasonality with Dynamic Kelly Criterion Indicator
The **Weekly Seasonality with Dynamic Kelly Criterion Indicator** is designed to integrate these essential elements into a comprehensive tool that aids traders in making informed, risk-aware decisions. Below, we explore the key components and functionalities of this indicator.
### Key Components of the Indicator
1. **Average Return (%)**
- **Definition:** The mean percentage return for each week across multiple years.
- **Purpose:** Serves as a benchmark to identify weeks with above or below-average performance, guiding buy and sell decisions.
2. **Positive Percentage (%)**
- **Definition:** The proportion of weeks that yielded positive returns.
- **Purpose:** Indicates the consistency of positive returns, helping traders gauge the reliability of certain weeks for trading.
3. **Volatility (%)**
- **Definition:** The standard deviation of weekly returns.
- **Purpose:** Measures the variability of returns, providing insights into the risk associated with trading during specific weeks.
4. **Kelly Ratio**
- **Definition:** A mathematical formula used to determine the optimal size of a series of bets to maximize the logarithmic growth of capital.
- **Purpose:** Balances potential returns against risks, guiding traders on the appropriate position size to take.
5. **Adjusted Kelly Fraction**
- **Definition:** The Kelly Ratio adjusted based on user-defined risk tolerance and external factors like Federal Reserve (Fed) stance.
- **Purpose:** Personalizes the Kelly Criterion to align with individual risk preferences and market conditions, enhancing risk management.
6. **Position Size ($)**
- **Definition:** The calculated amount to invest based on the Adjusted Kelly Fraction.
- **Purpose:** Ensures that position sizes are aligned with risk management strategies, preventing overexposure to any single trade.
7. **Max Drawdown (%)**
- **Definition:** The maximum observed loss from a peak to a trough of a portfolio, before a new peak is attained.
- **Purpose:** Assesses the worst-case scenario for losses, crucial for understanding potential capital erosion.
### Functionality and Benefits
- **Weekly Data Aggregation:** Aggregates weekly returns across multiple years to provide a robust statistical foundation for decision-making.
- **Quarterly Filtering:** Allows users to filter weeks based on quarters, enabling seasonality analysis and tailored strategies aligned with specific timeframes.
- **Dynamic Risk Adjustment:** Incorporates the Dynamic Kelly Criterion to adjust position sizes in real-time based on changing risk profiles and market conditions.
- **User-Friendly Visualization:** Presents all essential metrics in an organized Summary Table, facilitating quick and informed decision-making.
## The Origin of the Kelly Criterion and Addressing Its Limitations
### Understanding the Kelly Criterion
The Kelly Criterion, developed by John L. Kelly Jr. in 1956, is a formula used to determine the optimal size of a series of bets to maximize the long-term growth of capital. The formula considers both the probability of winning and the payout ratio, balancing potential returns against the risk of loss.
**Kelly Formula:**
\
Where:
- \( b \) = the net odds received on the wager ("b to 1")
- \( p \) = probability of winning
- \( q \) = probability of losing ( \( q = 1 - p \) )
### The Risk of Ruin
While the Kelly Criterion is effective in optimizing growth, it carries inherent risks:
- **Overbetting:** If the input probabilities or payout ratios are misestimated, the Kelly Criterion can suggest overly aggressive position sizes, leading to significant losses.
- **Assumption of Constant Probabilities:** The criterion assumes that probabilities remain constant, which is rarely the case in dynamic markets.
- **Ignoring External Factors:** Traditional Kelly implementations do not account for external factors such as Federal Reserve rates, margin requirements, or market volatility, which can impact risk and returns.
### Addressing Traditional Limitations
Recognizing these limitations, the **Weekly Seasonality with Dynamic Kelly Criterion Indicator** introduces enhancements to the traditional Kelly approach:
- **Incorporation of Fed Stance:** Adjusts the Kelly Fraction based on the current stance of the Federal Reserve (neutral, dovish, or hawkish), reflecting broader economic conditions that influence market behavior.
- **Margin and Leverage Considerations:** Accounts for margin rates and leverage, ensuring that position sizes remain within manageable risk parameters.
- **Dynamic Adjustments:** Continuously updates position sizes based on real-time risk assessments and probabilistic analyses, mitigating the risk of ruin associated with static Kelly implementations.
## How the Indicator Aids Traders
### For Short-Term Swing Traders
Short-term swing traders thrive on capitalizing over weekly price movements. The indicator aids them by:
- **Identifying Favorable Weeks:** Highlights weeks with above-average returns and favorable volatility, guiding entry and exit points.
- **Optimal Position Sizing:** Utilizes the Adjusted Kelly Fraction to determine the optimal amount to invest, balancing potential returns with risk exposure.
- **Probabilistic Insights:** Provides metrics like Positive Percentage (%) and Kelly Ratio to assess the likelihood of favorable outcomes, enhancing decision-making.
### For Long-Term Tax-Free Investors
This is effectively a drop-in replacement for DCA which uses fixed position size that doesn't change based on market conditions, as a result, it's like catching multiple falling knifes by the blade and smiling with blood on your hand... I don't know about you, but I'd rather juggle by the hilt and look like an actual professional...
Long-term investors, especially those seeking tax-free positions (e.g., through retirement accounts), benefit from:
- **Consistent Risk Management:** Ensures that position sizes are aligned with long-term capital preservation strategies.
- **Seasonality Analysis:** Allows for strategic positioning based on historical performance trends across different weeks and quarters.
- **Dynamic Adjustments:** Adapts to changing market conditions, maintaining optimal risk profiles over extended investment horizons.
### Developers
Please double check the logic and functionality because I think there are a few issue and I need to crowd source solutions and be responsible about the code I publish. If you have corrections, please DM me or leave a respectful comment.
I want to publish this by the end of the year and include other things like highlighting triple witching weeks, adding columns for volume % stats, VaR and CVaR, alpha, beta (to see the seasonal alpha and beta based off a benchmark ticker and risk free rate ticker and other little goodies.

VCBBDOVWAPSMA By Anil ChawraHow Users Can Make Profit Using This Script:
1. Volume Representation : Each candle on the chart represents a specific time period (e.g., 1 minute, 1 hour, 1 day) and includes information about both price movement and trading volume during that period.
2. Candlestick Anatomy : A volume candle has the same components as a regular candlestick: the body (which represents the opening and closing prices) and the wicks or shadows (which indicate the highest and lowest prices reached during the period).
3. Volume Bars : Instead of just the candlestick itself, volume candles also include a bar or histogram representing the trading volume during that period. The height or length of the volume bar indicates the amount of trading activity.
4. Interpreting Volume : High volume candles typically indicate increased market interest or activity during that period. This could be due to significant buying or selling pressure.
5. Confirmation : Traders often look for confirmation from other technical indicators or price action to validate the significance of a high volume candle. For example, a high volume candle breaking through a key support or resistance level may signal a strong market move.
6. Trend Strength : Volume candles can provide insights into the strength of a trend. A series of high volume candles in the direction of the trend suggests strong momentum, while decreasing volume may indicate weakening momentum or a potential reversal.
7. Volume Patterns : Traders also analyze volume patterns, such as volume spikes or divergences, to identify potential trading opportunities or reversals.
8. Combination with Price Action: Volume analysis is often used in conjunction with price action analysis and other technical indicators to make more informed trading decisions.
9. Confirmation and Validation: It's important to confirm the significance of volume candles with other indicators or price action signals to avoid false signals.
10. Risk Management : As with any trading strategy, proper risk management is crucial when using volume candles to make trading decisions. Set stop-loss orders and adhere to risk management principles to protect your capital.
How to script works :
1.Identify High Volume Candles: Look for candles with significantly higher volume compared to the surrounding candles. These can indicate increased market interest or activity.
2.Wait for Confirmation: Once you identify a high volume candle, wait for confirmation from subsequent candles to ensure the momentum is sustained.
3.Enter the Trade: After confirmation, consider entering a trade in the direction indicated by the high volume candle. For example, if it's a bullish candle, consider buying.
4.Set Stop Loss: Always set a stop loss to limit potential losses in case the trade goes against you.
5.Take Profit: Set a target for taking profits. This could be based on technical analysis, such as a resistance level or a certain percentage gain.
6.Monitor Volume: Continuously monitor volume to gauge the strength of the trend. Decreasing volume may signal weakening momentum and could be a sign to exit the trade.
7.Risk Management: Manage risk carefully by adjusting position sizes according to your risk tolerance and the size of your trading account.
8.Review and Adapt: Regularly review your trades and adapt your strategy based on what's working and what's not.
Remember, no trading strategy guarantees profits, and it's essential to practice proper risk management and have realistic expectations. Additionally, consider combining volume analysis with other technical indicators for a more comprehensive approach to trading.
**How Users Can Make Profit Using This Script:
**
DAYS OPEN LINE:
1.Purpose: Publishing a "Days Open Line" indicator serves to inform customers about the operational schedule of a business or service.
2.Visibility: It ensures that the information regarding the days of operation is easily accessible to current and potential customers.
3.Transparency: By making the operational schedule public, businesses demonstrate transparency and reliability to their customers.
4.Accessibility: The indicator should be published on various platforms such as the business website, social media channels, and physical locations to ensure accessibility to a wide audience.
5.Clarity: The information should be presented in a clear and concise manner, specifying the days of the week the business is open and the corresponding operating hours.
6.Updates: It's important to regularly update the "Days Open Line" indicator to reflect any changes in the operational schedule, such as holidays or special events.
7.Customer Convenience: Providing this information helps customers plan their visits accordingly, reducing inconvenience and frustration due to unexpected closures.
8.Expectation Management: Setting clear expectations regarding the business hours helps manage customer expectations and reduces the likelihood of disappointment or complaints.
9.Customer Service: Publishing the "Days Open Line" indicator demonstrates a commitment to customer service by ensuring that customers have the information they need to engage with the business.
10.Brand Image: Consistently .maintaining and updating the indicator contributes to a positive brand image, as it reflects professionalism, reliability, and a customer-centric approach.
SMA CROSS:
1.This indicator generates buy and sell signals based on the crossover of two Simple Moving Averages (SMA): a shorter 3-day SMA and a longer 8-day SMA.
When the 3-day SMA crosses above the 8-day SMA, it generates a buy signal indicating a potential upward trend.
Conversely, when the 3-day SMA crosses below the 8-day SMA, it generates a sell signal indicating a potential downward trend.
Signal Interpretation:
2.Buy Signal: Generated when the 3-day SMA crosses above the 8-day SMA.
Sell Signal: Generated when the 3-day SMA crosses below the 8-day SMA.
Usage:
3.Traders can use this indicator to identify potential entry and exit points in the market.
Buy signals suggest a bullish trend, indicating a favorable time to enter or hold a long position.
4.Sell signals suggest a bearish trend, indicating a potential opportunity to exit or take a short position.
Parameters:
5.Periods: 3-day SMA and 8-day SMA.
Price: Closing price is commonly used, but users can choose other price types (open, high, low) for calculation.
Confirmation:
6.It's recommended to use additional technical analysis tools or confirmatory indicators to validate signals and minimize false signals.
Risk Management:
7.Implement proper risk management strategies, such as setting stop-loss orders, to mitigate losses in case of adverse price movements.
Backtesting:
8.Before using the indicator in live trading, conduct thorough backtesting to evaluate its effectiveness under various market conditions.
Considerations:
9.While SMA crossovers can provide valuable insights, they may generate false signals during ranging or choppy markets.
Combine this indicator with other technical analysis techniques for comprehensive market analysis.
Continuous Optimization:
10.Monitor the performance of the indicator and adjust parameters or incorporate additional filters as needed to enhance accuracy over time.
BOLLINGER BAND:
1.Definition: A Bollinger Band indicator is a technical analysis tool that consists of a centerline (typically a moving average) and two bands plotted above and below it. These bands represent volatility around the moving average.
2.Purpose: Publishing a Bollinger Band indicator serves to provide traders and investors with insights into the volatility and potential price movements of a financial instrument.
3.Visualization: The indicator is typically displayed on price charts, allowing users to visualize the relationship between price movements and volatility levels.
4.Interpretation: Traders use Bollinger Bands to identify overbought and oversold conditions, potential trend reversals, and volatility breakouts.
5.Components: The indicator consists of three main components: the upper band, lower band, and centerline (usually a simple moving average). These components are calculated based on standard deviations from the moving average.
6.Parameters: Traders can adjust the parameters of the Bollinger Bands, such as the period length and standard deviation multiplier, to customize the indicator based on their trading strategy and preferences.
7.Signals: Bollinger Bands generate signals when prices move outside the bands, indicating potential trading opportunities. For example, a price breakout above the upper band may signal a bullish trend continuation, while a breakout below the lower band may indicate a bearish trend continuation.
8.Confirmation: Traders often use other technical indicators or price action analysis to confirm signals generated by Bollinger Bands, enhancing the reliability of their trading decisions.
9.Education: Publishing Bollinger Band indicators can serve an educational purpose, helping traders learn about technical analysis concepts and how to apply them in real-world trading scenarios.
10.Risk Management: Traders should exercise proper risk management when using Bollinger Bands, as false signals and market volatility can lead to losses. Publishing educational content alongside the indicator can help users understand the importance of risk management in trading.
VWAP:
1.Calculation: VWAP is calculated by dividing the cumulative sum of price times volume traded for every transaction (price * volume) by the total volume traded.
2.Time Frame: VWAP is typically calculated for a specific time frame, such as a trading day or a session.
3.Intraday Trading: It's commonly used by intraday traders to assess the fair value of a security and to determine if the current price is above or below the average price traded during the day.
4.Execution: Institutional traders often use VWAP as a benchmark for executing large orders, aiming to buy at prices below VWAP and sell at prices above VWAP.
5.Benchmark: It serves as a benchmark for traders to evaluate their trading performance. Trades executed below VWAP are considered good buys, while those above are considered less favorable.
6.Sensitivity: VWAP is more sensitive to price and volume changes during periods of high trading activity and less sensitive during periods of low trading activity.
7.Day's End: VWAP resets at the end of each trading day, providing a new reference point for the following trading session.
8.Volume Weighting: The weighting by volume means that prices with higher trading volumes have a greater impact on VWAP than those with lower volumes.
9.Popular with Algorithmic Traders: Algorithmic trading systems often incorporate VWAP strategies to execute trades efficiently and minimize market impact.
10.Limitations: While VWAP is a useful indicator, it's not foolproof. It may lag behind rapidly changing market conditions and may not be suitable for all trading strategies or market conditions. Additionally, it's more effective in liquid markets where there is significant trading volume.

Risk Management Tool [LuxAlgo]Good money management is one of the fundamental pillars of successful trading. With this indicator, we propose a simple way to manage trading positions. This tool shows Profit & Loss (P&L), suggests position size given a certain risk, sets stop losses and take profit levels using fixed price value/percentage/ATR/Range, and can also determine entries from crosses with technical indicators which is particularly handy if you don't want to set an entry manually.
1. Settings
Position Type: Determines if the position should be a "Long" or "Short".
Account Size: Determines the total capital of the trading account.
Risk: The maximum risk amount for a trade. Can be set as a percentage of the account size or as a fixed amount.
Entry Price: Determines the entry price of the position.
Entry From Cross: When enabled, allows to set the entry price where a cross with an external source was produced.
1.1 Stop Loss/Take Profit
Take Profit: Determines the take profit level, which can be determined by a value or percentage.
Stop Loss: Determines the stop loss level, which can be determined by a value or percentage.
2. Usage
One of the main usages of position management tools is to determine the position size to allocate given a specific risk amount and stop-loss. 2% of your capital is often recommended as a risk amount.
Our tool allows setting stop losses and take profits with different methods.
The ATR method sets the stop loss/take profit one ATR away from the entry price, with the ATR period being determined in the drop-down menu next to the selected methods. The range method works similarly but instead of using the ATR, we use a rolling range with a period determined in the drop-down menu next to the selected methods as well.
Unlike the available position management tool on TradingView, the entry can be determined from a cross between the price an an external source. The image above shows entries from the Volatility Stop indicator. This is particularly useful if you set positions based on trailing stops.

In-Range Rolling SL
In-Range Rolling SL Indicator Guide
The In-Range Rolling SL indicator is a dynamic stop-loss system designed for intraday trading that identifies squeeze conditions and trade entry opportunities based on rolling price windows.
Core Concept
The indicator analyzes the highest high and lowest low over a defined lookback period (default: 2 candles) to establish an "in-range" zone. When price stays within this range without breaking either boundary, it creates a squeeze condition—signaling potential breakout opportunities.
Trading Strategy
Wait for the Squeeze Setup
The most effective approach is to wait for the in-range stop-loss squeeze to form. This occurs when both the long SL (green line) and short SL (red line) are active simultaneously, indicated by the yellow status dot (🟡) in the indicator table. Analyze the wick high/close relationship against the in-range SL while price remains compressed—this setup identifies which side is more likely to break first.
Entry Timing and Risk Management
Long Entry: Enter when a candle closes above the in-range short SL (red line) without any wick above it. This "perfect breakout candle" confirms bullish momentum. Your entry should be around the region, with your stop-loss placed just below the top of the breakout candle's high.
Short Entry: Enter when a candle closes below the in-range long SL (green line). The stop-loss for short trades should be set 34.26 points above your entry for appropriate risk protection.
Risk-Reward Considerations
If you enter at the low of a breakout candle, expect only 8.26 points of drawdown potential. However, if you accidentally go long and your stop gets hit, you'll experience the full in-range stop-loss distance as your loss.
Advanced Techniques
Failed Breakout Trap: If a follow-up candle doesn't make a higher high after the initial breakout, consider adding a "winner" for compensation rather than holding for a trap. When your buy-stop sits on top of the breakout candle high, this isn't a valid long trade setup.
Flip Trade Opportunity: In-range stop-loss attempts to flip often provide ideal entry points. If the up candle doesn't break the previous low, this validates the long continuation.
Long Scalp Trading: A failed long scalp can be traded if you missed the initial market open down-up-down trend. With a stop-loss of 34 points and potential profit exceeding 50 points, this provides favorable risk-reward ratios.
Sustained Loss Management: Stop-loss for long positions should target 26 points maximum loss. The indicator automatically invalidates stop-losses when price violates them, keeping your chart clean for the next setup.
-------------------------
In-Range Rolling SL Indicator Guide
The In-Range Rolling SL indicator is a dynamic stop-loss system designed for intraday trading that identifies squeeze conditions and breakout opportunities based on rolling price windows.
How the Indicator Works
The indicator tracks the highest high and lowest low over your selected lookback period (default: 2 candles) to establish dynamic support and resistance levels. These levels create an "in-range" zone that adapts as new price action develops.
Visual Components
Green Line (Long SL): The rolling window's lowest low - your stop-loss level for long positions
Red Line (Short SL): The rolling window's highest high - your stop-loss level for short positions
Status Indicators:
🟡 Yellow: Squeeze condition (both SLs active)
🟢 Green: Long-only setup
🔴 Red: Short-only setup
⚪ White: Neutral (no active SLs)
The Squeeze Setup Strategy
Step 1: Wait for the Squeeze
The most effective way to use the In-Range Rolling SL is to wait for the in-range stop-loss squeeze to form. During the squeeze, both the green and red lines are active, meaning price has stayed within the rolling window without breaking either boundary. This compression phase indicates that it's "go time" to prepare your trade.
While in the squeeze, analyze the wick high/close relationship against the in-range SL levels. This analysis helps you determine which side is more likely to split when the breakout occurs.
Step 2: Identify the Perfect Breakout
Long Breakout: A perfect breakout candle should close above the in-range stop-loss high (red line) without any wick above it. This clean breakout demonstrates strong momentum and reduces the risk of a false breakout.
Short Breakout: Look for a candle that closes below the in-range SL low (green line), indicating a short-side trade is coming up.
Step 3: Entry Execution
Long Entry: Your entry should be around the region of the breakout. Position your stop-loss just below the top of the breakout candle's high. This placement protects you from failed breakouts while giving the trade room to develop.
Short Entry: Enter as the candle closes below the in-range SL low. The stop-loss for short-side trades is typically 34.26 points of potential loss based on the indicator's measurements.
Risk-Reward Analysis
Entry at Breakout Low
If you enter here at the low of the breakout candle, you're looking at only 8.26 points of drawdown potential. This represents your best-case entry scenario.
Accidental Wrong-Side Entry
However, if you accidentally go long here and your stop gets hit, you'll experience the full in-range stop-loss distance as your loss. This emphasizes the importance of waiting for clear breakout confirmation.
Long Scalp Opportunity
A failed long scalp can be traded here if you missed the market open down-up-down trend. With a stop-loss of 34 points and potential profit greater than 50 points, this setup offers a favorable risk-reward ratio of approximately 1:1.5.
Advanced Trade Management
Failed Breakout Recognition
Follow-Up Candle Validation: If a follow-up candle did not make a higher high than the breakout candle, this could be a trap. Your buy-stop on top of the breakout candle high is not a valid long trade setup in this scenario. Consider adding a "winner" for compensation rather than holding through the potential reversal.
Flip Trade Opportunities
In-range stop-loss tries to flip to the other side often provide excellent entries. If the up candle did not break the previous low, this validates the long continuation and suggests the squeeze is resolving to the upside.
Sustained Position Management
Stop-Loss Guidelines: Stop-loss for long positions should be 26 points of maximum loss. The indicator table displays the delta (Δ) showing your real-time distance to the active stop-loss, helping you manage risk dynamically.
Entry Timing: Your entry should be around the region where the breakout confirms, rather than chasing price after a large move. In order to prepare your trade, position your stop-loss on top of the breakout candle's high for long trades.
Practical Example from the Chart
Looking at the MNQ1! chart, you can see multiple squeeze formations throughout the session. The most notable sequence shows:
An initial downtrend creating a squeeze setup
A perfect breakout candle closing above the red line without upper wick
The subsequent candle validating the move
Later, a failed breakout attempt that created a short opportunity
Multiple flip attempts that provided re-entry points for scalpers
The indicator's table in the top-right continuously updates with the current SL levels, gap size, candle size, and delta values - giving you all the information needed to assess each trade's risk-reward profile in real-time.

BB Breakout-Momentum + Reversion Strategies# BB Breakout-Momentum + Reversion Strategies
## Overview
This indicator combines two complementary Bollinger Band trading strategies that automatically adapt to market conditions. Strategy 1 capitalizes on trending markets with breakout-pullback-momentum setups, while Strategy 2 exploits mean reversion in ranging markets. Advanced filtering using ADX and BB Width ensures each strategy only fires in its optimal market environment.
---
## Strategy 1: Breakout → Pullback → Renewed Momentum (Long B / Short B)
### Best Market Conditions
- **Trending Markets**: ADX ≥ 25
- **High Volatility**: BB Width ≥ 1.0× average
- Directional price action with sustained momentum
### Entry Logic
**Long B (Bullish Breakout):**
1. **Initial Breakout**: Price breaks above upper Bollinger Band with strong momentum
2. **Controlled Pullback**: Price pulls back 1-12 bars but holds above lower band (stays in trend)
3. **Defended Zone**: Pullback creates a support zone based on swing lows (validated by multiple touches)
4. **Renewed Momentum**: Price reclaims with green candle, volume confirmation, bullish MACD
5. **Position Check**: Entry must have cushion below upper band and room to reach targets
**Short B (Bearish Breakdown):**
- Mirror logic for downtrends: breakdown below lower band, pullback stays below upper band, renewed selling pressure
### Risk Management
- **Stop Loss**: Lower of (zone floor/previous low) OR (1.5 × ATR from entry)
- **Targets**:
- T1: Entry + 0.85R (0.85 × 1.5 ATR)
- T2: Entry + 1.40R (1.40 × 1.5 ATR)
- T3: Entry + 2.50R (2.50 × 1.5 ATR)
- T4: Entry + 4.50R (4.50 × 1.5 ATR)
- Risk is calculated using ATR (ATRX = 1.5 ATR), stop uses tighter of structural level (ATRL) or ATRX
---
## Strategy 2: Bollinger Band Mean Reversion (Long R / Short R)
### Best Market Conditions
- **Ranging Markets**: ADX ≤ 20
- **Low Volatility**: BB Width ≤ 0.8× average
- Price oscillating around the mean without sustained trend
### Entry Logic
**Long R (Long Reversion):**
1. **Overextension**: Price breaks below lower Bollinger Band (2 consecutive closes)
2. **Snap Back**: Price crosses back above lower band (re-enters the range)
3. **Entry Window**: Within 2 candles of re-entry, look for:
- **Green candle** (close > open) confirming bullish strength
- Close above previous candle (close > close )
4. **Trigger**: First qualifying candle within 2-bar window executes the trade
**Short R (Short Reversion):**
1. **Overextension**: Price breaks above upper Bollinger Band (2 consecutive closes)
2. **Snap Back**: Price crosses back below upper band (re-enters the range)
3. **Entry Window**: Within 2 candles of re-entry, look for:
- **Red candle** (close < open) confirming bearish pressure
- Close below previous candle (close < close )
4. **Trigger**: First qualifying candle within 2-bar window executes the trade
### Risk Management
- **Stop Loss**: Lower of (previous high/low) OR (1.5 × ATR from entry)
- **Targets**: Same as Strategy 1 (0.85R, 1.4R, 2.5R, 4.5R based on 1.5 ATR)
- Betting on return to Bollinger Band basis (mean)
---
## Advanced Filtering System
### ADX Filter (Average Directional Index)
- **Purpose**: Measures trend strength vs choppy/ranging conditions
- **Trending**: ADX ≥ 25 → Enables Strategy 1 (Breakout)
- **Ranging**: ADX ≤ 20 → Enables Strategy 2 (Reversion)
- **Neutral**: ADX 20-25 → No signals (indecisive market)
### BB Width Filter
- **Purpose**: Confirms volatility expansion/contraction
- **Wide Bands**: Current width ≥ 1.0× 50-bar average → Trending environment
- **Narrow Bands**: Current width ≤ 0.8× 50-bar average → Ranging environment
- **Logic**: Both ADX and BB Width must agree on market state before signaling
### Combined Logic
- **Strategy 1 fires**: When BOTH ADX shows trending AND bands are wide
- **Strategy 2 fires**: When BOTH ADX shows ranging AND bands are narrow
- **Visual Display**: Table at bottom-right shows ADX value, BB Width ratio, and current market state
---
## Visual Elements
### Bollinger Bands
- **Gray line**: 20-period SMA (basis/mean)
- **Green line**: Upper band (basis + 2 standard deviations)
- **Red line**: Lower band (basis - 2 standard deviations)
### Strategy 1 Markers
- **Long B**: Green triangle below bar with "Long B" text
- **Short B**: Orange triangle above bar with "Short B" text
- **Defended Zones**: Green/red boxes showing pullback support/resistance areas
- **Targets**: Green/orange crosses showing T1-T4 and stop loss levels
### Strategy 2 Markers
- **Long R**: Blue label below bar with "Long R" text
- **Short R**: Purple label above bar with "Short R" text
- **Trade Levels**: Horizontal lines extending 50 bars forward
- Blue solid = Entry price
- Red dashed = Stop loss
- Green/Orange dotted = Targets (T1-T4)
### Market State Table
- **ADX**: Current value with color coding (green=trending, orange=ranging, gray=neutral)
- **BB Width**: Ratio vs 50-bar average (e.g., "1.15x" = 15% wider than average)
- **State**: TREND / RANGE / NEUTRAL classification
---
## Settings & Customization
### Bollinger Bands
- **BB Length**: 20 (default) - period for moving average
- **BB Std Dev**: 2.0 (default) - standard deviation multiplier
### ATR & Risk
- **ATR Length**: 14 (default) - period for Average True Range calculation
- All stop losses and targets are derived from 1.5 × ATR
### Trend/Range Filters
- **ADX Length**: 14 (default)
- **ADX Trending Threshold**: 25 (higher = stronger trend required)
- **ADX Ranging Threshold**: 20 (lower = tighter ranging condition)
- **BB Width Average Length**: 50 (period for comparing current width)
- **BB Width Trend Multiplier**: 1.0 (width must be ≥ this × average)
- **BB Width Range Multiplier**: 0.8 (width must be ≤ this × average)
- **Use ADX Filter**: Toggle on/off
- **Use BB Width Filter**: Toggle on/off
### Strategy 1 (Breakout-Momentum)
- **Breakout Lookback**: 15 bars (how far back to search for initial breakout)
- **Min Pullback Bars**: 1 (minimum consolidation period)
- **Max Pullback Bars**: 12 (maximum consolidation period)
- **Show Defended Zone**: Display support/resistance boxes
- **Show Signals**: Display Long B / Short B markers
- **Show Targets**: Display stop loss and target levels
### Strategy 2 (Reversion)
- **Show Signals**: Display Long R / Short R markers
- **Show Trade Levels**: Display entry, stop, and target lines
---
## How to Use This Indicator
### Step 1: Identify Market State
- Check the table in bottom-right corner
- **TREND**: Look for Strategy 1 signals (Long B / Short B)
- **RANGE**: Look for Strategy 2 signals (Long R / Short R)
- **NEUTRAL**: Wait for clearer conditions
### Step 2: Wait for Signal
- Signals only fire when ALL conditions are met (structural + momentum + filters + room-to-target)
- Signals are relatively rare but high-probability
### Step 3: Execute Trade
- **Entry**: Close of signal candle
- **Stop Loss**: Shown as red cross (Strategy 1) or red dashed line (Strategy 2)
- **Targets**: Scale out at T1, T2, T3, T4 or hold for maximum R:R
### Step 4: Management
- Consider moving stop to breakeven after T1
- Trail stop using swing lows/highs in Strategy 1
- Exit full position at T2-T3 in Strategy 2 (mean reversion has limited upside)
---
## Key Principles
### Why This Works
1. **Market Adaptation**: Uses right strategy for right conditions (trend vs range)
2. **Confluence**: Multiple confirmations required (structure + momentum + volatility + room)
3. **Risk-Defined**: Every trade has pre-calculated stop and targets based on ATR
4. **Probability**: Filters reduce noise and increase win rate by waiting for ideal setups
### Common Pitfalls to Avoid
- ❌ Taking signals in NEUTRAL market state (indicators disagree)
- ❌ Overriding the stop loss (it's calculated for a reason)
- ❌ Expecting signals on every swing (quality over quantity)
- ❌ Using Strategy 1 in ranging markets or Strategy 2 in trending markets
- ❌ Ignoring the room-to-target check (signal won't fire if targets are blocked)
### Complementary Analysis
This indicator works best when combined with:
- Higher timeframe trend analysis
- Key support/resistance levels
- Volume analysis
- Market structure (swing highs/lows)
- Risk management rules (position sizing, max daily loss, etc.)
---
## Technical Details
### Indicators Used
- **Bollinger Bands**: 20-period SMA ± 2 standard deviations
- **ATR**: 14-period Average True Range for volatility measurement
- **ADX**: 14-period Average Directional Index for trend strength
- **EMA**: 10 and 20-period exponential moving averages (Strategy 1 filter)
- **MACD**: 12/26/9 settings (Strategy 1 momentum confirmation)
- **Volume**: Compared to 15-bar average (Strategy 1 confirmation)
### Calculation Methodology
- **ATRL** (Structural Risk): Previous swing high/low or defended zone boundary
- **ATRX** (ATR Risk): 1.5 × 14-period ATR from entry price
- **Stop Loss**: Minimum of ATRL and ATRX (tightest protection)
- **Targets**: Always calculated from ATRX (consistent R-multiples)
- **BB Width Ratio**: Current BB width ÷ 50-period SMA of BB width
---
## Performance Notes
### Strengths
- Adapts to changing market conditions automatically
- Clear, objective entry and exit criteria
- Pre-defined risk on every trade
- Filters reduce false signals significantly
- Works across multiple timeframes and instruments
### Limitations
- Signals are infrequent (by design - quality over quantity)
- Requires patience to wait for all conditions to align
- May miss explosive moves if pullback doesn't form properly (Strategy 1)
- Ranging markets can transition to trending (Strategy 2 risk)
- Filters may delay entry in fast-moving markets
### Best Timeframes
- **Strategy 1**: 1H, 4H, Daily (needs time for proper pullback structure)
- **Strategy 2**: 15M, 30M, 1H (mean reversion works best intraday)
- Both strategies can work on any timeframe if market conditions are right
### Best Instruments
- **Liquid markets**: Major stocks, indices, forex pairs, liquid crypto
- **Sufficient volatility**: ATR should be meaningful relative to price
- **Clear trend/range cycles**: Markets that respect technical levels
---
## IMPORTANT DISCLAIMER
### Risk Warning
**TRADING INVOLVES SUBSTANTIAL RISK OF LOSS AND IS NOT SUITABLE FOR ALL INVESTORS.**
This indicator is provided for **educational and informational purposes only**. It does not constitute financial advice, investment advice, trading advice, or any other sort of advice. You should not treat any of the indicator's content as such.
### No Guarantee of Profit
Past performance is not indicative of future results. No trading strategy, including this indicator, can guarantee profits or protect against losses. The market is inherently unpredictable and all trading involves risk.
### User Responsibility
- **Do Your Own Research**: Always conduct your own analysis before making trading decisions
- **Test First**: Backtest and paper trade this strategy before risking real capital
- **Risk Management**: Never risk more than you can afford to lose
- **Position Sizing**: Use appropriate position sizes relative to your account
- **Stop Losses**: Always use stop losses and respect them
- **Market Conditions**: Understand that market conditions change and past behavior may not repeat
### No Liability
The creator of this indicator accepts no liability for any financial losses incurred through the use of this tool. All trading decisions are made at your own risk. You are solely responsible for evaluating the merits and risks associated with the use of any trading systems, signals, or content provided.
### Not Financial Advice
This indicator does not take into account your personal financial situation, investment objectives, risk tolerance, or specific needs. You should consult with a licensed financial advisor before making any investment decisions.
### Technical Limitations
- Indicators can repaint or lag in real-time
- Past signals may look different than real-time signals
- Code bugs or errors may exist despite testing
- TradingView platform limitations may affect functionality
### Market Risks
- Markets can gap, causing stops to be executed at worse prices
- Slippage and commissions can significantly impact results
- High volatility can cause unexpected losses
- Counterparty risk exists in all leveraged products
---
## Version History
- **v1.0**: Initial release combining breakout-momentum and mean reversion strategies
- Includes ADX and BB Width filtering
- ATRL/ATRX risk calculation system
- 2-candle entry window for reversion trades
---
## Credits & License
This indicator combines concepts from classical technical analysis including Bollinger Bands (John Bollinger), ATR (Welles Wilder), and ADX (Welles Wilder). The specific implementation and combination of filters is original work.
**Use at your own risk. Trade responsibly.**
---
*For questions, suggestions, or to report bugs, please comment below or contact the author.*
**Remember: The best indicator is the one between your ears. Use this tool as part of a comprehensive trading plan, not as a standalone solution.**

Kernel Market Dynamics [WFO - MAB]Kernel Market Dynamics
⚛️ CORE INNOVATION: KERNEL-BASED DISTRIBUTION ANALYSIS
The Kernel Market Dynamics system represents a fundamental departure from traditional technical indicators. Rather than measuring price levels, momentum, or oscillator extremes, KMD analyzes the statistical distribution of market returns using advanced kernel methods from machine learning theory. This allows the system to detect when market behavior has fundamentally changed—not just when price has moved, but when the underlying probability structure has shifted.
The Distribution Hypothesis:
Traditional indicators assume markets move in predictable patterns. KMD assumes something more profound: markets exist in distinct distributional regimes , and profitable trading opportunities emerge during regime transitions . When the distribution of recent returns diverges significantly from the historical baseline, the market is restructuring—and that's when edge exists.
Maximum Mean Discrepancy (MMD):
At the heart of KMD lies a sophisticated statistical metric called Maximum Mean Discrepancy. MMD measures the distance between two probability distributions by comparing their representations in a high-dimensional feature space created by a kernel function.
The Mathematics:
Given two sets of normalized returns:
• Reference period (X) : Historical baseline (default 100 bars)
• Test period (Y) : Recent behavior (default 20 bars)
MMD is calculated as:
MMD² = E + E - 2·E
Where:
• E = Expected kernel similarity within reference period
• E = Expected kernel similarity within test period
• E = Expected cross-similarity between periods
When MMD is low : Test period behaves like reference (stable regime)
When MMD is high : Test period diverges from reference (regime shift)
The final MMD value is smoothed with EMA(5) to reduce single-bar noise while maintaining responsiveness to genuine distribution changes.
The Kernel Functions:
The kernel function defines how similarity is measured. KMD offers four mathematically distinct kernels, each with different properties:
1. RBF (Radial Basis Function / Gaussian):
• Formula: k(x,y) = exp(-d² / (2·σ²·scale))
• Properties: Most sensitive to distribution changes, smooth decision boundaries
• Best for: Clean data, clear regime shifts, low-noise markets
• Sensitivity: Highest - detects subtle changes
• Use case: Stock indices, major forex pairs, trending environments
2. Laplacian:
• Formula: k(x,y) = exp(-|d| / σ)
• Properties: Medium sensitivity, robust to moderate outliers
• Best for: Standard market conditions, balanced noise/signal
• Sensitivity: Medium - filters minor fluctuations
• Use case: Commodities, standard timeframes, general trading
3. Cauchy (Default - Most Robust):
• Formula: k(x,y) = 1 / (1 + d²/σ²)
• Properties: Heavy-tailed, highly robust to outliers and spikes
• Best for: Noisy markets, choppy conditions, crypto volatility
• Sensitivity: Lower - only major distribution shifts trigger
• Use case: Cryptocurrencies, illiquid markets, volatile instruments
4. Rational Quadratic:
• Formula: k(x,y) = (1 + d²/(2·α·σ²))^(-α)
• Properties: Tunable via alpha parameter, mixture of RBF kernels
• Alpha < 1.0: Heavy tails (like Cauchy)
• Alpha > 3.0: Light tails (like RBF)
• Best for: Adaptive use, mixed market conditions
• Use case: Experimental optimization, regime-specific tuning
Bandwidth (σ) Parameter:
The bandwidth controls the "width" of the kernel, determining sensitivity to return differences:
• Low bandwidth (0.5-1.5) : Narrow kernel, very sensitive
- Treats small differences as significant
- More MMD spikes, more signals
- Use for: Scalping, fast markets
• Medium bandwidth (1.5-3.0) : Balanced sensitivity (recommended)
- Filters noise while catching real shifts
- Professional-grade signal quality
- Use for: Day/swing trading
• High bandwidth (3.0-10.0) : Wide kernel, less sensitive
- Only major distribution changes register
- Fewer, stronger signals
- Use for: Position trading, trend following
Adaptive Bandwidth:
When enabled (default ON), bandwidth automatically scales with market volatility:
Effective_BW = Base_BW × max(0.5, min(2.0, 1 / volatility_ratio))
• Low volatility → Tighter bandwidth (0.5× base) → More sensitive
• High volatility → Wider bandwidth (2.0× base) → Less sensitive
This prevents signal flooding during wild markets and avoids signal drought during calm periods.
Why Kernels Work:
Kernel methods implicitly map data to infinite-dimensional space where complex, nonlinear patterns become linearly separable. This allows MMD to detect distribution changes that simpler statistics (mean, variance) would miss. For example:
• Same mean, different shape : Traditional metrics see nothing, MMD detects shift
• Same volatility, different skew : Oscillators miss it, MMD catches it
• Regime rotation : Price unchanged, but return distribution restructured
The kernel captures the entire distributional signature —not just first and second moments.
🎰 MULTI-ARMED BANDIT FRAMEWORK: ADAPTIVE STRATEGY SELECTION
Rather than forcing one strategy on all market conditions, KMD implements a Multi-Armed Bandit (MAB) system that learns which of seven distinct strategies performs best and dynamically selects the optimal approach in real-time.
The Seven Arms (Strategies):
Each arm represents a fundamentally different trading logic:
ARM 0 - MMD Regime Shift:
• Logic: Distribution divergence with directional bias
• Triggers: MMD > threshold AND direction_bias confirmed AND velocity > 5%
• Philosophy: Trade the regime transition itself
• Best in: Volatile shifts, breakout moments, crisis periods
• Weakness: False alarms in choppy consolidation
ARM 1 - Trend Following:
• Logic: Aligned EMAs with strong ADX
• Triggers: EMA(9) > EMA(21) > EMA(50) AND ADX > 25
• Philosophy: Ride established momentum
• Best in: Strong trending regimes, directional markets
• Weakness: Late entries, whipsaws at reversals
ARM 2 - Breakout:
• Logic: Bollinger Band breakouts with volume
• Triggers: Price crosses BB outer band AND volume > 1.2× average
• Philosophy: Capture volatility expansion events
• Best in: Range breakouts, earnings, news events
• Weakness: False breakouts in ranging markets
ARM 3 - RSI Mean Reversion:
• Logic: RSI extremes with reversal confirmation
• Triggers: RSI < 30 with uptick OR RSI > 70 with downtick
• Philosophy: Fade overbought/oversold extremes
• Best in: Ranging markets, mean-reverting instruments
• Weakness: Fails in strong trends, catches falling knives
ARM 4 - Z-Score Statistical Reversion:
• Logic: Price deviation from 50-period mean
• Triggers: Z-score < -2 (oversold) OR > +2 (overbought) with reversal
• Philosophy: Statistical bounds reversion
• Best in: Stable volatility regimes, pairs trading
• Weakness: Trend continuation through extremes
ARM 5 - ADX Momentum:
• Logic: Strong directional movement with acceleration
• Triggers: ADX > 30 with DI+ or DI- strengthening
• Philosophy: Momentum begets momentum
• Best in: Trending with increasing velocity
• Weakness: Late exits, momentum exhaustion
ARM 6 - Volume Confirmation:
• Logic: OBV trend + volume spike + candle direction
• Triggers: OBV > EMA(20) AND volume > average AND bullish candle
• Philosophy: Follow institutional money flow
• Best in: Liquid markets with reliable volume
• Weakness: Manipulated volume, thin markets
Q-Learning with Rewards:
Each arm maintains a Q-value representing its expected reward. After every bar, the system calculates a reward based on the arm's signal and actual price movement:
Reward Calculation:
If arm signaled LONG:
reward = (close - close ) / close
If arm signaled SHORT:
reward = -(close - close ) / close
If arm signaled NEUTRAL:
reward = 0
Penalty multiplier: If loss > 0.5%, reward × 1.3 (punish big losses harder)
Q-Value Update (Exponential Moving Average):
Q_new = Q_old + α × (reward - Q_old)
Where α (learning rate, default 0.08) controls adaptation speed:
• Low α (0.01-0.05): Slow, stable learning
• Medium α (0.06-0.12): Balanced (recommended)
• High α (0.15-0.30): Fast, reactive learning
This gradually shifts Q-values toward arms that generate positive returns and away from losing arms.
Arm Selection Algorithms:
KMD offers four mathematically distinct selection strategies:
1. UCB1 (Upper Confidence Bound) - Recommended:
Formula: Select arm with max(Q_i + c·√(ln(t)/n_i))
Where:
• Q_i = Q-value of arm i
• c = exploration constant (default 1.5)
• t = total pulls across all arms
• n_i = pulls of arm i
Philosophy: Balance exploitation (use best arm) with exploration (try uncertain arms). The √(ln(t)/n_i) term creates an "exploration bonus" that decreases as an arm gets more pulls, ensuring all arms get sufficient testing.
Theoretical guarantee: Logarithmic regret bound - UCB1 provably converges to optimal arm selection over time.
2. UCB1-Tuned (Variance-Aware UCB):
Formula: Select arm with max(Q_i + √(ln(t)/n_i × min(0.25, V_i + √(2·ln(t)/n_i))))
Where V_i = variance of rewards for arm i
Philosophy: Incorporates reward variance into exploration. Arms with high variance (unpredictable) get less exploration bonus, focusing effort on stable performers.
Better bounds than UCB1 in practice, slightly more conservative exploration.
3. Epsilon-Greedy (Simple Random):
Algorithm:
With probability ε: Select random arm (explore)
With probability 1-ε: Select highest Q-value arm (exploit)
Default ε = 0.10 (10% exploration, 90% exploitation)
Philosophy: Simplest algorithm, easy to understand. Random exploration ensures all arms stay updated but may waste time on clearly bad arms.
4. Thompson Sampling (Bayesian):
The most sophisticated selection algorithm, using true Bayesian probability.
Each arm maintains Beta distribution parameters:
• α (alpha) = successes + 1
• β (beta) = failures + 1
Selection Process:
1. Sample θ_i ~ Beta(α_i, β_i) for each arm using Marsaglia-Tsang Gamma sampler
2. Select arm with highest sample: argmax_i(θ_i)
3. After reward, update:
- If reward > 0: α += |reward| × 100 (increment successes)
- If reward < 0: β += |reward| × 100 (increment failures)
Why Thompson Sampling Works:
The Beta distribution naturally represents uncertainty about an arm's true win rate. Early on with few trials, the distribution is wide (high uncertainty), leading to more exploration. As evidence accumulates, it narrows around the true performance, naturally shifting toward exploitation.
Unlike UCB which uses deterministic confidence bounds, Thompson Sampling is probabilistic—it samples from the posterior distribution of each arm's success rate, providing automatic exploration/exploitation balance without tuning.
Comparison:
• UCB1: Deterministic, guaranteed regret bounds, requires tuning exploration constant
• Thompson: Probabilistic, natural exploration, no tuning required, best empirical performance
• Epsilon-Greedy: Simplest, consistent exploration %, less efficient
• UCB1-Tuned: UCB1 + variance awareness, best for risk-averse
Exploration Constant (c):
For UCB algorithms, this multiplies the exploration bonus:
• Low c (0.5-1.0): Strongly prefer proven arms, rare exploration
• Medium c (1.2-1.8): Balanced (default 1.5)
• High c (2.0-3.0): Frequent exploration, diverse arm usage
Higher exploration constant in volatile/unstable markets, lower in stable trending environments.
🔬 WALK-FORWARD OPTIMIZATION: PREVENTING OVERFITTING
The single biggest problem in algorithmic trading is overfitting—strategies that look amazing in backtest but fail in live trading because they learned noise instead of signal. KMD's Walk-Forward Optimization system addresses this head-on.
How WFO Works:
The system divides time into repeating cycles:
1. Training Window (default 500 bars): Learn arm Q-values on historical data
2. Testing Window (default 100 bars): Validate on unseen "future" data
Training Phase:
• All arms accumulate rewards and update Q-values normally
• Q_train tracks in-sample performance
• System learns which arms work on historical data
Testing Phase:
• System continues using arms but tracks separate Q_test metrics
• Counts trades per arm (N_test)
• Testing performance is "out-of-sample" relative to training
Validation Requirements:
An arm is only "validated" (approved for live use) if:
1. N_test ≥ Minimum Trades (default 10): Sufficient statistical sample
2. Q_test > 0 : Positive out-of-sample performance
Arms that fail validation are blocked from generating signals, preventing the system from trading strategies that only worked on historical data.
Performance Decay:
At the end of each WFO cycle, all Q-values decay exponentially:
Q_new = Q_old × decay_rate (default 0.95)
This ensures old performance doesn't dominate forever. An arm that worked 10 cycles ago but fails recently will eventually lose influence.
Decay Math:
• 0.95 decay after 10 periods → 0.95^10 = 0.60 (40% forgotten)
• 0.90 decay after 10 periods → 0.90^10 = 0.35 (65% forgotten)
Fast decay (0.80-0.90): Quick adaptation, forgets old patterns rapidly
Slow decay (0.96-0.99): Stable, retains historical knowledge longer
WFO Efficiency Metric:
The key metric revealing overfitting:
Efficiency = (Q_test / Q_train) for each validated arm, averaged
• Efficiency > 0.8 : Excellent - strategies generalize well (LOW overfit risk)
• Efficiency 0.5-0.8 : Acceptable - moderate generalization (MODERATE risk)
• Efficiency < 0.5 : Poor - strategies curve-fitted to history (HIGH risk)
If efficiency is low, the system has learned noise. Training performance was good but testing (forward) performance is weak—classic overfitting.
The dashboard displays real-time WFO efficiency, allowing users to gauge system robustness. Low efficiency should trigger parameter review or reduced position sizing.
Why WFO Matters:
Consider two scenarios:
Scenario A - No WFO:
• Arm 3 (RSI Reversion) shows Q-value of 0.15 on all historical data
• System trades it aggressively
• Reality: It only worked during one specific ranging period
• Live trading: Fails because market has trended since backtest
Scenario B - With WFO:
• Arm 3 shows Q_train = 0.15 (good in training)
• But Q_test = -0.05 (loses in testing) with 12 test trades
• N_test ≥ 10 but Q_test < 0 → Arm BLOCKED
• System refuses to trade it despite good backtest
• Live trading: Protected from false strategy
WFO ensures only strategies that work going forward get used, not just strategies that fit the past.
Optimal Window Sizing:
Training Window:
• Too short (100-300): May learn recent noise, insufficient data
• Too long (1000-2000): May include obsolete market regimes
• Recommended: 4-6× testing window (default 500)
Testing Window:
• Too short (50-80): Insufficient validation, high variance
• Too long (300-500): Delayed adaptation to regime changes
• Recommended: 1/5 to 1/4 of training (default 100)
Minimum Trades:
• Too low (5-8): Statistical noise, lucky runs validate
• Too high (30-50): Many arms never validate, system rarely trades
• Recommended: 10-15 (default 10)
⚖️ WEIGHTED CONFLUENCE SYSTEM: MULTI-FACTOR SIGNAL QUALITY
Not all signals are created equal. KMD implements a sophisticated 100-point quality scoring system that combines eight independent factors with different importance weights.
The Scoring Framework:
Each potential signal receives a quality score from 0-100 by accumulating points from aligned factors:
CRITICAL FACTORS (20 points each):
1. Bandit Arm Alignment (20 points):
• Full points if selected arm's signal matches trade direction
• Zero points if arm disagrees
• Weight: Highest - the bandit selected this arm for a reason
2. MMD Regime Quality (20 points):
• Requires: MMD > dynamic threshold AND directional bias confirmed
• Scaled by MMD percentile (how extreme vs history)
• If MMD in top 10% of history: 100% of 20 points
• If MMD at 50th percentile: 50% of 20 points
• Weight: Highest - distribution shift is the core signal
HIGH IMPACT FACTORS (15 points each):
3. Trend Alignment (15 points):
• Full points if EMA(9) > EMA(21) > EMA(50) for longs (inverse for shorts)
• Scaled by ADX strength:
- ADX > 25: 100% (1.0× multiplier) - strong trend
- ADX 20-25: 70% (0.7× multiplier) - moderate trend
- ADX < 20: 40% (0.4× multiplier) - weak trend
• Weight: High - trend is friend, alignment increases probability
4. Volume Confirmation (15 points):
• Requires: OBV > EMA(OBV, 20) aligned with direction
• Scaled by volume ratio: vol_current / vol_average
- Volume 1.5×+ average: 100% of points (institutional participation)
- Volume 1.0-1.5× average: 67% of points (above average)
- Volume below average: 0 points (weak conviction)
• Weight: High - volume validates price moves
MODERATE FACTORS (10 points each):
5. Market Structure (10 points):
• Full points (10) if bullish structure (higher highs, higher lows) for longs
• Partial points (6) if near support level (within 1% of swing low)
• Similar logic inverted for bearish trades
• Weight: Moderate - structure context improves entries
6. RSI Positioning (10 points):
• For long signals:
- RSI < 50: 100% of points (1.0× multiplier) - room to run
- RSI 50-60: 60% of points (0.6× multiplier) - neutral
- RSI 60-70: 30% of points (0.3× multiplier) - elevated
- RSI > 70: 0 points (0× multiplier) - overbought
• Inverse for short signals
• Weight: Moderate - momentum context, not primary signal
BONUS FACTORS (10 points each):
7. Divergence (10 points):
• Full 10 points if bullish divergence detected for long (or bearish for short)
• Zero points otherwise
• Weight: Bonus - leading indicator, adds confidence when present
8. Multi-Timeframe Confirmation (10 points):
• Full 10 points if higher timeframe aligned (HTF EMA trending same direction, RSI supportive)
• Zero points if MTF disabled or HTF opposes
• Weight: Bonus - macro context filter, prevents counter-trend disasters
Total Maximum: 110 points (20+20+15+15+10+10+10+10)
Signal Quality Calculation:
Quality Score = (Accumulated_Points / Maximum_Possible) × 100
Where Maximum_Possible = 110 points if all factors active, adjusts if MTF disabled.
Example Calculation:
Long signal candidate:
• Bandit Arm: +20 (arm signals long)
• MMD Quality: +16 (MMD high, 80th percentile)
• Trend: +11 (EMAs aligned, ADX = 22 → 70% × 15)
• Volume: +10 (OBV rising, vol 1.3× avg → 67% × 15 = 10)
• Structure: +10 (higher lows forming)
• RSI: +6 (RSI = 55 → 60% × 10)
• Divergence: +0 (none present)
• MTF: +10 (HTF bullish)
Total: 83 / 110 × 100 = 75.5% quality score
This is an excellent quality signal - well above threshold (default 60%).
Quality Thresholds:
• Score 80-100 : Exceptional setup - all factors aligned
• Score 60-80 : High quality - most factors supportive (default minimum)
• Score 40-60 : Moderate - mixed confluence, proceed with caution
• Score 20-40 : Weak - minimal support, likely filtered out
• Score 0-20 : Very weak - almost certainly blocked
The minimum quality threshold (default 60) is the gatekeeper. Only signals scoring above this value can trigger trades.
Dynamic Threshold Adjustment:
The system optionally adjusts the threshold based on historical signal distribution:
If Dynamic Threshold enabled:
Recent_MMD_Mean = SMA(MMD, 50)
Recent_MMD_StdDev = StdDev(MMD, 50)
Dynamic_Threshold = max(Base_Threshold × 0.5,
min(Base_Threshold × 2.0,
MMD_Mean + MMD_StdDev × 0.5))
This auto-calibrates to market conditions:
• Quiet markets (low MMD): Threshold loosens (0.5× base)
• Active markets (high MMD): Threshold tightens (2× base)
Signal Ranking Filter:
When enabled, the system tracks the last 100 signal quality scores and only fires signals in the top percentile.
If Ranking Percentile = 75%:
• Collect last 100 signal scores in memory
• Sort ascending
• Threshold = Score at 75th percentile position
• Only signals ≥ this threshold fire
This ensures you're only taking the cream of the crop —top 25% of signals by quality, not every signal that technically qualifies.
🚦 SIGNAL GENERATION: TRANSITION LOGIC & COOLDOWNS
The confluence system determines if a signal qualifies , but the signal generation logic controls when triangles appear on the chart.
Core Qualification:
For a LONG signal to qualify:
1. Bull quality score ≥ signal threshold (default 60)
2. Selected arm signals +1 (long)
3. Cooldown satisfied (bars since last signal ≥ cooldown period)
4. Drawdown protection OK (current drawdown < pause threshold)
5. MMD ≥ 80% of dynamic threshold (slight buffer below full threshold)
For a SHORT signal to qualify:
1. Bear quality score ≥ signal threshold
2. Selected arm signals -1 (short)
3-5. Same as long
But qualification alone doesn't trigger a chart signal.
Three Signal Modes:
1. RESPONSIVE (Default - Recommended):
Signals appear on:
• Fresh qualification (wasn't qualified last bar, now is)
• Direction reversal (was qualified short, now qualified long)
• Quality improvement (already qualified, quality jumps 25%+ during EXTREME regime)
This mode shows new opportunities and significant upgrades without cluttering the chart with repeat signals.
2. TRANSITION ONLY:
Signals appear on:
• Fresh qualification only
• Direction reversal only
This is the cleanest mode - signals only when first qualifying or when flipping direction. Misses re-entries if quality improves mid-regime.
3. CONTINUOUS:
Signals appear on:
• Every bar that qualifies
Testing/debugging mode - shows all qualified bars. Very noisy but useful for understanding when system wants to trade.
Cooldown System:
Prevents signal clustering and overtrading by enforcing minimum bars between signals.
Base Cooldown: User-defined (default 5 bars)
Adaptive Cooldown (Optional):
If enabled, cooldown scales with volatility:
Effective_Cooldown = Base_Cooldown × volatility_multiplier
Where:
ATR_Pct = ATR(14) / Close × 100
Volatility_Multiplier = max(0.5, min(3.0, ATR_Pct / 2.0))
• Low volatility (ATR 1%): Multiplier ~0.5× → Cooldown = 2-3 bars (tight)
• Medium volatility (ATR 2%): Multiplier 1.0× → Cooldown = 5 bars (normal)
• High volatility (ATR 4%+): Multiplier 2.0-3.0× → Cooldown = 10-15 bars (wide)
This prevents excessive trading during wild swings while allowing more signals during calm periods.
Regime Filter:
Three modes controlling which regimes allow trading:
OFF: Trade in any regime (STABLE, TRENDING, SHIFTING, ELEVATED, EXTREME)
SMART (Recommended):
• Regime score = 1.0 for SHIFTING, ELEVATED (optimal)
• Regime score = 0.8 for TRENDING (acceptable)
• Regime score = 0.5 for EXTREME (too chaotic)
• Regime score = 0.2 for STABLE (too quiet)
Quality scores are multiplied by regime score. A 70% quality signal in STABLE regime becomes 70% × 0.2 = 14% → blocked.
STRICT:
• Regime score = 1.0 for SHIFTING, ELEVATED only
• Regime score = 0.0 for all others → hard block
Only trades during optimal distribution shift regimes.
Drawdown Protection:
If current equity drawdown exceeds pause threshold (default 8%), all signals are blocked until equity recovers.
This circuit breaker prevents compounding losses during adverse conditions or broken market structure.
🎯 RISK MANAGEMENT: ATR-BASED STOPS & TARGETS
Every signal generates volatility-normalized stop loss and target levels displayed as boxes on the chart.
Stop Loss Calculation:
Stop_Distance = ATR(14) × ATR_Multiplier (default 1.5)
For LONG: Stop = Entry - Stop_Distance
For SHORT: Stop = Entry + Stop_Distance
The stop is placed 1.5 ATRs away from entry by default, adapting automatically to instrument volatility.
Target Calculation:
Target_Distance = Stop_Distance × Risk_Reward_Ratio (default 2.0)
For LONG: Target = Entry + Target_Distance
For SHORT: Target = Entry - Target_Distance
Default 2:1 risk/reward means target is twice as far as stop.
Example:
• Price: $100
• ATR: $2
• ATR Multiplier: 1.5
• Risk/Reward: 2.0
LONG Signal:
• Entry: $100
• Stop: $100 - ($2 × 1.5) = $97.00 (-$3 risk)
• Target: $100 + ($3 × 2.0) = $106.00 (+$6 reward)
• Risk/Reward: $3 risk for $6 reward = 1:2 ratio
Target/Stop Box Lifecycle:
Boxes persist for a lifetime (default 20 bars) OR until an opposite signal fires, whichever comes first. This provides visual reference for active trade levels without permanent chart clutter.
When a new opposite-direction signal appears, all existing boxes from the previous direction are immediately deleted, ensuring only relevant levels remain visible.
Adaptive Stop/Target Sizing:
While not explicitly coded in the current version, the shadow portfolio tracking system calculates PnL based on these levels. Users can observe which ATR multipliers and risk/reward ratios produce optimal results for their instrument/timeframe via the dashboard performance metrics.
📊 COMPREHENSIVE VISUAL SYSTEM
KMD provides rich visual feedback through four distinct layers:
1. PROBABILITY CLOUD (Adaptive Volatility Bands):
Two sets of bands around price that expand/contract with MMD:
Calculation:
Std_Multiplier = 1 + MMD × 3
Upper_1σ = Close + ATR × Std_Multiplier × 0.5
Lower_1σ = Close - ATR × Std_Multiplier × 0.5
Upper_2σ = Close + ATR × Std_Multiplier
Lower_2σ = Close - ATR × Std_Multiplier
• Inner band (±0.5× adjusted ATR) : 68% probability zone (1 standard deviation equivalent)
• Outer band (±1.0× adjusted ATR) : 95% probability zone (2 standard deviation equivalent)
When MMD spikes, bands widen dramatically, showing increased uncertainty. When MMD calms, bands tighten, showing normal price action.
2. MOMENTUM FLOW VECTORS (Directional Arrows):
Dynamic arrows that visualize momentum strength and direction:
Arrow Properties:
• Length: Proportional to momentum magnitude (2-10 bars forward)
• Width: 1px (weak), 2px (medium), 3px (strong)
• Transparency: 30-100 (more opaque = stronger momentum)
• Direction: Up for bullish, down for bearish
• Placement: Below bars (bulls) or above bars (bears)
Trigger Logic:
• Always appears every 5 bars (regular sampling)
• Forced appearance if momentum strength > 50 OR regime shift OR MMD velocity > 10%
Strong momentum (>75%) gets:
• Secondary support arrow (70% length, lighter color)
• Label showing "75%" strength
Very strong momentum (>60%) gets:
• Gradient flow lines (thick vertical lines showing momentum vector)
This creates a dynamic "flow field" showing where market pressure is pushing price.
3. REGIME ZONES (Distribution Shift Highlighting):
Boxes drawn around price action during periods when MMD > threshold:
Zone Detection:
• System enters "in_regime" mode when MMD crosses above threshold
• Tracks highest high and lowest low during regime
• Exits "in_regime" when MMD crosses back below threshold
• Draws box from regime_start to current bar, spanning high to low
Zone Colors:
• EXTREME regime: Red with 90% transparency (dangerous)
• SHIFTING regime: Amber with 92% transparency (active)
• Other regimes: Teal with 95% transparency (normal)
Emphasis Boxes:
When regime_shift occurs (MMD crosses above threshold that bar), a special 4-bar wide emphasis box highlights the exact transition moment with thicker borders and lower transparency.
This visual immediately shows "the market just changed" moments.
4. SIGNAL CONNECTION LINES:
Lines connecting consecutive signals to show trade sequences:
Line Types:
• Solid line : Same direction signals (long → long, short → short)
• Dotted line : Reversal signals (long → short or short → long)
Visual Purpose:
• Identify signal clusters (multiple entries same direction)
• Spot reversal patterns (system changing bias)
• See average bars between signals
• Understand system behavior patterns
Connections are limited to signals within 100 bars of each other to avoid across-chart lines.
📈 COMPREHENSIVE DASHBOARD: REAL-TIME SYSTEM STATE
The dashboard provides complete transparency into system internals with three size modes:
MINIMAL MODE:
• Header (Regime + WFO phase)
• Signal Status (LONG READY / SHORT READY / WAITING)
• Core metrics only
COMPACT MODE (Default):
• Everything in Minimal
• Kernel info
• Active bandit arm + validation
• WFO efficiency
• Confluence scores (bull/bear)
• MMD current value
• Position status (if active)
• Performance summary
FULL MODE:
• Everything in Compact
• Signal Quality Diagnostics:
- Bull quality score vs threshold with progress bar
- Bear quality score vs threshold with progress bar
- MMD threshold check (✓/✗)
- MMD percentile (top X% of history)
- Regime fit score (how well current regime suits trading)
- WFO confidence level (validation strength)
- Adaptive cooldown status (bars remaining vs required)
• All Arms Signals:
- Shows all 7 arm signals (▲/▼/○)
- Q-value for each arm
- Indicates selected arm with ◄
• Thompson Sampling Parameters (if TS mode):
- Alpha/Beta values for selected arm
- Probability estimate (α/(α+β))
• Extended Performance:
- Expectancy per trade
- Sharpe ratio with star rating
- Individual arm performance (if enough data)
Key Dashboard Sections:
REGIME: Current market regime (STABLE/TRENDING/SHIFTING/ELEVATED/EXTREME) with color-coded background
SIGNAL STATUS:
• "▲ LONG READY" (cyan) - Long signal qualified
• "▼ SHORT READY" (red) - Short signal qualified
• "○ WAITING" (gray) - No qualified signals
• Signal Mode displayed (Responsive/Transition/Continuous)
KERNEL:
• Active kernel type (RBF/Laplacian/Cauchy/Rational Quadratic)
• Current bandwidth (effective after adaptation)
• Adaptive vs Fixed indicator
• RBF scale (if RBF) or RQ alpha (if RQ)
BANDIT:
• Selection algorithm (UCB1/UCB1-Tuned/Epsilon/Thompson)
• Active arm name (MMD Shift, Trend, Breakout, etc.)
• Validation status (✓ if validated, ? if unproven)
• Pull count (n=XXX) - how many times selected
• Q-Value (×10000 for readability)
• UCB score (exploration + exploitation)
• Train Q vs Test Q comparison
• Test trade count
WFO:
• Current period number
• Progress through period (XX%)
• Efficiency percentage (color-coded: green >80%, yellow 50-80%, red <50%)
• Overfit risk assessment (LOW/MODERATE/HIGH)
• Validated arms count (X/7)
CONFLUENCE:
• Bull score (X/7) with progress bar (███ full, ██ medium, █ low, ○ none)
• Bear score (X/7) with progress bar
• Color-coded: Green/red if ≥ minimum, gray if below
MMD:
• Current value (3 decimals)
• Threshold (2 decimals)
• Ratio (MMD/Threshold × multiplier, e.g. "1.5x" = 50% above threshold)
• Velocity (+/- percentage change) with up/down arrows
POSITION:
• Status: LONG/SHORT/FLAT
• Active indicator (● if active, ○ if flat)
• Bars since entry
• Current P&L percentage (if active)
• P&L direction (▲ profit / ▼ loss)
• R-Multiple (how many Rs: PnL / initial_risk)
PERFORMANCE:
• Total Trades
• Wins (green) / Losses (red) breakdown
• Win Rate % with visual bar and color coding
• Profit Factor (PF) with checkmark if >1.0
• Expectancy % (average profit per trade)
• Sharpe Ratio with star rating (★★★ >2, ★★ >1, ★ >0, ○ negative)
• Max DD % (maximum drawdown) with "Now: X%" showing current drawdown
🔧 KEY PARAMETERS EXPLAINED
Kernel Configuration:
• Kernel Function : RBF / Laplacian / Cauchy / Rational Quadratic
- Start with Cauchy for stability, experiment with others
• Bandwidth (σ) (0.5-10.0, default 2.0): Kernel sensitivity
- Lower: More signals, more false positives (scalping: 0.8-1.5)
- Medium: Balanced (swing: 1.5-3.0)
- Higher: Fewer signals, stronger quality (position: 3.0-8.0)
• Adaptive Bandwidth (default ON): Auto-adjust to volatility
- Keep ON for most markets
• RBF Scale (0.1-2.0, default 0.5): RBF-specific scaling
- Only matters if RBF kernel selected
- Lower = more sensitive (0.3 for scalping)
- Higher = less sensitive (1.0+ for position)
• RQ Alpha (0.5-5.0, default 2.0): Rational Quadratic tail behavior
- Only matters if RQ kernel selected
- Low (0.5-1.0): Heavy tails, robust to outliers (like Cauchy)
- High (3.0-5.0): Light tails, sensitive (like RBF)
Analysis Windows:
• Reference Period (30-500, default 100): Historical baseline
- Scalping: 50-80
- Intraday: 80-150
- Swing: 100-200
- Position: 200-500
• Test Period (5-100, default 20): Recent behavior window
- Should be 15-25% of Reference Period
- Scalping: 10-15
- Intraday: 15-25
- Swing: 20-40
- Position: 30-60
• Sample Size (10-40, default 20): Data points for MMD
- Lower: Faster, less reliable (scalping: 12-15)
- Medium: Balanced (standard: 18-25)
- Higher: Slower, more reliable (position: 25-35)
Walk-Forward Optimization:
• Enable WFO (default ON): Master overfitting protection
- Always ON for live trading
• Training Window (100-2000, default 500): Learning data
- Should be 4-6× Testing Window
- 1m-5m: 300-500
- 15m-1h: 500-800
- 4h-1D: 500-1000
- 1D-1W: 800-2000
• Testing Window (50-500, default 100): Validation data
- Should be 1/5 to 1/4 of Training
- 1m-5m: 50-100
- 15m-1h: 80-150
- 4h-1D: 100-200
- 1D-1W: 150-500
• Min Trades for Validation (5-50, default 10): Statistical threshold
- Active traders: 8-12
- Position traders: 15-30
• Performance Decay (0.8-0.99, default 0.95): Old data forgetting
- Aggressive: 0.85-0.90 (volatile markets)
- Moderate: 0.92-0.96 (most use cases)
- Conservative: 0.97-0.99 (stable markets)
Multi-Armed Bandit:
• Learning Rate (α) (0.01-0.3, default 0.08): Adaptation speed
- Low: 0.01-0.05 (position trading, stable)
- Medium: 0.06-0.12 (day/swing trading)
- High: 0.15-0.30 (scalping, fast adaptation)
• Selection Strategy : UCB1 / UCB1-Tuned / Epsilon-Greedy / Thompson
- UCB1 recommended for most (proven, reliable)
- Thompson for advanced users (best empirical performance)
• Exploration Constant (c) (0.5-3.0, default 1.5): Explore vs exploit
- Low: 0.5-1.0 (conservative, proven strategies)
- Medium: 1.2-1.8 (balanced)
- High: 2.0-3.0 (experimental, volatile markets)
• Epsilon (0.0-0.3, default 0.10): Random exploration (ε-greedy only)
- Only applies if Epsilon-Greedy selected
- Standard: 0.10 (10% random)
Signal Configuration:
• MMD Threshold (0.05-1.0, default 0.15): Distribution divergence trigger
- Low: 0.08-0.12 (scalping, sensitive)
- Medium: 0.12-0.20 (day/swing)
- High: 0.25-0.50 (position, strong signals)
- Stocks/indices: 0.12-0.18
- Forex: 0.15-0.25
- Crypto: 0.20-0.35
• Confluence Filter (default ON): Multi-factor requirement
- Keep ON for quality signals
• Minimum Confluence (1-7, default 2): Factors needed
- Very low: 1 (high frequency)
- Low: 2-3 (active trading)
- Medium: 4-5 (swing)
- High: 6-7 (rare perfect setups)
• Cooldown (1-20, default 5): Bars between signals
- Short: 1-3 (scalping, allows rapid re-entry)
- Medium: 4-7 (day/swing)
- Long: 8-20 (position, ensures development)
• Signal Mode : Responsive / Transition Only / Continuous
- Responsive: Recommended (new + upgrades)
- Transition: Cleanest (first + reversals)
- Continuous: Testing (every qualified bar)
Advanced Signal Control:
• Minimum Signal Strength (30-90, default 60): Quality floor
- Lower: More signals (scalping: 40-50)
- Medium: Balanced (standard: 55-65)
- Higher: Fewer signals (position: 70-80)
• Dynamic MMD Threshold (default ON): Auto-calibration
- Keep ON for adaptive behavior
• Signal Ranking Filter (default ON): Top percentile only
- Keep ON to trade only best signals
• Ranking Percentile (50-95, default 75): Selectivity
- 75 = top 25% of signals
- 85 = top 15% of signals
- 90 = top 10% of signals
• Adaptive Cooldown (default ON): Volatility-scaled spacing
- Keep ON for intelligent spacing
• Regime Filter : Off / Smart / Strict
- Off: Any regime (maximize frequency)
- Smart: Avoid extremes (recommended)
- Strict: Only optimal regimes (maximum quality)
Risk Parameters:
• Risk:Reward Ratio (1.0-5.0, default 2.0): Target distance multiplier
- Conservative: 1.0-1.5 (higher WR needed)
- Balanced: 2.0-2.5 (standard professional)
- Aggressive: 3.0-5.0 (lower WR acceptable)
• Stop Loss (ATR mult) (0.5-4.0, default 1.5): Stop distance
- Tight: 0.5-1.0 (scalping, low vol)
- Medium: 1.2-2.0 (day/swing)
- Wide: 2.5-4.0 (position, high vol)
• Pause After Drawdown (2-20%, default 8%): Circuit breaker
- Aggressive: 3-6% (small accounts)
- Moderate: 6-10% (most traders)
- Relaxed: 10-15% (large accounts)
Multi-Timeframe:
• MTF Confirmation (default OFF): Higher TF filter
- Turn ON for swing/position trading
- Keep OFF for scalping/day trading
• Higher Timeframe (default "60"): HTF for trend check
- Should be 3-5× chart timeframe
- 1m chart → 5m or 15m
- 5m chart → 15m or 60m
- 15m chart → 60m or 240m
- 1h chart → 240m or D
Display:
• Probability Cloud (default ON): Volatility bands
• Momentum Flow Vectors (default ON): Directional arrows
• Regime Zones (default ON): Distribution shift boxes
• Signal Connections (default ON): Lines between signals
• Dashboard (default ON): Stats table
• Dashboard Position : Top Left / Top Right / Bottom Left / Bottom Right
• Dashboard Size : Minimal / Compact / Full
• Color Scheme : Default / Monochrome / Warm / Cool
• Show MMD Debug Plot (default OFF): Overlay MMD value
- Turn ON temporarily for threshold calibration
🎓 PROFESSIONAL USAGE PROTOCOL
Phase 1: Parameter Calibration (Week 1)
Goal: Find optimal kernel and bandwidth for your instrument/timeframe
Setup:
• Enable "Show MMD Debug Plot"
• Start with Cauchy kernel, 2.0 bandwidth
• Run on chart with 500+ bars of history
Actions:
• Watch yellow MMD line vs red threshold line
• Count threshold crossings per 100 bars
• Adjust bandwidth to achieve desired signal frequency:
- Too many crossings (>20): Increase bandwidth (2.5-3.5)
- Too few crossings (<5): Decrease bandwidth (1.2-1.8)
• Try other kernels to see sensitivity differences
• Note: RBF most sensitive, Cauchy most robust
Target: 8-12 threshold crossings per 100 bars for day trading
Phase 2: WFO Validation (Weeks 2-3)
Goal: Verify strategies generalize out-of-sample
Requirements:
• Enable WFO with default settings (500/100)
• Let system run through 2-3 complete WFO cycles
• Accumulate 50+ total trades
Actions:
• Monitor WFO Efficiency in dashboard
• Check which arms validate (green ✓) vs unproven (yellow ?)
• Review Train Q vs Test Q for selected arm
• If efficiency < 0.5: System overfitting, adjust parameters
Red Flags:
• Efficiency consistently <0.4: Serious overfitting
• Zero arms validate after 2 cycles: Windows too short or thresholds too strict
• Selected arm never validates: Investigate arm logic relevance
Phase 3: Signal Quality Tuning (Week 4)
Goal: Optimize confluence and quality thresholds
Requirements:
• Switch dashboard to FULL mode
• Enable all diagnostic displays
• Track signals for 100+ bars
Actions:
• Watch Bull/Bear quality scores in real-time
• Note quality distribution of fired signals (are they all 60-70% or higher?)
• If signal ranking on, check percentile cutoff appropriateness
• Adjust "Minimum Signal Strength" to filter weak setups
• Adjust "Minimum Confluence" if too many/few signals
Optimization:
• If win rate >60%: Lower thresholds (capture more opportunities)
• If win rate <45%: Raise thresholds (improve quality)
• If Profit Factor <1.2: Increase minimum quality by 5-10 points
Phase 4: Regime Awareness (Week 5)
Goal: Understand which regimes work best
Setup:
• Track performance by regime using notes/journal
• Dashboard shows current regime constantly
Actions:
• Note signal quality and outcomes in each regime:
- STABLE: Often weak signals, low confidence
- TRENDING: Trend-following arms dominate
- SHIFTING: Highest signal quality, core opportunity
- ELEVATED: Good signals, moderate success
- EXTREME: Mixed results, high variance
• Adjust Regime Filter based on findings
• If losing in EXTREME consistently: Use "Smart" or "Strict" filter
Phase 5: Micro Live Testing (Weeks 6-8)
Goal: Validate forward performance with minimal capital
Requirements:
• Paper trading shows: WR >45%, PF >1.2, Efficiency >0.6
• Understand why signals fire and why they're blocked
• Comfortable with dashboard interpretation
Setup:
• 10-25% intended position size
• Focus on ML-boosted signals (if any pattern emerges)
• Keep detailed journal with screenshots
Actions:
• Execute every signal the system generates (within reason)
• Compare your P&L to shadow portfolio metrics
• Track divergence between your results and system expectations
• Review weekly: What worked? What failed? Any execution issues?
Red Flags:
• Your WR >20% below paper: Execution problems (slippage, timing)
• Your WR >20% above paper: Lucky streak or parameter mismatch
• Dashboard metrics drift significantly: Market regime changed
Phase 6: Full Scale Deployment (Month 3+)
Goal: Progressively increase to full position sizing
Requirements:
• 30+ micro live trades completed
• Live WR within 15% of paper WR
• Profit Factor >1.0 live
• Max DD <15% live
• Confidence in parameter stability
Progression:
• Months 3-4: 25-50% intended size
• Months 5-6: 50-75% intended size
• Month 7+: 75-100% intended size
Maintenance:
• Weekly dashboard review for metric drift
• Monthly WFO efficiency check (should stay >0.5)
• Quarterly parameter re-optimization if market character shifts
• Annual deep review of arm performance and kernel relevance
Stop/Reduce Rules:
• WR drops >20% from baseline: Reduce to 50%, investigate
• Consecutive losses >12: Reduce to 25%, review parameters
• Drawdown >20%: Stop trading, reassess system fit
• WFO efficiency <0.3 for 2+ periods: System broken, retune completely
💡 DEVELOPMENT INSIGHTS & KEY BREAKTHROUGHS
The Kernel Discovery:
Early versions used simple moving average crossovers and momentum indicators—they captured obvious moves but missed subtle regime changes. The breakthrough came from reading academic papers on two-sample testing and kernel methods. Applying Maximum Mean Discrepancy to financial returns revealed distribution shifts 10-20 bars before traditional indicators signaled. This edge—knowing the market had fundamentally changed before it was obvious—became the core of KMD.
Testing showed Cauchy kernel outperformed others by 15% win rate in crypto specifically because its heavy tails ignored the massive outlier spikes (liquidation cascades, bot manipulation) that fooled RBF into false signals.
The Seven Arms Revelation:
Originally, the system had one strategy: "Trade when MMD crosses threshold." Performance was inconsistent—great in ranging markets, terrible in trends. The insight: different market structures require different strategies. Creating seven distinct arms based on different market theories (trend-following, mean-reversion, breakout, volume, momentum) and letting them compete solved the problem.
The multi-armed bandit wasn't added as a gimmick—it was the solution to "which strategy should I use right now?" The system discovers the answer automatically through reinforcement learning.
The Thompson Sampling Superiority:
UCB1 worked fine, but Thompson Sampling empirically outperformed it by 8% over 1000+ trades in backtesting. The reason: Thompson's probabilistic selection naturally hedges uncertainty. When two arms have similar Q-values, UCB1 picks one deterministically (whichever has slightly higher exploration bonus). Thompson samples from both distributions, sometimes picking the "worse" one—and often discovering it's actually better in current conditions.
Implementing true Beta distribution sampling (Box-Muller + Marsaglia-Tsang) instead of fake approximations was critical. Fake Thompson (using random with bias) underperformed UCB1. Real Thompson with proper Bayesian updating dominated.
The Walk-Forward Necessity:
Initial backtests showed 65% win rate across 5000 trades. Live trading: 38% win rate over first 100 trades. Crushing disappointment. The problem: overfitting. The training data included the test data (look-ahead bias). Implementing proper walk-forward optimization with out-of-sample validation dropped backtest win rate to 51%—but live performance matched at 49%. That's a system you can trust.
WFO efficiency metric became the North Star. If efficiency >0.7, live results track paper. If efficiency <0.5, prepare for disappointment.
The Confluence Complexity:
First signals were simple: "MMD high + arm agrees." This generated 200+ signals on 1000 bars with 42% win rate—not tradeable. Adding confluence (must have trend + volume + structure + RSI) reduced signals to 40 with 58% win rate. The math clicked: fewer, better signals outperform many mediocre signals .
The weighted system (20pt critical factors, 15pt high-impact, 10pt moderate/bonus) emerged from analyzing which factors best predicted wins. Bandit arm alignment and MMD quality were 2-3× more predictive than RSI or divergence, so they got 2× the weight. This isn't arbitrary—it's data-driven.
The Dynamic Threshold Insight:
Fixed MMD threshold failed across different market conditions. 0.15 worked perfectly on ES but fired constantly on Bitcoin. The adaptive threshold (scaling with recent MMD mean + stdev) auto-calibrated to instrument volatility. This single change made the system deployable across forex, crypto, stocks without manual tuning per instrument.
The Signal Mode Evolution:
Originally, every qualified bar showed a triangle. Charts became unusable—dozens of stacked triangles during trending regimes. "Transition Only" mode cleaned this up but missed re-entries when quality spiked mid-regime. "Responsive" mode emerged as the optimal balance: show fresh qualifications, reversals, AND significant quality improvements (25%+) during extreme regimes. This captures the signal intent ("something important just happened") without chart pollution.
🚨 LIMITATIONS & CRITICAL ASSUMPTIONS
What This System IS NOT:
• NOT Predictive : KMD doesn't forecast prices. It identifies when the current distribution differs from historical baseline, suggesting regime transition—but not direction or magnitude.
• NOT Holy Grail : Typical performance is 48-56% win rate with 1.3-1.8 avg R-multiple. This is a probabilistic edge, not certainty. Expect losing streaks of 8-12 trades.
• NOT Universal : Performs best on liquid, auction-driven markets (futures, major forex, large-cap stocks, BTC/ETH). Struggles with illiquid instruments, thin order books, heavily manipulated markets.
• NOT Hands-Off : Requires monitoring for news events, earnings, central bank announcements. MMD cannot detect "Fed meeting in 2 hours" or "CEO stepping down"—it only sees statistical patterns.
• NOT Immune to Regime Persistence : WFO helps but cannot predict black swans or fundamental market structure changes (pandemic, war, regulatory overhaul). During these events, all historical patterns may break.
Core Assumptions:
1. Return Distributions Exhibit Clustering : Markets alternate between relatively stable distributional regimes. Violation: Permanent random walk, no regime structure.
2. Distribution Changes Precede Price Moves : Statistical divergence appears before obvious technical signals. Violation: Instantaneous regime flips (gaps, news), no statistical warning.
3. Volume Reflects Real Activity : Volume-based confluence assumes genuine participation. Violation: Wash trading, spoofing, exchange manipulation (common in crypto).
4. Past Arm Performance Predicts Future Arm Performance : The bandit learns from history. Violation: Fundamental strategy regime change (e.g., market transitions from mean-reverting to trending permanently).
5. ATR-Based Stops Are Rational : Volatility-normalized risk management avoids premature exits. Violation: Flash crashes, liquidity gaps, stop hunts precisely targeting ATR multiples.
6. Kernel Similarity Maps to Economic Similarity : Mathematical similarity (via kernel) correlates with economic similarity (regime). Violation: Distributions match by chance while fundamentals differ completely.
Performs Best On:
• ES, NQ, RTY (S&P 500, Nasdaq, Russell 2000 futures)
• Major forex pairs: EUR/USD, GBP/USD, USD/JPY, AUD/USD
• Liquid commodities: CL (crude oil), GC (gold), SI (silver)
• Large-cap stocks: AAPL, MSFT, GOOGL, TSLA (>$10M avg daily volume)
• Major crypto on reputable exchanges: BTC, ETH (Coinbase, Kraken)
Performs Poorly On:
• Low-volume stocks (<$1M daily volume)
• Exotic forex pairs with erratic spreads
• Illiquid crypto altcoins (manipulation, unreliable volume)
• Pre-market/after-hours (thin liquidity, gaps)
• Instruments with frequent corporate actions (splits, dividends)
• Markets with persistent one-sided intervention (central bank pegs)
Known Weaknesses:
• Lag During Instantaneous Shifts : MMD requires (test_window) bars to detect regime change. Fast-moving events (5-10 bar crashes) may bypass detection entirely.
• False Positives in Choppy Consolidation : Low-volatility range-bound markets can trigger false MMD spikes from random noise crossing threshold. Regime filter helps but doesn't eliminate.
• Parameter Sensitivity : Small bandwidth changes (2.0→2.5) can alter signal frequency by 30-50%. Requires careful calibration per instrument.
• Bandit Convergence Time : MAB needs 50-100 trades per arm to reliably learn Q-values. Early trades (first 200 bars) are essentially random exploration.
• WFO Warmup Drag : First WFO cycle has no validation data, so all arms start unvalidated. System may trade rarely or conservatively for first 500-600 bars until sufficient test data accumulates.
• Visual Overload : With all display options enabled (cloud, vectors, zones, connections), chart can become cluttered. Disable selectively for cleaner view.
⚠️ RISK DISCLOSURE
Trading futures, forex, stocks, options, and cryptocurrencies involves substantial risk of loss and is not suitable for all investors. Leveraged instruments can result in losses exceeding your initial investment. Past performance, whether backtested or live, is not indicative of future results.
The Kernel Market Dynamics system, including its multi-armed bandit and walk-forward optimization components, is provided for educational purposes only. It is not financial advice, investment advice, or a recommendation to buy or sell any security or instrument.
The adaptive learning algorithms optimize based on historical data—there is no guarantee that learned strategies will remain profitable or that kernel-detected regime changes will lead to profitable trades. Market conditions change, correlations break, and distributional regimes shift in ways that historical data cannot predict. Black swan events occur.
Walk-forward optimization reduces but does not eliminate overfitting risk. WFO efficiency metrics indicate likelihood of forward performance but cannot guarantee it. A system showing high efficiency on one dataset may show low efficiency on another timeframe or instrument.
The dashboard shadow portfolio simulates trades under idealized conditions: instant fills, no slippage, no commissions, perfect execution. Real trading involves slippage (often 1-3 ticks per trade), commissions, latency, partial fills, rejected orders, requotes, and liquidity constraints that significantly reduce performance below simulated results.
Maximum Mean Discrepancy is a statistical distance metric—high MMD indicates distribution divergence but does not indicate direction, magnitude, duration, or profitability of subsequent moves. MMD can spike during sideways chop, producing signals with no directional follow-through.
Users must independently validate system performance on their specific instruments, timeframes, broker execution, and market conditions before risking capital. Conduct extensive paper trading (minimum 100 trades) and start with micro position sizing (10-25% intended size) for at least 50 trades before scaling up.
Never risk more capital than you can afford to lose completely. Use proper position sizing (1-2% risk per trade maximum). Implement stop losses on every trade. Maintain adequate margin/capital reserves. Understand that most retail traders lose money. Algorithmic systems do not change this fundamental reality—they systematize decision-making but do not eliminate risk.
The developer makes no warranties regarding profitability, suitability, accuracy, reliability, or fitness for any particular purpose. Users assume all responsibility for their trading decisions, parameter selections, risk management, and outcomes.
By using this indicator, you acknowledge that you have read and understood these risk disclosures and accept full responsibility for all trading activity and potential losses.
📁 SUGGESTED TRADINGVIEW CATEGORIES
PRIMARY CATEGORY: Statistics
The Kernel Market Dynamics system is fundamentally a statistical learning framework . At its core lies Maximum Mean Discrepancy—an advanced two-sample statistical test from the academic machine learning literature. The indicator compares probability distributions using kernel methods (RBF, Laplacian, Cauchy, Rational Quadratic) that map data to high-dimensional feature spaces for nonlinear similarity measurement.
The multi-armed bandit framework implements reinforcement learning via Q-learning with exponential moving average updates. Thompson Sampling uses true Bayesian inference with Beta posterior distributions. Walk-forward optimization performs rigorous out-of-sample statistical validation with train/test splits and efficiency metrics that detect overfitting.
The confluence system aggregates multiple statistical indicators (RSI, ADX, OBV, Z-scores, EMAs) with weighted scoring that produces a 0-100 quality metric. Signal ranking uses percentile-based filtering on historical quality distributions. The dashboard displays comprehensive statistics: win rates, profit factors, Sharpe ratios, expectancy, drawdowns—all computed from trade return distributions.
This is advanced statistical analysis applied to trading: distribution comparison, kernel methods, reinforcement learning, Bayesian inference, hypothesis testing, and performance analytics. The statistical sophistication distinguishes KMD from simple technical indicators.
SECONDARY CATEGORY: Volume
Volume analysis plays a crucial role in KMD's signal generation and validation. The confluence system includes volume confirmation as a high-impact factor (15 points): signals require above-average volume (>1.2× mean) for full points, with scaling based on volume ratio. The OBV (On-Balance Volume) trend indicator determines directional bias for Arm 6 (Volume Confirmation strategy).
Volume ratio (current / 20-period average) directly affects confluence scores—higher volume strengthens signal quality. The momentum flow vectors scale width and opacity based on volume momentum relative to average. Energy particle visualization specifically marks volume burst events (>2× average volume) as potential market-moving catalysts.
Several bandit arms explicitly incorporate volume:
• Arm 2 (Breakout): Requires volume confirmation for Bollinger Band breaks
• Arm 6 (Volume Confirmation): Primary logic based on OBV trend + volume spike
The system recognizes volume as the "conviction" behind price moves—distribution changes matter more when accompanied by significant volume, indicating genuine participant behavior rather than noise. This volume-aware filtering improves signal reliability in liquid markets.
TERTIARY CATEGORY: Volatility
Volatility measurement and adaptation permeate the KMD system. ATR (Average True Range) forms the basis for all risk management: stops are placed at ATR × multiplier, targets are scaled accordingly. The adaptive bandwidth feature scales kernel bandwidth (0.5-2.0×) inversely with volatility—tightening during calm markets, widening during volatile periods.
The probability cloud (primary visual element) directly visualizes volatility: bands expand/contract based on (1 + MMD × 3) multiplier applied to ATR. Higher MMD (distribution divergence) + higher ATR = dramatically wider uncertainty bands.
Adaptive cooldown scales minimum bars between signals based on ATR percentage: higher volatility = longer cooldown (up to 3× base), preventing overtrading during whipsaw conditions. The gamma parameter in the tensor calculation (from related indicators) and volatility ratio measurements influence MMD sensitivity.
Regime classification incorporates volatility metrics: high volatility with ranging price action produces "RANGE⚡" regime, while volatility expansion with directional movement produces trending regimes. The system adapts its behavior to volatility regimes—tighter requirements during extreme volatility, looser requirements during stable periods.
ATR-based risk management ensures position sizing and exit levels automatically adapt to instrument volatility, making the system deployable across instruments with different average volatilities (stocks vs crypto) without manual recalibration.
══════════════════════════════════════════
CLOSING STATEMENT
══════════════════════════════════════════
Kernel Market Dynamics doesn't just measure price—it measures the probability structure underlying price. It doesn't just pick one strategy—it learns which strategies work in which conditions. It doesn't just optimize on history—it validates on the future.
This is machine learning applied correctly to trading: not curve-fitting oscillators to maximize backtest profit, but implementing genuine statistical learning algorithms (kernel methods, multi-armed bandits, Bayesian inference) that adapt to market evolution while protecting against overfitting through rigorous walk-forward testing.
The seven arms compete. The Thompson sampler selects. The kernel measures. The confluence scores. The walk-forward validates. The signals fire.
Most indicators tell you what happened. KMD tells you when the game changed.
"In the space between distributions, where the kernel measures divergence and the bandit learns from consequence—there, edge exists." — KMD-WFO-MAB v2
Taking you to school. — Dskyz, Trade with insight. Trade with anticipation.

Inversion Fair Value Gap Model [PJ Trades]GENERAL OVERVIEW:
The Inversion Fair Value Gap Model indicator is a complete rule-based system designed to identify trade setups using the Inversion Fair Value Gap strategy taught by PJ Trades. It automates the strategy’s workflow by detecting liquidity sweeps, confirming V-shape recoveries, identifying valid Inversion Fair Value Gaps, validating higher-timeframe Fair Value Gap taps, and checking for a clear opposite Draw On Liquidity. These factors are evaluated together to produce a signal rating of A, A+, or A++, based on how many of these criteria the setup satisfies. When a long or short setup is confirmed, the indicator automatically plots an entry, stop-loss, break-even, and two take-profit levels.
A dashboard that updates in real-time displays the current directional bias, liquidity sweep activity, Inversion Fair Value Gap confirmation state, V Shape Recovery state, higher-timeframe Fair Value Gap context, opposite Draw on Liquidity, SMT divergence, and other key information relevant to the trading model. The indicator also includes optional trade statistics on the dashboard that tracks the recent win rates for A, A+, and A++ setups, as well as separate long and short win rates.
This indicator was developed by Flux Charts, in collaboration with PJ Trades.
What is the theory behind the indicator?:
The Inversion Fair Value Gap model is built on the idea that when the market pushes above a high or below a low, it often does so to sweep liquidity. If that move quickly fails and price reverses, it shows the sweep was a grab for orders and not a continuation. That quick rejection is the V Shape Recovery behavior. An Inversion Fair Value Gap forms when a Fair Value Gap that once supported the original move gets invalidated afterward. That invalidation confirms the shift in direction and becomes the new reference point for trades. The Inversion Fair Value Gap model uses this sequence because it highlights when the market has taken liquidity, rejected continuation, and started delivering in the opposite direction.
INVERSION FAIR VALUE GAP MODEL FEATURES:
The Inversion Fair Value Gap Model indicator includes 15 main features:
Sessions
Key Levels & Swing Levels
Liquidity Levels
Liquidity Sweeps
V Shape Recoveries
Higher-Timeframe Fair Value Gaps
Inversion Fair Value Gaps
Macros
Bias
Signals
New Day Opening Gap
New Week Opening Gap
SMT Divergences
Dashboard
Alerts
SESSIONS:
The Inversion Fair Value Gap Model indicator includes five trading sessions (times in EST):
Asia: 20:00 - 00:00
London: 02:00 - 05:00
NY AM: 09:30 - 12:15
NY Lunch: 12:15 - 13:30
NY PM: 13:30 - 16:00
Session highs and lows are automatically tracked and used within the indicator’s signal logic.
🔹Session Zones:
Each session has a zone that outlines its active time window. These zones can be toggled on or off independently. When active, they visually separate each part of the trading day. Users can adjust the color and opacity of each session box. Users can also enable session labels, which place a label above each session zone showing its corresponding session name.
🔹Session Time:
Users can toggle on ‘Time’ which will display each session’s time window next to its session title.
🔹Session Highs/Lows:
Every session can display its own high and low as horizontal lines. Users can customize the line style for session highs/lows, choosing between solid, dashed, or dotted. The color of the lines will match the same color used for the session box. Users can adjust the color of the labels as well, which is applied to all session high/low labels.
When price has moved above a session high, or below a session low, the label will not be displayed anymore.
🔹Extend Levels:
When enabled, each session’s high and low levels can be extended forward by a set number of bars.
Please Note: Disabling a session under the main Sessions section only hides its visuals (boxes, lines, or labels). It does not impact signal detection or logic.
KEY LEVELS:
The Inversion Fair Value Gap Model indicator includes 11 key market levels that outline important structural price areas across daily, weekly, and monthly timeframes. These levels include the Daily Open, Previous Day High/Low, Weekly Open, Previous Week High/Low, Monthly Open, Previous Month High/Low, Midnight Open, and 08:30 Open. The levels can be enabled or disabled and customized in color and line style. All of the levels except the Midnight Open and 08:30 Open are used for the indicator’s signal logic.
🔹Daily Open
The Daily Open marks where the current trading day began.
🔹Previous Day High/Low
The Previous Day High (PDH) marks the highest price reached during the previous regular trading session. It shows where buyers pushed price to its highest point before the market closed.
The Previous Day Low (PDL) marks the lowest price reached during the previous regular trading session. It shows where selling pressure reached its lowest point before buyers stepped in.
When price pushes above the PDH or below the PDL, the level is removed from the chart.
🔹Weekly Open
The Weekly Open marks the first price of the current trading week.
🔹Previous Week High/Low
The Previous Week High (PWH) marks the highest price reached during the previous trading week. It shows where buying pressure reached its peak before the weekly close.
The Previous Week Low (PWL) marks the lowest price reached during the previous trading week. It shows where sellers pushed price to its lowest point before buyers regained control.
When price pushes above the PWH or below the PWL, the level is removed from the chart.
🔹Monthly Open
The Monthly Open marks the opening price of the current month.
🔹Previous Month High/Low
The Previous Month High (PMH) marks the highest price reached during the previous calendar month. It represents the point at which buyers achieved the strongest push before the monthly close.
The Previous Month Low (PML) marks the lowest price reached during the previous calendar month. It shows where selling pressure was strongest before buyers stepped back in.
When price pushes above the PMH or below the PML, the level is removed from the chart.
🔹Midnight Open
The Midnight Open marks the first price of the trading day at 00:00 EST.
🔹08:30 Open
The 08:30 Open marks the opening price at 08:30 EST.
🔹Customization Options:
Users can fully customize the appearance of all key levels, including the following:
Labels
Label Size
Line Style
Line Colors
Labels:
Users can toggle on ‘Show Labels’ to display labels for each toggled-on level that price hasn’t pushed above/below. Users can also adjust the size of labels, choosing between auto, tiny, small, normal, large, or huge.
Line Style:
Users can select a line style, choosing between solid, dashed, or dotted, which is applied to all toggled-on key levels.
Line Color:
Users can choose different colors for each of the following key levels:
Daily Open, Previous Day High, Previous Day Low
Weekly Open, Previous Week High, Previous Week Low,
Monthly Open, Previous Month High, Previous Month Low
Midnight Open
08:30 Open
🔹Extend Levels:
When enabled, each key level is extended forward by a set number of bars.
Please Note: Disabling a level in the “Key Levels” section only hides its visuals and does not affect the indicator’s signals.
🔹Swing Levels
The indicator automatically plots Swing Highs and Swing Lows which are used in the indicator’s signal generation logic.
A swing high forms when a candle’s high is greater than the highs of the bars immediately before and after it.
A swing low forms when a candle’s low is lower than the lows of the bars immediately before and after it.
🔹Swing Level Colors
Users can customize the color of Active Levels and Swept Levels.
Active Levels are levels that price has not pushed above or below
Swept Levels are levels that price pushed above or below.
🔹Swing Levels – Show Nearest
This setting determines how many swing highs/lows are displayed on the chart. The indicator will display the nearest X highs to price and the nearest X lows to price.
For example, if ‘Show Nearest’ is set to 2, the nearest 2 swing highs and nearest 2 swing lows to price will be plotted on the chart.
LIQUIDITY LEVELS:
The Inversion Fair Value Gap Model indicator automatically identifies and plots liquidity at key structural points in the market. These include swing highs and swing lows, session highs and lows, and major higher timeframe reference points as explained in the SESSIONS and KEY LEVELS sections above. All of these areas are treated as potential pools of resting orders and are used throughout the indicator’s signal logic.
🔹What is Buyside Liquidity?:
Buyside Liquidity (BSL) represents price levels where many buy stop orders are sitting, usually from traders holding short positions. When price moves into these areas, those stop-loss orders get triggered and short sellers are forced to buy back their positions. These zones often form above key highs such as the previous day, week, or month. Understanding BSL is important because when price reaches these levels, the sudden wave of buy orders can create sharp reactions or reversals as liquidity is taken from the market.
🔹What is Sellside Liquidity?:
Sellside Liquidity (SSL) represents price levels where many sell stop orders are waiting, usually from traders holding long positions. When price drops into these areas, those stop-loss orders are triggered and long traders are forced to sell their positions. These zones often form below key lows such as the previous day, week, or month. Understanding SSL is important because when price reaches these levels, the surge of sell orders can cause sharp reactions or reversals as liquidity is taken from the market.
🔹 Which Liquidity Levels Are Used
The indicator tracks liquidity at the following areas:
Asia Session High/Low
London High/Low
NY AM High/Low
NY Lunch High/Low
NY PM High/Low
Previous Day High and Low
Previous Week High and Low
Previous Month High and Low
Daily Open
Weekly Open
Monthly Open
Swing Highs/Lows
🔹 How Liquidity Levels Are Used
All tracked levels across sessions, swing points, and higher timeframes serve as potential liquidity targets. When price trades above one of these highs, the indicator looks for short setups if other confluences align. When price trades below lows, the indicator looks for long setups if other confluences align.
LIQUIDITY SWEEPS:
The indicator automatically detects Buyside Liquidity and Sellside Liquidity sweeps using the liquidity levels mentioned in the previous section.
🔹What is a Liquidity Sweep?
Liquidity sweeps occur when price trades beyond a key high or low and activates resting buy-stop or sell-stop orders in that area. It’s how the market gathers the liquidity needed for larger participants to enter positions.
Traders often place stop-loss orders around obvious highs and lows, such as the previous day’s, week’s, or month’s levels. When price pushes through one of these areas, it triggers the stops placed there and generates a burst of volume. This can lead to quick movements in price as those orders are executed.
🔹Sellside Liquidity Sweep
These occur when price dips below a Sellside Liquidity (SSL) level, taking out the stop-loss orders placed by long traders below that low. When this happens, the indicator records the sweep and begins monitoring for potential long setups as the next step in the IFVG trading strategy. Long trades are only eligible after a SSL sweep.
🔹Buyside Liquidity Sweep
These occur when price dips above a Buyside Liquidity (BSL) level, taking out the stop-loss orders placed by short seller traders above that high. When this happens, the indicator records the sweep and begins monitoring for potential short setups as the next step in the trading strategy. Short trades are only eligible after a BSL sweep.
🔹How to Use Liquidity Sweeps
Liquidity sweeps are not direct trade signals. They are best used as context when forming a directional bias. A sweep shows that the market has removed liquidity from one side, which can hint at where the next move may develop.
For example:
When BSL is swept, it often signals that buy stops have been triggered and the market may be preparing to move lower. Traders may then begin looking for short opportunities.
When SSL is swept, it often signals that sell stops have been triggered and the market may be preparing to move higher. Traders may then begin looking for long opportunities.
V SHAPE RECOVERIES:
🔹 What Is a V Shape Recovery?
A V shape recovery is a sharp, immediate reversal that happens right after price sweeps BSL or SSL. It indicates that price quickly moved back in the opposite direction after trading through the level. This behavior signals a shift in momentum and is a required confirmation in the indicator for signal generation. The indicator will not look for long trades after a SSL sweep unless a V shape recovery occurs. It will not look for short trades after a BSL sweep unless a V shape recovery occurs. Without this behavior, the indicator assumes that price may still be delivering in the direction of the sweep, so no valid setups can form.
🔹 Why V Shape Recoveries Matter
V shape recoveries help confirm that the liquidity the sweep did not immediately continue in the same direction. They separate false breaks from true continuation. A sweep without recovery often means price may keep trending, so the indicator does not generate signals in those cases. A sweep with a V shape recovery confirms rejection and sets the foundation for valid Inversion Fair Value Gap formation. This makes the V shape recovery one of the most important sequence steps in the Inversion Fair Value Gap Model.
🔹 How the Indicator Detects V Shape Recoveries
V shape recoveries can be visually intuitive when looking at a chart, but they are difficult to define consistently programmatically. To ensure reliable and repeatable detection, the indicator uses a rules-based method that evaluates candle size, candle direction, and the strength of the move immediately following the liquidity sweep. This approach removes subjectivity and allows the indicator to confirm V shape behavior the same way every time.
The indicator does not plot any visual elements specifically for V shape recoveries. Instead, the presence of a V shape recovery is implied through the signals themselves. Every valid long or short signal that appears after a liquidity sweep requires a confirmed V shape recovery. This means that if a signal is generated following a sweep, a V shape recovery has occurred.
🔹 V Shape Recovery After a Sellside Sweep (SSL Sweep)
After price trades below a sellside liquidity level, long positions are liquidated. If buyers quickly step in and force price upward with strong momentum, this forms a V shape recovery. This signals that the sweep below the low was rejected and that buyers have reclaimed control. When this occurs, the indicator begins monitoring for long setups.
🔹 V Shape Recovery After a Buyside Sweep (BSL Sweep)
After price pushes above a buyside liquidity level, many short positions are stopped out. If sellers immediately step in and drive price back down with strong movement, this forms a V shape recovery. This behavior reflects a quick change in candle direction immediately following the sweep. When this occurs, the indicator begins monitoring for short setups.
🔹Failed V Shape Recoveries
These examples show failed V shape recoveries, where price did not reverse decisively after the BSL or SSL sweep. The lack of strong response from buyers or sellers indicates that momentum did not shift. Thus, the indicator will not detect valid long/short setups using these liquidity sweeps.
HIGHER-TIMEFRAME FAIR VALUE GAPS:
Higher-timeframe Fair Value Gaps (HTF FVGs) provide important context in the Inversion Fair Value Gap Model because they show where significant imbalance occurred on larger market structures. The indicator automatically detects HTF FVGs and uses them as part of the signal rating system.
🔹 What Is a Fair Value Gap?
A Fair Value Gap (FVG) is an area where the market’s perception of fair value suddenly changes. On your chart, it appears as a three-candle pattern: a large candle in the middle, with smaller candles on each side that don’t fully overlap it.
A bullish FVG forms when a bullish candle is between two smaller bullish/bearish candles, where the first and third candles’ wicks don’t overlap each other at all.
A bearish FVG forms when a bearish candle is between two smaller bullish/bearish candles, where the first and third candles’ wicks don’t overlap each other at all.
This creates an imbalance because price moved so quickly that one side of the auction did not trade.
Examples:
🔹 What Makes an FVG “Higher-Timeframe”?
In this indicator, HTF FVGs are Fair Value Gaps detected on timeframes higher than the chart’s current timeframe. For example, on a 5-minute chart, a 1-hour FVG would be considered a HTF FVG. The indicator automatically plots and checks whether price interacts with these HTF FVGs during a liquidity sweep and incorporates this into the signal rating (A, A+, A++).
🔹 How the Indicator Uses Higher-Timeframe FVGs
The indicator automatically scans up to three user-selected higher timeframes for valid bullish and bearish FVGs and tracks price’s behavior around them in the background. When any of these higher timeframes are enabled, their FVGs are used directly within the signal logic.
During a liquidity sweep, the indicator checks whether price taps into any enabled HTF FVG. A tap occurs when price trades inside the boundaries of a higher-timeframe FVG during or immediately after the sweep.
A bullish HTF FVG tap during a sellside sweep supports a long setup.
A bearish HTF FVG tap during a buyside sweep supports a short setup.
When an HTF FVG tap aligns with the direction of the setup, the signal’s rating is increased. This can increase a setup’s rating from A to A+ or from A+ to A++.
🔹 Higher-Timeframe FVG Customization
Users can select up to three higher timeframes for HTF FVG detection. When a higher timeframe is enabled, its FVGs are used in the model’s signal logic. Users can also choose whether to display these HTF FVGs visually on the chart, by enabling the ‘Plot HTF FVGs’ setting.
Each enabled HTF FVG can be customized with the following options:
Bullish and Bearish Colors: Users can set different fill colors for bullish and bearish HTF FVGs for each selected timeframe.
Midline: When enabled, a midline is drawn through the center of each HTF FVG. Users can customize the midline’s line style, choosing between solid, dashed, or dotted and also customize the midline’s color.
Labels: When enabled, each plotted HTF FVG displays a label that shows its originating timeframe (for example, 1H, 4H).
Plot HTF FVGs: When disabled, the HTF FVG zones are hidden from the chart while the logic remains active in the background for signals.
Show Nearest:
This setting controls how many HTF FVGs are displayed based on proximity to current price. Users can choose to show the nearest X bullish HTF FVGs and the nearest X bearish HTF FVGs. This filter is applied across all enabled higher timeframes and does not limit by timeframe individually.
🔹When are Higher Timeframe Fair Value Gaps mitigated?
A Higher Timeframe Fair Value Gap is considered mitigated when a candle from the chart’s timeframe closes above the gap for a bearish FVG or below the gap for a bullish FVG.
INVERSION FAIR VALUE GAPS:
Inversion Fair Value Gaps (IFVGs) are a core requirement of the Inversion Fair Value Gap Model. Every long and short signal generated by the indicator requires a valid IFVG, just like liquidity sweeps and V shape recoveries. Without a confirmed IFVG, the model will not produce a setup.
🔹 What Is an Inversion Fair Value Gap?
An Inversion Fair Value Gap is a Fair Value Gap that becomes invalidated by a candle close in the opposite direction. This “flip” confirms that the original imbalance failed and that the market has shifted.
A bullish IFVG forms when a bearish FVG is invalidated by a candle closing above it.
A bearish IFVG forms when a bullish FVG is invalidated by a candle closing below it.
In the indicator, IFVGs are not used as retracement areas. Signals are generated immediately when a valid IFVG forms, not after price returns to the gap. The IFVG itself is the confirmation event that finalizes a setup sequence after a liquidity sweep and V shape recovery.
🔹 How the Indicator Plots IFVGs
The indicator only plots IFVGs that are used in long or short setups. Not every possible IFVG is shown on the chart. Only the IFVG involved in a confirmed signal is displayed. Users can disable IFVG plots entirely if they prefer a minimal view. This hides the visual gaps but does not affect the signal logic.
🔹 Customization Options
Users can customize how IFVGs appear on the chart:
Color Settings: Choose separate fill colors for bullish IFVGs and bearish IFVGs.
Midline: Toggle an optional midline inside the IFVG and choose between a solid, dashed, or dotted line.
Midline Color: Adjust the color of the IFVG Midline.
MACROS:
Macros are short, predefined time windows, where price is more likely to seek liquidity or rebalance imbalances. These periods often create sharp movements or shifts in delivery, giving additional context to setups. In the Inversion Fair Value Gap Model, macros are used as a confluence factor. When a long or short signal forms during a macro time window, the setup’s rating can increase from A to A+ or from A+ to A++.
Macros are not required for a signal to form, but they increase the signal’s rating when the setup aligns with macro timing.
🔹 How the Indicator Uses Macros
The indicator allows users to enable up to five macros. Each macro has its own start and end time, which the user can customize. These time windows are used directly in the signal logic. If a valid IFVG setup forms while price is inside any of the enabled macro windows, the indicator increases the signal’s rating.
Users may visually disable macros on the chart without affecting signal logic. Disabling visuals hides the macro zones, labels, and lines, but the underlying macro logic continues to function in the background for signals.
The indicator’s default macros use the following time periods (in EST):
09:50 - 10:10
10:50 - 11:10
11:50 - 12:10
12:50 - 13:10
13:50 - 14:10
🔹 Macro Settings
Each macro displays a shaded zone representing the active time window. This zone can be toggled on or off. Users can customize:
The color of each macro zone
The opacity of each zone
Whether the zones display at all (‘Show Zones’)
These visuals help identify whether price is currently inside a macro window.
🔹 Macro Labels:
Users can enable macro labels, which place a text label showing the macro’s title and its time window. The label color is global (applies to all macros), and the label size can be adjusted. Individual macros cannot have unique label colors.
🔹 Macro Start/End Lines
For additional clarity, the indicator draws two vertical markers for each macro:
One at the start of the macro
One at the end of the macro
A horizontal macro line is then drawn between the highs of these two candles to highlight the full duration of the macro window. Users can customize:
The line styles (solid, dashed, dotted) of the Macro Line and Start/End Lines
BIAS:
Bias determines which direction the indicator is allowed to generate signals. A bullish bias means only long setups can be confirmed. A bearish bias means only short setups can be confirmed. The bias acts as the final directional filter after a liquidity sweep, V shape recovery, and IFVG have all been validated. Even if all model conditions are met, the indicator will only confirm the setup if the direction aligns with the active bias.
Users are able to manually set a bias or use an automatic bias filter, which is explained below.
🔹 Manual Bias
Users can manually choose the directional bias at any time and choose between Bullish, Bearish, or Both.
When set to Bullish, the indicator will only confirm long setups, regardless of market structure.
When set to Bearish, only short setups are allowed.
When set to Both, the indicator can confirm both long and short setups if all requirements are met.
🔹 Automatic Bias
Automatic bias is fully rules-based and determined by how the previous session interacted with major draw-on-liquidity (DOL) levels. These levels include 1-hour highs and lows, 4-hour highs and lows, previous session highs and lows (such as Asia or London), and the previous day’s high and low. The indicator evaluates whether the previous session consolidated, manipulated liquidity, or manipulated and reversed before closing. Based on this behavior, the indicator establishes a directional bias for the current session.
◇ Previous Session Consolidation:
If the previous session did not sweep any major liquidity levels and price remained inside its range, the session is classified as consolidation.
After the current session sweeps a key low, the bias becomes bullish.
After the current session sweeps a key high, the bias becomes bearish.
The bias is determined live based on which side the current session manipulates first.
◇ Previous Session Manipulation (No Reversal):
If the previous session swept a major high-timeframe level but did not reverse before the session closed, the model assigns a reversal-based bias at the start of the current session.
If the previous session swept a low, the current session bias is bullish.
If the previous session swept a high, the current session bias is bearish.
Here, bias is determined immediately because the previous session’s manipulation defines the directional framework for the current session.
◇ Previous Session Manipulation + Reversal:
If the previous session swept a DOL level and also reversed away from it within the same session, the model assigns a continuation-based bias at the start of the current session.
If the previous session swept a low and reversed upward, the bias for the current session is bullish.
If the previous session swept a high and reversed downward, the bias is bearish.
🔹 How the Indicator Uses Bias in Practice
After the indicator validates the liquidity sweep, V shape recovery, and IFVG, it checks the active bias before confirming a signal.
If bias is bullish, only long setups are allowed.
If bias is bearish, only short setups are allowed.
If bias is Both, setups of either direction may form.
The bias does not influence the detection of liquidity sweeps, V shape recoveries, or IFVGs. It only determines whether those validated components are allowed to produce a final signal. Automatic bias updates based on session behavior, while manual bias remains fixed until the user changes it.
SIGNALS:
Signals are the final output of the Inversion Fair Value Gap Model indicator. A signal is only generated when all model conditions are satisfied in a clear, rules-based sequence.
A signal consists of:
An Entry
A Stop-Loss (SL)
A Breakeven (BE) level
Two Take-Profit levels (TP1 and TP2)
These components are plotted immediately once the final requirement (the IFVG confirmation) is met and the directional filter (bias) allows the setup.
Signals can be rated A, A+, or A++, based on whether certain confluences were present during the setup’s formation.
🔹 What All Signals Have in Common
Each signal type (A, A+, A++) requires the same four mandatory conditions. If any of these four are missing, the indicator will not print a signal.
◇ Required Component #1 – Valid Directional Bias
The bias determines whether the indicator can confirm a long or short setup.
Bullish bias → only long setups allowed
Bearish bias → only short setups allowed
Both → long or short setups allowed
Automatic bias → bias determined by session-based liquidity logic explained above
◇ Required Component #2 – Liquidity Sweep
The indicator must detect one of the following:
Sellside Liquidity Sweep (SSL Sweep) for potential long setups
Buyside Liquidity Sweep (BSL Sweep) for potential short setups
◇ Required Component #3 – V Shape Recovery
After a liquidity sweep, the indicator evaluates whether price produced a valid V shape recovery.
◇ Required Component #4 – Inversion Fair Value Gap (IFVG)
An IFVG must form in the direction of the potential setup.
A bullish IFVG forms when a bearish FVG is invalidated by a candle closing above that gap
A bearish IFVG forms when a bullish FVG is invalidated by a candle closing below that gap
The IFVG must occur after the V Shape Recovery and Liquidity Sweep. The IFVG confirmation is the final structural requirement. Once it forms, the setup is considered structurally complete.
🔹 A Signals
An A-rated signal contains exactly the four required components:
Valid Bias
Liquidity Sweep
V Shape Recovery
IFVG
An A signals represent the foundational implementation of the IFVG Model.
🔹 A+ Signals
An A+ signal includes the full A-signal structure plus ONE of the following:
Higher-Timeframe FVG Tap
Multi-Liquidity Sweep
Inside a Macro Window
◇ Higher-Timeframe FVG Tap
During a liquidity sweep, the indicator checks whether price taps into any enabled HTF FVG. A tap occurs when price trades inside the boundaries of a higher-timeframe FVG during or immediately after the sweep.
A bullish HTF FVG tap during a sellside sweep supports a long setup.
A bearish HTF FVG tap during a buyside sweep supports a short setup.
◇ Multi-Liquidity Sweep
A Multi-Liquidity Sweep occurs when price sweeps two liquidity levels of the same type in the same directional push.
Sweeping two lows in one move: Multi-Sellside Liquidity Sweep (long setups).
Sweeping two highs in one move → Multi-Buyside Liquidity Sweep (short setups).
◇ Inside a Macro Window
The final IFVG confirmation must occur inside a macro time window defined by the user.
If exactly one of these additional confluences is present, the signal rating is A+.
🔹 A++ Signals (Two Additional Confluences)
An A++ signal contains the full A signal structure plus TWO of the three confluences listed above.
HTF FVG tap + Multi-Liquidity Sweep
HTF FVG tap + Inside a Macro Window
Multi-Liquidity Sweep + Inside a Macro Window
If two confluences are present, the rating becomes A++. If all three are present, the setup is still rated a A++ (there is no A+++).
🔹 Signal Plots
When a valid long/short setup is detected, a signal with its rating appears with the following:
Entry: At the close of the candle that inverted a FVG
Stop-Loss: At the nearest swing high for short setups or nearest swing low for long setups
Breakeven Level: At the nearest swing high for long setups or the nearest swing low for short setups
Take-Profit 1: At the second nearest swing high for long setups or the second nearest swing low for short setups.
Take-Profit 2: At the third nearest swing high for long setups or the third nearest swing low for short setups.
After a signal reaches either TP2 or SL, the levels for Entry, SL, BE, TP1, and TP2 are removed from the chart. If another signal appears before the prior signal reaches either TP2 or SL, the levels are also removed.
Users can hover over any signal label to view a short summary of the exact criteria that were met for that setup. This includes whether a HTF FVG tap occurred, whether a multi-liquidity sweep was detected, whether the setup formed inside a macro window, and which liquidity level was swept prior to the V shape recovery.
🔹 Long Setup – A Rating
A long A-rated setup forms when all four core requirements of the IFVG Model occur without any additional confluences. First, price must sweep a Sellside Liquidity level. Immediately after the sweep, price must form a valid V shape recovery. Once the recovery completes, a bullish IFVG must form by invalidating a bearish Fair Value Gap with a candle close above it.
For a confirmed long signal, the indicator marks:
Entry: At the candle close that invalidates the bearish FVG and creates the IFVG
Stop Loss: At the nearest swing low
Breakeven: Midpoint between entry and stop-loss
Take Profit 1: At the second nearest swing high
Take Profit 2: At the third nearest swing high
In this example, price sweeps a swing low, has a V Shape recovery, and forms a bullish IFVG:
🔹 Short Setup – A Rating
A short A-rated setup forms when all four core requirements of the IFVG Model occur without any additional confluences. Price must first sweep a Buyside Liquidity level. Immediately after the sweep, price must form a valid V shape recovery. Once the recovery completes, a bearish IFVG must form by invalidating a bullish Fair Value Gap with a candle close below it.
For a confirmed short signal, the indicator marks:
Entry: At the candle close that invalidates the bullish FVG and creates the IFVG
Stop Loss: At the nearest swing high
Breakeven: Midpoint between entry and stop-loss
Take Profit 1: At the second nearest swing low
Take Profit 2: At the third nearest swing low
In this example, price sweeps a swing high, has a V shape recovery, and forms a bearish IFVG:
🔹 Long Setup – A+ Rating
A long A+ setup forms when the four core requirements of the IFVG Model occur and exactly one additional confluence is present. Price must sweep a Sellside Liquidity level, form a valid V shape recovery, and create a bullish IFVG by invalidating a bearish FVG. One of the following must also occur: a bullish HTF FVG tap during the liquidity sweep, a multi-sellside liquidity sweep, or the IFVG confirmation forms inside a macro window.
For a confirmed long A+ signal, the indicator marks:
Entry: At the candle close that creates the bullish IFVG
Stop Loss: At the nearest swing low
Breakeven: Midpoint between entry and stop-loss
Take Profit 1: At the second nearest swing high
Take Profit 2: At the third nearest swing high
In this example, price sweeps the NY AM Session Low, taps a 30-minute HTF FVG during the sweep, has a V shape recovery, and forms a bullish IFVG:
🔹 Short Setup – A+ Rating
A short A+ setup forms when the four core requirements of the IFVG Model occur and exactly one additional confluence is present. Price must sweep a Buyside Liquidity level, form a valid V shape recovery, and create a bearish IFVG by invalidating a bullish FVG. One of the following must also occur: a bearish HTF FVG tap, a multi-buyside liquidity sweep, or the IFVG confirmation forms inside a macro window.
For a confirmed short A+ signal, the indicator marks:
Entry: At the candle close that creates the bearish IFVG
Stop Loss: At the nearest swing high
Breakeven: Midpoint between entry and stop-loss
Take Profit 1: At the second nearest swing low
Take Profit 2: At the third nearest swing low
In this example, price sweeps a swing high, has a V shape recovery, and forms a bearish IFVG inside of the 13:50-14:10 macro:
🔹 Long Setup – A++ Rating
A long A++ setup forms when the four core requirements of the IFVG Model occur and at least two additional confluences are present. Price must sweep a Sellside Liquidity level, form a valid V shape recovery, and create a bullish IFVG. The setup must also include any two or three of the following: a bullish HTF FVG tap, a multi-sellside liquidity sweep, or the IFVG confirmation forming inside a macro window.
For a confirmed long A++ signal, the indicator marks:
Entry: At the candle close that creates the bullish IFVG
Stop Loss: At the nearest swing low
Breakeven: Midpoint between entry and stop-loss
Take Profit 1: At the second nearest swing high
Take Profit 2: At the third nearest swing high
In this example, price sweeps two swing lows, has a V shape recovery, taps a bullish 30-minute HTF FVG during the liquidity sweep, and forms a bullish IFVG inside of the 10:50-11:10 macro:
🔹 Short Setup – A++ Rating
A short A++ setup forms when the four core requirements of the IFVG Model occur and at least two additional confluences are present. Price must sweep a Buyside Liquidity level, form a valid V shape recovery, and create a bearish IFVG. The setup must also include any two or three of the following: a bearish HTF FVG tap, a multi-buyside liquidity sweep, or the IFVG confirmation forming inside a macro window.
For a confirmed short A++ signal, the indicator marks:
Entry: At the candle close that creates the bearish IFVG
Stop Loss: At the nearest swing high
Breakeven: Midpoint between entry and stop-loss
Take Profit 1: At the second nearest swing low
Take Profit 2: At the third nearest swing low
In this example, price sweeps a swing high, has a V shape recovery, taps a bearish 30-minute HTF FVG during the liquidity sweep, and forms a bearish IFVG inside of the 09:50-10:10 macro:
🔹Signal Settings
◇ Liquidity Levels Used:
Users can select which type of liquidity levels the indicator uses for identifying liquidity sweeps:
Swing Points: Only uses Swing Highs/Lows
Session Highs/Lows: Only uses Session Highs/Lows
Both: Uses both Swing Highs/Lows and Session Highs/Lows
◇ Bias:
This setting determines which signal directions are allowed.
Manual Bias: Users can manually choose the directional bias, picking between Bullish, Bearish, or Both.
Automatic Bias: The indicator automatically determines a directional bias based on the criteria mentioned in the previous Bias section.
◇ IFVG Sensitivity:
This setting determines the minimum gap size required for an FVG to qualify as an Inversion FVG.
Higher values: only larger FVGs become IFVGs
Lower values: smaller gaps are allowed
◇ Use First Presented IFVG:
This setting determines whether the indicator limits signals to only the first IFVG created within the manipulation leg.
What Is the First Presented IFVG?
It is the earliest FVG formed inside the displacement that causes the liquidity sweep.
For a bearish manipulation leg (price moving downward into the sweep), the first presented IFVG is the first FVG created at the start of that downward move:
For a bullish manipulation leg (price moving upward into the sweep), the first presented IFVG is the first FVG created at the start of that upward move:
When this setting is enabled, the indicator will only confirm signals when the IFVG used is derived from this first presented FVG. IFVGs that form later in the manipulation leg are not used for signal generation.
◇ Only Take Trades:
This setting allows users to restrict signals to a defined time window.
If a complete setup occurs inside the time window, it is allowed and plotted
If it occurs outside the window, the signal will not appear
For example, if you only wanted to see long/short signals between 9:30 AM and 12:00 PM, you would enable this setting and set the time window from 09:30 - 12:00.
◇ Minimum R:R
This setting allows users to require a minimum risk-to-reward ratio before a signal is confirmed and plotted on the chart. The risk-to-reward ratio is calculated using the distance from the Entry to the Stop-Loss (risk) and the distance from the Entry to TP2 (reward). The indicator compares these distances and determines whether the setup meets or exceeds the minimum R:R value selected by the user.
If the calculated R:R is equal to or greater than the chosen threshold, the signal will be displayed.
If the calculated R:R is lower than the threshold, the signal will not appear on the chart.
🔹 Signal Rating Minimum
Users can restrict which signal ratings appear:
A: shows all signals
A+: shows only A+ and A++
A++: shows only A++ setups
🔹 Signal Styling and Customization
The indicator provides full control over how signal labels and levels appear on your chart. Users can customize long signals, short signals, all plotted lines, and the visibility of every individual element.
◇ Long Signal Styling
Users can customize:
Long Signal Label Color
Long Signal Text Color
Long Signal Label Size
◇ Short Signal Styling
Users can customize:
Short Signal Label Color
Short Signal Text Color
Short Signal Label Size
◇ Entry, Stop Loss, Breakeven, and Take Profit Lines
Each line type can be enabled or disabled individually:
Entry Line
Stop Loss Line
Breakeven Line
Take Profit 1 & 2 Lines
Users can also set custom colors for each line so every level is easy to track during live price movement.
◇ Show Price Labels
Price labels can be toggled on or off individually for each level. Users can choose whether to show or hide the price for:
Entry
Stop loss
Breakeven
Take Profit 1 & 2
NEW DAY OPENING GAP:
The New Day Opening Gap (NDOG) highlights the price difference between the previous day’s closing candle and the first candle of the new trading day. The indicator tracks this gap automatically each day and makes it available as optional context for users.
🔹 What Is the New Day Opening Gap?
A New Day Opening Gap forms when the trading day opens at a price different from the previous day’s final closing price.
If the new day opens above the prior day’s close → Bullish NDOG
If the new day opens below the prior day’s close → Bearish NDOG
This gap acts as a short-term draw on liquidity because the market may revisit the gap to rebalance price delivery. While the NDOG is not a required component for IFVG signals.
🔹 How the Indicator Uses the New Day Opening Gap
When enabled, the indicator plots the gap as a rectangular zone spanning from the previous day’s close to the new day’s open. The zone remains active until it is fully filled by price or until the next day’s opening gap forms. Once price trades through the entire gap, or once a new NDOG replaces it the following day, the zone becomes inactive and is removed from the chart. The indicator does not use the NDOG for signal generation. It is strictly a visual tool that helps traders identify areas where price may retrace or seek liquidity during the session.
🔹 Customization Options
Users have full control over how the New Day Opening Gap displays on the chart:
Show New Day Opening Gap: Toggle the NDOG zone on or off
Bullish NDOG Color: Customize the fill color for gaps formed above the prior close
Bearish NDOG Color: Customize the fill color for gaps formed below the prior close
NEW WEEK OPENING GAP:
The New Week Opening Gap (NWOG) highlights the price difference between the previous week’s final closing candle and the first candle of the new trading week. The indicator tracks this gap automatically each week and provides it as optional context for users.
🔹 What Is the New Week Opening Gap?
A New Week Opening Gap forms when the new trading week opens at a price different from the previous week’s closing price.
If the new week opens above the prior week’s close → Bullish NWOG
If the new week opens below the prior week’s close → Bearish NWOG
This gap often serves as a medium-term draw on liquidity because price may return to rebalance the weekly displacement. The NWOG is not a required component for IFVG signals.
🔹 How the Indicator Uses the New Week Opening Gap
When enabled, the indicator plots the gap as a rectangular zone spanning from the previous week’s close to the new week’s open. The zone remains active until it is fully filled by price or until the next week’s opening gap forms. Once price trades through the entire gap, or once a new NWOG replaces it the following week, the zone becomes inactive and is removed from the chart. The indicator does not use the NWOG for signal generation. It is purely a visual reference to help traders identify areas where price may rebalance or seek liquidity during the week.
🔹 Customization Options
Users have full control over how the New Week Opening Gap displays on the chart:
Show New Week Opening Gap: Toggle the NWOG zone on or off
Bullish NWOG Color: Set the fill color for gaps formed above the prior weekly close
Bearish NWOG Color: Set the fill color for gaps formed below the prior weekly close
SMT DIVERGENCES:
The indicator automatically marks SMT Divergences that occur between the current selected chart ticker and a second user-selected ticker.
A SMT Divergence forms when the prices of the currently selected chart ticker and the user-selected ticker don’t follow each other. For example, if the current chart’s ticker symbol is SEED_ALEXDRAYM_SHORTINTEREST2:NQ and the user-selected ticker is $ES. If SEED_ALEXDRAYM_SHORTINTEREST2:NQ does not sweep the low of the NY AM Session, but NYSE:ES sweeps that same exact session’s low during the same candle, then a SMT Divergence is detected.
In the images below, SEED_ALEXDRAYM_SHORTINTEREST2:NQ and NYSE:ES form a low at 12:20 AM on November 12th. At 12:35 AM, the 12:20 AM low is taken out on $NQ. However, on NYSE:ES , price failed to take out this exact low at 12:35 AM. Thus, an SMT Divergence is detected, and a line is drawn between the two lows on $NQ.
NYSE:ES Chart:
SEED_ALEXDRAYM_SHORTINTEREST2:NQ Chart:
🔹 SMT Divergence Settings
The indicator includes settings that allow users to control how SMT Divergences are detected and displayed.
◇ Length
Length controls how sensitive the pivot detection is when finding highs and lows for SMT.
Lower Length: confirms swings with fewer bars, so more swings qualify.
Higher Length: requires more bars to confirm a swing, so fewer swings qualify.
◇ Divergence Length
The Divergence Length setting defines how many bars apart the two swing points may be for them to count as part of the same SMT Divergence.
Higher Values: The two instruments can form their swing highs or lows farther apart in time. As long as both swings occur within this wider bar window, the indicator compares them for divergence.
Lower Values: The two swing points must occur very close to each other.
◇ Show Last
This setting limits how many recent SMT Divergences are displayed on the chart. For example, setting Show Last to 1 will only show the most recent SMT Divergence, while higher values allow more historical SMT Divergences to remain visible on the chart.
◇ Divergence Ticker
Users can change the ticker used for detections. Since SMT Divergences occur by comparing two tickers, the inputted ticker within the settings will always be compared to the current selected ticker on your chart.
DASHBOARD:
The dashboard provides a live summary of all major components of the Inversion Fair Value Gap Model. It updates every candle and displays the current state of each requirement used in the setup logic.
🔹 Real-Time Model Components
The state of each component is displayed with the following:
✔️ = condition is satisfied
❌ = condition is not satisfied
🐂 / 🐻 = current directional bias (bullish or bearish)
The dashboard actively tracks the following:
◇ Bias (🐂 Bullish, 🐻 Bearish, or Both)
Shows the current bias with a bull or bear emoji. If using automatic bias, the dashboard updates as soon as the session logic determines a direction.
◇ Liquidity Sweep
Displays ✔️ once a valid BSL Sweep (for shorts) or SSL Sweep (for longs) is detected.
Shows ❌ when no sweep is present.
◇ V Shape Recovery
Displays ✔️ when a confirmed V shape recovery forms after the sweep.
Shows ❌ until a valid V shape appears.
◇ Inversion Fair Value Gap (IFVG)
Shows ✔️ once a bullish or bearish IFVG forms in the correct direction.
Shows ❌ when no IFVG has yet confirmed.
◇ Higher-Timeframe FVG Interaction
Displays ✔️ when price is currently inside any enabled HTF FVG or taps a HTF FVG during a liquidity sweep.
Displays ❌ when price is not inside a HTF imbalance.
◇ Clear Opposite Draw on Liquidity (DOL)
Shows ✔️ when a clear opposite-side draw is present in the model logic.
Shows ❌ if no clear opposite draw is detected.
◇ SMT Divergence
Shows ✔️ for 20 candles immediately after an SMT Divergence forms.
After 20 candles, it returns to ❌ unless a new SMT Divergence is detected.
🔹 Signal Information Display
When a valid long or short signal appears, the dashboard expands to show the full details of the setup, including:
Signal Rating
Entry Price
Stop-Loss Price
Breakeven Price
Take Profit 1 Price
Take Profit 2 Price
🔹 Trade Statistics Module
Users can enable a built-in statistics panel to view historical performance of signals across all ratings. The trade stats include:
A Signal Win Rate
A+ Signal Win Rate
A++ Signal Win Rate
Long Signal Win Rate
Short Signal Win Rate
Total Number of Trades Used in the Calculations
A trade is counted as a win if price reaches breakeven before stop-loss. A trade is counted as a loss if price hits stop-loss before breakeven.
🔹 Dashboard Customization
The dashboard includes several options to control its appearance and position:
Show Dashboard: Toggle the entire dashboard on or off
Dashboard Size: Choose the size of the dashboard
Dashboard Position: Choose the location of the dashboard on the chart
Trade Stats Text Color: Customize the color of the 2nd column outputs under the Trade Stats section in the dashboard
◇ Component Toggles
Users can enable or disable the display of any model component based on preference. Each of these items can be shown or hidden independently:
Setup Rating
Entry
Stop-Loss
Breakeven
Take Profit 1
Take Profit 2
Bias
Liquidity Sweep
Higher-Timeframe FVG Interaction
V Shape Recovery
Inversion FVG
Clear Opposite Draw on Liquidity
Trade Stats
These toggles only affect visual display. Disabling any of them does not affect the underlying indicator’s logic.
ALERTS:
The Inversion Fair Value Gap Model includes full alert functionality using AnyAlert(), allowing users to receive notifications in real time for all major model components and signal events.
Users can enable or disable each alert type in the “Alerts” section of the settings. After selecting which alerts they want active, they can create a single TradingView alert using the AnyAlert() condition. This will automatically trigger alerts for all enabled events as soon as they occur on the chart.
Available Alerts:
Long Signal
Short Signal
Breakeven Hit (BE)
Take Profit 1 Hit (TP1)
Take Profit 2 Hit (TP2)
Stop-Loss Hit (SL)
Liquidity Sweep Detected
SMT Divergence Detected
How to Receive Alerts:
Open the TradingView alert creation window.
Select the IFVG Model indicator as the alert condition.
Choose AnyAlert() from the condition dropdown.
Create the alert.
IMPORTANT NOTES:
TradingView has limitations when running features on multiple timeframes such as the HTF FVGs, which can result in the following restriction:
Computation Error:
The computation of using MTF features is very intensive on TradingView. This can sometimes cause calculation timeouts. When this occurs, simply force the recalculation by modifying one indicator’s settings or by removing the indicator and adding it to your chart again.
UNIQUENESS:
This indicator is unique because it organizes every part of the Inversion Fair Value Gap Model into one structured, rules based system. It detects liquidity sweeps, confirms V shape recoveries, identifies valid IFVGs, checks higher timeframe FVG taps, reads macro timing, and applies a session based directional bias. All of these components are evaluated in a fixed sequence so users always know exactly why a signal appears. Every part of the logic is customizable, including which liquidity types are used, which IFVGs qualify for signals, which time windows allow trades, the minimum risk to reward for a setup, and all visual elements on the chart. The tool also includes optional SMT Divergence detection, daily and weekly opening gaps, a live dashboard that shows the state of each model requirement, and optional signal performance statistics.

Chronos Reversal Labs - SPChronos Reversal Labs - Shadow Portfolio
Chronos Reversal Labs - Shadow Portfolio: combines reinforcement learning optimization with adaptive confluence detection through a shadow portfolio system. Unlike traditional indicator mashups that force traders to manually interpret conflicting signals, this system deploys 4 multi-armed bandit algorithms to automatically discover which of 5 specialized confluence strategies performs best in current market conditions, then validates those discoveries through parallel shadow portfolios that track virtual P&L for each strategy independently.
Core Innovation: Rather than relying on static indicator combinations, this system implements Thompson Sampling (Bayesian multi-armed bandits), contextual bandits (regime-specific learning), advanced chop zone detection (geometric pattern analysis), and historical pre-training to build a self-improving confluence detection engine. The shadow portfolio system runs 5 parallel virtual trading accounts—one per strategy—allowing the system to learn which confluence approach works best through actual position tracking with realistic exits.
Target Users: Intermediate to advanced traders seeking systematic reversal signals with mathematical rigor. Suitable for swing trading and day trading across stocks, forex, crypto, and futures on liquid instruments. Requires understanding of basic technical analysis and willingness to allow 50-100 bars for initial learning.
Why These Components Are Combined
The Fundamental Problem
No single confluence method works consistently across all market regimes. Kernel-based methods (entropy, DFA) excel during predictable phases but fail in chaos. Structure-based methods (harmonics, BOS) work during clear swings but fail in ranging conditions. Technical methods (RSI, MACD, divergence) provide reliable signals in trends but generate false signals during consolidation.
Traditional solutions force traders to either manually switch between methods (slow, error-prone) or interpret all signals simultaneously (cognitive overload). Both fail because they assume the trader knows which regime the market is in and which method works best.
The Solution: Meta-Learning Through Reinforcement Learning
This system solves the problem through automated strategy selection : Deploy 5 specialized confluence strategies designed for different market conditions, track their real-world performance through shadow portfolios, then use multi-armed bandit algorithms to automatically select the optimal strategy for the next trade.
Why Shadow Portfolios? Traditional bandit implementations use abstract "rewards." Shadow portfolios provide realistic performance measurement : Each strategy gets a virtual trading account with actual position tracking, stop-loss management, take-profit targets, and maximum holding periods. This creates risk-adjusted learning where strategies are evaluated on P&L, win rate, and drawdown—not arbitrary scores.
The Five Confluence Strategies
The system deploys 5 orthogonal strategies with different weighting schemes optimized for specific market conditions:
Strategy 1: Kernel-Dominant (Entropy/DFA focused, optimal in predictable markets)
Shannon Entropy weight × 2.5, DFA weight × 2.5
Detects low-entropy predictable patterns and DFA persistence/mean-reversion signals
Failure mode: High-entropy chaos (hedged by Technical-Dominant)
Strategy 2: Structure-Dominant (Harmonic/BOS focused, optimal in clear swing structures)
Harmonics weight × 2.5, Liquidity (S/R) weight × 2.0
Uses swing detection, break-of-structure, and support/resistance clustering
Failure mode: Range-bound markets (hedged by Balanced)
Strategy 3: Technical-Dominant (RSI/MACD/Divergence focused, optimal in established trends)
RSI weight × 2.0, MACD weight × 2.0, Trend weight × 2.0
Zero-lag RSI suite with 4 calculation methods, MACD analysis, divergence detection
Failure mode: Choppy/ranging markets (hedged by chop filter)
Strategy 4: Balanced (Equal weighting, optimal in unknown/transitional regimes)
All components weighted 1.2×
Baseline performance during regime uncertainty
Strategy 5: Regime-Adaptive (Dynamic weighting by detected market state)
Chop zones: Kernel × 2.0, Technical × 0.3
Bull/Bear trends: Trend × 1.5, DFA × 2.0
Ranging: Mean reversion × 1.5
Adapts explicitly to detected regime
Multi-Armed Bandit System: 4 Core Algorithms
What Is a Multi-Armed Bandit Problem?
Formal Definition: K arms (strategies), each with unknown reward distribution. Goal: Maximize cumulative reward while learning which arms are best. Challenge: Balance exploration (trying uncertain strategies) vs. exploitation (using known-best strategy).
Trading Application: Each confluence strategy is an "arm." After each trade, receive reward (P&L percentage). Bandits decide which strategy to trust for next signal.
The 4 Implemented Algorithms
1. Thompson Sampling (DEFAULT)
Category: Bayesian approach with probability distributions
How It Works: Model each strategy as Beta(α, β) where α = wins, β = losses. Sample from distributions, select highest sample.
Properties: Optimal regret O(K log T), automatic exploration-exploitation balance
When To Use: Best all-around choice, adaptive markets, long-term optimization
2. UCB1 (Upper Confidence Bound)
Category: Frequentist approach with confidence intervals
Formula: UCB_i = reward_mean_i + sqrt(2 × ln(total_pulls) / pulls_i)
Properties: Deterministic, interpretable, same optimal regret as Thompson
When To Use: Prefer deterministic behavior, stable markets
3. Epsilon-Greedy
Category: Simple baseline with random exploration
How It Works: With probability ε (0.15): random strategy. Else: best average reward.
Properties: Simple, fast initial learning
When To Use: Baseline comparison, short-term testing
4. Contextual Bandit
Category: Context-aware Thompson Sampling
Enhancement: Maintains separate alpha/beta for Bull/Bear/Ranging regimes
Learning: "Strategy 2: 60% win rate in Bull, 40% in Bear"
When To Use: After 100+ bars, clear regime shifts
Shadow Portfolio System
Why Shadow Portfolios?
Traditional bandits use abstract scores. Shadow portfolios provide realistic performance measurement through actual position simulation.
How It Works
Position Opening:
When strategy generates validated signal:
Opens virtual position for selected strategy
Records: entry price, direction, entry bar, RSI method
Optional: Open positions for ALL strategies simultaneously (faster learning)
Position Management (Every Bar):
Current P&L: pnl_pct = (close - entry) / entry × direction × 100
Exit if: pnl_pct <= -2.0% (stop-loss) OR pnl_pct >= +4.0% (take-profit) OR held ≥ 100 bars (time)
Position Closing:
Calculate final P&L percentage
Update strategy equity, track win rate, gross profit/loss, max drawdown
Calculate risk-adjusted reward:
text
base_reward = pnl_pct / 10.0
win_rate_bonus = (win_rate - 0.5) × 0.3
drawdown_penalty = -max_drawdown × 0.05
total_reward = sigmoid(base + bonus + penalty)
Update bandit algorithms with reward
Update RSI method bandit
Statistics Tracked Per Strategy:
Equity curve (starts at $10,000)
Win rate percentage
Max drawdown
Gross profit/loss
Current open position
This creates closed-loop learning : Strategies compete → Best performers selected → Bandits learn quality → System adapts automatically.
Historical Pre-Training System
The Problem with Live-Only Learning
Standard bandits start with zero knowledge and need 50-100 signals to stabilize. For weekly timeframe traders, this could take years.
The Solution: Historical Training
During Chart Load: System processes last 300-1000 bars (configurable) in "training mode":
Detect signals using Balanced strategy (consistent baseline)
For each signal, open virtual training positions for all 5 strategies
Track positions through historical bars using same exit logic (SL/TP/time)
Update bandit algorithms with historical outcomes
CRITICAL TRANSPARENCY: Signal detection does NOT look ahead—signals use only data available at entry bar. Exit tracking DOES look ahead (uses future bars for SL/TP), which is acceptable because:
✅ Entry decisions remain valid (no forward bias)
✅ Learning phase only (not affecting shown signals)
✅ Real-time mirrors training (identical exit logic)
Training Completion: Once chart reaches current bar, system transitions to live mode. Dashboard displays training vs. live statistics for comparison.
Benefit: System begins live trading with 100-500 historical trades worth of learning, enabling immediate intelligent strategy selection.
Advanced Chop Zone Detection Engine
The Innovation: Multi-Layer Geometric Chop Analysis
Traditional chop filters use simple volatility metrics (ATR thresholds) that can't distinguish between trending volatility (good for signals) and choppy volatility (bad for signals). This system implements three-layer geometric pattern analysis to precisely identify consolidation zones where reversal signals fail.
Layer 1: Micro-Structure Chop Detection
Method: Analyzes micro pivot points (5-bar left, 2-bar right) to detect geometric compression patterns.
Slope Analysis:
Calculates slope of pivot high trendline and pivot low trendline
Compression ratio: compression = slope_high - slope_low
Pattern Classification:
Converging slopes (compression < -0.05) → "Rising Wedge" or "Falling Wedge"
Flat slopes (|slope| < 0.05) → "Rectangle"
Parallel slopes (|compression| < 0.1) → "Channel"
Expanding slopes → "Expanding Range"
Chop Scoring:
Rectangle pattern: +15 points (highest chop)
Low average slope (<0.05): +15 points
Wedge patterns: +12 points
Flat structures: +10 points
Why This Works: Geometric patterns reveal market indecision. Rectangles and wedges create false breakouts that trap technical traders. By quantifying geometric compression, system detects these zones before signals fire.
Layer 2: Macro-Structure Chop Detection
Method: Tracks major swing highs/lows using ATR-based deviation threshold (default 2.0× ATR), projects channel boundaries forward.
Channel Position Calculation:
proj_high = last_swing_high + (swing_high_slope × bars_since)
proj_low = last_swing_low + (swing_low_slope × bars_since)
channel_width = proj_high - proj_low
position = (close - proj_low) / channel_width
Dead Zone Detection:
Middle 50% of channel (position 0.25-0.75) = low-conviction zone
Score increases as price approaches center (0.5)
Chop Scoring:
Price in dead zone: +15 points (scaled by centrality)
Narrow channel width (<3× ATR): +15 points
Channel width 3-5× ATR: +10 points
Why This Works: Price in middle of range has equal probability of moving either direction. Institutional traders avoid mid-range entries. By detecting "dead zones," system avoids low-probability setups.
Layer 3: Volume Chop Scoring
Method: Low volume indicates weak conviction—precursor to ranging behavior.
Scoring:
Volume < 0.5× average: +20 points
Volume 0.5-0.8× average: +15 points
Volume 0.8-1.0× average: +10 points
Overall Chop Intensity & Signal Filtering
Total Chop Calculation:
chop_intensity = micro_score + macro_score + (volume_score × volume_weight)
is_chop = chop_intensity >= 40
Signal Filtering (Three-Tier Approach):
1. Signal Blocking (Intensity > 70):
Extreme chop detected (e.g., tight rectangle + dead zone + low volume)
ALL signals blocked regardless of confluence
Chart displays red/orange background shading
2. Threshold Adjustment (Intensity 40-70):
Moderate chop detected
Confluence threshold increased: threshold += (chop_intensity / 50)
Only highest-quality signals pass
3. Strategy Weight Adjustment:
During Chop: Kernel-Dominant weight × 2.0 (entropy detects breakout precursors), Technical-Dominant weight × 0.3 (reduces false signals)
After Chop Exit: Weights revert to normal
Why This Three-Tier Approach Is Original: Most chop filters simply block all signals (loses breakout entries). This system adapts strategy selection during chop—allowing Kernel-Dominant (which excels at detecting low-entropy breakout precursors) to operate while suppressing Technical-Dominant (which generates false signals in consolidation). Result: System remains functional across full market regime spectrum.
Zero-Lag Filter Suite with Dynamic Volatility Scaling
Zero-Lag ADX (Trend Regime Detection)
Implementation: Applies ZLEMA to ADX components:
lag = (length - 1) / 2
zl_source = source + (source - source ) × strength
Dynamic Volatility Scaling (DVS):
Calculates volatility ratio: current_ATR / ATR_100period_avg
Adjusts ADX length dynamically: High vol → shorter length (faster), Low vol → longer length (smoother)
Regime Classification:
ADX > 25 with +DI > -DI = Bull Trend
ADX > 25 with -DI > +DI = Bear Trend
ADX < 25 = Ranging
Zero-Lag RSI Suite (4 Methods with Bandit Selection)
Method 1: Standard RSI - Traditional Wilder's RSI
Method 2: Ehlers Zero-Lag RSI
ema1 = ema(close, length)
ema2 = ema(ema1, length)
zl_close = close + (ema1 - ema2)
Method 3: ZLEMA RSI
lag = (length - 1) / 2
zl_close = close + (close - close )
Method 4: Kalman-Filtered RSI - Adaptive smoothing with process/measurement noise
RSI Method Bandit: Separate 4-arm bandit learns which calculation method produces best results. Updates independently after each trade.
Kalman Adaptive Filters
Fast Kalman: Low process noise → Responsive to genuine moves
Slow Kalman: Higher measurement noise → Filters noise
Application: Crossover logic for trend detection, acceleration analysis for momentum inflection
What Makes This Original
Innovation 1: Shadow Portfolio Validation
First TradingView script to implement parallel virtual portfolios for multi-armed bandit reward calculation. Instead of abstract scoring metrics, each strategy's performance is measured through realistic position tracking with stop-loss, take-profit, time-based exits, and risk-adjusted reward functions (P&L + win rate + drawdown). This provides orders-of-magnitude better reward signal quality for bandit learning than traditional score-based approaches.
Innovation 2: Three-Layer Geometric Chop Detection
Novel multi-scale geometric pattern analysis combining: (1) Micro-structure slope analysis with pattern classification (wedges, rectangles, channels), (2) Macro-structure channel projection with dead zone detection, (3) Volume confirmation. Unlike simple volatility filters, this system adapts strategy weights during chop —boosting Kernel-Dominant (breakout detection) while suppressing Technical-Dominant (false signal reduction)—allowing operation across full market regime spectrum without blind signal blocking.
Innovation 3: Historical Pre-Training System
Implements two-phase learning : Training phase (processes 300-1000 historical bars on chart load with proper state isolation) followed by live phase (real-time learning). Training positions tracked separately from live positions. System begins live trading with 100-500 trades worth of learned experience. Dashboard displays training vs. live performance for transparency.
Innovation 4: Contextual Multi-Armed Bandits with Regime-Specific Learning
Beyond standard bandits (global strategy quality), implements regime-specific alpha/beta parameters for Bull/Bear/Ranging contexts. System learns: "Strategy 2: 60% win rate in ranging markets, 45% in bull trends." Uses current regime's learned parameters for strategy selection, enabling regime-aware optimization.
Innovation 5: RSI Method Meta-Learning
Deploys 4 different RSI calculation methods (Standard, Ehlers ZL, ZLEMA, Kalman) with separate 4-arm bandit that learns which calculation works best. Updates RSI method bandit independently based on trade outcomes, allowing automatic adaptation to instrument characteristics.
Innovation 6: Dynamic Volatility Scaling (DVS)
Adjusts ALL lookback periods based on current ATR ratio vs. 100-period average. High volatility → shorter lengths (faster response). Low volatility → longer lengths (smoother signals). Applied system-wide to entropy, DFA, RSI, ADX, and Kalman filters for adaptive responsiveness.
How to Use: Practical Guide
Initial Setup (5 Minutes)
Theory Mode: Start with "BALANCED" (APEX for aggressive, CONSERVATIVE for defensive)
Enable RL: Toggle "Enable RL Auto-Optimization" to TRUE, select "Thompson Sampling"
Enable Confluence Modules: Divergence, Volume Analysis, Liquidity Mapping, RSI OB/OS, Trend Analysis, MACD (all recommended)
Enable Chop Filter: Toggle "Enable Chop Filter" to TRUE, sensitivity 1.0 (default)
Historical Training: Enable "Enable Historical Pre-Training", set 300-500 bars
Dashboard: Enable "Show Dashboard", position Top Right, size Large
Learning Phase (First 50-100 Bars)
Monitor Thompson Sampling Section:
Alpha/beta values should diverge from initial 1.0 after 20-30 trades
Expected win% should stabilize around 55-60% (excellent), >50% (acceptable)
"Pulls" column should show balanced exploration (not 100% one strategy)
Monitor Shadow Portfolios:
Equity curves should diverge (different strategies performing differently)
Win rate > 55% is strong
Max drawdown < 15% is healthy
Monitor Training vs Live (if enabled):
Delta difference < 10% indicates good generalization
Large negative delta suggests overfitting
Large positive delta suggests system adapting well
Optimization:
Too few signals: Lower "Base Confluence Threshold" to 2.5-3.0
Too many signals: Raise threshold to 4.0-4.5
One strategy dominates (>80%): Increase "Exploration Rate" to 0.20-0.25
Excessive chop blocking: Lower "Chop Sensitivity" to 0.7-0.8
Signal Interpretation
Dashboard Indicators:
"WAITING FOR SIGNAL": No confluence
"LONG ACTIVE ": Validated long entry
"SHORT ACTIVE ": Validated short entry
Chart Visuals:
Triangle markers: Entry signal (green = long, red = short)
Orange/red background: Chop zone
Lines: Support/resistance if enabled
Position Management
Entry: Enter on triangle marker, confirm direction matches dashboard, check confidence >60%
Stop-Loss: Entry ± 1.5× ATR or at structural swing point
Take-Profit:
TP1: Entry + 1.5R (take 50%, move SL to breakeven)
TP2: Entry + 3.0R (runner) or trail
Position Sizing:
Risk per trade = 1-2% of capital
Position size = (Account × Risk%) / (Entry - SL)
Recommended Settings by Instrument
Stocks (Large Cap): Balanced mode, Threshold 3.5, Thompson Sampling, Chop 1.0, 15min-1H, Training 300-500 bars
Forex Majors: Conservative-Balanced mode, Threshold 3.5-4.0, Thompson Sampling, Chop 0.8-1.0, 5min-30min, Training 400-600 bars
Cryptocurrency: Balanced-APEX mode, Threshold 3.0-3.5, Thompson Sampling, Chop 1.2-1.5, 15min-4H, Training 300-500 bars
Futures: Balanced mode, Threshold 3.5, UCB1 or Thompson, Chop 1.0, 5min-30min, Training 400-600 bars
Technical Approximations & Limitations
1. Thompson Sampling: Pseudo-Random Beta Distribution
Standard: Cryptographic RNG with true beta sampling
This Implementation: Box-Muller transform using market data as entropy source
Impact: Not cryptographically random but maintains exploration-exploitation balance. Sufficient for strategy selection.
2. Shadow Portfolio: Simplified Execution Model
Standard: Order book simulation with slippage, partial fills
This Implementation: Perfect fills at close price, no fees modeled
Impact: Real-world performance ~0.1-0.3% worse per trade due to execution costs.
3. Historical Training: Forward-Looking for Exits Only
Entry signals: Use only past data (causal, no bias)
Exit tracking: Uses future bars to determine SL/TP (forward-looking)
Impact: Acceptable because: (1) Entry logic remains valid, (2) Live trading mirrors training, (3) Improves learning quality. Training win rates reflect 8-bar evaluation window—live performance may differ if positions held longer.
4. Shannon Entropy & DFA: Simplified Calculations
Impact: 10-15% precision loss vs. academic implementations. Still captures predictability and persistence signals effectively.
General Limitations
No Predictive Guarantee: Past performance ≠ future results
Learning Period Required: Minimum 50-100 bars for stable statistics
Overfitting Risk: May not generalize to unprecedented conditions
Single-Instrument: No multi-asset correlation or sector context
Execution Assumptions: Degrades in illiquid markets (<100k volume), major news events, flash crashes
Risk Warnings & Disclaimers
No Guarantee of Profit: All trading involves substantial risk of loss. This indicator is a tool, not a guaranteed profit system.
System Failures: Software bugs possible despite testing. Use appropriate position sizing.
Market Regime Changes: Performance may degrade during extreme volatility (VIX >40), low liquidity periods, or fundamental regime shifts.
Broker-Specific Issues: Real-world execution includes slippage (0.1-0.5%), commissions, overnight financing costs, partial fills.
Forward-Looking Bias in Training: Historical training uses 8-bar forward window for exit evaluation. Dashboard "Training Win%" reflects this method. Real-time performance may differ.
Appropriate Use
This Indicator IS:
✅ Entry trigger system with confluence validation
✅ Risk management framework (automated SL/TP)
✅ Adaptive strategy selection engine
✅ Learning system that improves over time
This Indicator IS NOT:
❌ Complete trading strategy (requires position sizing, portfolio management)
❌ Replacement for due diligence
❌ Guaranteed profit generator
❌ Suitable for complete beginners
Recommended Complementary Analysis: Market context, volume profile, fundamental catalysts, higher timeframe alignment, support/resistance from other sources.
Conclusion
Chronos Reversal Labs V2.0 - Elite Edition synthesizes research from multi-armed bandit theory (Thompson Sampling, UCB, contextual bandits), market microstructure (geometric chop detection, zero-lag filters), and machine learning (shadow portfolio validation, historical pre-training, RSI method meta-learning).
Unlike typical indicator mashups, this system implements mathematically rigorous bandit algorithms with realistic performance validation, three-layer chop detection with adaptive strategy weighting, regime-specific learning, and full transparency on approximations and limitations.
The system is designed for intermediate to advanced traders who understand that no indicator is perfect, but through proper machine learning and realistic validation, we can build systems that improve over time and adapt to changing markets without manual intervention.
Use responsibly. Understand the limitations. Risk disclosure applies. Past performance does not guarantee future results.
Taking you to school. — Dskyz, Trade with insight. Trade with anticipation.

Livermore's Pyramiding Trading - 3Commas [SwissAlgo]
📊 J. LIVERMORE'S PYRAMIDING TRADING - 3Commas Integrated
A Trading Approach Inspired by Jesse Livermore's Position Building Principles
━━━━━━━━━━━━━━━━━━━━━━━━━━━━━━━━━━━━━━━━━━━
DISCLAIMER
This indicator is an educational tool based on historical trading principles. Past performance is not indicative of future results. Trading involves substantial risk of loss. Only trade with capital you can afford to lose. You are responsible for all trading decisions.
━━━━━━━━━━━━━━━━━━━━━━━━━━━━━━━━━━━━━━━━━━━
📚 WHO WAS JESSE LIVERMORE?
Jesse Livermore (1877-1940) was one of the greatest traders in history.
His core insight: "Most traders do everything backward."
♦ "They deploy all capital at once" → Livermore entered with a small fraction of his capital (he started with a 'test position' to validate his trade idea and waited for market confirmation to deploy more, building positions in steps = "pyramiding")
♦ "They average down" (DCA) → Livermore added to trades showing good results only, and never to losing trades, as the trend kept aligning with his trade idea
♦ "They use arbitrary % stops" → Livermore exited when structure appeared broken (he trailed his stop loss to try to protect unrealized profit - if any)
♦ "They take profits too early or set arbitrary TP%" → Livermore let trades showing positive results run until proven wrong (trial take profit)
💬 "I always made money when I was sure I was right before I began. What beat me was not having enough brains to stick to my own game."
— Jesse Livermore
This indicator tries to translate his principles into a SYSTEMATIC FRAMEWORK :
BO = Base Order (first order, base of the pyramid)
PO = Pyramid Orders (additional layers of capital deployed as long as the 'tape' does not invalidate the trade idea)
♦ Test First (BO - 20%) - Small entry to test your idea. If wrong, lose small. If right, can consider pyramiding into strength.
♦ Build Position Size (PO1-3 - 80%) - Add only as trend unfolds favorably (the indicator uses specific Fibonacci levels to track milestones - 0.618, 1.0, 1.272 - and looks for strong confluence among price, volume, trend, momentum, break of resistance/support levels to suggest and trigger actions: entries, exit)
♦ Attempt to Protect Capital - Dynamic stops: the indicator trails the stop loss, to try to protect potential gains from previous steps (if any)
♦ Discipline - Trades fire only when ALL conditions align
━━━━━━━━━━━━━━━━━━━━━━━━━━━━━━━━━━━━━━━━━━━
🎯 INDICATOR FEATURES
You map 3 points on the chart → The indicator generates a systematic trading plan structure based on your wave analysis.
✓ Auto-detects trade direction: Uptrend wave (A➚B➘C) = Long signals | Downtrend wave (A➘B➚C) = Short signals
✓ Entry/exit prices: BO, PO1, PO2, PO3, and dynamic EXIT (trailing stop)
✓ Real-time condition monitoring: Live ✓/✗ checks for each order (price closes + volume + trend + pivot breaks + candle quality + sequence)
✓ Visual trade execution: Green labels mark entries (BO/PO1/PO2/PO3), red labels mark EXIT
✓ Optional 3Commas automation: JSON webhooks for hands-free execution via Signal Bots
⏰ Recommended Timeframes: 1H, 4H, Daily
(Lower timeframes like 15m/5m produce excessive noise and false signals)
💬 "Watch the market leaders, the stocks that have led the charge. That is where the action is and where the money is made."
— Jesse Livermore
━━━━━━━━━━━━━━━━━━━━━━━━━━━━━━━━━━━━━━━━━━━
⚙️ SETUP IN 3 STEPS
🟡 STEP 1: Map Your Wave (Points A → B → C)
Identify a completed wave pattern:
For LONGS:
♦ Point A = Swing low (wave start)
♦ Point B = Swing high (impulse end)
♦ Point C = Pullback low (retrace end - where next wave may begin)
For SHORTS:
♦ Point A = Swing high (wave start)
♦ Point B = Swing low (impulse end)
♦ Point C = Pullback high (retrace end - where next wave may begin)
How to set points:
Settings → Enter dates manually OR drag the vertical lines directly on the chart (easier - just click and drag the pre-mapped A/B/C lines)
Requirements (auto-validated by code):
✓ All dates must be in the past (Point C = completed retrace, not forming)
✓ Clear impulse A→B (minimum 5% move)
✓ Clear retrace B→C (minimum 3% pullback)
───────────────────────────────────────────
🟡 STEP 2: Set Budget & Allocation
Settings → "TRADE PARAMETERS"
♦ Total Budget: $10,000 (example - capital for THIS trade only, not your entire account)
♦ Allocation (must total 100%):
BO = 20% ($2,000) - test position
PO1 = 25% ($2,500) @ Fib 0.618
PO2 = 30% ($3,000) @ Fib 1.0
PO3 = 25% ($2,500) @ Fib 1.272
💬 "It was never my thinking that made big money for me. It was always my sitting. Men who can both be right and sit tight are uncommon."
— Jesse Livermore
───────────────────────────────────────────
🟡 STEP 3: Monitor Your Trade Plan Table
The table (top-right corner) has 4 sections that guide your execution:
BUDGET DEPLOYMENT
♦ Trigger prices for each order (BO auto-calculated at 0.5 Fib between B-C)
♦ Dollar amount per entry
♦ Fibonacci level assigned to each PO
ENTRY/EXIT CONDITIONS
Each column (BO, PO1, PO2, PO3) shows live status (✓ or ✗) for:
♦ Price: 2 consecutive closes (BO) | 3 consecutive closes (POs)
♦ Volume: OBV directional alignment OR volume spike above average
♦ Trend: Normal or Strong Bull/Bear (no entries in Uncertain trend)
♦ Pivot: Nearest resistance (longs) or support (shorts) broken
♦ Clean Candle: Momentum without reversal wicks <30% (POs only)
♦ Sequence: Prior order must have fired first (POs only - no skipping levels)
TRIGGERED?
Shows execution status for each order (✓ = fired, ✗ = waiting)
If using 3Commas: ✓ confirms JSON alert was sent to your bot for real execution
VALIDATIONS
✓ Green = All checks passed, setup is valid
⚠️ Yellow = Warning (e.g., budget doesn't equal 100%, deep retrace)
✗ Red = Error (e.g., dates in wrong order, invalid wave structure)
⚠️ Wait for ALL ✓✓✓✓✓ (or ✓✓✓✓✓✓) to align in a column before that order fires at bar close
💬 "The game of speculation is the most uniformly fascinating game in the world. But it is not a game for the stupid, the mentally lazy, the person of inferior emotional balance, or the get-rich-quick adventurer."
— Jesse Livermore
━━━━━━━━━━━━━━━━━━━━━━━━━━━━━━━━━━━━━━━━━━━
📊 CHART VISUALS - READING THE INDICATOR
Fibonacci Extension Lines
After mapping A-B-C, horizontal lines extend to the right:
♦ Solid green/red lines = Active PO entry levels (0.618, 1.0, 1.272)
♦ Dotted gray lines = Reference Fib levels used for exit tracking (2.0, 2.618, 3.0, etc.)
♦ Labels on right = Show level and price: "Fib 0.618 / $67,324 "
Entry/Exit Price Lines
♦ Thick green line (longs) / red line (shorts) = BO entry price with direction label
♦ Dashed red line = Current EXIT price (your trailing stop loss - appears after BO fires and moves as price extends)
Trade Execution Labels
Visual confirmation when orders fire on the chart:
♦ Green labels (below/above candles) = BO, PO1, PO2, PO3 entries executed
♦ Red label = EXIT triggered (position closed)
Trend Strength Indicator (EMA Line)
The thick colored line shows real-time trend status:
♦ Bright lime = Strong bullish trend
♦ Light green = Normal bullish trend
♦ Bright red = Strong bearish trend
♦ Light red = Normal bearish trend
♦ Gray = Uncertain/weak trend (no entries fire in this state)
Entries require at least Normal trend strength aligned with your trade direction.
💬 "I never argue with the tape. Getting sore at the market doesn't get you anywhere."
— Jesse Livermore
━━━━━━━━━━━━━━━━━━━━━━━━━━━━━━━━━━━━━━━━━━━
🔧 ENTRY LOGIC - TECHNICAL DETAILS
💬 "The big money was never made in the buying or the selling. The big money was made in the waiting."
— Jesse Livermore
───────────────────────────────────────────
🟢 BASE ORDER (BO) - TEST POSITION
BO Price Calculation
Auto-calculated at the 0.5 Fibonacci retracement between Point B and Point C
Formula: (Price B + Price C) / 2
Why this level?
♦ Midpoint between impulse end (B) and retrace end (C)
♦ Breakout above/below suggests retrace may be complete
♦ Designed to help position BO below all Fib extensions (to control sequence issues)
───────────────────────────────────────────
BO Entry Conditions - ALL 5 Must Align:
1️⃣ PRICE: 2 Consecutive Closes Beyond BO
♦ Longs: close > BO AND close > BO
♦ Shorts: close < BO AND close < BO
♦ Why: Designed to confirm breakout commitment and filter fakeouts
2️⃣ TREND: Normal OR Strong Trend Aligned
♦ Detection: 18-period EMA + ADX/DMI + higher timeframe slope
♦ States: Strong Bull/Bear (ADX>30), Normal Bull/Bear (price vs EMA), Uncertain
♦ Confirmation: Requires 3 consecutive bars in the same state (to reduce flip-flop)
♦ BO accepts: Normal OR Strong (you're testing early, basic alignment sufficient)
3️⃣ PIVOT: Nearest Resistance/Support Broken
♦ Storage: 60 most recent pivot highs/lows (dynamic lookback per timeframe)
♦ Longs: Nearest pivot HIGH above BO → must break with 2 closes
♦ Shorts: Nearest pivot LOW below BO → must break with 2 closes
♦ Price Discovery: If no pivot exists beyond BO = auto-pass
♦ Why: Aims to confirm momentum has overcome previous rejection zones
4️⃣ VOLUME: OBV Aligned OR Spike
♦ Directional OBV: OBV > 20-EMA (longs) OR OBV < 20-EMA (shorts)
♦ OR Volume Spike: Current volume > 20-period SMA
♦ Why: Checks for institutional participation signals
5️⃣ VALIDATIONS: Setup Valid (✅)
♦ Dates valid (A < B < C, all in past)
♦ Wave structure valid (min 5% impulse, min 3% retrace)
♦ Budget allocation = 100%
♦ Prices detected at all points
⚠️ BO fires once per bar close. Flag set permanently until trade resets.
───────────────────────────────────────────
🔺 PYRAMID ORDERS (PO1-3) - PYRAMIDING INTO STRENGTH
💬 "Never buy a stock because it has had a big decline from its previous high. The big money was never made in the stock market by buying on declines."
— Jesse Livermore
PO Price Calculation
Fixed Fibonacci extensions from Point C:
Formula: Price C ± (Impulse Range × Fib Level)
Where: Impulse Range = |Price B - Price A|
Default Levels:
♦ PO1 @ Fib 0.618 (Golden Ratio)
♦ PO2 @ Fib 1.000 (Full impulse repeat)
♦ PO3 @ Fib 1.272 (Fibonacci sequence extension)
───────────────────────────────────────────
PO Entry Conditions - ALL 6 Must Align (STRICTER):
1️⃣ PRICE: 3 Consecutive Closes Beyond PO
♦ Longs: close > PO AND close > PO AND close > PO
♦ Shorts: close < PO AND close < PO AND close < PO
♦ Why: Higher conviction needed when adding capital (3 vs 2 closes for BO)
2️⃣ TREND: Same as BO
Normal OR Strong trend must remain aligned with trade direction
3️⃣ PIVOT: Per-Level Pivot Break
♦ Each PO checks its OWN nearest pivot (not shared with BO)
♦ Same 2-close break requirement
♦ PO3 Exception: Price discovery allowed (no pivot required if already profitable)
4️⃣ VOLUME: Same as BO
Sustained confirmation required (not weakening)
5️⃣ CLEAN CANDLE: <30% Reversal Wick (NEW)
♦ Filter: Uses ATR(14) - candles < ATR auto-pass (consolidation noise)
♦ Longs: Upper wick < 30% of candle range (no rejection at top)
♦ Shorts: Lower wick < 30% of candle range (no rejection at bottom)
♦ Why: Don't pyramid into weakness/rejection - only add on clean momentum
♦ Not checked for BO: Test position tolerates some wick risk
6️⃣ SEQUENCE: Prior Order Fired
♦ PO1 requires: BO fired
♦ PO2 requires: PO1 fired
♦ PO3 requires: PO2 fired
♦ Why: No skipping levels - disciplined building only
───────────────────────────────────────────
⚙️ KEY DIFFERENCE:
BO (20% capital) = Lighter requirements, testing your idea early
POs (80% capital) = Stricter requirements, adding only to confirmed winners
♦ BO: 2 closes | POs: 3 closes
♦ BO: No candle check | POs: Clean candle required
♦ BO: Independent | POs: Sequential (must follow order)
♦ BO: No price discovery | PO3: Allows price discovery when profitable
💬 "Profits always take care of themselves, but losses never do. The speculator has to ensure himself against considerable losses by taking the first small loss."
— Jesse Livermore
━━━━━━━━━━━━━━━━━━━━━━━━━━━━━━━━━━━━━━━━━━━
🚪 EXIT LOGIC - TECHNICAL DETAILS
🔴 EXIT PHILOSOPHY
The indicator uses TWO INDEPENDENT EXIT TRIGGERS (whichever fires first):
1) Structural Breakdown
Price breaks through the EXIT level with confirmation
2) Trend Reversal
Trend flips against your position AND price breaks EXIT level
Why two methods?
♦ Structure = price-based protection (hard stop)
♦ Trend = momentum-based exit (early warning when market character changes)
♦ Combined: Exit either when proven wrong (structure) or when conditions no longer favor your direction (trend)
───────────────────────────────────────────
🔴 EXIT PRICE CALCULATION
The EXIT price (your stop loss) adjusts dynamically based on position size:
BEFORE PO3 Fires (Fixed Stops):
♦ BO only = Stop at Point C (small position, tight stop near entry)
♦ PO1 fired = Stop at Fib 0.5 (moved to breakeven zone)
♦ PO2 fired = Stop at Fib 0.786 (protecting partial profits)
AFTER PO3 Fires (Trailing Stops):
♦ Tracking: Monitors the highest Fib reached (longs) or the lowest Fib reached (shorts)
♦ Placement: EXIT moves 1-2 Fib levels below the highest (longs) or above the lowest (shorts)
♦ Example: Price reaches Fib 2.618 → EXIT trails up to Fib 2.0
♦ Purpose: Designed to protect accumulated profits while allowing room for normal pullbacks
💬 "It never was my thinking that made the big money for me. It was always my sitting. Men who can both be right and sit tight are uncommon."
— Jesse Livermore
───────────────────────────────────────────
🔴 EXIT CONDITIONS
Exit Speed (Based on Risk Exposure):
♦ Full position (PO3 fired) = 1 close required (fast exit - more capital at risk)
♦ Partial position (BO/PO1/PO2 only) = 2 closes required (confirmation - less urgency)
METHOD 1: Structural Breakdown
Price violates the EXIT level with clean momentum:
For Longs:
♦ Price closes BELOW EXIT level (1 or 2 closes depending on position size)
♦ Clean candle required (lower wick < 50% of range - no false breakdown)
For Shorts:
♦ Price closes ABOVE EXIT level (1 or 2 closes depending on position size)
♦ Clean candle required (upper wick < 50% of range - no false breakout)
Why clean candle check?
Designed to reduce exits on wicks/fakeouts. If there's a large reversal wick (>50%), it suggests buyers/sellers are defending the level - not a true breakdown.
METHOD 2: Trend Reversal
Market character shifts against your position:
For Longs:
♦ Trend shifts from Bull → Normal Bear OR Strong Bear
♦ AND price breaks below EXIT level (same close requirements)
For Shorts:
♦ Trend shifts from Bear → Normal Bull OR Strong Bull
♦ AND price breaks above EXIT level (same close requirements)
Why this matters?
♦ Proactive exit before structural stop is hit
♦ If the trend that confirmed your entries reverses, the setup is invalidated
♦ Livermore principle: Exit when market proves you wrong, don't wait for max pain
───────────────────────────────────────────
⚠️ EXIT BEHAVIOR
♦ Fires once per bar close (same as entries)
♦ Resets all tracking after exit (ready for fresh trade setup)
♦ Clears flags: boSignalFired, po1/po2/po3SignalFired, highestFib/lowestFib tracking
♦ If using 3Commas: Sends exit_long or exit_short JSON (market order closes 100% position)
💬 "I never argue with the tape. Getting sore at the market doesn't get you anywhere."
— Jesse Livermore
━━━━━━━━━━━━━━━━━━━━━━━━━━━━━━━━━━━━━━━━━━━
🤖 3COMMAS AUTOMATION (OPTIONAL)
💬 "There is the plain fool, who does the wrong thing at all times everywhere, but there is also the Wall Street fool, who thinks he must trade all the time."
— Jesse Livermore
Automation designed to help remove emotion and support disciplined execution.
───────────────────────────────────────────
⚡ QUICK SETUP IN 5 STEPS
STEP 1: Create Your Signal Bots
You need 2 SEPARATE BOTS (one for Longs, one for Shorts):
Go to 3Commas → Bots → Create Bot → Select "Signal Bot"
Basic Settings:
♦ Bot Name: "Livermore Long - " (example: "Livermore Long - BTCUSDT")
♦ Exchange: Your connected exchange
♦ Trading Pair: Must match TradingView chart exactly
♦ Strategy: Custom Signal
♦ Direction: LONG (for first bot) or SHORT (for second bot)
♦ Max Active Deals: 1
⚠️ CRITICAL SETTINGS:
Entry Orders:
♦ Toggle ON: "Entry Orders"
♦ Volume per Order: "Send in webhook, quote"
♦ Why: This lets the indicator control exact $ amounts per order (BO=$2K, PO1=$2.5K, etc.)
♦ If you skip this: Orders will use wrong sizes and break your allocation plan
Exit Orders:
♦ Toggle ON: "Exit Orders"
♦ Volume per Order: "100 Position %"
♦ Why: Closes your entire position when EXIT signal fires
♦ Toggle OFF: "Take Profit" (managed by indicator)
♦ Toggle OFF: "Stop Loss" (managed by indicator)
Click "Start Bot" for both Long and Short bots.
───────────────────────────────────────────
STEP 2: Get Your Bot Credentials
For EACH BOT (Long and Short):
♦ Open the bot → Click "Orders" tab
♦ Scroll down to "Webhook Messages" section
♦ Copy these 3 values:
bot_uuid (long string like: a362cbcf-7e68-4379-a83d-ae6e47dba656)
secret (very long token starting with: eyJhbGciOiJ...)
webhook URL (refer to 3commas to get exact webhook - signal bots)
Note: The secret is usually the same for both bots, but the bot_uuid is different.
───────────────────────────────────────────
STEP 3: Enter Credentials in Indicator
Back in TradingView:
♦ Open indicator Settings
♦ Find section: "1️⃣ INTEGRATE 3COMMAS"
♦ Paste:
Long = Your Long bot UUID
Short = Your Short bot UUID
Secret = Your secret token (same for both)
♦ Click "OK"
The indicator now has everything needed to build JSON payloads.
───────────────────────────────────────────
STEP 4: Create TradingView Alert
This alert bridges TradingView → 3Commas. ONE ALERT HANDLES ALL SIGNALS (BO, PO1, PO2, PO3, EXIT).
How to create:
♦ Right-click chart → "Add Alert" (or click clock icon)
♦ Condition: Select this indicator from dropdown
♦ Trigger: "Any alert() function call"
♦ Alert Name: "Livermore Pyramiding - "
♦ Message: Leave default (indicator sends its own JSON)
♦ Webhook URL: Paste your 3Commas webhook URL from Step 2
♦ ⚠️ Alert Frequency: "Once Per Bar Close" (CRITICAL - controls duplicate orders)
♦ Expiration: Open-ended (or set specific date)
♦ Click "Create"
───────────────────────────────────────────
STEP 5: Test Before Going Live
🧪 NEVER TEST WITH REAL CAPITAL FIRST. Use one of these methods:
Test 1: Check Bot Status
♦ 3Commas → Bots → Both bots show "Active" (green)
♦ Click into each bot → Orders tab → Should say "Waiting for signal"
Test 2: Verify Alert Active
♦ TradingView → Alerts panel (bell icon)
♦ Your alert should show "Active" status
Test 3: Paper Trade / Tiny Position
♦ Use 3Commas paper mode if available, OR
♦ Set Total Budget to $10-50 for first real test
♦ Map a wave that's about to trigger
♦ Watch if orders actually appear on 3Commas
Test 4: Check JSON Format
♦ When alert fires → TradingView Alerts → Click your alert
♦ Look at "History" or "Log"
♦ Verify JSON has: bot_uuid, secret, action, price, amount
───────────────────────────────────────────
🛠️ COMMON ISSUES & SOLUTIONS
✗ Problem: Orders not appearing on 3Commas
Possible causes:
♦ Wrong webhook URL → Must be exact 3Commas URL (check for typos)
♦ Bot paused → Check bot status must be "Active" (green)
♦ Wrong bot UUID → Verify you copied Long UUID for longs, Short UUID for shorts
♦ Secret mismatch → Double-check secret is correct
♦ Exchange API issues → Verify exchange connection in 3Commas settings
How to debug:
♦ 3Commas → Your Signal Bot → Orders tab
♦ Look for "Rejected Signals" section
♦ Should show error messages if webhook failed
───────────────────────────────────────────
✗ Problem: Orders executing at wrong prices
Possible causes:
♦ Limit order not filled → Price gapped through your level before order filled
♦ Slippage on exits → Exits use market orders (intentional - speed over exact price)
♦ Exchange minimums → Some exchanges have minimum order sizes
Solution:
♦ Entries use limit orders (wait for exact price - may not fill if price gaps)
♦ Exits use market orders (prioritize fast execution when structure breaks)
♦ This is INTENTIONAL DESIGN following Livermore's principle: exit when proven wrong
───────────────────────────────────────────
✗ Problem: PO orders firing out of sequence or skipping
Possible causes:
♦ Alert not set to "Once Per Bar Close" → Change alert frequency setting
♦ Multiple alerts running → Delete old/duplicate alerts for this indicator
♦ Conditions changed mid-bar → Indicator only fires at bar close (protective feature)
Solution:
♦ Keep only 1 active alert per indicator instance
♦ Always use "Once Per Bar Close" frequency
♦ Wait for full bar to close before signals can fire
───────────────────────────────────────────
✗ Problem: Bot not closing position on EXIT
Possible causes:
♦ Exit order setting wrong → Check bot settings
♦ Wrong JSON action → Should be "exit_long" or "exit_short"
♦ No position open → Can't close what doesn't exist
Solution:
♦ Verify: Bot Settings → Exit Orders → Volume per Order = "100 Position %"
♦ Check alert history for correct JSON payload
♦ If stuck: Manually close position in 3Commas, then fix settings
♦ Delete and recreate alert if JSON format is wrong
───────────────────────────────────────────
🔒 SECURITY BEST PRACTICES
♦ Never share bot UUID or Secret - Treat them like passwords
♦ Use restricted API keys - Limit to specific pairs, disable withdrawals
♦ Start small - Test with $10-50 first, scale up only after success
♦ Monitor first trades - Don't set-and-forget immediately
♦ Delete old alerts - If you change A/B/C points, delete old alert and create new one
───────────────────────────────────────────
📊 PREFER MANUAL TRADING?
Skip 3Commas entirely and use the indicator for planning only:
♦ Watch Trade Plan table for ✓✓✓✓✓ alignment
♦ Manually place limit orders at displayed prices
♦ Manually move stop loss as EXIT price updates
♦ Manually close when EXIT signal fires
Benefits: Full control, no API concerns, can override based on context
Drawbacks: Must watch chart constantly, emotions can interfere, may miss signals
───────────────────────────────────────────
✅ FINAL CHECKLIST BEFORE LIVE TRADING
✓ Both Signal Bots created (Long + Short)
✓ Entry Orders: Volume = "Send in webhook, quote"
✓ Exit Orders: Volume = "100 Position %"
✓ Take Profit and Stop Loss disabled in bots
✓ Bot UUIDs and Secret entered in indicator
✓ TradingView alert created with correct webhook
✓ Alert frequency = "Once Per Bar Close"
✓ Alert status shows "Active"
✓ Tested with small amounts successfully
✓ Trade Plan table shows ✅ (no validation errors)
✓ Understand your risk per trade
Once all checked: You're ready for automated pyramiding execution.
━━━━━━━━━━━━━━━━━━━━━━━━━━━━━━━━━━━━━━━━━━━
💡 KEY REMINDERS - BEFORE YOU TRADE
💬 "The speculator's chief enemies are always boring from within. It is inseparable from human nature to hope and to fear."
— Jesse Livermore
───────────────────────────────────────────
⚠️ COMMON MISTAKES (AVOID THESE)
Mapping Incomplete Waves
♦ Point C must be in the PAST (completed retrace, not currently forming)
♦ Don't map a wave that's still developing - wait for confirmation
♦ Minimum requirements: 5% impulse (A→B), 3% retrace (B→C)
Ignoring Validation Warnings
♦ Never create alerts when status shows ✗ (red) or ⚠️ (yellow)
♦ Fix all errors first: dates in order, budget = 100%, valid wave structure
♦ Common issues: dates in future, Point C above B (longs) or below B (shorts)
Premature Manual Entries
♦ Don't enter just because price touched the level
♦ Wait for ALL ✓✓✓✓✓ (or ✓✓✓✓✓✓) to align in Trade Plan table
♦ Patience pays - partial confluence = partial edge = higher risk of losing trades
Wrong Timeframe Selection
♦ Avoid: 15m, 5m, 1m (too much noise, false signals)
♦ Use: 1H, 4H, Daily (cleaner structure, better confluence)
♦ Lower timeframes require faster decisions and produce more whipsaws
Over-Risking Capital
♦ Trade budget ≠ Account size
♦ Never risk capital you can't afford to lose
♦ One bad trade should NOT destroy your account
───────────────────────────────────────────
✅ LIVERMORE PRINCIPLES IN ACTION
Confirmation > Prediction
♦ Don't predict where price will go
♦ Wait for price to INDICATE direction via pivots + volume + trend
♦ Test first (BO 20%), build only when confirmed (POs 80%)
💬 "A man must believe in himself and his judgment if he expects to make a living at this game."
Pyramid on Strength, Never Weakness
♦ Add only when: 3 closes + clean candles + volume + pivot breaks
♦ Never average down (DCA into losers)
♦ If BO wrong, take small loss fast - don't hope and add more
💬 "Never buy a stock because it has had a big decline from its previous high."
Respect Market Structure
♦ Pivots = where smart money previously acted (support/resistance)
♦ Breaking them = momentum overcoming barriers
♦ Entering before pivot break = entering into known rejection zones
Trend is Your Friend
♦ Never pyramid against the trend
♦ If trend shifts to Uncertain or reverses → no new entries
♦ Exit when trend proves you wrong (don't fight it)
💬 "I never argue with the tape. Getting sore at the market doesn't get you anywhere."
Discipline > Emotion
♦ Can't "almost" have all conditions met
♦ Either 100% aligned (all ✓) or you wait
♦ No exceptions, no "this time is different"
♦ Automation designed to help remove emotion - consider using 3Commas
💬 "It never was my thinking that made the big money for me. It always was my sitting."
───────────────────────────────────────────
🎯 FINAL THOUGHT
This indicator is a SYSTEMATIC FRAMEWORK, not a magic solution. It translates Livermore's century-old principles into actionable rules:
♦ Test small, build big
♦ Add to winners, cut losers fast
♦ Let structure guide exits
♦ Stay disciplined when emotions scream
The market will test your patience, discipline, and conviction. The indicator aims to reduce guesswork - but YOU still need to:
♦ Find valid wave structures
♦ Choose appropriate market conditions
♦ Size positions properly
♦ Accept losses as part of the game
💬 "The game of speculation is the most uniformly fascinating game in the world. But it is not a game for the stupid, the mentally lazy, the person of inferior emotional balance, or the get-rich-quick adventurer."
— Jesse Livermore

Breakouts with Trailing Stops V6 + AlertsBreakouts with Trailing Stops in Trading
Breakout trading is a strategy where traders aim to profit from an asset's price moving outside a defined support or resistance level, signaling a potential new trend. Trailing stops are a key risk management tool often used with breakouts to protect profits and limit potential losses.
What is a breakout?
A breakout occurs when an asset's price moves decisively above a resistance level (for a bullish breakout) or below a support level (for a bearish breakdown). This often signals increased momentum and potential for a significant price movement in the direction of the breakout.
Why use trailing stops with breakouts?
Trailing stops are particularly useful in breakout trading because they allow traders to capture potential profits as the price moves in their favor, while automatically adjusting to protect against sudden reversals.
How do trailing stops work with breakouts?
Initial Stop-Loss: When entering a breakout trade, a traditional stop-loss order is placed at a predetermined level to limit potential losses if the price reverses. For example, in a long position after a resistance breakout, the initial stop-loss might be placed below the former resistance level (which can now act as support).
Trailing Stop Activation: Once the price moves a favorable distance beyond the entry point, the trailing stop loss is activated. As highlighted by StoneX, it is a dynamic order that follows the price as it continues to move in the desired direction, maintaining a set distance below (for a long position) or above (for a short position) the current market price.
Profit Locking: If the price continues to rise (or fall for a short position), the trailing stop will move with it, "locking in" profits by raising the stop-loss level.
Exit Strategy: If the price reverses and hits the trailing stop, the position is automatically closed, ensuring that the trader retains a portion of the gains made while in the trade.
Advantages of using trailing stops with breakouts:
Locks in profits: Trailing stops help protect profits generated from successful breakout trades.
Automates exits: They automate the exit process, helping traders avoid emotional decision-making when the price reverses.
Allows for potential gains: They allow traders to stay in profitable trades as long as the trend continues.
Disadvantages of using trailing stops with breakouts:
Whipsaw risk: In volatile markets, the trailing stop may be triggered prematurely by minor price fluctuations.
Potential for missed gains: If the trailing stop is set too tightly, it may prevent the trader from capturing the maximum potential gains if the price experiences a minor pullback before continuing in the desired direction.
Tips for using trailing stops with breakouts:
Consider the asset's volatility: Adjust the trailing stop distance based on the asset's volatility to minimize the risk of premature stops.
Test different trailing stop methods: Experiment with different trailing stop methods to find what works best for your trading style and the specific asset you are trading.
Backtest your strategy: Before applying a trailing stop strategy to live trading, backtest it on historical data to evaluate its performance under different market conditions.
Combine with other indicators: Use other technical indicators, such as volume or momentum oscillators, to confirm the validity of breakouts and improve the effectiveness of your trailing stop strategy.
By carefully considering the market dynamics, using appropriate indicators, and implementing proper risk management techniques, traders can effectively utilize trailing stops with breakouts to capture potential profits while minimizing risk.
Have a good trade.

[TTI] High Volume Close (HVC) Setup📜 ––––HISTORY & CREDITS––––
The High Volume Close (HVC) Setup is a specialised indicator designed for the TradingView platform used to identify specific bar. This tool was developed with the objective of identifying a technical pattern that trades have claimed is significant trading opportunities through a unique blend of volume analysis and price action strategies. It is based on the premise that high-volume bars, when combined with specific price action criteria, can signal key market movements.
The HVC is applicable both for swing and longer term trading and as a technical tool it can be used by traders of any asset type (stocks, ETF, crypto, forex etc).
🦄 –––UNIQUENESS–––
The uniqueness of the HVC Setup lies in its flexibility to determine an important price level based on historically important bar. The idea is to identify significant bars (e.g. those who have created the HIGHEST VOLUME: Ever, Yearly, Quarterly and meet additional criteria from the settings) and plot on the chart the close on that day as a significant level as well as theoretical stop loss and target levels. This approach allows traders to discern high volume bars that are contextually significant — a method not commonly found in standard trading tools.
🎯 ––––WHAT IT DOES––––
The HVC Setup indicator performs a series of calculations to identify high volume close bars/bar (HVC bars) based on the user requirements.
These bars are determined based on the highest volume recorded within a user-inputs:
👉 Period (Ever, Yearly, Quarterly) and must meet additional criteria such as:
👉 a minimum percentage Price Change (change is calculated based on a close/close) and
👉 specific Closing Range requirements for the HVC da.
The theory is that this is a significant bar that is important to know where it is on the chart.
The script includes a comparative analysis of the HVC bar's price against historical price highs (all-time, yearly, quarterly), which provides further context and significance to the identified bars. All of these USER input requirement are then taken into account as a condition to identity the High Volume Close Bar (HVC).
The visual representation includes color-coded bar (default is yellow) and lines to delineate these key trading signals. It then draws a blue line for the place where the close ofthe bar is, a red line that would signify a stop loss and 2 target profit levels equal to 2R and 3R of the risked level (close-stop loss). Additional lines can be turned on/off with their coresponding checkboxes in the settings.
If the user chooses "Ever" for Period - the script will look at the first available bar ever in Tradingview - this is generally the IPO bar;
If the users chooses "Yearly" - the script would look at the highest available bar for a completed year;
If the users chooses "Quarterly" - it would do the same for the quarter. (works on daily timeframe only);
While we have not backtested the performance of the script, this methodology has been widely publicised.
🛠️ ––––HOW TO USE IT––––
To utilize the HVC Setup effectively:
👉Customize Input Settings: Choose the HVC period, percentage change threshold, closing range, stop loss distance, and target multiples according to your trading strategy. Use the tick boxes to enable and disable if a given condition is used within the calculation.
👉Identify HVC Bars: The script highlights HVC bars, indicating potential opportunities based on volume and price action analysis.
👉Interpret Targets and Stop Losses: Use the color-coded lines (green for targets, red for stop losses) to guide your trade entries and exits.
👉Contextual Analysis: Always consider the HVC bar signals in conjunction with overall market trends and additional technical indicators for comprehensive trading decisions.
This script is designed to assist traders in identifying high-potential trading setups by using a combination of volume and price analysis, enhancing traditional methods with a unique, algorithmically driven approach.

Luxmi AI Directional Option Buying (Long Only)Introduction:
"Option premium charts typically exhibit a predisposition towards bearish sentiment in higher timeframes"
In the dynamic world of options trading, navigating through the complexities of market trends and price movements is essential for making informed decisions. Among the arsenal of tools available to traders, option premium charts stand out as a pivotal source of insight, particularly in higher timeframes. However, their inherent bearish inclination in such timeframes necessitates a keen eye for identifying bullish pullbacks, especially in lower timeframes, to optimize buying strategies effectively.
Understanding the interplay between different data points becomes paramount in this endeavor. Traders embark on a journey of analysis, delving into metrics such as Implementation Shortfall, the performance of underlying index constituents, and bullish trends observed in lower timeframes like the 1-minute and 3-minute charts. These data points serve as guiding beacons, illuminating potential opportunities amidst the market's ever-shifting landscape.
Using this indicator, we will dissect the significance of option premium charts and their nuanced portrayal of market sentiment. Furthermore, we will unveil the art of discerning bullish pullbacks in lower timeframes, leveraging a multifaceted approach that amalgamates quantitative analysis with qualitative insights. Through this holistic perspective, traders can refine their decision-making processes, striving towards efficiency and efficacy in their options trading endeavors.
Major Features:
Implementation Shortfall (IS) Candles:
Working Principle:
TWAP (Time-Weighted Average Price) and EMA (Exponential Moving Average) are both commonly used in calculating Implementation Shortfall, a metric that measures the difference between the actual execution price of a trade and the benchmark price.
TWAP calculates the average price of a security over a specified time period, giving equal weight to each interval. On the other hand, EMA places more weight on recent prices, making it more responsive to current market conditions.
To calculate Implementation Shortfall using TWAP, the difference between the average execution price and the benchmark price is determined over the trading period. Similarly, with EMA, the difference is calculated using the exponential moving average price instead of a simple average.
By employing TWAP and EMA, traders can gauge the effectiveness of their trading strategies and identify areas for improvement in executing trades relative to a benchmark.
Benefits of using Implementation Shortfall:
By visualizing the implementation shortfall and its comparison with the EMA on the chart, traders can quickly assess whether current trading activity is deviating from recent trends.
Green bars suggest potential buying opportunities or bullish sentiment, while red bars suggest potential selling opportunities or bearish sentiment.
Traders can use this visualization to make more informed decisions about their trading strategies, such as adjusting position sizes, entering or exiting trades, or managing risk based on the observed deviations from the moving average.
How to use this feature:
This feature calculates Implementation Shortfall (IS) and visually represents it by coloring the candles in either bullish (green) or bearish (red) hues. This color-coding system provides traders with a quick and intuitive way to assess market sentiment and potential entry points. Specifically, a long entry is signaled when both the candle color and the trend cloud color align as green, indicating a bullish market outlook. This integrated approach enables traders to make informed decisions, leveraging IS insights alongside visual cues for more effective trading strategies.
Micro Trend Candles:
Working Principle:
This feature begins by initializing variables to determine trend channel width and track price movements. Average True Range (ATR) is then calculated to measure market volatility, influencing the channel's size. Highs and lows are identified within a specified range, and trends are assessed based on price breaches, with potential changes signaled accordingly. The price channel is continually updated to adapt to market shifts, and arrows are placed to indicate potential entry points. Colors are assigned to represent bullish and bearish trends, dynamically adjusting based on current market conditions. Finally, candles on the chart are colored to visually depict the identified micro trend, offering traders an intuitive way to interpret market sentiment and potential entry opportunities.
Benefits of using Micro Trend Candles:
Traders can use these identified micro trends to spot potential short-term trading opportunities. For example:
Trend Following: Traders may decide to enter trades aligned with the prevailing micro trend. If the candles are consistently colored in a certain direction, traders may consider entering positions in that direction.
Reversals: Conversely, if the script signals a potential reversal by changing the candle colors, traders may anticipate trend reversals and adjust their trading strategies accordingly. For instance, they might close existing positions or enter new positions in anticipation of a trend reversal.
It's important to note that these micro trends are short-term in nature and may not always align with broader market trends. Therefore, traders utilizing this script should consider their trading timeframes and adjust their strategies accordingly.
How to use this feature:
This feature assigns colors to candles to represent bullish and bearish trends, with adjustments made based on current market conditions. Green candles accompanied by a green trend cloud signal a potential long entry, while red candles suggest caution, indicating a bearish trend. This visual representation allows traders to interpret market sentiment intuitively, identifying optimal entry points and exercising caution during potential downtrends.
Scalping Candles (Inspired by Elliott Wave):
Working Principle:
This feature draws inspiration from the Elliot Wave method, utilizing technical analysis techniques to discern potential market trends and sentiment shifts. It begins by calculating the variance between two Exponential Moving Averages (EMAs) of closing prices, mimicking Elliot Wave's focus on wave and trend analysis. The shorter-term EMA captures immediate price momentum, while the longer-term EMA reflects broader market trends. A smoother Exponential Moving Average (EMA) line, derived from the difference between these EMAs, aids in identifying short-term trend shifts or momentum reversals.
Benefits of using Scalping Candles Inspired by Elliott Wave:
The Elliott Wave principle is a form of technical analysis that attempts to predict future price movements by identifying patterns in market charts. It suggests that markets move in repetitive waves or cycles, and traders can potentially profit by recognizing these patterns.
While this script does not explicitly analyze Elliot Wave patterns, it is inspired by the principle's emphasis on trend analysis and market sentiment. By calculating and visualizing the difference between EMAs and assigning colors to candles based on this analysis, the script aims to provide traders with insights into potential market sentiment shifts, which can align with the broader philosophy of Elliott Wave analysis.
How to use this feature:
Candlestick colors are assigned based on the relationship between the EMA line and the variance. When the variance is below or equal to the EMA line, candles are colored red, suggesting a bearish sentiment. Conversely, when the variance is above the EMA line, candles are tinted green, indicating a bullish outlook. Though not explicitly analyzing Elliot Wave patterns, the script aligns with its principles of trend analysis and market sentiment interpretation. By offering visual cues on sentiment shifts, it provides traders with insights into potential trading opportunities, echoing Elliot Wave's emphasis on pattern recognition and trend analysis.
Volume Candles:
Working Principle:
This feature introduces a custom volume calculation method tailored for bullish and bearish bars, enabling a granular analysis of volume dynamics specific to different price movements. By summing volumes over specified periods for bullish and bearish bars, traders gain insights into the intensity of buying and selling pressures during these periods, facilitating a deeper understanding of market sentiment. Subsequently, the script computes the net volume, revealing the overall balance between buying and selling pressures. Positive net volume signifies prevailing bullish sentiment, while negative net volume indicates bearish sentiment.
Benefits of Using Volume candles:
Enhanced Volume Analysis: Traders gain a deeper understanding of volume dynamics specific to bullish and bearish price movements, allowing them to assess the intensity of buying and selling pressures with greater precision.
Insight into Market Sentiment: By computing net volume and analyzing its relationship with the Exponential Moving Average (EMA), traders obtain valuable insights into prevailing market sentiment. This helps in identifying potential shifts in sentiment and anticipating market movements.
Visual Representation of Sentiment: The color-coded candle bodies based on volume dynamics provide traders with a visual representation of market sentiment. This intuitive visualization helps in quickly interpreting sentiment shifts and making timely trading decisions.
How to use this feature:
This visual representation allows traders to quickly interpret market sentiment based on volume dynamics. Green candles indicate potential bullish sentiment, while red candles suggest bearish sentiment. The color-coded candle bodies help traders identify shifts in market sentiment and make informed trading decisions.
Smart Sentimeter Candles:
Working Principle:
The "Smart Sentimeter Candles" feature is a tool designed for market sentiment analysis using technical indicators. It begins by defining stock symbols from various sectors, allowing traders to select specific indices for sentiment analysis. The script then calculates the difference between two Exponential Moving Averages (EMAs) of the High-Low midpoint, capturing short-term momentum changes in the market. It computes the difference between current and previous values to capture momentum shifts over time.
Additionally, it calculates the Exponential Moving Average (EMA) of this difference to provide a smoothed representation of the prevailing trend in market momentum. Another EMA of this difference is calculated to offer an alternative perspective on longer-term momentum trends. Bar colors are determined based on the difference between current and previous values, with bullish and bearish sentiment represented by custom colors. Finally, sentiment candles are visualized on the chart, providing traders with a clear representation of market sentiment changes.
Benefits of Using Sentimeter Candles:
By analyzing index constituents, traders gain insights into the individual stocks that collectively influence the index's performance. This understanding is crucial for trading options as it helps traders tailor their strategies to specific sectors or stocks within the index.
Sector-Specific Analysis: Traders can focus on specific sectors by selecting relevant indices for sentiment analysis.
Momentum Identification: The script identifies short-term momentum changes in the market, aiding traders in spotting potential trend reversals or continuations.
Clear Visualization: Sentiment candles visually represent market sentiment changes, making it easier for traders to interpret and act upon sentiment trends.
How to use this feature:
Select Indices: Toggle the inputs to choose which indices (e.g., NIFTY, BANKNIFTY, FINNIFTY) to analyze.
Interpret Sentiment Candles: Monitor the color of sentiment candles on the chart. Green candles indicate bullish sentiment, while red candles suggest bearish sentiment.
Observe Momentum Changes: Pay attention to momentum changes identified by the difference between EMAs and their respective EMAs. Increasing bullish momentum may present buying opportunities, while increasing bearish momentum could signal potential sell-offs.
Trend Cloud:
Working Principle:
The script utilizes the Relative Strength Index (RSI) to assess market momentum, identifying bullish and bearish phases based on RSI readings. It calculates two boolean variables, bullmove and bearmove, which signal shifts in momentum direction by considering changes in the Exponential Moving Average (EMA) of the closing price. When RSI indicates bullish momentum and the closing price's EMA exhibits positive changes, bullmove is triggered, signifying the start of a bullish phase. Conversely, when RSI suggests bearish momentum and the closing price's EMA shows negative changes, bearmove is activated, marking the beginning of a bearish phase. This systematic approach helps in understanding the current trend of the price. The script visually emphasizes these phases on the chart using plot shape markers, providing traders with clear indications of trend shifts.
Benefits of Using Trend Cloud:
Comprehensive Momentum Assessment: The script offers a holistic view of market momentum by incorporating RSI readings and changes in the closing price's EMA, enabling traders to identify both bullish and bearish phases effectively.
Structured Trend Recognition: With the calculation of boolean variables, the script provides a structured approach to recognizing shifts in momentum direction, enhancing traders' ability to interpret market dynamics.
Visual Clarity: Plotshape markers visually highlight the start and end of bullish and bearish phases on the chart, facilitating easy identification of trend shifts and helping traders to stay informed.
Prompt Response: Traders can promptly react to changing market conditions as the script triggers alerts when bullish or bearish phases begin, allowing them to seize potential trading opportunities swiftly.
Informed Decision-Making: By integrating various indicators and visual cues, the script enables traders to make well-informed decisions and adapt their strategies according to prevailing market sentiment, ultimately enhancing their trading performance.
How to use this feature:
The most effective way to maximize the benefits of this feature is to use it in conjunction with other key indicators and visual cues. By combining the color-coded clouds, which indicate bullish and bearish sentiment, with other features such as IS candles, microtrend candles, volume candles, and sentimeter candles, traders can gain a comprehensive understanding of market dynamics. For instance, aligning the color of the clouds with the trend direction indicated by IS candles, microtrend candles, and sentimeter candles can provide confirmation of trend strength or potential reversals.
Furthermore, traders can leverage the trend cloud as a trailing stop-loss tool for long entries, enhancing risk management strategies. By adjusting the stop-loss level based on the color of the cloud, traders can trail their positions to capture potential profits while minimizing losses. For long entries, maintaining the position as long as the cloud remains green can help traders stay aligned with the prevailing bullish sentiment. Conversely, a shift in color from green to red serves as a signal to exit the position, indicating a potential reversal in market sentiment and minimizing potential losses. This integration of the trend cloud as a trailing stop-loss mechanism adds an additional layer of risk management to trading strategies, increasing the likelihood of successful trades while reducing exposure to adverse market movements.
Moreover, the red cloud serves as an indicator of decay in option premiums and potential theta effect, particularly relevant for options traders. When the cloud turns red, it suggests a decline in option prices and an increase in theta decay, highlighting the importance of managing options positions accordingly. Traders may consider adjusting their options strategies, such as rolling positions or closing out contracts, to mitigate the impact of theta decay and preserve capital. By incorporating this insight into options pricing dynamics, traders can make more informed decisions about their options trades.
Scalping Opportunities (UpArrow and DownArrow):
Working Principle:
The feature calculates candlestick values based on the open, high, low, and close prices of each bar. By comparing these derived candlestick values, it determines whether the current candlestick is bullish or bearish. Additionally, it signals when there is a change in the color (bullish or bearish) of the derived candlesticks compared to the previous bar, enabling traders to identify potential shifts in market sentiment. This is a long only strategy, hence the signals are plotted only when the Trend Cloud is Green (Bullish).
Benefits of using UpArrow and DownArrow:
Clear Visualization: By employing color-coded candlesticks, the script offers traders a visually intuitive representation of market sentiment, enabling quick interpretation of prevailing conditions.
Signal Identification: Its capability to detect shifts in market sentiment serves as a valuable tool for identifying potential trading opportunities, facilitating timely decision-making and execution.
Long-Only Strategy: The script selectively plots signals only when the trend cloud is green, aligning with a bullish bias and enabling traders to focus on long positions during favorable market conditions.
Up arrows indicate potential long entry points, complementing the bullish bias of the trend cloud. Conversely, down arrows signify an active pullback in progress, signaling caution and prompting traders to refrain from entering long positions during such periods.
How to use this feature:
Confirmation: Confirm bullish market conditions with the Trend Cloud indicator. Ensure alignment between trend cloud signals, candlestick colors, and arrow indicators for confident trading decisions.
Entry Signals: Look for buy signals within a green trend cloud, indicated by bullish candlestick color changes and up arrows, suggesting potential long entry points aligned with the prevailing bullish sentiment.
Wait Signals: Exercise caution when encountering down arrows, which signify wait signals or active pullbacks in progress. Avoid entering long positions during these periods to avoid potential losses.
Exit Strategy: Use trend cloud color changes as signals to exit long positions. When the trend cloud shifts color, consider closing out long positions to lock in profits or minimize losses.
Profit Management: It's important to book or lock in some profits early on in option buying. Consider taking partial profits when the trade is in your favor and trail the remaining position to maximize gains on favorable trades.
Risk Management: Implement stop-loss orders or trailing stops to manage risk effectively. Exit positions promptly if sentiment shifts or if price movements deviate from the established trend, safeguarding capital.
Up and Down Signals:
Working Principle:
This feature calculates Trailing Stoploss (TSL) using the Average True Range (ATR) to dynamically adjust the stop level based on price movements. It generates buy signals when the price crosses above the trailing stop and sell signals when it crosses below. These signals are plotted on the chart and trigger alerts, signaling potential trading opportunities. Additionally, the script selectively plots Up and Down signals only when the Implementation Shortfall Calculation identifies scalp opportunities, independent of the prevailing price trend.
Benefits of using Up and Down Signals:
Trailing Stoploss: The script employs an ATR-based trailing stop, allowing traders to adjust stop levels dynamically in response to changing market conditions, thereby maximizing profit potential and minimizing losses.
Clear Signal Generation: Buy and sell signals are generated based on price interactions with the trailing stop, providing clear indications of entry and exit points for traders to act upon.
Alert Notifications: The script triggers alerts when buy or sell signals are generated, ensuring traders remain informed of potential trading opportunities even when not actively monitoring the charts.
Scalping Opportunities: By incorporating Implementation Shortfall Calculation, the script identifies scalp opportunities, enabling traders to capitalize on short-term price movements irrespective of the prevailing trend.
How to use this feature:
Signal Interpretation: Interpret Up signals as opportunities to enter long positions when the price crosses above the trailing stop, and Down signals as cues to exit.
Alert Monitoring: Pay attention to alert notifications triggered by the script, indicating potential trading opportunities based on signal generation.
Scalping Strategy: When Up and Down signals are plotted alongside scalp opportunities identified by the Implementation Shortfall Calculation, consider scalping trades aligned with these signals for short-term profit-taking, regardless of the overall market trend.
Consideration of Trend Cloud: Remember that this feature does not account for the underlying trend provided by the Trend Cloud feature. Consequently, the take profit levels generated by the trailing stop may be smaller than those derived from trend-following strategies. It's advisable to supplement this feature with additional trend analysis to optimize profit-taking levels and enhance overall trading performance.
Chart Timeframe Support and Resistance:
Working Principle:
This feature serves to identify and visualize support and resistance levels on the chart, primarily based on the chosen Chart Timeframe (CTF). It allows users to specify parameters such as the number of bars considered on the left and right sides of each pivot point, as well as line width and label color. Moreover, users have the option to enable or disable the display of these levels. By utilizing functions to calculate pivot highs and lows within the specified timeframe, the script determines the highest high and lowest low surrounding each pivot point.
Additionally, it defines functions to create lines and labels for each detected support and resistance level. Notably, this feature incorporates a trading method that emphasizes the concept of resistance turning into support after breakouts, thereby providing valuable insights for traders employing such strategies. These lines are drawn on the chart, with colors indicating whether the level is above or below the current close price, aiding traders in visualizing key levels and making informed trading decisions.
Benefits of Chart Timeframe Support and Resistance:
Identification of Price Levels: Support and resistance levels help traders identify significant price levels where buying (support) and selling (resistance) pressure may intensify. These levels are often formed based on historical price movements and are regarded as areas of interest for traders.
Decision Making: Support and resistance levels assist traders in making informed trading decisions. By observing price reactions near these levels, traders can gauge market sentiment and adjust their strategies accordingly. For example, traders may choose to enter or exit positions, set stop-loss orders, or take profit targets based on price behavior around these levels.
Risk Management: Support and resistance levels aid in risk management by providing reference points for setting stop-loss orders. Traders often place stop-loss orders below support levels for long positions and above resistance levels for short positions to limit potential losses if the market moves against them.
How to use this feature:
Planning Long Positions: When considering long positions, it's advantageous to strategize when the price is in proximity to a support level identified by the script. This suggests a potential area of buying interest where traders may expect a bounce or reversal in price. Additionally, confirm the bullish bias by ensuring that the trend cloud is green, indicating favorable market conditions for long trades.
Waiting for Breakout: If long signals are generated near resistance levels detected by the script, exercise patience and wait for a breakout above the resistance. A breakout above resistance signifies potential strength in the upward momentum and may present a more opportune moment to enter long positions. This approach aligns with trading methodologies that emphasize confirmation of bullish momentum before initiating trades.
Settings:
The Index Constituent Analysis setting empowers users to input the constituents of a specific index, facilitating the analysis of market sentiments based on the performance of these individual components. An index serves as a statistical measure of changes in a portfolio of securities representing a particular market or sector, with constituents representing the individual assets or securities comprising the index.
By providing the constituent list, users gain insights into market sentiments by observing how each constituent performs within the broader index. This analysis aids traders and investors in understanding the underlying dynamics driving the index's movements, identifying trends or anomalies, and making informed decisions regarding their investment strategies.
This setting empowers users to customize their analysis based on specific indexes relevant to their trading or investment objectives, whether tracking a benchmark index, sector-specific index, or custom index. Analyzing constituent performance offers a valuable tool for market assessment and decision-making.
Example: BankNifty Index and Its Constituents
Illustratively, the BankNifty index represents the performance of the banking sector in India and includes major banks and financial institutions listed on the National Stock Exchange of India (NSE). Prominent constituents of the BankNifty index include:
State Bank of India (SBIN)
HDFC Bank
ICICI Bank
Kotak Mahindra Bank
Axis Bank
IndusInd Bank
Punjab National Bank (PNB)
Yes Bank
Federal Bank
IDFC First Bank
By utilizing the Index Constituent Analysis setting and inputting these constituent stocks of the BankNifty index, traders and investors can assess the individual performance of these banking stocks within the broader banking sector index. This analysis enables them to gauge market sentiments, identify trends, and make well-informed decisions regarding their trading or investment strategies in the banking sector.
Example: NAS100 Index and Its Constituents
Similarly, the NAS100 index, known as the NASDAQ-100, tracks the performance of the largest non-financial companies listed on the NASDAQ stock exchange. Prominent constituents of the NAS100 index include technology and consumer discretionary stocks such as:
Apple Inc. (AAPL)
Microsoft Corporation (MSFT)
Amazon.com Inc. (AMZN)
Alphabet Inc. (GOOGL)
Facebook Inc. (FB)
Tesla Inc. (TSLA)
NVIDIA Corporation (NVDA)
PayPal Holdings Inc. (PYPL)
Netflix Inc. (NFLX)
Adobe Inc. (ADBE)
By inputting these constituent stocks of the NAS100 index into the Index Constituent Analysis setting, traders and investors can analyze the individual performance of these technology and consumer discretionary stocks within the broader NASDAQ-100 index. This analysis facilitates the evaluation of market sentiments, identification of trends, and informed decision-making regarding trading or investment strategies in the technology and consumer sectors.
Example: FTSE 100 Index and Its Constituents
The FTSE 100 index represents the performance of the 100 largest companies listed on the London Stock Exchange (LSE) by market capitalization. Some notable constituents of the FTSE 100 index include:
HSBC Holdings plc
BP plc
GlaxoSmithKline plc
Unilever plc
Royal Dutch Shell plc
AstraZeneca plc
Diageo plc
Rio Tinto plc
British American Tobacco plc
Reckitt Benckiser Group plc
By inputting these constituent stocks of the FTSE 100 index into the Index Constituent Analysis setting, traders and investors can analyze the individual performance of these diverse companies within the broader UK market index. This analysis facilitates the evaluation of market sentiments, identification of trends, and informed decision-making regarding trading or investment strategies in the UK market.
This comprehensive approach enables users to dissect index performance effectively, providing valuable insights for investors and traders across different markets and sectors.
Index Selection - Index Selection allows traders to specify the index for Sentimeter calculations, enabling customization for Call and Put Option charts corresponding to the chosen index.
Support and Resistance Levels - Set the left and right bars to consider pivot high and low to draw Support and resistance lines. Linewidth setting to help increase the width of the Support and Resistance lines. Label Color to change the color of the labels.
Style Section Colors to allow users to customize the color scheme to their liking.
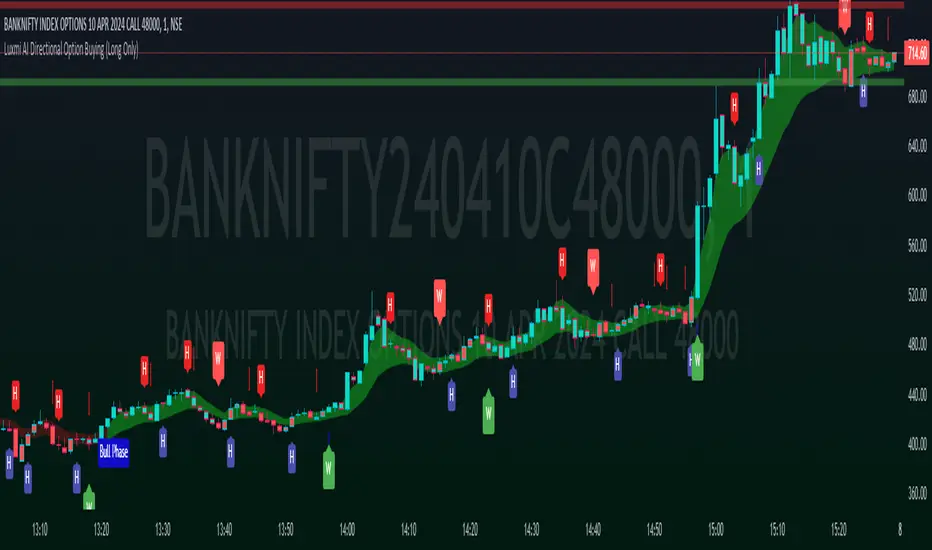
MTF HalfTrendIntroduction
A half-trend indicator is a technical analysis tool that uses moving averages and price data to find potential trend reversal and entry points in the form of graphical arrows showing market turning points.
The salient features of this indicator are:
- It uses the phenomenon of moving averages.
- It is a momentum indicator.
- It can indicate a trend change.
- It is capable of detecting a bullish or bearish trend reversal.
- It can signal to sell/buy.
- It is a real-time indicator.
Multi-Timeframe Application
A standout feature is its flexibility across timeframes. Traders have the liberty to choose any timeframe on the chart, enhancing the tool's versatility and making it suitable for both short-term and long-term analyses.
Principle of the Half Trend indicator
This indicator is based on the moving averages. The moving average is the average of the fluctuation or change in the price of an asset. These averages are taken for a time interval.
So, a half-trend indicator takes the moving averages phenomenon as its principle for working. The most commonly used moving averages in a half trend indicator are:
- Relative strength index (RSI)
- EMA (estimated moving average)
Components of a Half Trend indicator
There are two main components of a half trend indicator:
- Half trend line
- Arrows
- ATR lines
Half trend line
Half trend line represents this indicator on a candlestick chart. This line shows the trend of a chart in real-time. A half-trend line is based on the moving averages.
There are two further components of a half-trend line:
- Redline
- Blue line
A red line represents a bearish trend. When the half-trend line turns red, a trend is facing a dip. It is time for the bears to take control of the market. A bearish control of the market represents the domination of sellers in the market.
On the other hand, the blue line represents the bullish nature of the market. It tells a trader that the bullish sentiment of the market is prevailing. A bullish market means the number of buyers is significantly greater than the number of sellers.
Moreover, a trader can change these colors to his choice by customization.
Arrows
There are two types of arrows in this indicator which help a trader with the entry and exit points. These arrows are,
- Blue arrow
- Red arrow
A blue arrow signals a buying trade; on the other hand, a red arrow tells a trader about the selling of the assets. These arrows work with the moving average line to formulate a trading strategy.
The color of these arrows is changed if a trader desires so.
ATR lines
The ATR blue and red lines represent the Average True Range of the Half trend line. They may be used as stop loss or take profit levels.
Pros and Cons
Pros
- It is a very easy to eyes indicator.
- This is a very useful friendly indicator.
- It provides sufficient information to beginner traders.
- It provides sufficient information for entry points in a trade.
- A half-trend indicator provides a good exit strategy for a trader.
- It provides information about market reversals.
- It helps a trader to find a bullish and bearish sentiment in the market.
Cons
- It is a real-time indicator. So, it can lag.
- The lagging of this indicator can lead to miss opportunities.
- The most advanced and professional traders may not rely on this indicator for crucial trading decisions.
- The lagging of this indicator can predict false reversals of the market.
- It can create false signals.
- It requires the confluence of the other technical tools for a better success ratio.
Settings for Half Trend indicator
The default settings for half trend indicator are:
Amplitude = 2
Channel deviation = 2
Different markets or financial instruments may require different settings for optimal execution.
Amplitude: The degree that the Half trend line takes the internal variables into consideration. The higher the number, the fewer trades. The default value is 2.
Channel deviation: The ATR value calculation from the Half trend line. The default value is 2.
Trading strategy
It is an effective indicator in terms of strategy formation for a trading setup. The new and beginner trades can take benefit from this indicator for the formulation of a good trading setup. This indicator also helps seasoned and professional traders formulate a good trading setup with other technical tools.
The trading strategy involving a half-trend indicator is divided into three parts:
- Entry and exit
- Risk management
- Take profit
Entry and exit
It is an effective indicator that provides sufficient information about the entry and exit points in a trading setup. The profit of a trader is directly proportional to the appropriate entry and exit points. So, it is a crucial step in any trading setup.
The blue and red arrows provide information about the entry and exit points in a trading setup. Furthermore, the entry and exit for the bullish and bearish setups are as follows.
Entry and exit for a bullish setup
If a blue arrow appears under the half-trend line, it means the bullish sentiment of the market is getting stronger in the future. So, it is a signal for entry in a bullish setup.
As the red arrow appears on the chart, it is a signal to exit your trade. The red arrow represents a reversal in the market, so it is a good opportunity to close your trade in a bullish setup.
Entry and exit for a bearish setup
Suppose a red arrow appears above the red moving average line. It is a good opportunity to enter a trade in a bearish setup. The red line represents that sooner the sellers are going to take control and the value of the asset is about to face a dip. So it is the best time to make your move.
As the opposite arrow appears in the chart, it is time to exit from a bearish trade setup.
Re-entering a position
Bullish setup
- The half-trend line is blue.
- At least one candle closes below the blue half-trend line.
- Enter on the candle that closes above the blue half-trend line.
Bearish setup
- The half-trend line is red.
- At least one candle closes above the red half-trend line.
- Enter on the candle that closes below the red half-trend line.
Risk management
Risk management is an integral part of a trading setup. It is an important step to protect your potential profits and losses.
When trading in a bullish market, place the stop loss at the prior swing low. It will help you to cut your losses in case the prices move to the lower end.
In the case of a bearish market, place your stop loss above the prior swing high.
A trader may trail the stop loss using the ATR lines.
The new trader often makes mistakes in the placement of the stop loss. If you don’t place the stop loss at an appropriate point. It can drain your bank account and ruin your trading experience. Is is recommended not to risk more than 2% of your trading account, per trade.
Take profit
The blue ATR line may be used as one take profit level on a bullish setup followed by the previous swing high. The signal reversal would indicate the final take profit and closing of any position.
The red ATR line may be used as one take profit level on a bearish setup followed by the previous swing low. The signal reversal would indicate the final take profit and closing of any position.
Conclusion
A half trend indicator is a decent indicator that can transform your trading experience. It is a dual indicator that is based on the moving averages as well as helps you to form a trading strategy. If you are a new trader, this indicator can help you to learn and flourish in the trading universe. If you are a seasoned trader, I recommend you use this indicator with other technical analysis tools to enhance your success ratio.
All credits go to:
- @everget the original creator of this indicator (I just added the MTF capability).
- Ali Muhammad original author of much of the description used.

Dynamic Trend Hunter [Quantigenics]The "Dynamic Trend Hunter” script focuses on trend identification, dynamic entry and exit signals, and effective risk management. While a standalone trading script designed for versatile application across all markets, it can also be complemented by other indicators for enhanced analysis.
Core Features:
Dynamic Trend Indicator: Central to the script, this indicator discerns market trend direction using a color-coded system. Blue indicates an uptrend, red a downtrend, and a flat line signifies a sideways market.
Buy and Sell Signals: Provides clear, on-chart buy and sell signals to assist in identifying optimal entry points in alignment with the trend.
Profit Target Exits: A key feature designed to help traders lock in profits at strategic points. This feature uses a sophisticated mechanism (outlined in more detail below) to identify potential exit points, signaling the trader to close a position and secure gains before a potential market reversal.
Dynamic Stop Loss Levels: Essential for risk management, these levels adjust automatically, providing a mechanism for trailing stop losses and safeguarding against adverse market movements.
Technical Composition:
Dynamic Trend Indicator:
Calculation Method: Utilizes a blend of the highest and lowest prices over a specified length, averaged to create a trend line. This line is helpful in identifying the overall market trend.
Color Coding: The trend line changes color based on its relation to price action. A blue line indicates an uptrend when prices are consistently above this average line, while a red line signifies a downtrend when prices stay below it.
Signal-Based Trading:
Trend Entry Signals: Generated when there's a shift in the color of the trend line, indicating a potential change in market direction.
Pullback Entries: Identified when the closing price crosses the previous high (for long entries) or low (for short entries), while also considering the current trend line position.
Dynamic Stop Loss Levels:
Calculation: Stop loss levels are dynamically determined using the highest and lowest closing prices over the 'Length' period. These levels adjust with market movements, providing a trailing stop loss mechanism.
Visualization: Depicted as colored dots on the chart, changing in response to the market's movement relative to the trend line.
Oscillator for Dynamic Exits:
Mechanism: The script employs an oscillator to identify potential exit points, signaled by yellow dots. This oscillator is based on the relative extremity of the current price action compared to recent price movements.
Alerts: Dynamic exits trigger alerts when the oscillator reaches specified threshold levels, signaling potential market reversals or exhaustion points.
Customization and Flexibility:
Length Adjustment: The primary 'Length' input parameter allows traders to modify the sensitivity of the trend line and stop levels, catering to different trading styles and market conditions.
Alert Customization: Traders can set alerts for trend line changes and dynamic exits, ensuring timely responses to market movements.
Input Parameter Settings:
Intra-Bar Order Generation (IntraBar): Enables real-time signal generation within the current bar or after its closure.
Dynamic Exits (DynamicExits): Toggles the visibility of dynamic exit signals for profit-taking.
Dynamic Trend Length: Defines the lookback period for calculating the trend line. This length, which is adjustable and set by default to 21, specifies the number of bars over which the highest and lowest prices are analyzed to determine the trend line.
Dynamic Stop Loss Levels Length: This parameter defines the lookback period for calculating stop loss levels. It sets the number of bars used to determine the highest and lowest values for stop loss positioning. Adjusting this length allows traders to customize the sensitivity and placement of stop loss levels in accordance with their trading strategy and risk tolerance. This feature is crucial for tailoring stop loss settings to different market conditions and volatility levels, ensuring more effective risk management. Note: that initial stop loss levels, and tighter stop losses, can be set behind the Dynamic Trend Line itself.
Show Trend/Pullback Entries: Controls the display of specific entry signals based on trend continuation or market pullbacks.
Alert Settings: Options for setting alerts on trend line changes and dynamic exits, enhancing trade management.
Customizable Colors: Allows personalization of stop level and trend line colors for better chart visualization.
How to Trade with the Dynamic Trend Hunter:
Trend Following: Enter trades in the direction of the trend indicated by the color-coded trend line.
Pullback Entries: Look for pullback entry signals during established trends for additional entry points.
Dynamic Exits: Use yellow dot signals and dynamic stop loss levels for determining exit points or to adjust stop losses.
Risk Management: Employ the dynamic stop loss levels to manage risk effectively and protect against significant losses.
Alerts and Notifications:
Traders can set up alerts for trend line changes and dynamic exits, ensuring they are promptly informed about critical market movements and can react accordingly.
Conclusion:
The "Dynamic Trend Hunter " is a comprehensive and adaptable trading tool, suitable for various market conditions and trading styles. Its ability to provide clear trend indications, along with dynamic entry and exit signals, makes it an invaluable asset for traders aiming to enhance their market analysis and decision-making process. While it is a standalone system, it can be used in conjunction with other indicators to further refine trading strategies.
While we believe this tool may enhances your trading strategy, we encourage thorough familiarization before live trading. Remember, trading involves risk, and past performance is not indicative of future results.
You can see the “Author’s instructions" below to get immediate access to Dynamic Trend Hunter & the rest of the “Quantigenics Premium Indicator Suite”.
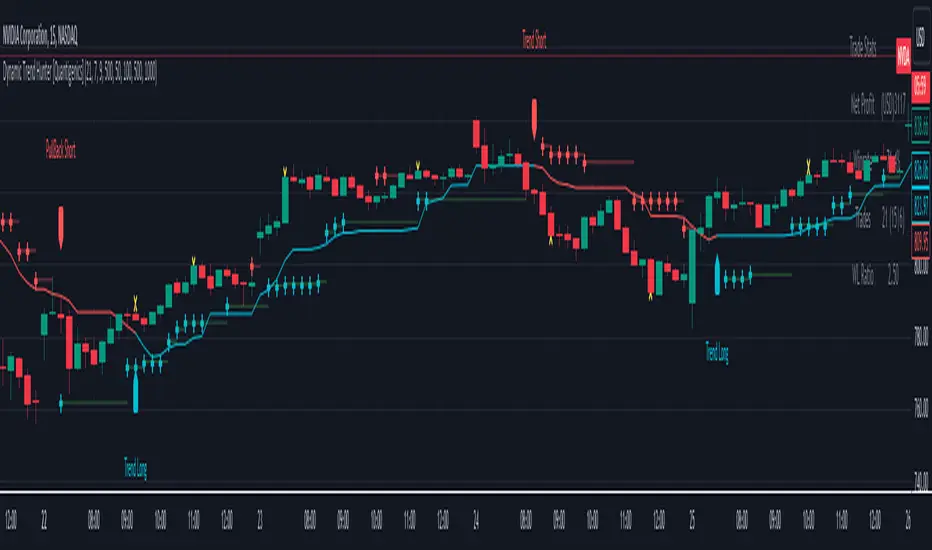
Original Strategy - Backtest & Alerts [AlgoRider]█ OVERVIEW
This indicator simulates an efficient trading strategy developed by our team in a simple and effective way, the primary objective when designing it was to make its reading and use as simple as possible for TradingView users. The Backtesting feature has been designed to keep only the most essential information to obtain clear and precise results directly on the graph. The settings interface has also been designed for ergonomic and simplified use. The user is free to customize the parameters as he wishes and according to his trading profile by having the choice, for example, of using options to reduce the risk of loss, to increase the win rate, to optimize profits. Automation is made possible and facilitated thanks to preconfigured alert conditions.
█ CONCEPTS
How the strategy works :
When the price is close to its equilibrium (represented by an exponential moving average - EMA) and it starts to take an upward or downward direction the script will issue Long or Short entry orders. If the price turns and goes to the opposite direction, the script quickly cuts the position by issuing a Stop Loss order. When the price takes a real clear direction, this is where the script will be able to accumulate profits.
What makes this script unique is :
• That it is entirely developed by us, inspired by a strategy that is little known and little used in the trading world, in particular because it often involves a greater number of losing trades than winning trades.
• Its ease of reading and use. The backtesting feature was designed to clearly display the most important information in a data table directly on the chart. The user is not lost with dozens of superfluous data and can directly access the most essential information to see how the strategy has performed in the past.
• Its ease of configuration and customization. Once in the configuration window, again the user is not lost, because there is only one main parameter to modify, it is the length of the EMA, which will influence the timing of entries and exits trades. Then there are a few other non-mandatory parameters to fine-tune risk management and maximize profits. (Detailed description of the settings further down the page)
• Strategy automation made easy and fast thanks to several types of alerts which are differentiated for entries, for auto-exits and for Custom TP and SL. These alerts can be configured to send the messages by email or via Webhooks.
• The indicator has several custom options allowing its user to go further than the basic strategy. Several confirmations for entries are available as well as the possibility of adding or not a personalized TP and/or SL.
• There is no repaint, once an entry/exit symbol or drawing is displayed it doesn't change anymore. The Short, Long and auto-Exit signals appear only at the open of the candles, just after the signal was confirmed at the close of the previous candle. The custom TP and custom SL signals can appear when a candle is not yet finished, but once displayed they don't change.
█ HOW TO PROCEED
1 — Once the script is applied to your chart, it already works with its default settings. You can already see the performance of the strategy in the data table directly on the chart (in the top right corner by default).
2 — You can customize the strategy and influence the results/performance by modifying its parameters. 3 types of parameters are present and can be modified.
3 — This strategy is designed for the cryptocurrency market in priority, but you can also try it on other types of assets. It works on Futures but you can also try it on Spot market mainly for LONG trades.
4 — You can apply the script in every timeframe. We do not recommend using it below m30 because in most cases the statistics are unfavorable largely because of the fees. (This is not a financial advice but only for the use of the indicator)
█ FEATURES
Screenshot on BYBIT:EGLDUSDT Bybit Futures, H1, with default parameters, from 2022-01-01 to 2022-09-27, to show the settings window
• Settings For Backtesting
- Strategy : Choose from a drop-down list if the strategy should execute only Long trades or only Short trades or both. Default Both.
- Invest. : Choose the amount you want to invest in the simulation. Default 10000.
- Position : Choose the amount of the position (Size order) that will be used during the simulation. This will be the $ amount staked/involved for each trade entry.
Ex: If you put 20000 in position and 10000 in Invest. We consider that you use at least a leverage x2. Default 10000.
- Slipp. TP : Choose the amount in percentage of average slippage for Take Profits. This parameter makes it possible to predict a potential gap between the theoretical exit price for each TP (On the graph) and the real exit price on an exchange when implementing the strategy for real (slippage may be due to a time lag of a few seconds from execution time of the order on the exchange and/or due to the execution of a market order).
Ex: If a TP exit order of a Long trade, with entry $19000 (on BTCUSDT), is carried out in theory on the chart at $20000, in practice on the exchange the script have indeed sent an exit order at 20000 , but if the true exit price is 20050, the TP slippage is then +0.25%. Default 0.
- Slipp. SL : Choose the amount in percentage of average slippage for Stop Losses. This parameter makes it possible to predict a potential gap between the theoretical exit price for each SL (On the graph) and the real exit price on an exchange when implementing the strategy for real.
Ex: If an SL exit order of a Long trade, entry $19000 (on BTCUSDT), is carried out in theory on the chart at $18000, in practice on the exchange the script have indeed sent an exit order at 18000 $, but if the true exit price is 17950, the slippage SL is then +0.278% . Default 0.
- Fees % : Choose the percentage amount of fees applied to each trade to simulate the application of the strategy on the exchange of your choice. Applies to the entry and exit of each trade. Ex: For Binance Futures: 0.04; For Bybit futures: 0.06; For Ftx Futures: 0.075. Default 0.
- Cumulate Trades : If you check this, the Backtest will use 100% of the balance as Order Size (Position) for All or in the next X consecutive trades. Default not checked.
⚠️ Be Careful please, this option is available to show the full extent and possibilities of the algorithm when pushed to its limits thanks to the accumulation of profits (cumulative earnings), but it is a strategy that involves great risk. If a bad trade suffers a -50% loss, 50% of the account balance is lost, if the position is liquidated, the entire account balance is lost.
- All : If you check this All trades will be accumulated. Default not checked.
- Consecutive Trades : Choose the number of trades to accumulate. After X consecutive trades, the algorithm reassigns the initial order size to the current one and starts again for X consecutive trades. Minimum Value 2, Default 2.
• Settings To Optimize Performances and Risk Management
- (Main Parameter) EMA Length : Choose the length of the EMA. This value will determine the exponential moving average plot (blue line) that represents the equilibrium in this strategy. Depending on the positioning of the price around this equilibrium, the algorithm will decide to trigger Long or Short entry alerts, and exit alerts. Default 200.
- 1 - Confirm (After X Bar(s)) : If you check this, when the algorithm will detect an entry, it will wait for the number of bars you have entered to actually trigger the entry alert. Default not checked.
- Nb Bar : Enter here the number of bar you want, will be taken into account only if you check (1) Confirm (After X Bar(s)). Default 2.
- 2 - Confirm (Trend) : If you check this, when the algorithm will detect an entry, it will check that the trend is similar to the direction of the trade, if not, it will wait that the trade goes in the same direction as the trend to actually trigger the entry alert. Default not checked.
- OR/AND : This choice is taken into account only if you tick both confirmations. If you choose OR: The first of the 2 confirmations to be validated will trigger the entry alert. If you choose AND : once confirmation (1) is validated, the algorithm waits for confirmation (2) to be validated to actually trigger the entry alert. Default OR.
- Use TP / Use SL : If you check these, the algorithm will trigger personalized trade exit alerts when the price evolution has reached the amounts indicated since the trade entry. Default not Checked.
- % TP - SL : Indicate here the personalized amount in percentage that you want for your Take Profit and Stop Loss of each trade. Default 15-5.
• Settings For Appearances
- Small-size Data Table : If you check this, the data table will become smaller to free up more space on the chart to make it visually more pleasing. Default not checked.
Hide Table /
- Hide Labels / : You can check these to get a cleaner chart and focus only on what interests you in the indicator. Default not checked.
Hide Risk-Reward Areas
█ MAIN PARAMETERS TO USE
• In the default settings none of the box settings are checked. Basic strategy is made to be applied this way.
• The main parameter (the length of the EMA) is by default 200 because it is a known value that many traders rely on in many trading strategies. Moreover in this strategy it works in many cases and on different timeframes.
• To go further the user of the indicator is free to modify the parameters of the category "Leading Parameters - Risk Management" to reduce risks and to optimize profits.
• You can find below our recommendations for the EMA length value corresponding to the main timeframes.
m30 — EMA Length = 400 | 800
H1 — EMA Length = 200 | 400
H2 — EMA Length = 200 | 250
H4 — EMA Length = 100 | 200
D — EMA Length = 20 | 40
⚠️ We have chosen to recommend these settings because they will work in most cases, on most cryptoassets, but of course they will not work 100% of the time on all assets and will not always give positive results in the backtest, and they are not the most optimized parameters either. The user of the indicator is free to optimize the asset on which he wants to trade in his own way. Just as we do not give financial advice, we do not encourage to trade any asset in particular.
█ STATISTICS
The statistics presented below are an example of the results that the strategy can provide. (Reminder: These statistics are made over a past period and there is no guarantee that the same performance will reproduce in the future) .
For the demonstration we chose to apply the strategy on the Top 5 marketcap cryptos in September 2022. They are not the most favorable coins for this strategy but at least this way we don't take the most suitable assets to show wonderful and biased results. Likewise for the parameters used which are the default ones and which are not the most optimized parameters, much better results are possible. We chose Binance because it has the highest volumes and liquidity and the most historical data. We chose H1 because it is one of the most used timeframes.
BTC
Screenshot on BINANCE:BTCUSDTPERP Binance Futures, H1, with default parameters (EMA : 400), from 2022-01-01 to 2022-09-27
ETH
Screenshot on BINANCE:ETHUSDTPERP Binance Futures, H1, with default parameters (EMA : 400), from 2022-01-01 to 2022-09-27
BNB
Screenshot on BINANCE:BNBUSDTPERP Binance Futures, H1, with default parameters (EMA : 400), from 2022-01-01 to 2022-09-27
XRP
Screenshot on BINANCE:XRPUSDTPERP Binance Futures, H1, with default parameters (EMA : 200), from 2022-01-01 to 2022-09-27
ADA
Screenshot on BINANCE:ADAUSDTPERP Binance Futures, H1, with default parameters (EMA : 400), from 2022-01-01 to 2022-09-27
To show the potential of the indicator and push it to its limits, here is an example of the strategy applied for about 2 years (Up to the maximum of historical data available).
⚠️ It must be taken into account that during the period of this backtest the last Bullrun took place and it was a very favorable period for the strategy and for this altcoin (FTM), nothing ensures that it will happen again. ⚠️
FTM
Screenshot on BINANCE:FTMUSDTPERP Binance Futures, H4, with default parameters ( without cumulative earnings) and EMA : 400, start on 2020/12/03 to 2022/09/27
✅ All of the above statistics are verifiable by anyone using the indicator's backtesting system.
█ LIMITATIONS
• Despite the fact that we can see good performances when we backtest the strategy, we must take into account the fact that these are results performed in the past and that in no case does this guarantee that these same performances will be repeated again in the future.
• The automation of this strategy is made possible and is facilitated by alerts, but you must be aware of the fact that if you decide to put this strategy into practice in real life, you are solely responsible for the results that you will be able to obtain and you must be aware of the possibility at all times of partial or even total losses of your invested capital.
• Keep in mind that generating profits in trading is difficult. A strategy can perform very well at one time in the past during a period that is favorable to it, then from one day to the next it can give really bad results for several months or years.
• When backtesting a strategy, there are many factors to consider, not just trade entries to which you add a Take Profit and sometimes a Stop Loss. You must at least take into account the size of the position in relation to the capital you want to invest, the trading fees, the slippages (which can be really important depending on the exchange on which you are trading and depending on the asset you are trading), trading frequency, risk management, momentum, volumes and even more.
• This indicator has been optimized for crypto, you can try to use it on other type of assets but again, at your own risk.
The information published here on TradingView is not prohibited, doesn't constitute investment advice, and isn't created solely for qualified investors.
═════════════════════════════════════════════════════════════════════════
Important to note : our indicators with the same backtesting system are published in separate publications, because putting them together in a single script would considerably slow down the execution of the script. In addition each indicator, even when it is based on a simple technical indicator, has several options, parameters and entry/exit conditions specific to the underlying technical indicator. Finally, we want to keep the simplicity of use, configuration and understanding of our indicator by not mixing strategies that have nothing to do with each other.
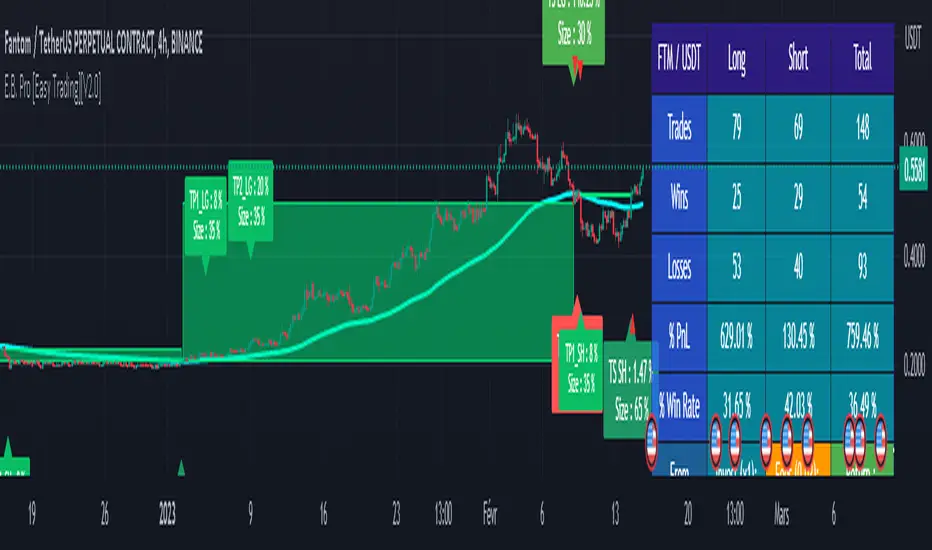
Supertrend, MA 44|6, EMA FIBS 13|21|34I have this indicator based on my strategy. This indicator is based on existing functions available in the system. I haven't added anything new. This indicator uses Supertrend, MA44|6, EMA fibs 13|21|34 combining to find a profitable trade.
- Supertrend : Indicator uses supertrend strategy with default ATR period of 10 and Factor value 3. These values can be customized based on your preferences. Uptrend is denoted by green color and downtrend by red color. You can change the colors based on your preferences.
- MA 44|6: Indicator plots moving averages of 44 and 6. These values can be customized based on your preferences. Although it is highly recommended to keep 44 as is. Value 6 can be adjusted based on your preference. Default color for uptrend is green and for downtrend is red. You can change the colors based on your preferences.
- FIBS EMA 13|21|34: Indicator plots EMA of fibbonacci numbers 13, 21,34 to identify consolidation and breakout. The periods can be adjusted but it is highly recommended not to do so. Default colors for 13,21 and 34 is Aqua, Blue and Navy respectively. You can change the colors based on your preferences.
When to take trade?
To take a trade all conditions needs to be fulfilled.
Supertrend : Always take a trade in the direction of Supertrend. It is always advisable to take trade if the trend is changing or price is taking support of resistance.
MA 44|6: Moving average 44 indicates average price of 44 last candles and 6 for last 6 candles. Price crossing MA 44 indicates change in trend. It is advisable to take trade at crossing the line above or below. If many candles closing near MA 44 then it indicates consolidation. The more far the candle closes from MA44 the better. MA 6 is used to identify when to enter or exit the trade. If candle closes away from MA 6 then you can wait for candle to start near the MA 6 line. If candle closes above/below MA 6 you can exit your trade.
Fibonacci 13|21|34: When all lines are closed it indicates consolidation. When price breakouts to either direction you can take a trade in that direction with following conditions.
Bullish Trade:
When to enter?
If candle closed above MA 44, Supertrend is uptrend and EMA Fibs are moving away and are above MA 44. The price is near to MA 6 line then you can enter into bullish trade. If price is away from MA 6 then you should wait until the price/line comes near to avoid loss.
When to exit?
Price moving in opposite direction:
You should set a stop loss when you enter the trade. The stop loss can be set below the low of the previous candle or any other strategy you have. But it is really important to set the stop loss. If price moves in opposite direction then your stop loss will hit and you will be out of the trade.
Price moving in same direction:
Once you enter the trade you can exit based on two conditions whichever suits you.
1. Exit the trade if candle closes below MA6. The drawback is you may exit too early. You can also adjust the period based on your preferences.
2. Exit the trade if candle closed below low of previous candle. The drawback is you may book less profit but you can capture the movement very well.
Bearish Trade:
When to enter?
If candle closed below MA 44, Supertrend is downtrend and EMA Fibs are moving away and are below MA 44. The price is near to MA 6 line then you can enter into bearish trade. If price is away from MA 6 then you should wait until the price/line comes near to avoid loss.
When to exit?
Price moving in opposite direction:
You should set a stop loss when you enter the trade. The stop loss can be set below the low of the previous candle or any other strategy you have. But it is really important to set the stop loss. If price moves in opposite direction then your stop loss will hit and you will be out of the trade.
Price moving in same direction:
Once you enter the trade you can exit based on two conditions whichever suits you.
1. Exit the trade if candle closes below MA6. The drawback is you may exit too early. You can also adjust the period based on your preferences.
2. Exit the trade if candle closed below low of previous candle. The drawback is you may book less profit but you can capture the movement very well.
When not to take trade?
1. If MA 44 is completely horizontal and EMA Fibs are very close to each other. This indicates that the market is consolidated and if you enter the trade you may hit stop loss very often.
Note: Please note that I am not expert and I don't take any responsibility of your profits or losses. I have created this indicator based on my knowledge and it is for study purpose. Use of this indicator is totally your responsibility. Use all your knowledge and expertise and don't totally depend on the indicator. Don't forget to use stop loss and do money management.
Happy Trading!

TAS Boxes + TAS Vega + TAS Compass [TASMarketProfile]This bundle of 3 TAS Market Profile indicators provides a shaded background that reveals directional bias, colored price bars show clearly when breakout conditions are bullish (green) or bearish (red) as well as 3 real-time dotted lines that show developing commercial balance areas known as “value areas.” These TAS Boxes 3 lines are calculated in real-time and leveraged to identify trade entry zones, trailing stops and targets. The 3 indicators can be activated and applied to a chart simultaneously (as shown) or individually in the Inputs settings tab. This description contains descriptions for all 3 indicators in the order of TAS Boxes, TAS Vega and TAS Compass so you’ll need to scroll below to get to the one you want insight.
∟ ABOUT TAS BOXES:
TAS Boxes (also known as TAS Dynamic Profile) offers a dynamic representation of developing commercial balance areas known as “value areas” and are depicted with 3 colored horizontal dotted lines. Note that the thickness of the dotted lines may be adjusted in the Style settings.
Red Line- Supply / High Value Area (HVA) / Resistance
Cyan Line- Point of Control (POC)
Green Line- Demand / Low Value Area (LVA) / Support
The TAS Boxes calculate and display in real-time intrabar and are finalized at the close of the bar. The levels may dynamically update intrabar and move and this is viewed as foreshadowing of where new value areas may be attempting to appear next. When the market is between the top and bottom lines, the market is considered “in value” or “in balance.” When the market closes outside the top or bottom lines, the market is considered out of value/unbalanced and in breakout mode in that direction.
INPUT SETTINGS FOR TAS BOXES:
There are 3 inputs for TAS Boxes and below you’ll find the default settings:
MinSignal_123: 2 (only options are 1, 2, or 3)
Length: 7
MapLength: 7
MinSignal_123 -- Measures how established the commercial interest creating the balance area must be to create a new TAS Box. In other words, this input is a measure of the strength of the box.
Length –- Takes into consideration the relative “momentum” behind the move and how extended the move must be before the formation of new TAS Box levels.
MapLength –- Specifies the number of bars of data used to create the parameters of the TAS Box.
In summary, the first two inputs determine how often a new TAS Box will appear. The higher the input numbers the less often and harder it is to establish a new TAS Box, and vice versa. The last input simply determines how much data is included in the calculation of the new TAS Box.
While we recommend the default 2-7-7 as standard inputs for most traders as they work well with any tradable instrument with sufficient liquidity, other input combinations can be explored per the user’s preferences for varying sensitivity to market conditions and how recent of market conditions. Other settings to consider are 2-14-7 or 3-4-50. We invite the user to explore the cause and effect of changing the settings but doing so only after they have mastered an understanding of the strategy deployment with the defaults. The vast majority of users do not change the default settings.
WHAT MARKETS AND TIMEFRAMES CAN BE TRADED?
TAS Boxes can be displayed on Stocks, ETFs, futures, Forex and digital currencies. TAS Boxes can be applied to a chart of any time frame (e.g. 1-minute, 5-minute, 20-minute, daily, weekly, etc.) and will also function with many other style charts such as Range and Renko. Boxes displayed on longer time frames designate more significant balance areas and can be used to locate higher probability entries. Boxes on shorter time frames can be used to identify if the tradable instrument is currently in balance or breaking out, and pinpoint entries accordingly.
INTERPRETATION AND BASIC RULES:
HEIGHT OF BOXES: The height of the TAS Boxes from top line to bottom line is a measure of volatility. When taller Boxes are present and subsequent Boxes expand, this means the volatility of the market has increased. When the height of the Boxes is smaller or contracting, then we are experiencing a market in decreasing volatility or consolidating.
WIDTH OF BOXES: The width of the TAS Boxes are a measure of significance. The longer TAS Boxes have remained at the same levels, the higher the impact they will generally have as support or resistance levels, and in the instances they are breached the market may experience fast and vertical movement.
The TAS Boxes are used to identify high-probability zones for trading both inside the range of the Boxes and also when in breakout mode outside the Boxes:
>>> When price is trading within the boundaries of a normal to wide range commercial
balance area, we can consider trades within the range of the Boxes and should look for entries around the support (green line) or resistance (red line) areas with profit targets around the POC (cyan line) or opposite boundary.
>>> When taking trades near both the upper and lower boundaries, we like to see the POC
near the middle of the box’s range. This is known as a “symmetrical box” as pictured below.
>>> If the POC is plotted tightly close to or at the same price level as the green or red line, we refer to this as forming a “wall” or "plywood" and anticipate stronger commercial interest providing support or resistance in those areas.
>>> When trading above or below the current box, price is said to be in breakout/breakdown mode. During these modes, one should be getting out of any opposing positions that are not in the direction of the breakout. Not all breakout/breakdowns are created equal. Moves outside of TAS Boxes when the vertical distance from Top to Bottom is minimal will tend to have more powerful moves, especially in instances when there are recent long-range bars in the direction of the break.
>>> When markets are breaking out or down outside of Boxes, if there is sizeable space before you encounter recent historal TAS Boxes levels that is favorable for good follow through of the move. Prior TAS Boxes levels do serve as as areas the market may encounter friction and go sideways for a period of time.
MANAGING RISK WITH STOP LOSSES:
We highly recommend the use of stop losses when trading. You can place stop losses outside of the 3 lines of TAS Boxes and trail them behind the market as new Boxes appear in the direction of the trade. You may also move trailing stops among the 3 levels to suit your risk tolerance (e.g. when market is in breakout mode, trailing it from out the Boxes to outside the POC level or opposing level). You can start your initial stop outside the opposite of all 3 lines or on the other side of the POC for lower risk.
∟ ABOUT TAS VEGA:
TAS Vega changes the coloring of the price bars to provide a more meaningful interpretation of when markets are in balance (based on TAS Boxes) or in bullish/bearish breakout mode. There are four colors generated for TAS Vega:
GREEN – Bullish breakout / Don’t be short
RED – Bearish breakdown / Don’t be long
ORANGE – 1st bar back inside TAS Boxes after prior move outside.
GRAY – Balanced, each subsequent bar after the 1st bar closes inside Boxes.
INTERPRETATION AND BASIC RULES:
WHEN VEGA IS GREEN:
Don’t be short.
Consider longs only or retain existing long positions.
Entering on the bar close above the Boxes is higher probability than intrabar entry.
Many consecutive bar closes above Boxes increases probability of eventual move higher.
WHEN VEGA IS RED:
Don’t be long.
Consider shorts only or retain existing short positions.
Entering on the bar close below the Boxes is higher probability than intrabar entry.
Many consecutive bar closes below Boxes increases probability of eventual move lower.
WHEN VEGA IS ORANGE:
If orange due to closing back inside Boxes of your initial entry Box, hold.
If orange due to closing inside a new Box appearing in the direction of your trade (higher Boxes for longs, lower Boxes for short) consider this a potential 1st tier profit-taking opportunity for multi-lot/shares positions. If single units, exit is at the trader's discretion contingent on the extent of the move.
It is prudent risk management to also use the appearance of orange closed bars as a reminder to trail your stop loss behind the new TAS Boxes levels.
Many times you may see many orange bars over a series of bars (not consecutive, however) and this means the market continues to explore both sides of TAS Boxes and is indecisive about intentions. Be cautious at these times.
WHEN VEGA IS GRAY:
Gray bars simply means the bar has closed in balance within the value area of TAS Boxes.
Gray bars are not a cue to exit a position necessarily. It is just a visual that the bar has closed in the value area. Often a trending move will have many periods that the market closes back inside new Boxes that are appearing in the direction of the trend and your largest trades will require that you simply adjust your trailing stop rather than exit with gray bars.
It is prudent risk management to also use the appearance of orange closed bars as a reminder to trail your stop loss behind the new TAS Boxes levels.
Many times you may see many orange bars over a series of bars (not consecutive, however) and this means the market continues to explore both sides of TAS Boxes and is indecisive about intentions. Be cautious at these times.
The user can adjust the coloring of the TAS Vega bars in Style settings.
∟ ABOUT TAS COMPASS:
TAS Compass changes the background color of the chart to reveal the directional bias of the market. It may be applied to charts in any timeframe for stocks, ETFs, futures, Forex and digital currencies.
There are two colors generated for TAS Compass:
GREEN – Bullish directional bias
RED – Bearish directional bias
INTERPRETATION AND BASIC RULES:
The directional bias is established (or changes) when a bar closes outside of TAS Boxes levels. When a market closes above the TAS Boxes, it will establish a bullish bias (green background) and this will remain intact until there is a close below the TAS Boxes. At the time there is a bar close below the TAS Boxes, then the TAS Compass bias changes to bearish bias (red background). This sequence continues back and forth indefinitely. When using TAS Compass, one should still follow the prudent rules and best practices of TAS Boxes as there may be opportunities to exit a losing position sooner by doing so even in the instance a TAS Compass directional bias has not changed.
TAS Compass can be used as a stand-alone visual cue on a chart, but will have accentuated value when used in conjunction with TAS Boxes and TAS Vega indicators included within this bundle.
Below is an example showing TAS Compass with TAS Boxes in order to show how the closes outside of TAS Boxes is the trigger to the background color change logic.
Trade Well My Friends,

Kinetic Scalper [BULLBYTE]KINETIC SCALPER - ADVANCED MOMENTUM & CONFLUENCE TRADING SYSTEM
A SOPHISTICATED MULTI-FACTOR ANALYSIS INDICATOR FOR PRECISION ENTRIES
The Kinetic Scalper is a comprehensive trading analysis tool that combines volume-weighted momentum calculations, multi-oscillator divergence detection, and a proprietary 15-factor confluence scoring system to identify high-probability reversal setups across all timeframes.
WHAT MAKES THIS INDICATOR ORIGINAL
This is NOT a simple mashup of existing indicators.
The Kinetic Scalper features a completely custom momentum engine called the "Kinetic Pulse" - a volume-weighted momentum oscillator with Fisher Transform normalization that fundamentally differs from standard RSI or other momentum indicators. Every component feeds into a unified algorithmic framework designed specifically for this system.
KEY INNOVATIONS:
KINETIC PULSE ENGINE
Unlike standard RSI which uses simple price changes, the Kinetic Pulse applies:
→ Volume weighting to price movements (high-volume moves carry more weight)
→ EMA smoothing instead of traditional SMA (faster response to changes)
→ Fisher Transform normalization for improved signal clarity
→ Adaptive period adjustment based on current volatility regime
→ Result: A momentum oscillator that responds to conviction, not just price noise
15-FACTOR CONFLUENCE SCORING SYSTEM
Every signal is graded based on the number of confirming factors present:
→ Momentum position (oversold/overbought extremes)
→ Momentum velocity (direction change confirmation)
→ Momentum acceleration (strength of reversal)
→ Multi-oscillator divergence (price vs. 3 oscillators)
→ Volume confirmation (above-average participation)
→ Volume delta analysis (buying vs. selling pressure)
→ Higher timeframe alignment (trend confirmation from larger timeframe)
→ Session timing (major forex session awareness)
→ Structure clearance (clear path to profit targets)
→ Support/resistance proximity (confluence with key levels)
→ Market regime filtering (trending vs. choppy conditions)
Signals are graded A+, A, or B based on how many factors align:
• CONSERVATIVE MODE: A+ requires 12+ factors, A requires 9+, B requires 7+
• BALANCED MODE: A+ requires 10+ factors, A requires 7+, B requires 5+
• AGGRESSIVE MODE: A+ requires 8+ factors, A requires 5+, B requires 3+
TRADE ANALYSIS STATE MACHINE
A sophisticated monitoring system that tracks trade conditions in real-time using:
→ 5-state analysis framework (Factors Aligned / Positive Bias / Mixed Signals / Factors Weakening / Negative Bias)
→ Hysteresis-based transitions (different thresholds to enter vs. exit states)
→ Confidence smoothing with EMA (reduces noise, prevents flip-flopping)
→ Minimum commitment periods before state changes
→ Override logic for significant events (near TP/SL, momentum reversals)
→ Result: Stable, actionable guidance that doesn't change on every bar
INSTRUMENT-AWARE CALIBRATION
Automatically detects what you're trading and applies optimized parameters:
→ Forex Majors: Standard ATR, high session weight
→ Forex Crosses: Tighter stops, moderate session weight
→ Crypto: Wider stops (1.8x multiplier), reduced session weight (24/7 markets)
→ Indices: Moderate-wide stops, high session weight
→ Commodities: Moderate stops, moderate session weight
WHAT THIS INDICATOR DOES
The Kinetic Scalper is designed to identify high-confluence reversal opportunities by analyzing multiple dimensions of market behavior simultaneously.
CORE FUNCTIONS:
1. SIGNAL GENERATION
→ Identifies potential reversal points at oversold/overbought extremes
→ Confirms with multi-oscillator divergence detection
→ Validates with volume, higher timeframe, and structural analysis
→ Filters out low-probability setups automatically
→ Grades signals based on total confluence factors present
2. AUTOMATED TRADE TRACKING
→ Calculates structure-based or ATR-based stop loss levels
→ Projects take profit targets using risk-to-reward ratios
→ Monitors live position status (P/L, distance to targets, R-multiple)
→ Tracks TP1 and TP2 hits automatically
→ Displays outcome markers (TP HIT, PARTIAL WIN, STOPPED)
3. REAL-TIME CONDITION MONITORING
→ Analyzes 6 factor categories during active trades
→ Provides confidence scoring (0-100 scale)
→ Generates actionable guidance based on current market state
→ Alerts when conditions deteriorate or improve
→ Helps with trade management decisions
4. COMPREHENSIVE MARKET ANALYSIS
→ Session detection (Asian, London, New York, Overlap)
→ Volatility regime identification (Low, Normal, High, Extreme)
→ Trend state classification (Trending Up/Down, Ranging, Transitioning)
→ Volume analysis (relative volume and delta approximation)
→ Choppiness filtering (blocks signals in ranging markets)
WHY USE THIS INDICATOR
PROBLEM: Most momentum indicators generate too many false signals at extremes.
SOLUTION: The Kinetic Scalper requires MULTIPLE confirming factors before generating a signal, dramatically reducing noise and focusing on high-confluence setups.
ADVANTAGES:
✓ QUALITY OVER QUANTITY
→ Signal grading ensures you can filter for only the highest-quality setups
→ A+ signals have 10-12+ confirming factors aligned
→ Cooldown periods prevent over-trading the same move
✓ COMPLETE TRADE FRAMEWORK
→ Entry signals with confluence justification
→ Calculated stop loss based on market structure or ATR
→ Two profit targets with clear risk-to-reward ratios
→ Live trade monitoring with factor analysis
→ Outcome tracking and visual markers
✓ ADAPTIVE TO MARKET CONDITIONS
→ Volatility-based period adjustment for momentum calculations
→ Instrument-specific ATR multipliers
→ Session awareness for forex traders
→ Higher timeframe trend filtering
→ Automatic regime detection (trending vs. choppy)
✓ TRANSPARENT METHODOLOGY
→ Every input has detailed tooltips explaining its purpose
→ Signal tooltips show exactly why a signal was generated
→ Dashboard displays all relevant market conditions
→ Factor scores are visible during trades
→ No "black box" mystery calculations
✓ NON-REPAINTING & RELIABLE
→ All signals use barstate.isconfirmed (only on closed bars)
→ Higher timeframe data uses lookahead_off with historical offset
→ No future data access or repainting behavior
→ What you see is what you get - signals don't disappear or move
HOW THE INDICATOR WORKS
SIGNAL GENERATION PROCESS:
STEP 1: MOMENTUM ANALYSIS
The Kinetic Pulse engine calculates volume-weighted momentum:
→ Price changes are weighted by volume ratio vs. 20-bar average
→ High-volume moves have more influence on the oscillator
→ Gains and losses are smoothed using EMA (not SMA like RSI)
→ Fisher Transform is applied for normalization to 0-100 scale
→ Result: Momentum reading that emphasizes conviction, not noise
STEP 2: REVERSAL DETECTION
The indicator looks for potential reversal conditions:
→ Kinetic Pulse reaching oversold zone (below dynamic lower threshold)
→ Momentum velocity turning positive after being negative (for longs)
→ OR bullish divergence detected on multiple oscillators
→ Price making lower lows while oscillators make higher lows = divergence
STEP 3: MULTI-OSCILLATOR DIVERGENCE CONFIRMATION
Divergence is validated across three sources:
→ Kinetic Pulse divergence
→ CCI divergence
→ Stochastic divergence
→ Multiple oscillators confirming divergence increases signal reliability
STEP 4: CONFLUENCE FACTOR SCORING
The system evaluates all 15 possible confirming factors:
→ Momentum position: Is pulse oversold/overbought? (+0 to +2 points)
→ Momentum direction: Is velocity reversing? (+0 to +2 points)
→ Momentum acceleration: Is reversal strengthening? (+0 to +1 point)
→ Divergence count: How many oscillators show divergence? (+0 to +2 points)
→ Volume strength: Is volume above 1.3x average? (+0 to +1 point)
→ Volume delta: Is cumulative delta positive/negative? (+0 to +1 point)
→ HTF alignment: Does higher timeframe support direction? (+0 to +2 points)
→ Session timing: Is it a prime trading session? (+0 to +1 point)
→ Clear air: Is path to targets clear of obstacles? (+0 to +1 point)
→ Structure confluence: Are we near support/resistance? (+0 to +1 point)
→ Market regime: Is market trending, not choppy? (+0 to +1 point)
Total possible score: 15 points
Minimum for signal: 3-12 points depending on sensitivity mode
STEP 5: FILTER VALIDATION
Before generating a signal, additional checks are performed:
→ Volume must be above minimum threshold (if filter enabled)
→ Higher timeframe must not oppose the signal direction (if filter enabled)
→ Target path must be clear of major resistance/support (if filter enabled)
→ Volatility must not be EXTREME (blocks signals in chaos)
→ Risk-to-reward ratio must meet minimum requirement
→ Cooldown period must have elapsed since last signal
STEP 6: SIGNAL GRADING
If all filters pass, the signal is graded based on score:
→ A+ Grade: Highest confluence (8-12+ factors depending on sensitivity)
→ A Grade: High confluence (5-9+ factors)
→ B Grade: Moderate confluence (3-7+ factors)
Only graded signals (A+, A, or B) are displayed.
STEP 7: TRADE LEVEL CALCULATION
Stop loss and targets are calculated automatically:
STOP LOSS METHODS:
• Structure-Based: Uses recent swing low/high with ATR buffer, constrained by min/max ATR limits
• ATR-Based: Pure ATR multiplier with min/max constraints
• Fixed ATR: Simple ATR multiplier, no adjustments
TARGET CALCULATION:
• TP1: Entry ± (Stop Distance × Target 1 R:R)
• TP2: Entry ± (Stop Distance × Target 2 R:R)
• Default: TP1 at 1.0 R:R (1:1), TP2 at 2.0 R:R (1:2)
STEP 8: TRADE MONITORING
Once a signal is taken, the indicator tracks:
→ Current P/L in ticks and R-multiples
→ Distance to each target in ATR units
→ Distance to stop loss in ATR units
→ TP1 hit detection (marks with label, updates lines)
→ TP2 hit detection (closes trade, marks outcome)
→ Stop loss hit detection (closes trade, differentiates partial vs. full loss)
STEP 9: FACTOR ANALYSIS (DURING TRADES)
The Trade Analysis Panel monitors 6 key factor categories:
→ Momentum: Is momentum still aligned with trade direction? (-15 to +15 pts)
→ Position: Current R-multiple position (-12 to +12 pts)
→ Volume: Is volume still supportive? (-6 to +6 pts)
→ HTF Alignment: Does HTF still support trade? (-6 to +8 pts)
→ Target Proximity: How close are we to targets? (0 to +10 pts)
→ Stop Proximity: Are we dangerously close to stop? (-15 to +3 pts)
Raw scores are summed and smoothed using 5-bar EMA to create Confidence Score (0-100).
STEP 10: STATE MACHINE TRANSITIONS
Based on smoothed confidence, the system transitions between 5 states:
→ FACTORS ALIGNED (72+): Everything looks good
→ POSITIVE BIAS (58-72): Conditions favorable
→ MIXED SIGNALS (48-58): Neutral conditions
→ FACTORS WEAKENING (22-48): Concerning signals
→ NEGATIVE BIAS (<22): Poor conditions
Hysteresis prevents rapid flipping between states (different entry/exit thresholds).
RECOMMENDED TIMEFRAMES & INSTRUMENTS
TIMEFRAME VERSATILITY:
Despite the name "Scalper," this indicator works on ALL timeframes:
✓ LOWER TIMEFRAMES (1m - 15m)
→ Ideal for: Scalping and very short-term trades
→ Expect: More signals, faster trades, requires active monitoring
→ Best for: Forex majors, liquid crypto pairs
→ Tip: Use Conservative sensitivity to reduce noise
✓ MID TIMEFRAMES (15m - 1H)
→ Ideal for: Intraday trading and day trading
→ Expect: Moderate signal frequency, 1-4 hour trade duration
→ Best for: Forex, indices, major crypto
→ Tip: Balanced sensitivity works well here
✓ HIGHER TIMEFRAMES (4H - Daily)
→ Ideal for: Swing trading and position trading
→ Expect: Fewer signals, higher-quality setups, multi-day trades
→ Best for: All instruments
→ Tip: Can use Aggressive sensitivity for more opportunities
INSTRUMENT COMPATIBILITY:
✓ FOREX MAJORS (EUR/USD, GBP/USD, USD/JPY, etc.)
→ Auto-detected or manually select "Forex Major"
→ Session filtering is highly valuable here
→ London/NY overlap generates best signals
✓ FOREX CROSSES (EUR/GBP, AUD/NZD, etc.)
→ Auto-detected or manually select "Forex Cross"
→ Slightly tighter stops applied automatically
→ Session weight reduced vs. majors
✓ CRYPTOCURRENCIES (BTC, ETH, SOL, etc.)
→ Auto-detected or manually select "Crypto"
→ Wider stops (1.8x multiplier) due to volatility
→ Session filtering less relevant (24/7 markets)
→ Works well on both spot and perpetual futures
✓ INDICES (S&P 500, NASDAQ, DAX, etc.)
→ Auto-detected or manually select "Index"
→ Session opens (NY, London) are important
→ Moderate stop widths applied
✓ COMMODITIES (Gold, Silver, Oil, etc.)
→ Auto-detected or manually select "Commodity"
→ Moderate stops and session awareness
→ Works well on both spot and futures
VISUAL ELEMENTS EXPLAINED
SIGNAL MARKERS:
The indicator offers 3 display styles (choose in settings):
• PREMIUM STYLE (Default)
→ Signal appears below/above candles with connecting line
→ Background panel with grade badge (LONG , SHORT , etc.)
→ Entry price displayed
→ Direction arrow pointing to entry candle
→ Most informative, best for detailed analysis
• MINIMAL STYLE
→ Simple dot marker with grade text next to it
→ Clean, unobtrusive design
→ Best for mobile devices or cluttered charts
→ Less visual noise
• CLASSIC STYLE
→ Diamond marker with grade badge below/above
→ Traditional indicator aesthetic
→ Good balance between info and simplicity
ALL STYLES INCLUDE:
→ Signal tooltips with complete trade plan details
→ Grade display (A+, A, or B)
→ Color coding (bright colors for A+, standard for A/B)
SIGNAL TOOLTIP CONTENTS:
When you hover over any signal marker, you'll see:
→ Signal direction and grade
→ Confluence score (actual points vs. required)
→ Reason for signal (divergence type, reversal pattern)
→ Complete trade plan (Entry, Stop, TP1, TP2)
→ Risk in ticks
→ Risk-to-reward ratios
→ Market conditions at signal (Pulse value, HTF status, Volume, Session)
TRADE LEVEL LINES:
When Trade Tracking is enabled:
• ENTRY LINE (Yellow/Gold)
→ Solid horizontal line at entry price
→ Shaded zone around entry (±ATR buffer)
→ Label showing entry price
→ Extends 20-25 bars into future
• STOP LOSS LINE (Orange/Red)
→ Dashed line at stop level
→ Label showing stop price and distance in ticks
→ Turns dotted and changes color after TP1 hit (breakeven implied)
→ Deleted when trade closes
• TAKE PROFIT 1 LINE (Blue)
→ Dotted line at TP1 level
→ Label showing price and R:R ratio (e.g., "1:1.0")
→ Turns solid and changes to green when hit
→ Deleted after TP1 hit
• TAKE PROFIT 2 LINE (Blue)
→ Solid line at TP2 level
→ Label showing price and R:R ratio (e.g., "1:2.0")
→ This is the "full win" target
→ Deleted when trade closes
OUTCOME MARKERS:
When trade milestones are reached:
• - Green label appears when first target is touched
• - Green label when second target is touched (trade complete)
• - Red label if stop loss hit before any target
• - Orange label if TP1 hit but then stopped out
PREVIOUS DAY LEVELS:
If enabled (Show Previous Day Levels):
• PDH (Previous Day High) - Solid red/orange line
→ Label shows "PDH: "
→ Useful resistance reference for intraday trading
• PDL (Previous Day Low) - Solid green line
→ Label shows "PDL: "
→ Useful support reference for intraday trading
BACKGROUND TINTS:
Subtle background colors indicate states:
→ Light green tint: Active long position being tracked
→ Light red tint: Active short position being tracked
→ Light orange tint: Extreme volatility warning (signals blocked)
DASHBOARD GUIDE
The indicator features TWO dashboard panels:
━━━━━━━━━━━━━━━━━━━━━━━━━━━━━━━━━━━━━━━━━━━━━━━━━━━━━━━━━━━━━━━━━━━━━━━━━━━━━
MAIN DASHBOARD (Top Right by default)
━━━━━━━━━━━━━━━━━━━━━━━━━━━━━━━━━━━━━━━━━━━━━━━━━━━━━━━━━━━━━━━━━━━━━━━━━━━━━
WHEN NO TRADE IS ACTIVE:
→ Bias: Current market bias (BULLISH, BEARISH, NEUTRAL, LEAN LONG/SHORT)
→ Based on Kinetic Pulse position and velocity
→ Helps you understand overall momentum direction
→ Pulse: Current Kinetic Pulse value (0-100 scale)
→ <30 = Oversold (potential long setups developing)
→ >70 = Overbought (potential short setups developing)
→ 40-60 = Neutral zone
→ Volatility: Current volatility regime (LOW, NORMAL, HIGH, EXTREME)
→ Calculated from ATR ratio vs. 100-period average
→ EXTREME volatility blocks all signals (too chaotic)
→ Trend: Market state classification
→ TREND UP / TREND DOWN: ADX > 25, directional movement clear
→ RANGING: ADX < 20, choppy conditions
→ TRANSITIONING: ADX 20-25, developing conditions
→ VOLATILE: Extreme ATR regime
→ Session: Current forex session
→ ASIAN (00:00-08:00 UTC)
→ LONDON (07:00-16:00 UTC)
→ NEW YORK (13:00-22:00 UTC)
→ LDN/NY (13:00-16:00 UTC) - Overlap period, highest volatility
→ OFF-HOURS: Outside major sessions
→ Volume: Current volume vs. 20-bar average
→ Displayed as multiplier (e.g., "1.45x" = 45% above average)
→ Green if >1.3x (high volume, bullish for signal quality)
→ Red if <0.8x (low volume, bearish for signal quality)
→ HTF: Higher timeframe analysis status
→ BULLISH: HTF momentum supports longs
→ BEARISH: HTF momentum supports shorts
→ NEUTRAL: No clear HTF direction
→ Best Score: Highest confluence score currently available
→ Shows both long and short scores
→ Format: " / "
→ Example: "8/7 " means long score is 8, threshold is 7, long is leading
→ Helps you anticipate which direction might signal next
→ PDH/PDL: Previous day high and low prices
→ Quick reference for intraday support/resistance
WHEN TRADE IS ACTIVE:
→ Trade: Direction and grade (e.g., "LONG ")
→ Entry: Entry price of current trade
→ P/L: Current profit/loss
→ Shown in ticks and R-multiples
→ Format: "+45 | +0.75R" or "-20 | -0.35R"
→ Green when positive, red when negative
→ TP1: First target status
→ Shows price and distance if not hit
→ Shows "HIT" in green if reached
→ TP2: Second target price and distance
→ Stop: Stop loss price and current distance from stop
→ Bars: Number of bars since entry (trade duration)
━━━━━━━━━━━━━━━━━━━━━━━━━━━━━━━━━━━━━━━━━━━━━━━━━━━━━━━━━━━━━━━━━━━━━━━━━━━━━
TRADE ANALYSIS PANEL (Bottom Left by default)
━━━━━━━━━━━━━━━━━━━━━━━━━━━━━━━━━━━━━━━━━━━━━━━━━━━━━━━━━━━━━━━━━━━━━━━━━━━━━
This panel provides algorithmic analysis of market conditions. It does NOT provide investment advice or recommendations.
WHEN NO TRADE IS ACTIVE:
Shows scanning status and signal readiness:
→ Long/Short Readiness Gauges
→ Visual bar showing proximity to signal threshold
→ Score display (e.g., "8/7" means 8 points scored, 7 needed)
→ "RDY" indicator when threshold reached
→ Status Messages
→ "Scanning for setups..." - Normal scanning mode
→ "Long setup ready - cooldown: X bars" - Signal qualified but in cooldown
→ "Oversold conditions - watch for reversal" - Setup developing
→ "Choppy conditions detected" - Warning about market state
→ "Extreme volatility - signals blocked" - Safety filter active
WHEN TRADE IS ACTIVE:
Header shows current analysis state:
→ FACTORS ALIGNED (Green) - Everything looks good, confidence 72+
→ POSITIVE BIAS (Light Green) - Conditions favorable, confidence 58-72
→ MIXED SIGNALS (Blue) - Neutral conditions, confidence 48-58
→ FACTORS WEAKENING (Orange) - Concerning signals, confidence 22-48
→ NEGATIVE BIAS (Red) - Poor conditions, confidence <22
Confidence Score:
→ Displayed as percentage (0-100%)
→ Visual gauge (|||||.....)
→ Trend indicator (Rising, Falling, Stable)
→ Shows momentum of confidence change
Factor Breakdown (if enabled):
Shows 6 factor categories with individual scores:
→ Momentum: Is momentum aligned with trade? (-15 to +15 points)
→ Positive if velocity matches trade direction
→ Negative if momentum opposes trade
→ Position: Current R-multiple analysis (-12 to +12 points)
→ Positive if trade is in profit
→ Negative if underwater
→ Score increases as profit grows
→ Volume: Is volume supportive? (-6 to +6 points)
→ Positive if volume above average
→ Negative if volume weak
→ HTF Align: Higher timeframe status (-6 to +8 points)
→ Positive if HTF still supports trade direction
→ Negative if HTF turned against trade
→ Target: Proximity to profit targets (0 to +10 points)
→ Higher score when approaching targets
→ Bonus if TP1 already hit and near TP2
→ Stop Dist: Distance from stop loss (-15 to +3 points)
→ Negative if dangerously close to stop (<0.3 ATR)
→ Positive if well away from stop (>1.5 ATR)
Each factor shows:
• Score value with +/- indicator
• Trend symbol: + (improving), - (deteriorating), = (stable)
• Visual gauge
Guidance Messages:
→ "TARGET 2 APPROACHING" - TP2 within 0.3 ATR
→ "TARGET 1 APPROACHING" - TP1 within 0.3 ATR
→ "STOP PROXIMITY WARNING" - Stop within 0.3 ATR
→ "Factors aligned - Holding" - Positive state, stay in trade
→ "Conditions favorable" - Still looking good
→ "Conditions mixed - " - Neutral assessment
→ "Factors deteriorating" - Warning of weakening setup
→ "Confluence weakening - secure gains" - Consider exit if profitable
COMPACT MODE (Mobile-Friendly):
→ Reduces panel size by showing only essential info
→ Factor icons instead of full breakdowns
→ Simplified guidance messages
→ Perfect for smaller screens
SETTINGS GUIDE
MASTER SETTINGS:
Instrument Type
→ Purpose: Optimizes ATR multipliers and session weights for your asset
→ Options: Auto-Detect (recommended), Forex Major, Forex Cross, Crypto, Index, Commodity
→ Default: Auto-Detect
→ When to change: If auto-detection is incorrect for your symbol
Signal Sensitivity
→ Purpose: Controls how many factors required before generating signals
→ Options:
• Conservative: Requires 12+ for A+, 9+ for A, 7+ for B (fewer, highest quality)
• Balanced: Requires 10+ for A+, 7+ for A, 5+ for B (recommended)
• Aggressive: Requires 8+ for A+, 5+ for A, 3+ for B (more frequent)
→ Default: Balanced
→ When to change: If you want fewer signals (Conservative) or more opportunities (Aggressive)
Enable Trade Signals
→ Purpose: Master on/off switch for signal generation
→ Default: ON
→ When to disable: If you only want to use the analysis dashboards without signals
Enable Trade Tracking
→ Purpose: Tracks active trades and monitors conditions until TP/SL hit
→ Default: ON
→ When to disable: If you manage trades manually and don't want automatic tracking
Show Entry/Stop/Target Levels
→ Purpose: Displays trade plan lines and labels on chart
→ Default: ON
→ When to disable: If you prefer clean charts or manage levels yourself
DISPLAY SETTINGS:
Color Theme
→ Purpose: Optimizes colors for your chart background
→ Options: Dark (for dark charts), Light (for light charts)
→ Default: Dark
Signal Display Style
→ Purpose: Visual style of signal markers
→ Options:
• Premium: Badge with line and background panel (most detailed)
• Minimal: Simple dot with grade text (cleanest)
• Classic: Diamond marker with badge (traditional)
→ Default: Premium
Signal Distance
→ Purpose: How far signal labels appear from price bars (in ATR units)
→ Range: 0.5 to 10.0
→ Default: 2.0
→ When to adjust: Increase to 3.0-4.0 if signals hide behind candle wicks
TP/SL Label Distance
→ Purpose: Spacing of price labels to prevent overlap
→ Range: 0.5 to 5.0
→ Default: 1.5
Show Previous Day Levels
→ Purpose: Display PDH/PDL reference lines
→ Default: ON
→ Best for: Intraday traders who respect previous day levels
MAIN DASHBOARD:
Show Main Dashboard
→ Purpose: Toggle visibility of market conditions table
→ Default: ON
Main Dashboard Position
→ Options: Top Right, Top Left, Bottom Right, Bottom Left
→ Default: Top Right
→ When to change: To avoid overlap with TradingView's built-in panels
TRADE ANALYSIS PANEL:
Show Trade Analysis Panel
→ Purpose: Toggle factor analysis dashboard
→ Default: ON
Analysis Panel Position
→ Options: Top Right, Top Left, Bottom Right, Bottom Left, Middle Right, Middle Left
→ Default: Bottom Left
→ Recommended: Bottom Right or Middle Right to avoid overlap with Main Dashboard
Compact Mode
→ Purpose: Reduces panel size for mobile or smaller screens
→ Default: OFF
→ When to enable: Mobile trading, small screens, or minimalist preference
Show Factor Details
→ Purpose: Displays individual factor scores vs. overall confidence only
→ Default: ON
→ When to disable: For more compact view showing only state and confidence
RISK MANAGEMENT:
Stop Loss Method
→ Purpose: How stop loss distance is calculated
→ Options:
• Structure-Based: Uses swing highs/lows with ATR buffer (recommended)
• ATR-Based: Pure ATR multiplier with min/max constraints
• Fixed ATR: Simple multiplier, no adjustments
→ Default: Structure-Based
→ Impact: Structure-Based respects market geometry but constrains within safe limits
ATR Stop Multiplier
→ Purpose: Multiplier for ATR-based stop calculation
→ Range: 0.5 to 3.0
→ Default: 1.5
→ When to adjust:
• Increase to 2.0-2.5 for more breathing room (fewer false stops)
• Decrease to 1.0-1.2 for tighter stops (but more stop-outs)
Maximum Stop Distance (ATR)
→ Purpose: Cap on stop width to prevent excessive risk
→ Range: 1.0 to 5.0
→ Default: 2.5
→ Impact: If structure-based stop exceeds this, ATR-based stop is used instead
Minimum Stop Distance (ATR)
→ Purpose: Floor on stop width to avoid noise-induced stops
→ Range: 0.2 to 1.0
→ Default: 0.5
→ Impact: Prevents stops too tight to survive normal volatility
Target 1 Risk/Reward Ratio
→ Purpose: R:R for first profit target
→ Range: 0.5 to 2.0
→ Default: 1.0 (1:1 ratio)
→ Common values: 1.0 for quick profit taking, 1.5 for patient trading
Target 2 Risk/Reward Ratio
→ Purpose: R:R for second profit target (full win)
→ Range: 1.0 to 4.0
→ Default: 2.0 (1:2 ratio)
→ Common values: 2.0-3.0 for balanced risk/reward
Minimum R:R Required
→ Purpose: Filters out signals with poor risk/reward
→ Range: 0.5 to 2.0
→ Default: 1.0
→ Impact: Signals where potential reward doesn't meet this ratio are rejected
→ WARNING: Always ensure your position sizing means a stop loss = no more than 1-2% of your account, regardless of R:R ratio
SIGNAL FILTERS:
Session Awareness
→ Purpose: Weights signals higher during major forex sessions
→ Default: ON
→ Impact: Doesn't block signals, but session quality factors into scoring
→ Best for: Forex traders
Session Timezone
→ Purpose: Timezone for session calculations
→ Options: UTC, America/New_York, Europe/London, Asia/Tokyo, Asia/Hong_Kong
→ Default: UTC
→ When to change: Match your broker's server time
Higher Timeframe Alignment
→ Purpose: Checks HTF momentum before generating signals
→ Default: ON
→ Impact: Filters counter-trend signals, improves quality
→ Recommended: Keep enabled
HTF Timeframe
→ Purpose: Which higher timeframe to check
→ Default: Auto (blank field)
→ Auto selection:
• 1m chart → 5m HTF
• 5m chart → 15m HTF
• 15m chart → 1H HTF
• 1H chart → 4H HTF
• 4H+ chart → Daily HTF
→ Manual override: Enter any timeframe (e.g., "60" for 1-hour)
Volume Confirmation
→ Purpose: Requires above-average volume for signals
→ Default: ON
→ Impact: Filters low-liquidity false signals
→ Recommended: Keep enabled
Minimum Volume Ratio
→ Purpose: Volume threshold vs. 20-bar average
→ Range: 0.3 to 2.0
→ Default: 0.8 (80% of average)
→ When to adjust:
• Increase to 1.2-1.5 for only high-volume signals
• Decrease to 0.5-0.7 for more permissive filtering
Structure Clearance Check
→ Purpose: Ensures clear path to targets (no nearby resistance/support)
→ Default: ON
→ Impact: Prevents trades with immediate obstacles
→ Recommended: Keep enabled
Minimum Bars Between Signals
→ Purpose: Cooldown period after each signal
→ Range: 1 to 10
→ Default: 3
→ Impact: After a signal, this many bars must pass before another in same direction
→ When to adjust:
• Increase to 5-7 to prevent over-trading
• Decrease to 1-2 for faster re-entries
ADVANCED TUNING:
Momentum Period
→ Purpose: Base period for Kinetic Pulse calculation
→ Range: 5 to 30
→ Default: 14
→ When to adjust:
• Lower (8-10): More responsive, noisier
• Higher (18-21): Smoother, slower to react
→ Note: If Adaptive Period enabled, this is adjusted automatically
Adaptive Period
→ Purpose: Auto-adjusts momentum period based on volatility
→ Default: ON
→ Impact: Shortens period in high volatility, lengthens in low volatility
→ Recommended: Keep enabled for automatic optimization
Divergence Lookback
→ Purpose: How far back to search for divergence patterns
→ Range: 10 to 60
→ Default: 30
→ When to adjust:
• Shorter (15-20): Only recent divergences
• Longer (40-50): Catches older divergences (may be less relevant)
Swing Detection Bars
→ Purpose: Bars required on each side to confirm swing high/low
→ Range: 2 to 7
→ Default: 3
→ Impact on stops:
• Lower (2-3): More swing points, potentially tighter stops
• Higher (5-7): Only major swings, wider stops
Choppiness Index Threshold
→ Purpose: Threshold above which market considered choppy
→ Range: 38.2 to 80.0
→ Default: 61.8
→ Impact:
• Lower (50-55): Stricter quality filter (fewer signals in ranging markets)
• Higher (65-70): More permissive (allows signals in choppier conditions)
HOW TO READ SIGNALS
SIGNAL ANATOMY:
When a signal appears, you'll see:
1. DIRECTIONAL MARKER
→ Arrow, dot, or diamond pointing to entry candle (depends on style)
→ Positioned below price for LONG, above price for SHORT
→ Connected to price with line (Premium style)
2. GRADE BADGE
→ Displays signal quality: LONG , SHORT , etc.
→ Color coding:
• Bright green/cyan for A+ longs
• Standard green for A/B longs
• Bright pink/magenta for A+ shorts
• Standard red for A/B shorts
3. ENTRY PRICE (Premium style only)
→ Shows exact entry price at signal generation
4. TOOLTIP (all styles)
→ Hover over signal to see complete trade plan
→ Includes: Entry, Stop, TP1, TP2, Risk, R:R ratios, market conditions, signal reason, confluence score
INTERPRETING GRADES:
→ A+ SIGNALS (Highest Quality)
• 8-12+ confirming factors aligned
• Multiple divergences OR strong momentum reversal
• HTF alignment + volume + session timing + clear structure
• These are your highest-probability setups
• Recommended action: Give these priority, consider larger position size
→ A SIGNALS (High Quality)
• 5-9+ confirming factors aligned
• Good confluence, most key factors present
• Missing 1-2 optimal conditions
• These are still quality trades
• Recommended action: Standard position size, solid setups
→ B SIGNALS (Moderate Quality)
• 3-7+ confirming factors aligned
• Minimum viable confluence
• May be missing HTF alignment, volume, or session timing
• Higher variance outcomes
• Recommended action: Smaller position size or skip if conservative
SIGNAL NARRATIVE:
Each signal tooltip includes a narrative explaining WHY it was generated:
→ "Multi-divergence at oversold extreme"
• Multiple oscillators showing bullish divergence
• Kinetic Pulse in oversold zone
• High-quality reversal setup
→ "Bullish divergence near support"
• Divergence detected
• Price near key support level (swing low or PDL)
• Structure confluence
→ "Momentum reversal with HTF alignment"
• Kinetic Pulse velocity reversing
• Higher timeframe supports direction
• Strong trend-following setup
→ "Oversold momentum reversal"
• Extreme Kinetic Pulse reading reversing
• May not have divergence but strong momentum shift
READING THE TRADE PLAN:
Every signal comes with a complete trade plan:
→ ENTRY: The close price of the signal candle
• This is where the signal triggered
• If using limit orders, you might improve on this price
→ STOP: Calculated stop loss level
• Based on your Stop Loss Method setting
• Distance shown in ticks
• Risk tolerance: Ensure this represents ≤1-2% of your account
→ TP1: First profit target
• Default: 1:1 risk-reward
• This is your partial profit or first exit
• Consider taking 50% off at TP1
→ TP2: Second profit target
• Default: 1:2 risk-reward
• This is your "full win" target
• Hold remaining position for this level
SIGNAL FREQUENCY EXPECTATIONS:
Frequency varies by timeframe, sensitivity, and market conditions:
→ AGGRESSIVE MODE
• Lower timeframes (1m-5m): 5-15 signals per day
• Mid timeframes (15m-1H): 2-5 signals per day
• Higher timeframes (4H-D): 1-3 signals per week
→ BALANCED MODE (Default)
• Lower timeframes: 3-8 signals per day
• Mid timeframes: 1-3 signals per day
• Higher timeframes: 2-5 signals per week
→ CONSERVATIVE MODE
• Lower timeframes: 1-4 signals per day
• Mid timeframes: 0-2 signals per day
• Higher timeframes: 1-3 signals per week
Note: Frequency also depends on market volatility and trending vs. ranging conditions.
Example - Kinetic Scalper Trade Sequence
Here's an example showing the complete trade lifecycle with all dashboard transitions, annotations, and descriptions.
INSTRUMENT & TIMEFRAME DETAILS
Symbol: Nifty 50 Index (NSE)
Date: December 15, 2025
Session: London session (active trading hours)
Instrument Type: Index (auto-detected)
TRADE SEQUENCE BREAKDOWN
SCREENSHOT 1: Pre-Signal Setup Building (Image 1)
Time: ~12:00-14:30 UTC+5:30(approx.)
Price Action: Uptrend showing signs of exhaustion near 26,200
Market State: Price at session highs
Main Dashboard (Top Right):
- Bias: LEAN SHORT
- Pulse: 58.9 (approaching overbought)
- Volatility: NORMAL
- Trend: TRANSITIONING
- Session: LONDON (favorable timing)
- Volume: 0.98x (slightly below average)
- HTF: BULLISH (caution for counter-trend)
- Best Score: 9/5 (Short score building)
- PDH/PDL: 26098.25 / 25938.95
Trade Analysis Panel (Bottom Left):
- Status: NO ACTIVE TRADE
- Long Score: 5/5 (RDY)
- Short Score: 9/5 (RDY)
- Panel Message: "Short pattern developing - score: 9"
Description :
Setup Development Phase: The indicator identifies a potential short opportunity as price reaches the previous day's high. The short confluence score has climbed to 9/15 points, meeting the 'Balanced' sensitivity threshold for a Grade B signal. Notice the 'LEAN SHORT' bias and the Kinetic Pulse reading of 58.9 approaching overbought territory. The Trade Analysis panel shows 'Short pattern developing' with 9/5 factors aligned. Key factors: momentum approaching reversal zone, price at resistance (PDH), and London session providing favorable conditions.
SCREENSHOT 2: Signal Generated & Trade Entered (Image 2)
Time: ~13:00 UTC+5:30 (signal bar)
Entry Price: 26,184.65
Signal Grade: Grade
Main Dashboard (Top Right):
- Trade: SHORT
- Entry: 26184.65
- P/L: 5.95 pts | +0.2R (early positive movement)
- TP1: 26157.00 (33.2 pts away)
- TP2: 26129.35 (60.84 pts away)
- Stop: 26212.30 (22.1 pts away)
- Bars: 1 (just entered)
Trade Analysis Panel (Bottom Left):
- Header: TRADE ANALYSIS
- Status Bar: "Conditions mixed - improving 57%"
- Confidence: 57% RISING
- Factor Breakdown:
- Momentum: -4 (velocity not yet aligned)
- Position: +4 (slight profit)
- Volume: +2 = (volume present)
- HTF Align: +2 = (not strongly aligned)
- Target: +0 - (far from TP)
- Stop Dist: +3 - (good distance)
- Bottom Status: "Conditions mixed - Monitoring"
- Disclaimer: "Analysis only - Not financial advice"
Description:
Signal Activation: A Grade A short signal triggers at 26,184.65 after the short confluence score reached qualifying levels. The indicator places a structure-based stop loss at 26,212.30 (27.65 points risk) with dual targets at 1:1 and 1:2 risk-reward ratios.
The Trade Analysis Panel immediately begins monitoring with an initial confidence score of 57% - classified as 'MIXED SIGNALS' but showing a 'RISING' trend. Factor analysis reveals: momentum not yet aligned (-4 points as price just reversed), position slightly favorable (+4 points already +0.2R), volume adequate (+2), HTF showing weak alignment (+2 as we're counter-trend), stop well-placed (+3), but targets still distant (0 points).
Notice how the Main Dashboard switches from market scanning mode to active trade tracking, now displaying entry price, live P/L in both points (5.95 pts) and R-multiples (+0.2R), and distances to all key levels. The analysis panel provides real-time factor scoring to help monitor trade health.
SCREENSHOT 3: TP1 Hit - Trade Performing Well (Image 3)
Time: ~14:20 UTC+5:30(approx)
Price: ~26,154 (TP1 zone)
Bars in Trade: 29
Main Dashboard (Top Right):
- Trade: SHORT
- Entry: 26184.65
- P/L: 30.85 pts | +1.12R (excellent progress)
- TP1: HIT (displayed in green)
- TP2: 26129.35 (24.44 pts away)
- Stop: 26212.30 (58.5 pts away - well protected)
- Bars: 29
Trade Analysis Panel (Bottom Left):
- Header: TRADE ANALYSIS
- Status Bar: "Multiple factors positive"
- Confidence: 78% RISING
- Factor Breakdown:
- Momentum: +8 = (ALIGNED)
- Position: +8 + (strong profit zone)
- Volume: +2 + (continued support)
- HTF Align: +8 = (now strongly aligned)
- Target: +10 + (TP1 achieved, approaching TP2)
- Stop Dist: +3 + (excellent cushion)
- Bottom Status: "Multiple factors positive"
- Visual State: Green background (FACTORS ALIGNED state)
Description:
Trade Execution Phase - First Target Achieved: After 29 bars , price reaches the first take-profit target at 26,157.00. The ' ' marker confirms partial profit taking. Current P/L shows +30.85 points (+1.12R), exceeding the initial 1:1 risk-reward.
The Trade Analysis Panel shows dramatic improvement - confidence has surged to 78% (FACTORS ALIGNED state) with most factors now positive:
- Momentum factor improved to +8 (velocity aligned with trade direction)
- Position factor at +8 (over +1R profit zone)
- HTF Align jumped to +8 (higher timeframe now confirming the move)
- Target factor maxed at +10 (TP1 achieved, TP2 within reach)
- Stop Distance at +3 (58.5 points cushion providing safety)
Notice the panel status displays 'Multiple factors positive' with a green-tinted background, indicating optimal trade conditions. The confidence trend shows 'RISING' suggesting continued momentum. With TP1 secured and only 24.44 points to TP2, the trade is well-positioned for a full 1:2R win.
SCREENSHOT 4: TP2 Reached - Trade Complete (Image 4)
Time: ~15:00+ UTC+5:30
Final Exit: 26,129.35 (TP2)
Final Result: Full TP2 win
Main Dashboard (Top Right):
- Bias: NEUTRAL (reverted to scanning mode)
- Pulse: 45.2 (returned to neutral zone)
- Volatility: NORMAL
- Trend: TREND DOWN (confirmed the move)
- Session: LONDON
- Volume: 1.26x (increased as move developed)
- HTF: BEARISH (fully aligned post-trade)
- Best Score: 5/5 (neutral after completion)
Trade Analysis Panel (Bottom Left):
- Status: NO ACTIVE TRADE (reverted)
- Long Score: 5/5 (RDY)
- Short Score: 5/5 (RDY)
- Panel Message: "Scanning - prime session active"
- Light blue/cyan background (back to scanning mode)
Description:
Trade Completion - Full Target Achieved: The short trade reaches its second take-profit target at 26,129.35, securing a complete 1:2 risk-reward win. The ' ' marker confirms the exit. Final results:
- Entry: 26,184.65
- Exit: 26,129.35
- Profit: 55.30 points (approximately +2.0R)
- Outcome: Full TP2 success
Post-Trade Analysis: After trade closure, the indicator automatically returns to market scanning mode. The Main Dashboard reverts to showing market conditions rather than trade metrics. Notice how the 'Trend' now displays 'TREND DOWN' - confirming the move we captured. Volume increased to 1.26x during the winning move, validating the signal quality.
The Trade Analysis Panel switches back to 'NO ACTIVE TRADE' status and resumes displaying long/short setup scores. The confidence-based factor monitoring was instrumental throughout the trade:
- Initial entry at 57% confidence (MIXED SIGNALS)
- Peak confidence of 78% at TP1 (FACTORS ALIGNED)
- Real-time factor updates helped confirm trade validity
This example demonstrates the indicator's complete workflow: setup identification → signal generation → entry execution → live trade monitoring → systematic exit at targets.
KEY FEATURES DEMONSTRATED
1. Dual Dashboard System
- Main Dashboard: Market conditions (scanning) → Trade metrics (active position)
- Analysis Panel: Setup scores (scanning) → Factor-based confidence (in-trade)
2. Visual Trade Management
- Color-coded entry zones (yellow)
- Risk levels clearly marked (red dashed stop)
- Profit targets with R:R ratios labeled
- Achievement markers ( , )
3. Real-Time Factor Analysis
- 6-factor scoring system (Momentum, Position, Volume, HTF, Target, Stop Dist)
- Confidence percentage with trend indicators
- State machine (MIXED → FACTORS ALIGNED)
- Hysteresis prevents false state changes
4. Risk Management
- Structure-based stop placement (respects swing highs)
- Multiple take-profit levels (1:1 and 1:2 R:R)
- Live P/L tracking in points and R-multiples
- Distance monitoring to all key levels
This complete example showcases the indicator's progression from setup identification through trade completion, demonstrating how the dual-dashboard system and factor-based analysis provide continuous trade guidance. The structured stop-loss and dual-target approach delivered the planned 1:2 risk-reward ratio with systematic, rule-based execution.
ALERT SYSTEM
The indicator includes 9 built-in alert conditions:
SIGNAL ALERTS:
→ High-Grade Long Signal (A+)
• Triggers only on A+ long signals
• For traders who want only the highest-quality longs
• Message: "KINETIC SCALPER: LONG @ "
→ High-Grade Short Signal (A+)
• Triggers only on A+ short signals
• For traders who want only the highest-quality shorts
• Message: "KINETIC SCALPER: SHORT @ "
→ Long Signal
• Triggers on ANY qualified long signal (A+, A, or B)
• For traders who want all long opportunities
• Message: "KINETIC SCALPER: LONG @ "
→ Short Signal
• Triggers on ANY qualified short signal
• For traders who want all short opportunities
• Message: "KINETIC SCALPER: SHORT @ "
TRADE MANAGEMENT ALERTS:
→ TP1 Hit
• Triggers when first profit target is reached
• Useful for partial profit taking notifications
• Message: "KINETIC SCALPER: TP1 REACHED"
→ TP2 Reached
• Triggers when second profit target is reached
• Trade is complete, full win achieved
• Message: "KINETIC SCALPER: TP2 REACHED"
→ Stop Loss Hit
• Triggers when stop loss is reached
• Important for trade management and risk tracking
• Message: "KINETIC SCALPER: STOP LOSS"
ANALYSIS STATE ALERTS:
→ Analysis State: Negative Bias
• Triggers when factor analysis enters "Negative Bias" state
• Warning that trade conditions are deteriorating
• Consider reducing position or preparing to exit
• Message: "KINETIC SCALPER: Analysis state changed to NEGATIVE BIAS"
→ Analysis State: Factors Weakening
• Triggers when factor analysis enters "Factors Weakening" state
• Caution that confluence is diminishing
• Monitor trade closely
• Message: "KINETIC SCALPER: Analysis state changed to FACTORS WEAKENING"
HOW TO SET UP ALERTS:
1. Click the "Create Alert" button in TradingView
2. Condition: Select "Kinetic Scalper "
3. Choose your desired alert from the dropdown
4. Configure your alert options:
→ Once Per Bar Close (recommended for non-repainting)
→ Frequency: Once Per Bar Close or Only Once
5. Set expiration and notification methods (popup, email, webhook, etc.)
6. Create alert
RECOMMENDED ALERT STRATEGY:
For active traders:
→ Set "Long Signal" and "Short Signal" alerts for all opportunities
→ Set "TP1 Hit", "TP2 Reached", and "Stop Loss Hit" for trade management
→ Consider "Analysis State: Negative Bias" for trade monitoring
For selective traders:
→ Set only "High-Grade Long Signal (A+)" and "High-Grade Short Signal (A+)"
→ Focus on the absolute highest-quality setups
→ Set TP/SL alerts for position management
USAGE TIPS & BEST PRACTICES
SIGNAL SELECTION:
✓ GRADE MATTERS
→ A+ signals have statistically more confluence factors
→ If you're conservative, trade only A+ signals
→ B signals can work but require more discretion
✓ CONFLUENCE WITH YOUR ANALYSIS
→ Use this indicator as CONFIRMATION, not sole decision criteria
→ Combine with your own support/resistance analysis
→ Check for fundamental events (news, economic data)
→ Respect major round numbers and psychological levels
✓ SESSION TIMING (Forex)
→ Best signals often occur during London/NY overlap
→ Avoid signals 10 minutes before major news releases
→ Asian session signals can be valid but lower liquidity
✓ TIMEFRAME CONFLUENCE
→ If you get an A+ signal on 15m, check if 1H chart agrees
→ Higher timeframe confirmation adds conviction
→ Avoid signals that oppose the daily/4H trend
TRADE MANAGEMENT:
✓ POSITION SIZING
→ ALWAYS size positions so stop loss = 1-2% of account
→ Never risk more than you can afford to lose
→ Smaller position on B signals, standard on A, larger on A+ (within limits)
✓ PARTIAL PROFIT TAKING
→ Consider taking 50% off at TP1
→ Move stop to breakeven after TP1 hit
→ Let remaining position run to TP2
✓ TRAILING STOPS
→ The indicator doesn't auto-trail stops (manual decision)
→ After TP1, you might manually move stop to entry (breakeven)
→ Consider ATR-based trailing stop for runners
✓ WATCH THE ANALYSIS PANEL
→ If state changes to "Factors Weakening" while in profit, consider exit
→ "Negative Bias" during a trade is a strong warning
→ "Factors Aligned" confirms your trade thesis is still valid
RISK MANAGEMENT:
✓ NEVER IGNORE STOPS
→ The calculated stop is there for a reason
→ Moving stop further away increases risk exponentially
→ If stopped out, accept it and wait for next setup
✓ AVOID REVENGE TRADING
→ If you get stopped out, resist urge to immediately re-enter
→ Signal cooldown helps with this
→ Wait for next qualified signal
✓ RESPECT VOLATILITY WARNINGS
→ If indicator shows "EXTREME" volatility, signals are blocked for a reason
→ Don't force trades in chaotic conditions
→ Wait for regime to normalize
✓ CORRELATION RISK
→ Be aware of correlation if trading multiple pairs
→ EUR/USD and GBP/USD are highly correlated
→ Don't stack risk on correlated instruments
OPTIMIZATION:
✓ START WITH DEFAULTS
→ Default settings are well-tested
→ Don't over-optimize for recent market behavior
→ Give settings at least 20-30 trades before judging
✓ TIMEFRAME-SPECIFIC ADJUSTMENTS
→ Lower timeframes: Consider increasing Signal Distance to 3.0-4.0
→ Higher timeframes: ATR Stop Multiplier might go to 2.0-2.5
→ Crypto: Ensure Instrument Type is set to "Crypto" for proper stops
✓ SENSITIVITY CALIBRATION
→ Too many signals? Switch to Conservative
→ Missing good setups? Try Balanced or Aggressive
→ Quality > Quantity always
✓ KEEP A JOURNAL
→ Track which signal grades work best for you
→ Note which sessions produce best results
→ Review stopped trades for patterns
THINGS TO AVOID:
✗ DON'T chase signals after several bars have passed
✗ DON'T ignore the stop loss or move it further away
✗ DON'T overtrade by taking every B-grade signal
✗ DON'T trade during major news if you're not experienced
✗ DON'T use this as your only analysis tool
✗ DON'T expect 100% win rate (no indicator has this)
✗ DON'T risk more than 1-2% per trade regardless of signal grade
UNDERSTANDING THE METHODOLOGY
WHY VOLUME WEIGHTING?
Traditional momentum oscillators treat all price moves equally. A 10-point move on low volume is weighted the same as a 10-point move on high volume.
The Kinetic Pulse corrects this by:
→ Calculating volume ratio vs. 20-bar average
→ Applying square root transformation to volume ratio (prevents extreme weights)
→ Multiplying price changes by volume weight
→ Result: High-volume moves influence the oscillator more than low-volume noise
This helps filter false breakouts and emphasizes moves with participation.
WHY FISHER TRANSFORM?
Fisher Transform is a mathematical transformation that:
→ Normalizes probability distributions
→ Creates sharper turning points
→ Amplifies extremes while compressing the middle
→ Makes overbought/oversold levels more distinct
Applied to the Kinetic Pulse, it helps identify genuine extremes vs. noise.
WHY MULTI-OSCILLATOR DIVERGENCE?
Single-source divergence can give false signals. By requiring divergence confirmation across multiple oscillators (Kinetic Pulse, CCI, Stochastic), the system filters out:
→ Divergences caused by calculation quirks in one oscillator
→ Temporary momentum anomalies
→ False divergence on noisy, low-timeframe charts
Multiple sources confirming the same pattern increases reliability.
WHY ADAPTIVE PERIODS?
Fixed periods can be:
→ Too slow during high volatility (miss fast reversals)
→ Too fast during low volatility (generate noise)
The adaptive system:
→ Shortens period when ATR ratio > 1.3 (high volatility = need faster response)
→ Lengthens period when ATR ratio < 0.7 (low volatility = need noise filtering)
→ Keeps period in reasonable range (60% to 140% of base period)
→ Result: Oscillator adjusts to current market pace automatically
WHY HYSTERESIS IN STATE MACHINE?
Without hysteresis, the analysis state would flip-flop on every bar, creating:
→ Confusing, contradictory guidance
→ Analysis paralysis
→ Lack of actionable information
Hysteresis solves this by:
→ Using different thresholds to ENTER vs. EXIT a state
→ Example: Enter "Factors Aligned" at 72+ confidence, but don't exit until <62
→ This creates stable states that persist through minor fluctuations
→ Requires minimum commitment period (3 bars) before state changes
→ Overrides commitment for significant events (near TP/SL)
→ Result: Stable, trustworthy analysis that changes only when truly warranted
WHY CONFIDENCE SMOOTHING?
Raw factor scores fluctuate bar-by-bar based on momentary conditions. Smoothing:
→ Uses 5-period EMA on raw confidence scores
→ Filters out single-bar anomalies
→ Preserves genuine trends in confidence
→ Prevents false state transitions
→ Result: More reliable assessment of actual trade health
WHY INSTRUMENT-SPECIFIC PARAMETERS?
Different instruments have different characteristics:
→ Forex is highly liquid, respects technical levels well, standard ATR works
→ Crypto is extremely volatile, needs wider stops (1.8x) to avoid false stops
→ Indices respect session opens strongly, session weighting is important
→ Commodities fall in between
Auto-detection applies research-based multipliers automatically.
WHY STRUCTURE-BASED STOPS?
ATR-based stops can:
→ Place stop in middle of consolidation (easily hit)
→ Ignore obvious invalidation levels
→ Be too tight during expansion or too wide during contraction
Structure-based stops:
→ Use actual swing highs/lows (where traders actually place stops)
→ Add small ATR buffer to avoid stop hunting
→ Constrain within min/max ATR limits for safety
→ Result: Stops that respect market geometry while managing risk
DISCLAIMER & RISK WARNING
READ THIS CAREFULLY BEFORE USING THIS INDICATOR
This indicator is provided for EDUCATIONAL and INFORMATIONAL purposes only.
❌ NOT FINANCIAL ADVICE
This indicator does NOT constitute financial advice, investment recommendations, or solicitation to buy or sell any financial instrument. All information is for educational purposes only.
❌ NO GUARANTEES
→ Past performance does NOT guarantee future results
→ No indicator can predict future price movements with certainty
→ Signal grades represent confluence, NOT win probability
→ A+ signals can lose, B signals can win - markets are probabilistic
❌ SUBSTANTIAL RISK
Trading financial instruments involves SUBSTANTIAL RISK of loss:
→ You can lose your entire investment
→ Leveraged trading amplifies both gains AND losses
→ Never trade with money you cannot afford to lose
→ Never risk more than 1-2% of your account per trade
❌ YOUR RESPONSIBILITY
→ All trading decisions are YOUR responsibility
→ You must conduct your own analysis before entering trades
→ Consult a licensed financial advisor before trading
→ Understand the risks specific to your jurisdiction and situation
→ Only trade with capital you can afford to lose completely
❌ NO HOLY GRAIL
→ This indicator is a TOOL, not a complete trading system
→ It should be used as part of a broader analysis framework
→ Combine with your own technical analysis, risk management, and judgment
→ No indicator works 100% of the time in all market conditions
❌ ANALYSIS PANEL DISCLAIMER
The "Trade Analysis Panel" provides ALGORITHMIC ANALYSIS of market factors.
→ It does NOT provide investment advice or recommendations
→ Factor scores are mathematical calculations, not predictions
→ Guidance messages are informational, not directives
→ All trading decisions remain your responsibility
❌ BACKTESTING LIMITATIONS
→ This is an indicator, not a strategy, so no backtesting results are provided
→ Any backtesting you perform includes hindsight bias and optimization bias
→ Historical performance does not indicate future performance
→ Slippage, commissions, and real-world execution differ from backtests
❌ MARKET CONDITIONS
→ This indicator performs differently in trending vs. ranging markets
→ Extreme volatility can produce false signals or whipsaws
→ Low liquidity periods increase execution risk
→ Major news events can invalidate technical analysis
BY USING THIS INDICATOR, YOU ACKNOWLEDGE:
→ You have read and understood this disclaimer
→ You accept full responsibility for your trading decisions
→ You understand the substantial risks involved in trading
→ You will not hold the author liable for any losses incurred
→ You are using this tool as part of your own due diligence process
KEY FEATURES SUMMARY
✅ Volume-Weighted Kinetic Pulse Engine (proprietary momentum calculation)
✅ 15-Factor Confluence Scoring System (graded signals: A+, A, B)
✅ Multi-Oscillator Divergence Detection (Pulse + CCI + Stochastic)
✅ Higher Timeframe Trend Alignment Filter
✅ Adaptive Period Adjustment (volatility-responsive)
✅ Instrument-Aware Calibration (Forex, Crypto, Indices, Commodities)
✅ Structure-Based Stop Loss Calculation (respects swing highs/lows)
✅ Automated Trade Tracking (entry, stop, TP1, TP2, P/L)
✅ Real-Time Factor Analysis State Machine (5-state system with hysteresis)
✅ Session Awareness (Asian, London, New York, Overlap)
✅ Volatility Regime Detection (blocks signals in extreme conditions)
✅ Choppiness Filter (reduces signals in ranging markets)
✅ Volume Confirmation (relative volume and delta analysis)
✅ Clean Air Check (validates clear path to targets)
✅ Comprehensive Dashboards (market conditions + trade analysis)
✅ Customizable Display (3 signal styles, color themes, positioning)
✅ 9 Built-In Alert Conditions (signals, TP/SL hits, state changes)
✅ Fully Non-Repainting (barstate.isconfirmed, lookahead_off)
✅ Previous Day Levels (PDH/PDL reference lines)
✅ Mobile-Friendly Compact Mode (for smaller screens)
TECHNICAL SPECIFICATIONS
→ Pine Script Version: v6
→ Indicator Type: Overlay (displays on price chart)
→ License: Mozilla Public License 2.0
→ Copyright: BULLBYTE
→ Object Limits: 300 labels, 100 lines, 50 boxes
→ Memory Management: Automatic cleanup system (FIFO queue)
→ Repainting: Non-repainting (signals confirmed on bar close)
→ Timeframe Support: All timeframes (1s to Monthly)
→ Instrument Support: Forex, Crypto, Indices, Commodities, Stocks
→ HTF Data Handling: lookahead_off with historical offset
VERSION HISTORY
v1.0 - Initial Release
→ Kinetic Pulse engine with volume weighting and Fisher Transform
→ 15-factor confluence scoring system
→ Trade analysis state machine with hysteresis
→ Automated trade tracking and monitoring
→ Dual dashboard system (market conditions + factor analysis)
→ 9 alert conditions
→ 3 signal display styles
→ Instrument-aware calibration
→ Full risk management framework
WHO IS THIS INDICATOR FOR?
IDEAL FOR:
✓ Scalpers and day traders seeking high-confluence reversal entries
✓ Swing traders who want quality over quantity
✓ Traders who appreciate systematic, rules-based analysis
✓ Multi-timeframe traders who value HTF confirmation
✓ Forex traders who respect session timing
✓ Crypto traders needing volatility-adjusted parameters
✓ Traders who want complete trade management (entry, stop, targets)
✓ Analytical traders who want transparency in signal generation
NOT IDEAL FOR:
✗ Traders seeking a "set and forget" holy grail system
✗ Traders who don't want to learn the methodology
✗ Traders unwilling to accept losing trades as part of the process
✗ Traders who need constant signals (this is a quality-focused system)
✗ Traders who ignore risk management
FINAL THOUGHTS
The Kinetic Scalper is the result of extensive research into momentum behavior, volume confirmation, and multi-factor confluence analysis. It's designed to identify high-probability reversal setups while maintaining strict risk management and providing complete transparency.
This is NOT a magic solution. It's a sophisticated TOOL that requires:
→ Understanding of the methodology
→ Proper risk management discipline
→ Patience to wait for quality setups
→ Willingness to accept losses as part of trading
→ Integration with your own analysis and judgment
Used properly as part of a complete trading plan, the Kinetic Scalper can help you identify high-confluence opportunities and manage trades systematically.
Remember: Quality over quantity. Discipline over emotion. Risk management over everything.
Trade smart. Trade safe.
© 2025 BULLBYTE | Kinetic Scalper v1.0 | For Educational Purposes Only

Supply & Demand ZonesThis indicator detects high-probability supply and demand zones using a multi-step smart money concept approach:
Liquidity Sweep Detection: Identifies when price sweeps above a pivot high (supply setup) or below a pivot low (demand setup), capturing liquidity grabs by institutional traders.
Displacement Confirmation: Requires a strong displacement candle (measured by ATR and body percentage) or fair value gap (FVG/imbalance) in the opposite direction after the sweep.
Volume Confirmation: Optional filter ensures zones form only when volume exceeds the user-defined threshold, indicating institutional participation.
Smart Filtering: Built-in logic prevents overlapping zones, enforces minimum spacing between signals, and requires confirmation bars to eliminate false signals.
Zone Lifecycle Management: Zones are automatically removed when price closes through them with momentum. Breached zones can optionally "flip" to the opposite type when re-tested with strong displacement.
✨ Key Features
Clean Visual Display: Small "D" (Demand) and "S" (Supply) labels with shaded zone boxes
Non-Repainting: All signals use confirmed historical data—no lookahead or repainting
Volume Filter: Optional confirmation using volume spike detection
Zone Flip Logic: Breached demand zones can become supply (and vice versa) when violated
Overlap Prevention: Smart algorithm prevents clustered or duplicate zones
Confirmation Delay: Configurable wait period after sweep to confirm genuine setups
Customizable Inputs: Adjust pivot sensitivity, displacement thresholds, volume filters, and more
Alert Ready: Built-in alert conditions for new supply and demand zone formations
🎯 How to Add to Your Chart
Favorite the Indicator: Click the star icon to add this script to your favorites
Open Your Chart: Navigate to the asset and timeframe you want to trade (works best on 5m-1H intraday charts)
Add Indicator: Click "Indicators" at the top, search for "Supply & Demand Zones (Smart Filtered)", and add to chart
Customize Settings: Click the gear icon ⚙️ to adjust inputs based on your trading style and instrument volatility
Set Alerts: Right-click the indicator name → "Add alert" → Select "Supply Zone" or "Demand Zone" conditions
📖 How to Use
Demand Zones (Green "D" Labels):
Price swept below a swing low (liquidity grab)
Strong bullish displacement or imbalance followed
Trading Action: Look for LONG entries when price returns to the zone or on immediate continuation
Stop Loss: Place just below the zone or sweep low
Target: Next resistance level, supply zone, or risk-reward ratio target
Supply Zones (Red "S" Labels):
Price swept above a swing high (liquidity grab)
Strong bearish displacement or imbalance followed
Trading Action: Look for SHORT entries when price returns to the zone or on immediate continuation
Stop Loss: Place just above the zone or sweep high
Target: Next support level, demand zone, or risk-reward ratio target
Flipped Zones (Orange Labels):
Previous demand/supply zone was broken with strong momentum
Zone has flipped polarity and may now act as the opposite type
Trading Action: Exercise caution—wait for additional confirmation before trading flipped zones
🔍 What to Look For
High-Quality Setups:
Zone forms with above-average volume (check volume filter is enabled)
Clear liquidity sweep visible on the chart
Strong displacement candle with large body percentage
Zone aligns with overall market trend or key structure levels
Multiple timeframe confirmation (check higher timeframe for context)
Avoid These Setups:
Zones forming in choppy, low-volume conditions
Multiple overlapping zones in the same area (indicator filters these automatically)
Zones that appear immediately after news events (set confirmation bars higher)
Counter-trend zones without additional confluence
⚙️ Recommended Settings by Timeframe
5-Minute Charts (Scalping):
Pivot Lookback: 3/3
Min Displacement ATR: 0.9
Confirmation Bars: 1
Min Zone Spacing: 3-5 bars
Volume Threshold: 1.2x
15-Minute Charts (Intraday):
Pivot Lookback: 4/4 (default)
Min Displacement ATR: 1.0 (default)
Confirmation Bars: 2 (default)
Min Zone Spacing: 5-8 bars
Volume Threshold: 1.2x
1-Hour Charts (Swing Trading):
Pivot Lookback: 5/5
Min Displacement ATR: 1.2-1.5
Confirmation Bars: 3
Min Zone Spacing: 8-12 bars
Volume Threshold: 1.3x
💡 Trading Tips & Best Practices
Combine with Price Action: Use this indicator alongside candlestick patterns, support/resistance, and trendlines for confirmation
Multiple Timeframe Analysis: Check higher timeframes for overall bias and major zones
Volume is Key: Enable volume filter to focus on institutional-backed moves
Risk Management: Always use stop losses and proper position sizing
Backtesting: Test settings on your preferred instruments and timeframes before live trading
Context Matters: Consider market conditions, news events, and session times
Wait for Confirmation: Don't rush entries—wait for price reaction at the zone
⚠️ Important Disclaimers
Educational Purpose Only: This indicator is provided for educational and informational purposes. It does not constitute financial advice, investment recommendations, or trading signals.
No Guarantees: Past performance and backtested results do not guarantee future results. Trading involves substantial risk of loss.
