Fuerza Relativa vs SPY con TablaRelative Strength vs SPY with Score (0–100)
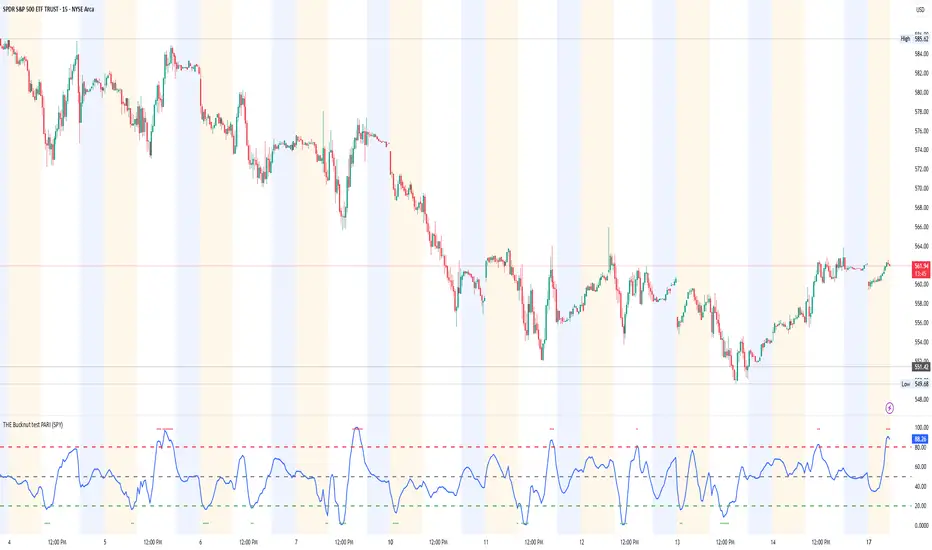
This indicator measures the relative strength of an asset versus SPY (or any user-defined benchmark), allowing traders to quickly identify whether an asset is outperforming or underperforming the broader market.
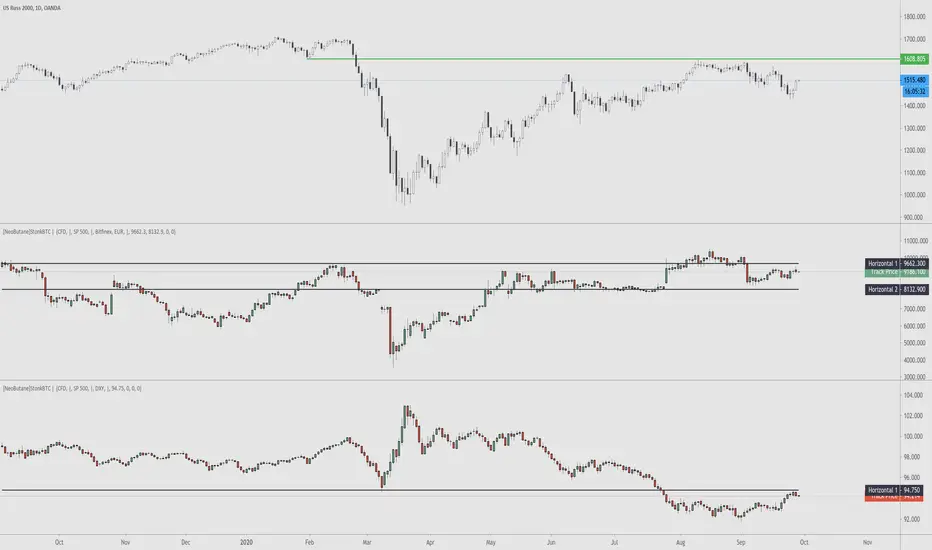
Relative strength is calculated as the ratio between the asset’s price and the reference index price, and is accompanied by a smoothed moving average that acts as a baseline to detect changes in relative trend.
🔹 Main Features:
Relative Strength Line:
Green when the asset shows strength versus the market.
Red when it shows relative weakness.
Configurable moving average used as a dynamic reference line.
Colored cloud between the relative strength line and its moving average for quick visual interpretation.
Crossover signals (triangles) when relative strength crosses above its moving average.
🔹 Relative Strength Score (0–100)
Includes an information table displaying a normalized score based on Percent Rank, comparing the current value with its historical behavior:
Current
Previous Day
Previous Week
Previous Month
Score interpretation:
🟢 > 70 → Strong relative performance
🟠 30 – 70 → Neutral zone
🔴 < 30 → Relative weakness
🔹 Recommended Uses:
Identifying market leaders.
Trend confirmation.
Comparative analysis between assets.
Strength-based filters for swing and medium-term trading strategies.
Indicador Pine Script®