Volume SessionsTrading sessions showed. You can add or remove sessions in settings. You can also adjust timings of session openings and close. Indicador Pine Script®por gabbietrades22130
G Trade SessionsWe built this indicator because we was tired of guessing when major markets open and close. It draws simple boxes around each trading session so you can instantly see where the action is. What it does: Shows you the four key sessions — Asia, Frankfurt, London, and New York — as transparent boxes right on your chart. Each box marks the high and low of that session, which is super useful for spotting support/resistance levels. Why I like it: No clutter — boxes are subtle and don't get in the way Labels switch from black to white automatically depending on your chart theme (dark or light) Sessions don't overlap, so the chart stays clean You can turn off any session you don't care about Hope you find it useful!Indicador Pine Script®por Lacker00Atualizado 107
Market Sessions and TPO (+Forecast)This indicator "Market Sessions and TPO (+Forecast)" shows various market sessions alongside a TPO profile (presented as the traditional lettering system or as bars) and price forecast for the duration of the session. Additionally, numerous statistics for the session are shown. Features Session open and close times presented in boxes Session pre market and post market shown TPO profile generated for each session (normal market hours only) A forecast for the remained of the session is projected forward Forecast can be augmented by ATR Naked POCs remain on the chart until violated Volume delta for the session shown OI Change for the session shown (Binance sourced) Total volume for the session shown Price range for the session shown The image above shows processes of the indicator. Volume delta, OI change, total volume and session range are calculated and presented for each session. Additionally, a TPO profile for the most recent session is shown, and a forecast for the remainder of the active session is shown. The image above shows an alternative display method for the session forecast and TPO profile! Additionally, the pre-market and post-market times are denoted by dashed boxes. The image above exemplifies additional capabilities. That's all for now; further updates to come and thank you for checking this out! And a special thank you to @TradingView of course, for making all of this possible! Indicador Pine Script®por MXWLL-Capital-TradingAtualizado 5050 3.5 K
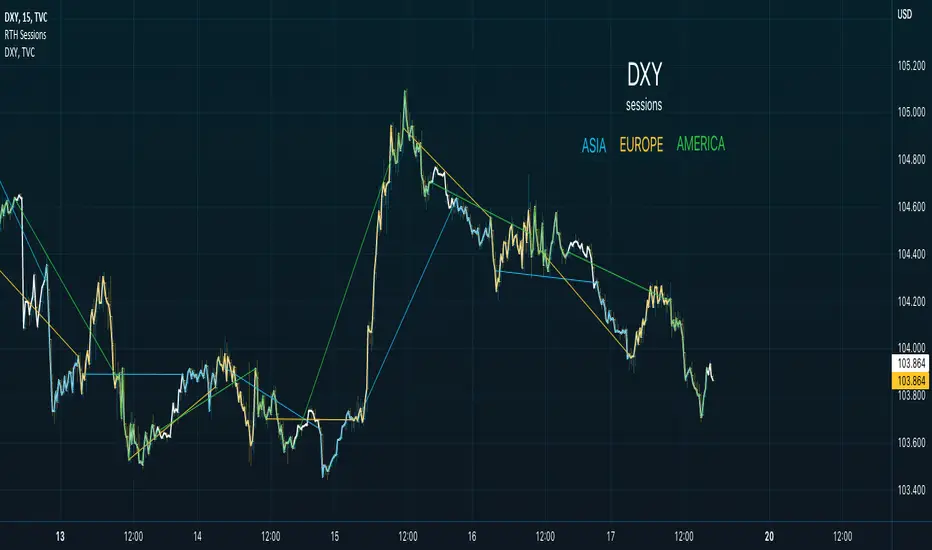
Regular Trading Hour Sessions for America, Asia and EUThis trading view script is a simple one but I find it very helpful in spotting changes in trend of FX. The basic idea is to create a visual direction from the previous session to the next new session. The concept while basic provides visual trend direction and changes as session change. The three sessions are: 1. Asia from 2130-0400 2. Europe from 0300-1130 3. America from 0930-1600 When you use a line chart you will see the default line when no sessions are active. Features I plan to add * Tracking delta of each session * Moving Averages of each session * Momentum of each session * Delta difference My ultimate goal for this script will be to provide a way to visualize the impact of each session and provide data to buy/sell triggers for Trading Strategies. Please provide feedback and if you use the script or add a feature please update me or send me the feature to add to the script.Indicador Pine Script®por SPYvsGME33151
ATR+ Advanced Sessions ATR for DaterangeATR+ Advanced Sessions ATR for Daterange The ATR+ adds the following additional filters to the stock ATR indicator by Tradingview: - Calculates the overall average ATR for a user defined daterange, optionally filtered by trading session and selected weekdays, presented as a secondary line over the standard ATR line. - Basic ATR line, with colour highlight to indicate the selected sessions, days and timeframe being calculated by the average ATR+ line. - Average ATR+ line indicating the average of all ATRs within the defined timeframe, optionally filtered by instances of a selected trading session and selected weekdays. - Customisable appearance. - The ATR+ also includes the basic ATR configuration options typically found in the standard ATR by Tradingview, including period length and smoothing type. Defaults are set to the factory standards: 14 length, RMA smoothing type. What Is the Average True Range (ATR)? The ATR is a technical analysis tool that measures market volatility by decomposing the entire range asset price for that period. Investopedia describes the ATR as follows: "The average true range (ATR) is a technical analysis indicator, introduced by market technician J. Welles Wilder Jr. in his book New Concepts in Technical Trading Systems, that measures market volatility by decomposing the entire range of an asset price for that period. The true range indicator is taken as the greatest of the following: current high less the current low; the absolute value of the current high less the previous close; and the absolute value of the current low less the previous close. The ATR is then a moving average, generally using 14 days, of the true ranges." For more information on the ATR and its calculations and use cases, see here: Investopedia link here. Tradingview link here. Note The indicator may time out if the number of bars being calculated is too long. If this happens, you will need to reduce the datetime range, or increase the chart timeframe in order to reduce the number of bars being calculated and the indicator will attempt to recalculate.Indicador Pine Script®por PHVNTOM_TRADERAtualizado 33131
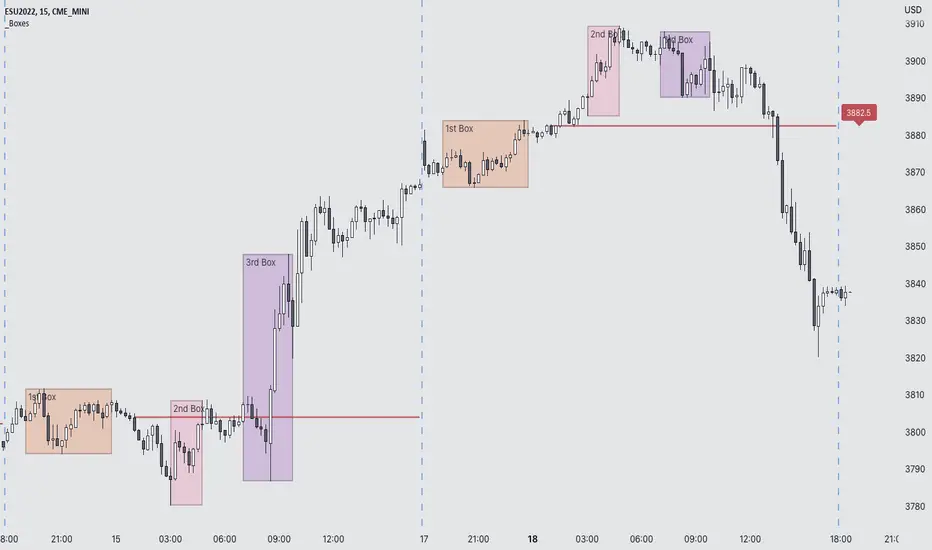
Futures Exchange Sessions 2.0Description Successor to Futures Exchange Sessions indicator. Completely rebuilt code from the ground up. Every feature has been redesigned and refactored to be the most beneficial while allowing for complete configuration by the user. This indicator displays Futures Sessions as live boxes that expand dynamically as price moves over the time interval. These boxes make liquidity levels extremely easy to spot and visualize. It helps the user identify market structure and develop their own bias of price action. Everything about the Session boxes can be configured. Box color, border color, border style, and border width are all individually controllable. Each Future Session can be turned on or off at any time. Also, each box has their own text label (Asian Session, London Session, New York Session) and this text can be moved around the box, change color, and change size. Previous days highs and lows (major liquidity levels) are always important to the futures trader. This indicator now allows the user to individually display the three previous days highs and low levels as lines with optional label. Each line can be independently toggled on or off and like always, every conceivable customization option is available to the user. And the labels can be moved to the right (via the Input Settings) to allow unobstructed views of candles. The midnight EST open and 8:30 AM EST open horizontal lines (developed by the Inner Circle Trader) are returning in this indicator. But the biggest improvement is that the lines stop at the current bar or the last bar of the trading day. Additionally, the time lines are displayed on previous days so the user can easily see how the candles reacted to these important times of the day. The Session boxes and the horizontal time lines now can be set to only display a certain number of day back. If the user wants just to see Session boxes for the previous day only, they can do that. If the user wants to see the last 15 days of boxes or lines it is very easy to increase the days back in the settings. Currently, the max days back is 80 calendar days. Additional Images Easily visualize and understand price action across time Everything is customizable so the user can easily match this indicator to their color preferences Special Notes To turn off box session text set opacity to 0% Boxes and horizontal time lines only display when timeframe is <= 30 minute Indicador Pine Script®por Infinity_Trading_99 1.3 K
Crypto / Fx SessionsTrading sessions for crypto markets - the major time segments: London, NYC, Beijing. Times are set in UTC. Quick experiment for now, may be edited. More granular data around session breaks for these time zones at www.altcointrading.net or as CSVs daily updated on Keybase keybase.pub Indicador Pine Script®por JMatTrang46
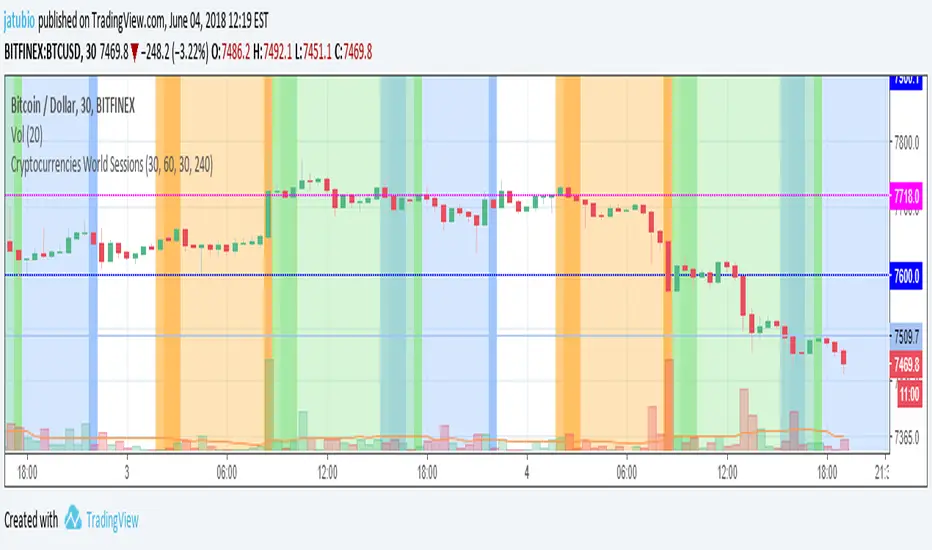
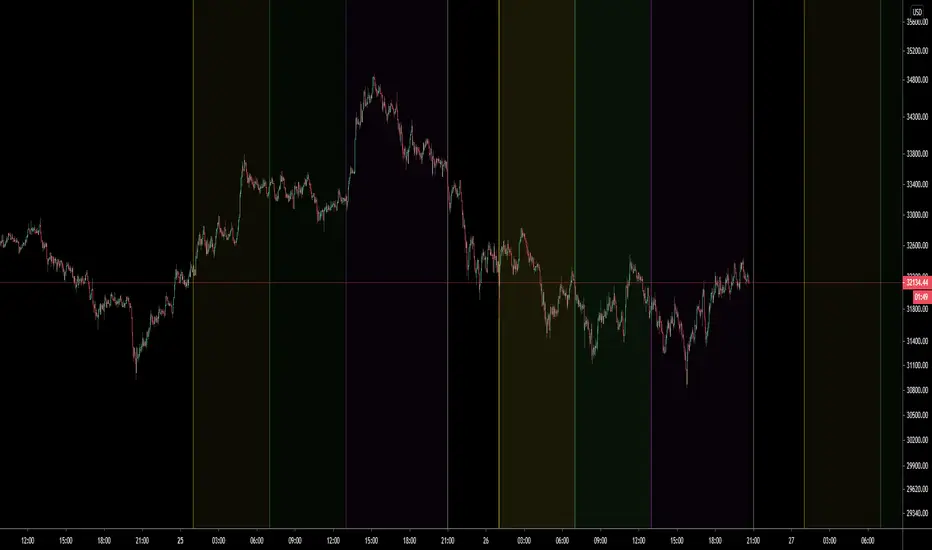
Cryptocurrencies World SessionsEste indicador cambia los colores del fondo para identificar zonas horarias relacionadas con las sesiones de trading en criptomonedas. Se muestran las sesiones de: America (Nueva York), Europa (Londres) y Korea (Seúl) Además de mostrar la duración de la sesión, se pueden configurar intervalos para resaltar (en minutos): Antes de la apertura, después de la apertura y antes del cierre. ----------------------------------------------------------------------------------- This indicators show background colours to identify world timezones about to cryptocurrencies trading sessions These sessions are shown: USA (New York), Europe (London) and Korea (Seoul). In addition to show the duration of the session, you can set intervals to be highlighted (in minutes): Before opening, after opening, before closing. Indicador Pine Script®por jatubio164
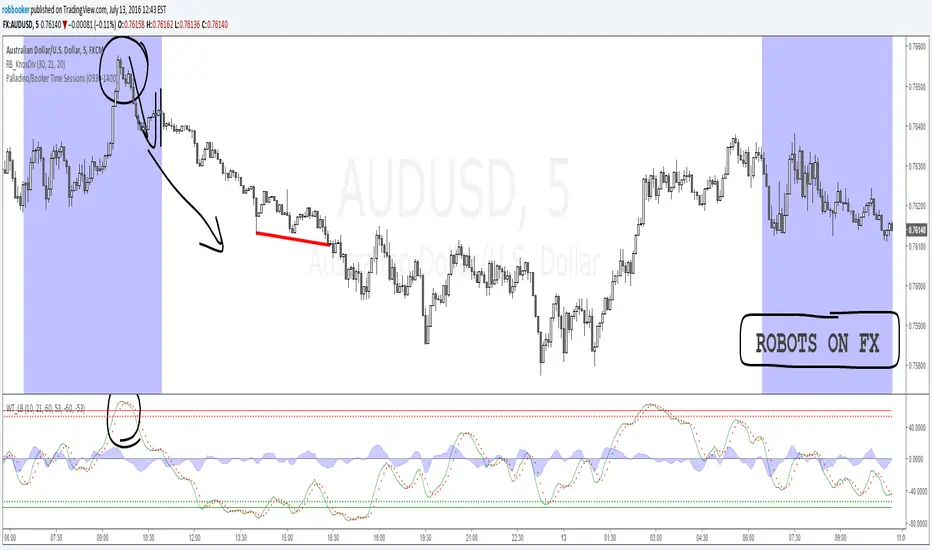
Palladino/Booker Time SessionsThe Palladino/Booker Time Sessions script will allow you to highlight certain periods of time during the day that are best suited to your trading. Add the script to your chart as many times as you like to highlight as many Time Sessions as you like.Indicador Pine Script®por robbooker33518
Sakalau02 Yearly Monthly Sessions Sakalau02 Yearly Monthly Sessions is an advanced time-mapping tool designed to highlight monthly cycles throughout the year. The indicator converts raw price data into a clean visual structure, using arrays for optimized performance. Macro Perspective: It allows you to visualize how price interacts with previous monthly highs and lows, making it ideal for identifying seasonal trends. Array-Based Structure: Unlike traditional scripts, this dynamically handles data for all 12 months, ensuring low resource consumption even with a multi-year lookback. Display Modes: Offers full flexibility by using Boxes (monthly price range), Zones (full-height background shading), or Timeline (discrete bottom markers). Key Features: Reference Levels: Includes the monthly Open price and the Equilibrium level (0.5 Level) for every session. Individual Customization: Each month can be toggled and colored separately to highlight specific quarters or fiscal periods. Alert System: Automated notifications for month starts and breakouts of monthly extremes (High/Low). By Sakalau02 ( Andrei )Indicador Pine Script®por Aa0022
Sakalau02 Monthly Weekly SessionsSakalau02 Monthly Weekly Sessions is a visual analysis tool designed to automatically identify and highlight the 5 weeks of each calendar month. The indicator tracks price action throughout each week and offers several display modes: Boxes: Draws rectangular zones covering the weekly High and Low. Zones: Shades the chart background based on the active week. Timeline: Adds discrete markers at the bottom of the chart. Key Features: Automated Levels: Displays the weekly Open price and the equilibrium line (0.5 Level) for each session. Full Customization: Allows users to modify colors, line styles, and labels for each individual week. Integrated Alerts: Notifies you when a new week starts or when the price hits a new weekly High or Low. Performance Optimization: Includes a lookback setting to limit calculations to a specific number of months, keeping the chart responsive. By Sakalau02 (Andre) Indicador Pine Script®por Aa0022
BD SessionsSession boxes indicator for intraday charts. Highlights up to four customizable market sessions using transparent boxes with clearly defined high/low ranges and labels. Each session can be individually configured by name, time, timezone, and color.Indicador Pine Script®por BankingDesertAtualizado 29
Market Sessions V2🔄 MAJOR UPDATE v2.0 ✨ NEW FEATURES: - Live Info Panel with session status, timer, range & change% - Average range statistics (based on history period) - Weekend mode highlighting (Fri US Close → Mon Asia Open) - Pre-market & Post-market tracking for US session (table only) - Auto/Manual session times with validation 🔧 IMPROVEMENTS: - Accurate official exchange hours (TSE 09:00-15:30, LSE 08:00-16:30, NYSE 09:30-16:00, ASX 10:00-16:00) - Automatic DST handling via native timezones - Tokyo Lunch Break indicator (11:30-12:30 JST) - Works on all timeframes with smart adaptation (boxes ≤4H, table always) - Bar Replay compatible 🛡️ RELIABILITY: - Input validation for manual time entries - Graceful handling of higher timeframes - Optimized memory management 📖 For Forex/Crypto traders: Sessions show continuous trading hours. Tokyo lunch (11:30-12:30 JST) is indicated in table only.Indicador Pine Script®por MAXmksAtualizado 2246
Simple Trading SessionsThis indicator highlights the major global trading sessions (Tokyo, London, and New York) directly on your chart with clean background shading. Tokyo Session (default 00:00–09:00 exchange time) London Session (default 07:00–16:00 exchange time) New York Session (default 12:30–21:00 exchange time) Each session is displayed as a different shaded block, making it easy to: Spot when the market is most active. Identify overlapping periods (e.g., London–New York overlap). Backtest strategies that depend on session timing. ⚙️ How to Use Add the indicator to any intraday chart. Adjust session times in the settings panel to match your broker or preferred timezone. Use the shading to guide your trading around regional liquidity zones. ✅ Notes By default, session times follow the chart’s exchange timezone. You can change the inputs to match your own session definitions. Very lightweight and designed for traders who want a simple, uncluttered session map without extra calculations.Indicador Pine Script®por BePaMi1120
[TTM] ICT Sessions & Ranges🌟 Overview 🌟 The ICT Sessions & Ranges Indicator helps traders identify key intraday price levels by marking custom session highs/lows and opening ranges. It helps traders spot potential liquidity grabs, reversals, and breakout zones by tracking price behavior around these key areas 🌟 Session Highs & Lows – Liquidity Zones 🌟 Session highs and lows often attract price due to stop orders resting above or below them. These levels are frequently targeted during high-volatility moves. 🔹 Asia Session - Usually ranges in low volatility. - Highs/lows often get swept during early London. - Price may raid these levels, then reverse. 🔹 London Session - First major volatility of the day. - Highs/lows often tested or swept in New York. - Commonly forms the day’s true high or low. 🌟 Opening Range Concepts 🌟 The Opening Range is the first 15, 30, or 60 minutes of a session (e.g., New York). The high (ORH) and low (ORL) define the market’s initial balance and key reaction levels. 🔹 Breakout Trade - Price breaks ORH/ORL with momentum. - Signals directional intent. - Traders enter on the breakout, with stops inside the range. 🔹 Liquidity Raid - Price briefly breaks ORH/ORL to trigger stops. - Reverses after the sweep. - Look for structure shift and entry near FVG or OB. 🌟 Customizable Settings 🌟 The indicator includes 3 configurable ranges , each with: Start & End Time – Set any custom time window. Display Type – Choose Box (highlight range) or Lines (mark high/low). Color Settings – Set custom colors for boxes and lines. 🌟 Default Settings 🌟 Range 1 : 19:00–00:00 (Asia Session) Range 2 : 01:45–05:15 (London Session) Range 3 : 09:30–10:00 (NY Opening Range – 30m) Indicador Pine Script®por TheTickMagnetAtualizado 1212642
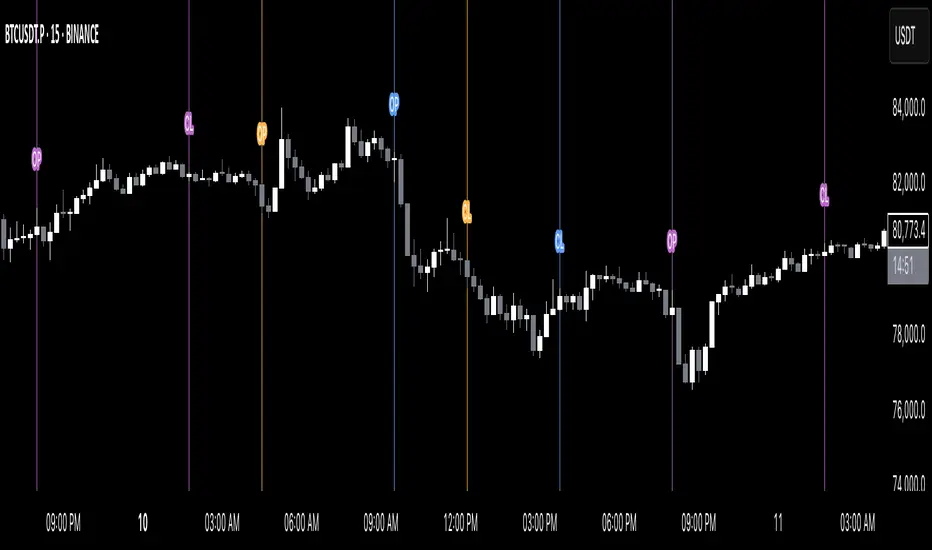
Simple Sessions========== TLDR ========== The "Simple Sessions" indicator plots vertical lines and labels at the open and close of the US (New York), Asia (Tokyo), and Europe (London), daily session. The existing session indicators I could find all changed the background color of the chart for the entire session or added extra information to the chart that cluttered up my view. This is meant to be a less noisy and easy to interpret indication that the session you trade has started or is ending. ========== Features ========== - Show or hide vertical lines for session opens and closes - Show or hide labels for session opens and closes - Show or hide each session individually - Show or hide just the session close indications - Change the color used for each session open and close - Change the labels text, size, and text color ========== Limitations ========== The session start and end times are hard coded in for their time zones and can't be changed: - US (New York) - 9:30 - 16:00 - Asia (Tokyo) - 9:00 - 15:00 - Europe (London) - 8:30 - 16:30 ========== Use Cases ========== - Easily see when each session started and ended without the chart being too noisy - Make it easier to identify price action patterns and trade setups that may occur on the open of each session ============================= If you'd like more features or options feel free to request them in the comments. Indicador Pine Script®por chriselderxyzAtualizado 93
Indian Market Sessions for BacktestingThis indicator is designed to increase the quality of your backtesting in the Indian Market. NSE & BSE run from 9:15 am IST to 3:30 pm IST. Naturally different times have different kinds of volatility. On your chart you will find premarked - Saffron - 9:15 am to 10:30 am - Opening Session - High Volatility Observed Historically White - 10:35 am to 2:25 pm - Middle Session - Lower Volatility Observed Historically Green - 2:30 pm to 3:30 pm - Closing Session - Medium to High Volatility Observed Historically You will also find the start of each session marked with an arrow. Feel free to change the times from the input settings and the color and visibility from the style settings. _______________ Usage: When you backtest any strategies, say moving average crossovers, also mark the sessions in your sheet which will help you further increase accuracy. Feel free to drop your doubts in the comments.Indicador Pine Script®por tradingwithsidhant33166
FVG Sessions [LuxAlgo]The FVG Sessions indicator highlights the first fair value gap of the trading session as well as the session range. Detected fair value gaps extend to the end of the trading session. Alerts are included on the formation of a session fair value gap, price being within a session fair value gap, mitigations, and price crossing session fair value gaps average. 🔶 USAGE Trader ICT states that the first fair value gap of the trading session can attract the most significant reaction. Having only one FVG per session allows users to further focus on that precise imbalance as well as external elements. The mitigation of a fair value gap is clearly indicated on the chart with a more transparent color allowing users to see inverse FVGs. Extending the fair value gaps allows the imbalance area to provide potential support and resistance. Do note that this script should be used on intraday charts. 🔶 ALERTS The script includes the following alerts: 🔹 Bullish/Bearish FVG Alerts on the formation of the first bullish or bearish FVG of the session. 🔹 Bullish/Bearish FVG Mitigation Alerts when the first bullish or bearish FVG of the session is mitigated. 🔹 Price Within FVG Alerts when price is within the first bullish or bearish FVG area of the session. 🔹 Price Cross FVG Average Alerts when price cross the average level of the first bullish or bearish FVG of the session.Indicador Pine Script®por LuxAlgo2222 8.1 K
Sessions By SaintSessions indicator for traders wanting to look for breakouts early. This tool will help you differentiate between Tokyo, London, New York and Sydney sessions on a daily basis with the option of a daily high and low view.Indicador Pine Script®por St_G1bbs13
Futures Exchange Sessions 3.0Description The ultimate conclusion to the Futures Exchange Sessions 2.0 indicator. In version 3.0 the user gets full control of the start and end times of three separate dynamic boxes and one horizontal line. If the user wants to visually keep track of killzones, lunches, or any other time span in a trading day, version 3.0 will dynamically expand and keep track of price within the time specified by the user. Inputs and Style Everything about the three dynamic boxes and one horizontal line can but independently configured. Color, style, border, width can all be adjusted. In the Settings each box has a text box so the user can give each one a unique name. Timezone All of the start and end times are in EST. Additionally, each box and line need a dependent start of each day. This is controlled by a setting where the user can specify a timezone called Start Day Timezone which would be midnight of the respective timezone. In general if a box or line resides within a particular Session pick the corresponding timezone. If the users box/line fits in the Asian Session then choose Asia/Shanghai. If the box/line is within the London Session then choose Europe/London. And the same goes for the New York Session. Special Notes If start time is within one period of the Start Day Timezone in the Settings, then the line/box won't display Boxes and time lines only display when timeframe is <= 30 minute To turn off box text label set opacity to 0% Indicador Pine Script®por Infinity_Trading_1414 2.1 K
Market Sessions Open/Close LevelsThis indicator displays the market open and close price levels for the main trading sessions (Sydney, Tokyo, Frankfurt, London and New York). The Daily Line changes color depending on if price is trading above or below the level. Feel free to add or replace levels depending on your trading style and trading times. Indicador Pine Script®por MarkMcFX99642
Yesterday's RTH&ON sessions OHLCsThe indicator plots the OHLC levels of both trading sessions of the day before: the overnight session and the Regular Trading Hours.Indicador Pine Script®por czoaAtualizado 1818632
CC SessionsAsia, London, NY and Close Sessions in the "Igor-ChartChampion Style"Indicador Pine Script®por CryptoCurlAtualizado 1.1 K