Custom Session Tracker (KN)**Custom Session Tracker (KN)**
Visually highlight any intraday session’s high, low, and midpoint on your chart with full styling control.
**Description**
Custom Session Tracker (KN) lets you define any trading session (e.g. 09:30–16:00 NY time) and automatically draws:
* A translucent box spanning the session’s High and Low
* A horizontal line marking the session midpoint
All elements update in real time and persist after session close.
**Features**
* **Session Range Box**: Plots from session open through close
* **Mid-Price Line**: Marks the exact midpoint of High/Low
* **Timezone Input**: Aligns session to any GMT offset
* **Custom Colors**: Fill, border, and mid-line colors
* **Line & Border Styles**: Choose solid or dashed
**Inputs**
* **Timezone** – GMT offset for your market
* **Session** – Hours in `HHMM-HHMM` format
* **Fill Color** – Box interior transparency
* **Border Color** – Box outline
* **Box Border Style** – Solid or dashed
* **Midline Color** – Mid-price line color
* **Mid Price Line Style** – Solid or dashed
**How to Use**
1. Add the script to your chart.
2. Set your session hours and timezone.
3. Customize colors and styles.
4. Watch each session’s high, low, and midpoint appear automatically.
Perfect for session-overlap strategies, mean-reversion signals, or simply keeping key levels in view.
Pesquisar nos scripts por "session"

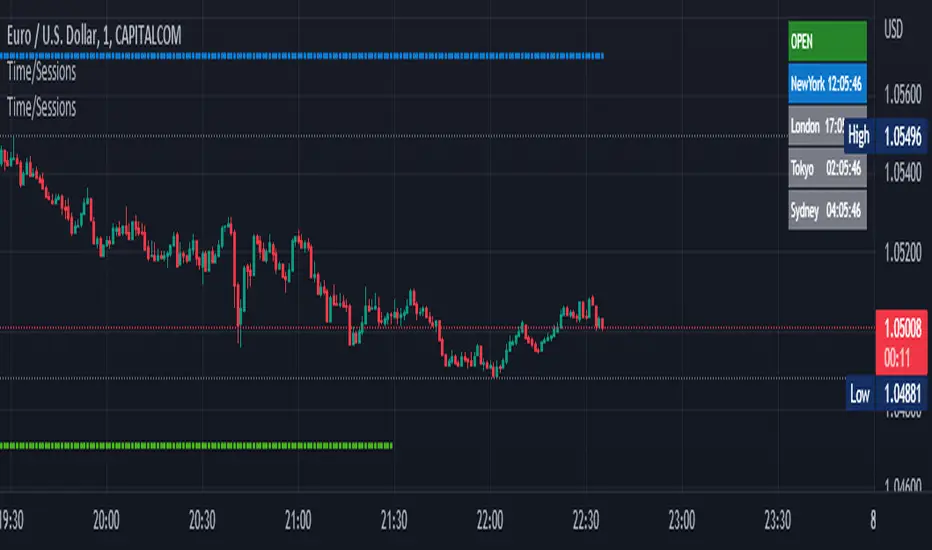
Time Zone / Market SessionsTime Zone / Market Sessions indicator is a handy tool to display current major Market Open / Close condition along with present time at that Exchange. Sydney, Tokyo, London, New York market sessions are included. Clear display of Overlap Zones and Kill Zones.. Can be used to estimate market Pumping and Dumping. Alerts can be set when a market opens.
Time is Displayed in Table Layout
Active Market is displayed as Dots on top and bottom
You can select as Timeline or Table display
Overlap is clearly displayed on top and bottom without any mess
Gray color in Table layout Shows Closed Markets
You are free to reuse this code No Limitations.
Kill Zones are indicated in Table format. When some of the markets are closed
Alerts included for market openings
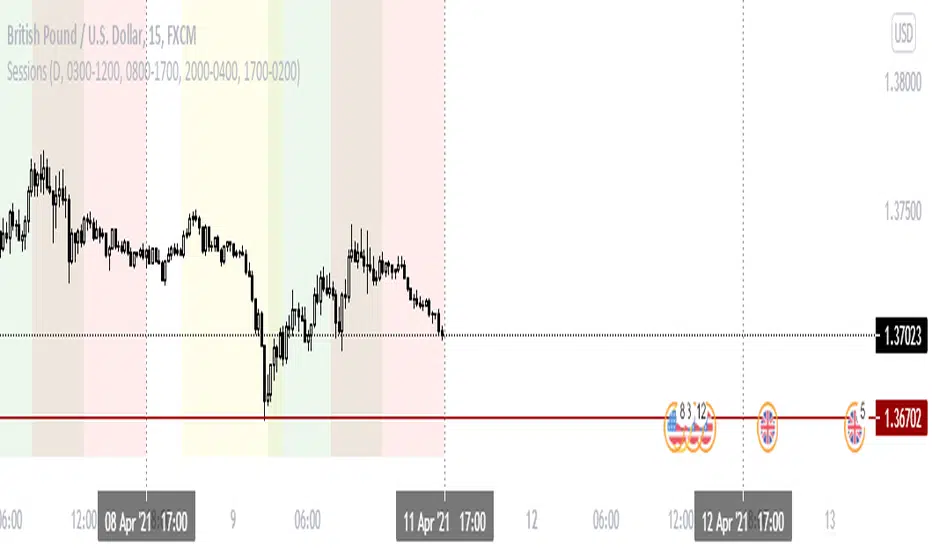
London & New York Sessions ESTThis is a sessions displayer that displays only Lond and New York for EST. It is customizable for other sessions as well
Value Area PRO (TPO/Volume Session VAH/VAL/POC) 📌 AP Capital Value Area PRO (TPO / Volume)
AP Capital Value Area PRO is a session-based value area indicator designed for Gold (XAUUSD), NASDAQ (NAS100), and other CFD instruments.
It focuses on where the market has accepted price during the current session and highlights high-probability interaction zones used by professional traders.
Unlike rolling lookback volume profiles, this indicator builds a true session value area and provides actionable signals around VAH, VAL, and POC.
🔹 Core Features
Session-Anchored Value Area
Value Area is built only during the selected session
Resets cleanly at session start
Levels develop during the session and can be extended forward
No repainting or shifting due to lookback changes
TPO or Volume Mode
TPO (Time-at-Price) mode – ideal for CFDs and tick-volume data
Volume mode – uses broker volume if preferred
Same logic, different weighting method
Fixed Price Bin Size
Uses a fixed bin size (e.g. 0.10 for Gold, 0.25–0.50 for NAS100)
Produces cleaner, more realistic VAH/VAL levels
Avoids distorted profiles caused by dynamic bin scaling
VAH / VAL / POC Levels
VAH (Value Area High)
VAL (Value Area Low)
POC (Point of Control) (optional)
Lines can be extended to act as forward reference levels
🔹 Trading Signals & Alerts
Value Re-Entry
Identifies false breakouts where price:
Trades outside value
Then closes back inside
Often seen before strong mean-reversion or continuation moves.
Acceptance
Detects initiative activity using:
Multiple consecutive closes outside value
Filters out weak single-candle breaks
Rejection
Flags strong rejection candles:
Large candle body
Wick outside value
Close back inside the value area
These conditions are especially effective on Gold intraday.
🔹 Optional Profile Histogram
Right-side volume/TPO histogram
Buy/sell imbalance visualization
Fully optional to reduce chart clutter and improve performance
🔹 Best Use Cases
Recommended markets
XAUUSD (Gold)
NAS100 / US100
Other index or metal CFDs
Recommended timeframes
5m, 15m, 30m
Suggested settings
Mode: TPO
Value Area: 70%
Bin size:
Gold: 0.10
NAS100: 0.25 or 0.50
🔹 How Traders Use It
Trade rejections at VAH / VAL
Look for acceptance to confirm trend days
Use re-entries to fade failed breakouts
Combine with trend filters, EMA structure, or session context
⚠️ Disclaimer
This indicator is provided for educational and analytical purposes only and does not constitute financial advice. Always manage risk appropriately.

SA Range Rank NQ 1.13.2026 PM SESSION15 MINUTE — PREPARE / POSITION MODE
Developer Note: Bias & Position Framing
This daily view is preparatory, not executable.
The purpose of the Daily timeframe is to define directional bias, not entries.
It helps frame which side of the market deserves attention and which activity should be ignored.
The goal here is context, not action.
________________________________________
Purpose on Daily
The Daily timeframe is used to:
• Define directional bias for the week
• Prepare position-building zones
• Identify environments where participation is unnecessary or elevated-risk
• Reduce overtrading by narrowing focus
Daily charts answer one question only:
“If I participate this week, which side makes sense?”
________________________________________
What Matters Most (Public View)
SA Range Indicator (RI):
→ Is the market transitioning or trending?
→ Is energy building, releasing, or rotating?
SA ZoneEngine (visual context only):
→ Are daily moves aligned with higher-timeframe structure?
→ Is price operating with or against dominant bias?
These visuals explain environment, not decisions.
________________________________________
How to Interpret Public Daily Posts
• Daily is not timing
• Daily is not execution
• Daily is not a signal
Daily charts prepare the trader mentally and structurally by clarifying:
• what deserves patience
• what deserves caution
• what deserves no attention at all
________________________________________
Messaging Line
“Daily charts prepare the trade — they don’t execute it.”
________________________________________
SEO Intent
daily equity bias, position preparation, market structure analysis
________________________________________
🤝 For Those Who Find Value
If these daily posts help you see the market more clearly:
• Follow, boost, and share my scripts, Ideas, and MINDS posts
• Feel free to message me directly with questions or build requests
• Constructive feedback and collaboration are always welcome
For traders who want to go deeper, optional memberships may include:
• Additional signal access
• Early previews
• Occasional free tools and upgrades
🔗 Membership & Signals
trianchor.gumroad.com
________________________________________
________________________________________
⏱ 15-MIN — PREPARE / POSITION MODE
Developer Note: Setup Formation Phase
The 15-minute timeframe is where setups begin to form, not where they are acted on.
This view exists to separate developing structure from noise.
________________________________________
Purpose on 15-Minute
The 15-minute timeframe is used to:
• Spot trap-prone conditions
• Identify developing structure
• Observe compression, rotation, or early expansion
• Prepare for execution — without acting
This timeframe answers a different question:
“Is something forming — or is this noise?”
________________________________________
What Matters Most (Public View)
SA Range Indicator (RI):
→ Compression → expansion transitions
→ Energy buildup vs premature release
SA CloudRegimes (visual only):
→ Whether price behavior reflects continuation, pullback, or contraction
→ Whether movement is controlled or impulsive
These visuals describe behavior, not entries.
________________________________________
How to Interpret Public 15-Minute Posts
• 15m is setup formation
• 15m is environmental awareness
• 15m is not execution
Most errors occur when traders act before structure has finished forming.
This timeframe exists to slow that impulse down.
________________________________________
Messaging Line
“Preparation happens before the move — not during it.”
________________________________________
________________________________________
🤝 For Those Who Find Value
If these posts help you better recognize developing structure:
• Follow, boost, and share my scripts, Ideas, and MINDS posts
• Feel free to message me directly with questions or build requests
• Constructive feedback and collaboration are always welcome
For traders who want to go deeper, optional memberships may include:
• Additional signal access
• Early previews
• Occasional free tools and upgrades
🔗 Membership & Signals
trianchor.gumroad.com
15 Minute (15m) — Tactical Entry Alignment / “Permission + Timing”
Goal: Convert higher-timeframe permission into tradable timing.
How to use:
• Trade the first clean reclaim after a pullback.
• Avoid taking a reclaim if price is already extended far beyond the wake edge (late reclaim).
Best conditions:
• Works extremely well when:
o 1H agrees
o session structure is active (open/close windows)
o reclaim occurs near VWAP or a key level you already respect
Settings:
• dispMult 0.75–1.05
• reclaimWindow 6–14
• cooldown 3–6
🟠 15-MINUTE — Intraday Structure & Session Logic
1️⃣ Range Indicator (RI)
• Session compression → impulse likely
• Expansion → follow, don’t fade
Use:
Defines session behavior.
________________________________________
2️⃣ ZoneEngine (Structure)
• Filters session traps
• Explains failed breakouts
Use:
Keeps you aligned with real participation.
________________________________________
3️⃣ Cloud / Reclaim (Behavior)
• Identifies pullback vs continuation
• Reclaim confirms acceptance
Use:
Contextual confirmation.
________________________________________
4️⃣ Stop-Hunt Proxy
• Session liquidity sweeps
• Common near opens and transitions
Use:
Stop-hunt + compression = likely session impulse.

Golden hour 1130 1230 Session LinesGolden Hour 11:30–12:30 Session Lines
Overview :
Calculate the session high and low between 11:30 AM and 12:30 PM and mark the lines.
Trading Rule
Once the price breaks either side (high or low), it will continue to move further in that direction.
Session Time : 11:30 AM – 12:30 PM
Key Levels : Session High & Session Low
Strategy : Breakout continuation in the direction of the break

MSSM - Multi-Session Structural Map (Precision Sweeps)MSSM – Multi-Session Structural Map (Precision Sweeps)
This indicator provides a structured view of the market based on four key components:
1). Previous session levels
2). Confirmed fractal swing points
3). Volume pocket highlights
4). Non-repainting precision liquidity sweep markers
It is designed to help analyze how price interacts with important reference areas and structural points. This tool does not generate signals or predictions. All information is visual and educational only.
HOW THE INDICATOR WORKS
PREVIOUS SESSION LEVELS
The script plots the previous session’s High, Low, and Mid. These levels help observe how the current session behaves around the prior day’s range. They act as reference areas only.
FRACTAL SWING MAP (NON-REPAINTING)
Confirmed fractals are used to mark historical swing highs and swing lows. Since fractals confirm after a certain number of bars, the swings do not repaint once formed. These swings provide a clearer view of market structure.
VOLUME POCKETS
The indicator highlights areas where volume expands relative to a rolling volume average. These regions show increased participation or activity. The highlights are informational and do not imply direction.
PRECISION LIQUIDITY SWEEPS (NON-REPAINTING)
A sweep is tagged only when:
• Price trades beyond a confirmed swing high or swing low
• Price closes back inside the previous swing level
• A wick rejection occurs
• Volume expands relative to a recent rolling average
These markers simply show where price interacted with liquidity around prior structural levels. They do not indicate a trading signal or bias.
HOW TO ADD THE INDICATOR
Open the Pine Editor in TradingView
Search the indicator name and add to favorites.
Click “Add to chart”
Adjust settings as needed (fractals, sweeps, volume pockets, or session levels)
HOW TO READ AND USE THE INDICATOR
SESSION LEVELS
Observe whether price respects, rejects, compresses around, or expands beyond the previous session high, low, or midpoint. These are observational reference levels only.
FRACTALS
Fractal highs and lows help visualize structural turning points. They provide a clearer picture of where liquidity may rest above or below past swing levels.
VOLUME POCKETS
When volume expands compared to the recent average, the candle is shaded. These areas may show increased participation, but no directional meaning is implied.
PRECISION SWEEPS
Sweeps highlight when price reaches beyond a prior confirmed swing level and then rejects that area with displacement. These markers identify interactions with liquidity, but they are not signals and do not forecast future outcomes.
CUSTOMIZATION OPTIONS
Users can adjust:
• Session level visibility
• Fractal sensitivity
• Volume pocket threshold
• Sweep sensitivity and visibility
• Transparency and styling
This makes the tool flexible across different symbols and timeframes.
IMPORTANT NOTES AND POLICY COMPLIANCE
• The indicator does not provide buy or sell signals
• The indicator does not predict price or direction
• All plotted elements are based on past price behavior
• All components are informational only
• Users should perform their own analysis and risk evaluation
• Past behavior does not guarantee future performance
SUMMARY
MSSM provides a structured view of price by combining previous session levels, confirmed swing structure, volume expansion zones, and non-repainting sweep identification. Its purpose is to assist traders in visually analyzing market structure while staying fully aligned with TradingView’s House Rules and content policies.

LevelsThis Indicator is meant to plot some of the most common levels that traders use.
The display of these levels is highly customizable, as you can choose the line type , color , thickness and whether it shows you no label, price only, reduced label or full label next to the line. All labels (except for "no Label") will show the price at this level.
Also You have the option to mark the start on each timeframe with either a individually colored background or a vertical line where you can choose the line style and color.
Full List of available Levels and Optional inputs to these levels:
Previous HTF Candle Levels:
• Previous HTF Candle Open
• Previous HTF Candle High
• Previous HTF Candle Low
• Previous HTF Candle Close
Optional:
• Choose any higher timeframe
• Mark start of new HTF candle
Session Levels:
• Session Open
• Session High
• Session Low
• Session Close
Optional:
• Choose any time as start and end of your session
• Mark start of session
• Mark full session
Daily Levels:
• Current Day Open
• Current Day High
• Current Day Low
• Previous Day Open
• Previous Day High
• Previous Day Low
• Previous Day Close
Optional:
• Choose start of day (standard, NY Midnight, custom start time)
• Mark start of day
Weekly Levels:
• Current Week Open
• Current Week High
• Current Week Low
• Previous Week Open
• Previous Week High
• Previous Week Low
• Previous Week Close
Optional:
• Mark start of Week
Monthly Levels:
• Current Month Open
• Current Month High
• Current MonthLow
• Previous Month Open
• Previous Month High
• Previous Month Low
• Previous Month Close
Optional:
• Mark start of Month

Key Session Levels (KUUUMZ)
📜 Summary
Tired of manually drawing the same key levels every single trading day? The KUUMZ-Key Session Levels indicator automates this entire process, plotting the most critical intraday and previous day levels directly on your chart. This tool provides a clean, dynamic framework of potential support and resistance zones, allowing you to focus on your trading strategy, not on chart setup.
Built for day traders and scalpers of US equities, this indicator helps you instantly visualize the market's structure from the moment the session begins.
🎯 Key Levels Plotted
This indicator automatically identifies and draws horizontal lines for the following session levels:
Previous Day High (PDH) & Low (PDL): The highest and lowest points of the prior trading day, which often act as major psychological support and resistance magnets.
Pre-Market High & Low (PMH/PML): The range established during the pre-market session (4:00 - 9:30 AM ET). A breakout from this range can often signal the initial directional bias.
5-Minute Opening Range High & Low (OR5): The high and low of the first 5 minutes of the regular session (9:30 - 9:35 AM ET). A crucial level for opening range breakout (ORB) strategies.
15-Minute Opening Range High & Low (OR15): The high and low of the first 15 minutes (9:30 - 9:45 AM ET), providing a slightly broader view of the initial balance area.
📈 How to Use This Indicator
These levels are fundamental to many intraday trading strategies:
Support & Resistance: Watch how price reacts as it approaches these levels. A bounce or rejection can signal a potential reversal, while a clean break can indicate continuation.
Breakout Trading: A strong, high-volume move through one of these levels (e.g., breaking above the Pre-Market High) can be an entry signal for a breakout trade.
Market Context: Quickly gauge market sentiment. Is the price trading above or below the previous day's range? Is it trapped within the opening range? These levels provide immediate context to the current price action.
Setting Targets & Stops: Use these levels to set logical profit targets or place stop-loss orders. For example, if you go long on a breakout of the 5-min OR, the Pre-Market High or Previous Day High could be your first target.
⚙️ Features & Customization
The script is designed to be flexible and clean, allowing you to tailor it to your specific charting style.
Toggle Any Level: Enable or disable any set of levels (Previous Day, Pre-Market, etc.) to reduce clutter.
Full Style Control: Customize the Color, Width, and Style (Solid, Dotted, Dashed) for each pair of high/low lines independently.
Optional Labels: A master switch allows you to show or hide all price labels (like "PDH", "PM Low", etc.) with a single click.
Automatic & Dynamic: Levels are calculated and drawn in real-time as each session concludes and are automatically cleared and reset for the next trading day.

Smart Directional Fib Zone (Selectable Session)🎯 Overview
This indicator plots a dynamic Fibonacci zone between the 0.5 and 0.618 levels , calculated from the previous day’s price action , and is designed specifically for intraday traders.
It visually highlights key retracement or reaction areas where the market often pauses or reverses.
🔍 How it works
At the start of each day, the script automatically captures:
the previous day’s open (pdo),
high (pdh),
low (pdl),
and close (pdc).
It then determines if the previous day was bullish (Close > Open) or bearish (Close < Open).
Based on that:
If the previous day was bullish, it projects the Fibonacci levels down from the high (typical for expecting retracements).
If bearish, it projects them up from the low.
The two key levels are:
0.5 (50%) retracement / projection
0.618 (61.8%) retracement / projection
A colored zone is plotted between these levels to act as a leading guide for intraday setups.
⏰ Time filtering & session customization
A unique feature is the dynamic session filtering:
By default, the zone is only plotted during active market hours, keeping your chart clean outside trading hours.
The script provides a dropdown selector so you can quickly switch between:
India session (9:15 to 15:30)
Europe session (9:00 to 17:30)
US session (9:30 to 16:00)
Or even define your own custom session times.
This makes it ideal for intraday traders in any region.
🎨 Visual features
The fill zone changes color based on the previous day’s sentiment:
Green zone if the previous day was bullish
Red zone if the previous day was bearish
🚨 Alerts
The script includes an alert condition, so you can easily set up TradingView alerts to notify you when:
Price enters the Fibonacci zone.
This is extremely helpful for catching retracements or reversals without staring at the screen all day.
⚙️ How to use
✅ Works on any intraday timeframe (1 min, 5 min, 15 min, etc.).
✅ Simply add it to your chart, pick your session in the dropdown, and watch the Fibonacci zone automatically adjust to your selected market hours.
Use it as a confluence tool alongside other indicators like VWAP, EMAs, Bollinger Bands, or price action patterns to time entries and exits.
💪 Why this is powerful
This is more than a simple Fib retracement tool:
It dynamically adapts to the previous day’s sentiment, helping you trade in alignment with recent market psychology.
The session filtering ensures your charts are focused only on the periods

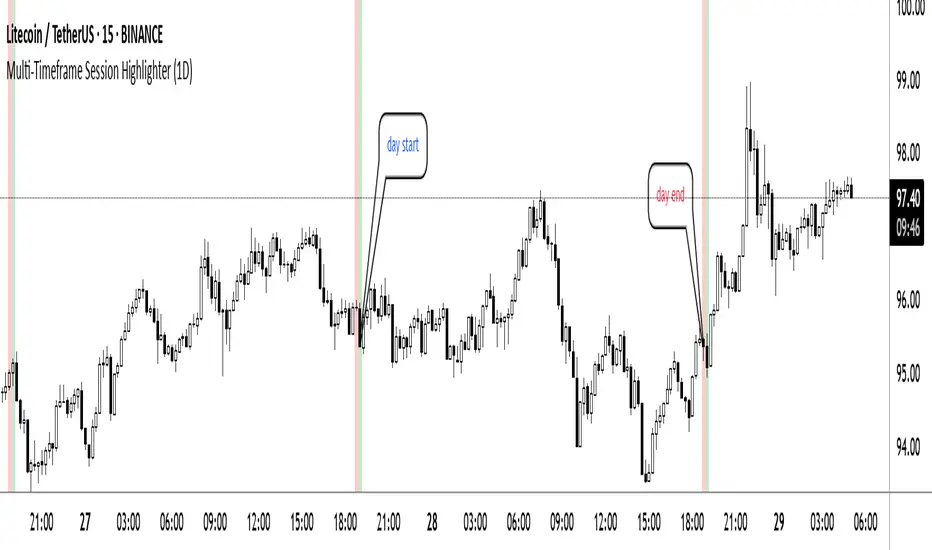
Multi-Timeframe Session HighlighterWhat is the Multi-Timeframe Session Highlighter?
It’s a simple Pine Script indicator that paints two special candles on your chart, no matter what timeframe you’re looking at. Think of it as a highlighter pen for session starts and ends—can be used for session-based strategies or just keeping an eye on key turning points.
How it works:
Green Bar (Session Open): Marks the exact bar when your chosen higher-timeframe session kicks off. If you select “4H,” on the indicator, you’ll see green on every 4-hour open, even if you’re staring at a 15-minute chart.
Red Bar (Session Close): Highlights the very last lower-timeframe candle immediately before that session wraps up. So on a 1H chart with “Daily” selected, you’ll get a red band on the 23:00 hour before the new daily bar at midnight.
Customizable: Pick your own colors and transparency level to match your chart theme.
Getting started:
Add the indicator to your chart.
In the inputs, select the session timeframe (for example, “240” for 4H or “D” for daily).
Choose your favorite green and red shades.
That’s it.
NY Trading Session TrackerNY Trading Session Tracker
This indicator highlights the New York trading session (14:30–21:00 UTC) directly on your chart. It visually identifies the session with a customizable background color and optional labels marking the session’s open and close. For added clarity, the labels can display the precise open and close prices, formatted with commas and up to 4 decimal places. Perfect for intraday traders looking to focus on one of the most active market periods.
Features:
• Highlight the NY session with a customizable background.
• Optional session open/close labels.
• Display open/close prices with professional formatting.
• Fully customizable settings for labels and colors.
Streamline your trading workflow and focus on what matters with the NY Trading Session Tracker!

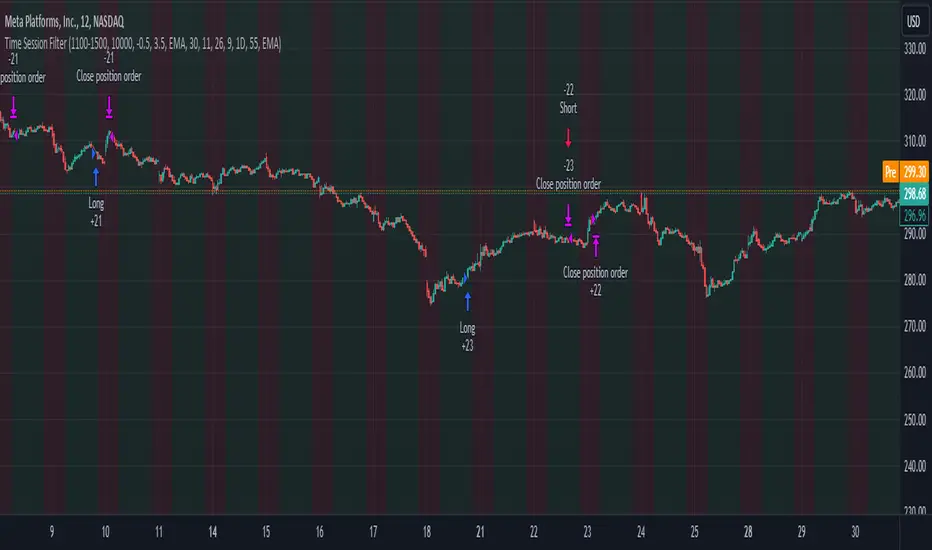
Time Session Filter - MACD exampleTime Session Filter in TradingView Strategy: A Comprehensive Guide
Welcome to this educational TradingView blog where we dive deep into the functionality and utility of the time session filter in trading strategies. It's interesting to note that the time session filter is a commonly overlooked feature in Pine Script, often not integrated into overall trading strategies. Yet, when used wisely, this tool can significantly enhance your trading approach. In essence, the session filter ensures that trades are only made within a specific, user-defined time frame. By incorporating this often-neglected building block, you can make your strategy more adaptable to various market conditions and trading preferences.
What is a Time Session Filter?
A time session filter is designed to:
Select Times of the Day to Trade: The filter allows you to choose specific hours during the day in which trades are allowed to be excecuted.
Toggle Days to Trade: You can decide which days of the week you want to trade, giving you the flexibility to avoid days that are historically not profitable for your strategy.
Close Trade When Session Ends: The filter can automatically close any open trade once the specified time session concludes, reducing the risk associated with holding positions outside your chosen time frame.
The user interface is streamlined, taking minimal space for the input sections, making it convenient to integrate with other indicators in your overall strategy script. In addition the script colors the background of the chart green when the timesession filter is on and makes the background red when the filter doesn't allow any trades. This helps you to visualise the selected timeframes in relation to chart patterns.
Best Practices for Time Selection
From my personal trading experience I share some input settings you can try to play around with:
Stocks: Trading stocks sometimes yield better results if you only trade in the mornings until lunchtime. This is the period when markets are generally more active, and traders are keenly participating.
Cryptocurrencies: For cryptocurrencies, it sometimes makes sense to avoid trading on Fridays, a day when futures contracts often expire. Various other market-moving events also typically occur on Fridays.
Random Selection: Interestingly, sometimes choosing a random selection of times and days can improve the script's performance, adding an element of unpredictability that might outperform more systematic approaches.
Strategy Overview
This strategy script incorporates various elements, including risk position size and MACD indicator, to provide a comprehensive trading strategy. For a detailed explanation of risk position sizing, please refer to this article:
For a complete understanding of the MACD indicator utilized, visit the following explanation:
Additionally, for high time frame trend filters, consult this resource for more info:
Educational Purposes and Risks
Please note that this script is for educational purposes and serves merely as an example of how to incorporate a time session filter into a trading strategy for pinescript. It is a simplified strategy without a fixed stop-loss, which can result in higher exposure to significant losses. The time session filter can be a powerful addition to your trading strategy, providing you with the tools to tailor your approach according to time-specific market conditions. By understanding its functionalities and best practices, you can make more informed trading decisions, but always remember that trading carries inherent risks.
Happy trading!
itradesize /\ Overnight Session & Silver BulletOvernight Session & Silver Bullet indicator
The indicator can be divided into two separate stuff:
ONS ( Overnight Session ) based on TCM’s ( TheCurrencyMerchant ) theory and Silver Bullet based on what ICT ( InnerCircleTrader ) is teaching to us.
Overnight Session
• ONS will be always based on Chicago 4am to 8am time according to TCM’s CME teaching.
The indicator has the option to show TSO ( Today’s session only ) which is good to have the chart not messed up by it. At this time when it comes to backtesting just turn this off to have the past ONS and SB ranges showed up on your chart.
• Mid line at the ONS range is useful to have as you are able to decide wether price is in a premium or a discount under the ONS.
If Im a buyer target is above the range, if Im a seller target is below the range.
• You are also able to have SD ( Standard Deviation ) lines for price projections. In the variety of TCM’s videos you are able to have a deeper knowledge.
• You can also extend Today’s ONS lines to the very end of the chart which could make an easier looking on the levels you eyeing with.
Silver Bullet
It’s based on New York time as ICT ( Inner Circle Trader ) is always teaching to us that we should use New York time, every time when it comes to his concepts.
Silver Bullets are always be there aiming of an opposing liquidity pool. They are working even on choppy days.
Silver Bullet hours:
• 03:00 - 04:00am NY Time
• 10:00 - 11:00am NY Time
• 02:00 - 03:00pm NY Time
SB highlighted areas could be shown as a box or a range according to your taste, with or without Start/End lines.
Both of them ca be used to form trades.
You should dig yourself into Silver Bullet ( InnerCircleTrader ) and Overnight Session ( TheCurrencyMerchant ) teachings before the use of the indicator.
Simple setups
• Silver Bullet
Look 20-30 minutes before any SB where the Buy or Sell program has started.
Where the first 1m FVG ( Fair Value Gap ) appears under the range, enter the trade.
Expect only a 5 handle move as a beginner.
1m chart is a must for these kind of FVG entries. ( 30s , 15s can also be used )
• ONS
Price is trading aggressively out of the range to take liquidity.
Once price grabbed liquidity that candle on the 3-5m could considered as on order block for the further movement.
If you are trading in the range, then the opposite side can be the target, if its out of the range and trading one sided, then use standard deviations as 0.5 is a minimum target.

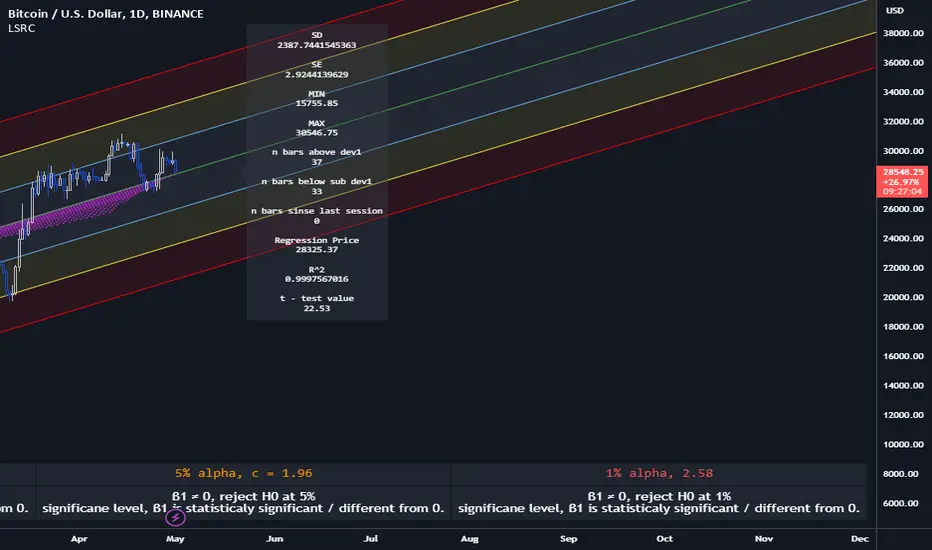
Lagging Session Regression ChannelHello Traders !
Note :
This is my very first published script on trading view & from brainstorming an idea to developing to the finched product it was imperative to me for the indiactor and every one of its features to be of some meaningfull use. If you like the idea of statsitics being able to predict future prices in the market then this indicator may be usefull in your trading arsenal.
Introduction :
Lagging Session Regression Channel (LSRC) is a statistical trend analysis indicator that "laggs" the market by the user defined session, by defualt a day, by doing so the indicator leverges the ability of simple linear regression to predict future asset price.(This can be used on any asset in any market in any time frame)
Options & inputs :
- Bar regression lookback :
The value of bars back from the lats session change, if the seesion time is equivelnt to the the chart timefrmae then the regression line will not lag price, i.e it will act as a stantdard lineer regression channel chnaging on evrey last confimred bar.
- Standard Deviation lookback :
The value of bars from the last session change to cacluate the unbiased standard deviation, The lookback can be set to > or < the regression lookback to cauture > or < less asset volatility. (note this is the same as the residual standard deviation)
- Predicted price at nth bar :
if you whant to know the predicted close price value at any given point in the regression and to the RHS of the regression.
- Regression Line colors group :
Changes the colors of each plotted line.
- OLS Line color : is only changeable when trend color is set to false / unticked.
- Visable deviations group :
Plots the lines that you want on chart, e.g if "Show DEV1" and "Sow DEV SUB1" are the only inputs ticked then they will be the only lines ploted along with the simple linear regression line.
- Regression Line Dynamics group :
All inputs in this group change the regressions calculations given the bar lookback is constant / the same.
- Trend color : if set too true, when the close of the proceding real time bar is greater than the simple linear regression line from the last confimred session the line will be colored green, if otherwise the close is below the simple linear regression line the line will be colored red.
- Extend regression line :
This is the same chart image as seen on the publication chart image but with Extend regression line set to true, this allows the trader to test the valdity of the regression and how well it predicts future price, as seen on the M15 chart of BTCUSD above the indicator was pritty good at doing this.
- Standard deviation channel source :
Source for standard deviation to be calculated on. note if this is set to a varible other than the close then this will no longer be the resdiaul standard deviation, as of now "LSRC 1.0" the regression uses only the close for y / predicted values.
- Time elasped unitl next regression calculation :
The session time until the next LSRC will be calculated and plotted
Label LSRC stats :
- STAN DEV : the standard deviation used to cacluateed the deviation channels
- MIN : The lowest price across the regression
- MAX : The highest price across the regression
- n bars above dev 1 : The number of bars that closed above the first standard deviation channel across the entire regression calculation
- n bars below sub dev1 : The number of bars that closed below the first standard deviation channel.
- Regression Price : The output of "Predicted price at nth bar" input.
Hope you find this usefull !
I will continue too try improve this script and update it accordingly.
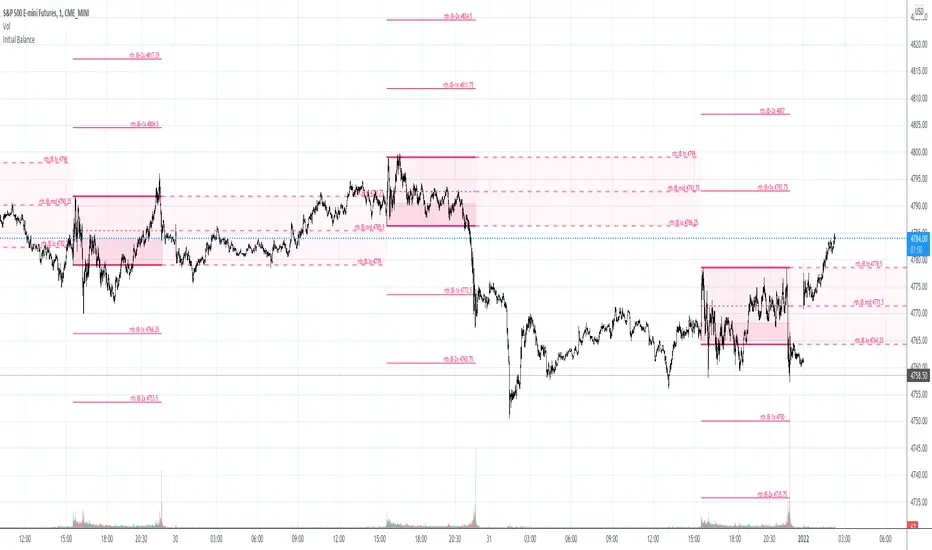
Initial Balance & extensions Custom session time and IB durationThe indicator will plot Initial Balance levels and extensions. The session start and end times are configurable depending on instrument, as well as the Initial Balance end time. The session times must be entered in the underlying instrument's timezone, for example:
ES-futures (Chicago Timezone)
Session Start: 0830
Initial Balance End: 0930
Session End: 1515
US-Stocks (New York Timezone)
Session Start: 0930
Initial Balance End: 1030
Session End: 1600
Europe Futures (Madrid Timezone)
Session Start: 0800
Initial balance End: 0900
Session End: 2200
Colors and linewidths are also customisable.
KJ Sessions (Today Only): Asia/London/US + OverlapKJ Sessions : Asia/London/US + Overlap.
best for people to clearly mark Asia, UK and US opening and closing timing.

KJ Sessions : Asia/London/US + OverlapKJ Sessions : Asia/London/US + Overlap.
times are set as per dubai time.

HazMeed Session Highs/Lows)Marks out Asia Session Highs and Lows
Marks out London Session Highs and Lows
Marks out NYAM Session Highs and Lows

First FVG per Session - Big Boss Traders)First FVG per Session - Big Boss Traders)
All persistent variables (fvgTop, fvgBottom, boxes) declared with var at the top.
No assignment to na without var → compiles error-free.
FVG boxes and levels are dark orange.
First FVG per session is drawn and prolonged dynamically.
Background colors per session remain.

DAX 9-10 Breakout Strategy IndicatorOpening Hour Breakout (ORB) indicator for intraday trading.
WHAT IT DOES:
• Identifies the price range of a specific hour (default: 9:00-10:00)
• Detects breakout direction (Long/Short) when price breaks above HIGH or below LOW
• Automatically calculates Take Profit and Stop Loss zones based on range size
• Tracks trade outcome (Win/Lose) when TP or SL is hit
HOW TO USE:
1. Set the session hour according to your chart's timezone
2. Wait for the session range to form (yellow box)
3. Enter on breakout above HIGH (Long) or below LOW (Short)
4. TP and SL levels are automatically calculated
DEFAULT SETTINGS:
• TP Multiplier: 1.41x range (Risk:Reward ≈ 1:2.7)
• SL Multiplier: 0.52x range
FEATURES:
• Works on any timeframe (H1, M15, M30, etc.)
• Visual zones for session range, TP, and SL
• Price labels for all key levels
• Entry arrows and direction letters (L/S)
• Win/Lose markers (W/X) when trade closes
• Fully customizable - show/hide any element
• Info panel with live status and R:R ratio
• Alert conditions for Entry, TP hit, SL hit
BEST USED ON:
• DAX (Germany 40)
• Other indices: US30, US500, NAS100
• Forex majors during London/NY open
NOTE: This is an indicator for visual analysis. Use the Strategy version for backtesting.

ICT IRON-CLAD: Fixed Sessionsall sessions and killzones marked out with colours and lables as used by all traders

