High-Low Breakout Strategy with ATR traling Stop LossThis script is a TradingView Pine Script strategy that implements a High-Low Breakout Strategy with ATR Trailing Stop.created by SK WEALTH GURU, Here’s a breakdown of its key components:
Features and Functionality
Custom Timeframe and High-Low Detection
Allows users to select a custom timeframe (default: 30 minutes) to detect high and low levels.
Tracks the high and low within a user-specified period (e.g., first 30 minutes of the session).
Draws horizontal lines for high and low, persisting for a specified number of days.
Trade Entry Conditions
Long Entry: If the closing price crosses above the recorded high.
Short Entry: If the closing price crosses below the recorded low.
The user can choose to trade Long, Short, or Both.
ATR-Based Trailing Stop & Risk Management
Uses Average True Range (ATR) with a multiplier (default: 3.5) to determine a dynamic trailing stop-loss.
Trades reset daily, ensuring a fresh start each day.
Trade Execution and Partial Profit Taking
Stop-loss: Default at 1% of entry price.
Partial profit: Books 50% of the position at 3% profit.
Max 2 trades per day: If the first trade hits stop-loss, the strategy allows one re-entry.
Intraday Exit Condition
All positions close at 3:15 PM to ensure no overnight risk.
Pesquisar nos scripts por "session"

TheHorsyAlgoPROThe Horsy algo is an automated strategy that uses any minute Higher timeframe range as reference and search for a purge of liquidity on the HTF high or low where buyside or sell side liquidity is, the algo only search this at specific desired times that can be configured according to the time you usually trade, the strategy is known as Turtle soup purge and reverse or lately as CRT.
Why is useful?
The purpose of this Algorithm is to help turtle soup traders to quickly identify when the market is likely to reverse the algo evaluates if the opportunity is worth it, base on risk reward and other desired filters. Also this strategy can help to quickly backtest the trader strategy it can be configured in different timeframes and adapt to the trader personality, they can easily see the results and statistics and notice if its profitable or not.
This algo is useful for intraday traders looking for a purge and reverse at a key times and at key HTF price levels this only looks the previous HTF highs and lows but is important to also monitor Order blocks, FVGs, gaps, or wicks to have the best results.
How it works and how it does it?
The Horsy algo simply Jumps from one type of liquidity to another one buyside to sell side or vice versa. In order for the algo to trigger an entry it has to meet these conditions
1. Take HTF liquidity, trade above a HTF high or below a HTF low in the selected time window
2. Make a change in the state of delivery with a close below the previous candle low for shorts and close above previous candle high for longs.
3. Allow for a reasonable risk reward, it will use the highest high for shorts and the lowest low for longs. The default take profit is the opposite side of the range.
4. Validate others user filters this include enter only trades aligned with the HTF bias, or trades aligned with the LTF bias or booth. The algo have the option to enter only premium and discount entries. And finally, an option to allow for different contract sizes depending of the maximum percent of the account we want to risk default is 1%. For this last option is important to check the initial balance and leverage are configured correctly, is disable by default because it requires more capital to perform well.
We can see the algo performing in the picture below with a short trade, notice there are some white lines, they are the high or the low of HTF candle that start generating inside candles in the HTF meaning a possible consolidation. The algo plots the HTF ranges in a shaded boxes as you can see below
The HTF bias as you can see in the picture is calculated based on the last close of the HTF meaning close above previous HTF high is bullish close below previous HTF low is bearish. This HTF bias level is also the last HTF mid-price or 50%. By default, this line is enabled.
The LTF bias is calculated based on the range created from the expansion outside the previous HTF range is also the mid-price. If the LTF close above previous HTF high is bullish and if the LTF close below previous HTF low is bearish. By default this LTF bias line is disable.
This strategy includes an original and personal developed code that uses dealing ranges to recognize if the market is expanding, retracing, reversing or consolidating. This allow the algo to exit the position when it detects a retracement or at the end of the expansion. This is the default exit type.
You can monitor the previous dealing ranges created in history with an option than can be enable, by default is disable, this ranges are created after price takes buyside and then sell side or vice versa. So this dealing ranges can be useful also to identify minor pools of liquidity and premium and discount in the lower timeframe.
The picture below is a long example, the exit in this case is just at the high of the range. The normal take profit is in a blue line for longs.
How to use it?
First select the desired HTF timeframe recommended is from 30min to 240min then you setup the chart on the lower timeframe you want to trade recommended is from 1min to 15min to enter. By default This strategy is designed to work for intraday during key times when price take stops and then moves quickly away from them. You can select as much as 6 different times or just one. After you select the desired time window where the algo will look for the purge and reverse, They are highlighted in the candles that change colors excluding the gray ones that indicates consolidation.
Then the Algo allow to performs several additional filters in the entries you can select if you want to trade only longs or shorts trades, you can select when to move the stop loss to Break even. In deviations of the risk or you can just select to remove risk when price hits the 50% of previous HTF range.
You can select the minimum desired risk reward of the trade before is allow to be taken. Once is configured correctly the algo should trigger signals with a triangle up or down plus the strategy entry.
At the beginning of the picture there are some blue lines in the HTF high low and close, this is to easily identify that the market is in the Asia session, the time can be configured by the user, these lines are normally gray.
On the right top of the screen you can see some statistics about the strategy how many trades it took, ARR is an approximated value of the accumulated total risk reward of all the trades when they get closed in the simulation.
Profit factor and percent profitable are also shown should be green it means that the strategy makes money over time. But apart from that is important to notice how it makes money it is stable over time? it is a roller coaster? that why I Include this other measurements MxcsTps is the maximum consecutives take profits and Mxcsls is the maximum consecutive stop losses it takes, the slash number after it is the consecutive Break evens. So this way you know what to expect and what is normal in the strategy.
The algo shows all the times the stop loss, take profit and break even level if enable in the colored red lines for short and blue lines for longs. You can also select how price will manage the profit or stoploss point meaning that you can choose to wait for the candle to close to invalidate your idea or to take profit. This is good to avoid liquidity sweeps but can also lead to mayor loses if the idea is wrong. The default setting is to close the trade when price takes the high or low where the stoploss is, the take profit is taken after a retracement to allow to profit on expansions. You can select also to exit on a reversal if you want to ride all the move. This last option has to be used with caution because sometimes price just retrace or reverse very fast decreasing the trade profit and overall strategy performance.
The algo have the option to use standard deviation from the normal risk if you prefer to prevent liquidity sweeps near the stop level this make wider stops but can lead to increased loses so it has to be used carefully.
Below is a picture that show the entry stop and take profit levels with an exit on a retracement activated.
Strategy Results
The backtesting results are obtained simulating a 2000usd account in the Micro Nasdaq using 1 contract per trade. Commission are set to 2usd per contract, slippage to 1tick. You can see in list of trades we are not risking more than 1 % percent of the account. The backtested range is from august to November 2024. This strategy doesn’t generate too much trades because of the time filters and conditions that has to be meet to take an entry but you can see the results of the last 4months with the available data that are around 32 trades.
The default settings for this strategy is HTF as 240min designed to work on a LTF 5min chart, the default purge times are 245-300, 745-800, 845-900, 1045-1100 and 1245-1300 UTC-4, the algo will look for shorts or longs, with a minimum risk reward of 2.0. With an additional filter of the HTFBias. The take profit is by default taken on the first retracement after hitting the target. The default settings are optimized to work on the Nasdaq or Spy, but can also perform well in other assets with the correct adjustments.
Remember entries constitute only a small component of a complete winning strategy. Other factors like risk management, position-sizing, trading frequency, trading fees, and many others must also be properly managed to achieve profitability. Past performance doesn’t guarantee future results. To really take advantage of this strategy you have to study turtle soup and the HTF key levels use this only as a confirmation that your overall idea will play out and use it to backtest your model.
Summary of features
·Adaptable strategy to different HTF timeframes from 1-1440min
· Select up to 6 different purge time windows UTC-4, UTC-5
· Choose desired Risk Reward per trade
· Easily see the HTF high low close and 50% key levels in the LTF
· Identify HTF consolidations that generate key major liquidity pools
· HTF/LTF bias filters to trade in favor of the big trend or in sync
· Shaded boxes that indicate if the market is bullish, bearish or consolidating
· See the current midpoint of the last expansion move
· Optimal trade entry filter to trade only in a discount or premium
· Customizable trade management take profit, stop, breakeven level
· Option to exit on a close, retracement or reversal after hitting the take profit level
· Option to exit on a close or reversal after hitting stop loss
· Configurable breakeven point with standard deviations or at 50% of the HTF
· Calculate different contract sizes depending of a percentage of the initial balance
· Standard deviations from normal risk can be used to prevent liquidity sweeps
· See dealing ranges history to check minor pools of liquidity and premium or discount
· Dashboard with instant statistics about the strategy current settings

Nifty scalping 3 minutesOverview:
The "Nifty Scalping 3 Minutes" strategy is a uniquely tailored trading system for Nifty Futures traders, with a clear focus on capital preservation, dynamic risk management, and high-probability trade entries. This strategy uses unique combination of standard technical indicators like Jurik Moving Average (JMA), Exponential Moving Average (EMA), and Bollinger Bands, but it truly stands out through its Price-Volume Spike Detection system—a unique mechanism designed to trigger trades only during periods of high momentum and market participation. The strategy also incorporates robust risk management, ensuring that traders minimize losses while maximizing profits. in complete back test range max drawdown is less than 1%
Scalping Approach and Requirements:
The strategy focuses on quick in and out trades, aiming to capture small, quick profits during periods of heightened market activity. For optimal performance, traders should have ₹2,00,000 or more in capital available per trade. The dynamic lot calculation and risk controls require this level of capital to function effectively.
Small, frequent trades are the focus, and the strategy is ideal for traders comfortable with high-frequency executions. Traders with insufficient capital or those not comfortable with frequent trades may find this strategy unsuitable.
Default Properties for Publication:
Initial Capital: ₹2,000,000
Lot Size: 25 contracts (adjusted dynamically based on available margin)
Stop-Loss: Risk per trade capped at 1% of equity.
Slippage and Commission: Realistic values are factored into the backtesting.
Key Feature: Price-Volume Spike Detection
1. Condition: Trades are executed only when there is a significant price spike confirmed by a volume spike. The candle width is calculated by multiplying the price change (difference between the candle's open and close) by the volume, and this result is compared to a 126-period average of both price and volume.
A trade is triggered when the current price-volume spike exceeds this average by a preset volume multiplier (default set at 3). This ensures that both the price change and volume are unusually strong compared to normal market behavior.
2. Reasoning: Many traders fail to incorporate the relationship between price movement and volume effectively. By using this Price-Volume Spike Detection mechanism, the strategy ensures that it only enters trades during periods of strong market momentum when both price and volume confirm a real market move, not just noise or small fluctuations.
The 126-period moving average of volume is chosen specifically because it represents a complete trading session on the 3-minute chart. This ensures that the volume spike is compared against a realistic baseline of daily activity, making the detection more robust and reliable.
The volume multiplier allows flexibility in determining the threshold for a significant spike, enabling users to fine-tune the strategy according to their risk tolerance and market conditions.
Trade Placement Logic:
1. Trend Confirmation with JMA and EMA:
Condition: The strategy will only consider entering a trade when JMA crosses above EMA for a long trade or JMA crosses below EMA for a short trade.
Reasoning: The JMA is used for its low lag and responsiveness, allowing it to capture early trends, while the EMA adds a level of confirmation by weighing recent price action more heavily. This dual confirmation ensures that trades are entered only when a solid trend is in place.
2. Bollinger Bands for Volatility Breakouts:
Condition: In addition to the JMA-EMA crossover, the price must break outside the Bollinger Bands—above the upper band for long trades, or below the lower band for short trades.
Reasoning: Bollinger Bands are a volatility indicator. By requiring a price breakout beyond the bands, the strategy ensures that trades are placed during periods of high volatility, avoiding low-momentum, sideways markets.
3. Volume and Price Confirmation (Price-Volume Spike Detection):
Condition: A trade is only triggered if the price-volume spike condition is met. This ensures that the market move is backed by strong volume and that the price change is significant relative to the recent average activity.
Reasoning: This condition filters out low-volume environments where price movements are more likely to reverse or stall. By waiting for a spike in both price and volume, the strategy ensures that it enters trades during high-momentum periods, where follow-through is more likely.
Exit Logic and Risk Management:
1. Stop-Loss (SL) Placement:
Condition: Upon entering a trade, an initial stop-loss is placed below the candle low for long trades or above the candle high for short trades. This is adjusted if the risk exceeds 1% of total capital.
Reasoning: The stop-loss is placed at a logical level that accounts for recent price action, ensuring that the trade is given room to develop while protecting capital from unexpected market reversals.
2. Profit Target and Partial Profit Booking:
Condition: The first profit target is set at 2.1x the initial risk for long trades, and 2.5x the initial risk for short trades.
Reasoning: The 2.1x risk-reward ratio for long trades provides a solid return while maintaining a conservative risk profile. For short trades, the strategy uses a higher 2.5x risk-reward ratio because market falls tend to be sharper and quicker than rises, allowing for larger profit targets to be reached more reliably.
Partial Profit Booking: Once the first target is hit, 60% of the position is closed to lock in profits. The remaining 40% is left to run with a trailing stop.
3. ATR-Based Trailing Stop:
Condition: Once the first target is hit, the ATR (Average True Range) trailing stop is applied to the remaining position. This dynamically adjusts the stop-loss as the trade moves in a favorable direction.
Reasoning: The trailing stop allows the trade to capture further gains if the trend continues, while protecting profits if the momentum weakens. The ATR ensures that the stop adjusts according to the market's current volatility, providing flexibility and protection.
4. Time-Based Exit:
Condition: If a trade is still open by 3:20 PM, it is automatically closed to avoid end-of-day volatility.
Reasoning: The time-based exit ensures that trades are not held into the often-volatile closing minutes of the market, reducing the risk of unexpected price swings.
Capital and Risk Management:
1. Lot Size Calculation:
Condition: The strategy calculates the number of lots dynamically based on the available margin. It uses only 10% of total equity for each trade, and ensures that the maximum risk per trade does not exceed 1% of total capital.
Reasoning: This ensures that traders are not over-leveraged and that the risk is controlled for each trade. Capital protection is at the core of the strategy, ensuring that even during adverse market conditions, the trader’s capital is preserved.
2. Stop-Loss Protection:
Condition: The stop-loss is designed to ensure that no more than 1% of capital is at risk in any trade.
Reasoning: By limiting risk exposure, the strategy focuses on long-term capital preservation while still allowing for profitable trades in favorable market conditions.
STBT/BTST Facilitation:
1. Feature: The strategy allows traders the option to hold positions overnight, facilitating STBT (Sell Today Buy Tomorrow) and BTST (Buy Today Sell Tomorrow) trades.
Reasoning: Backtests show that holding positions overnight when all trade conditions are still valid can lead to beneficial outcomes. This feature allows traders to take advantage of overnight market movements, providing flexibility beyond intraday trades.
Why This Strategy Stands Out:
Price-Volume Spike Detection: Unlike traditional strategies, this one uniquely focuses on Price-Volume Spike Detection to filter out low-probability trades. By ensuring that both price and volume spikes are present, the strategy guarantees that trades are placed only when there is significant market momentum.
Risk Management with Capital Protection: The strategy strictly limits the risk per trade to 1% of capital, ensuring long-term capital preservation. This is especially important for traders who wish to avoid large drawdowns and prefer a sustainable approach to trading.
2.5x Risk-Reward for Short Trades: Recognizing the sharpness of market declines, the strategy employs a 2.5x risk-reward ratio for short trades, maximizing profits during bearish trends.
Dynamic Exit Strategy: With partial profit booking and ATR-based trailing stops, the strategy is designed to capture gains efficiently while protecting capital through dynamic exit conditions.
Summary of Execution:
Entry: Triggered when JMA crosses EMA, combined with Bollinger Band breakouts and Price-Volume Spike Detection.
Capital Management: Trades are executed with 10% of available capital, and the risk per trade is capped at 1%.
Exit: Trades exit when stop-loss, ATR trailing stop, or time-based exit conditions are met.
Profit Booking: 60% of the position is closed at the first target, with the remainder trailed using an ATR-based stop.

NASDAQ 100 Peak Hours StrategyNASDAQ 100 Peak Hours Trading Strategy
Description
Our NASDAQ 100 Peak Hours Trading Strategy leverages a carefully designed algorithm to trade within specific hours of high market activity, particularly focusing on the first two hours of the trading session from 09:30 AM to 11:30 AM GMT-5. This period is identified for its increased volatility and liquidity, offering numerous trading opportunities.
The strategy incorporates a blend of technical indicators to identify entry and exit points for both long and short positions. These indicators include:
Exponential Moving Averages (EMAs) : A short-term 9-period EMA and a longer-term 21-period EMA to determine the market trend and momentum.
Relative Strength Index (RSI) : A 14-period RSI to gauge the market's momentum.
Average True Range (ATR) : A 14-period ATR to assess market volatility and to set dynamic stop losses and trailing stops.
Volume Weighted Average Price (VWAP) : To identify the market's average price weighted by volume, serving as a benchmark for the trading day.
Our strategy uniquely applies a volatility filter using the ATR, ensuring trades are only executed in conditions that favor our setup. Additionally, we consider the direction of the EMAs to confirm the market's trend before entering trades.
Originality and Usefulness
This strategy stands out by combining these indicators within the NASDAQ 100's peak hours, exploiting the specific market conditions that prevail during these times. The inclusion of a volatility filter and dynamic stop-loss mechanisms based on the ATR provides a robust method for managing risk.
By focusing on the early trading hours, the strategy aims to capture the initial market movements driven by overnight news and the opening rush, often characterized by higher volatility. This approach is particularly useful for traders looking to maximize gains from short-term fluctuations while limiting exposure to longer-term market uncertainty.
Strategy Results
To ensure the strategy's effectiveness and reliability, it has undergone rigorous backtesting over a significant dataset to produce a sample size of more than 100 trades. This testing phase helps in identifying the strategy's potential in various market conditions, its consistency, and its risk-to-reward ratio.
Our backtesting adheres to realistic trading conditions, accounting for slippage and commission to reflect actual trading scenarios accurately. The strategy is designed with a conservative approach to risk management, advising not to risk more than 5-10% of equity on a single trade. The default settings in the script align with these principles, ensuring that users can replicate our tested conditions.
Using the Strategy
The strategy is designed for simplicity and ease of use:
Trade Hours : Focuses on 09:30 AM to 11:30 AM GMT-5, during the NASDAQ 100's peak activity hours.
Entry Conditions : Trades are initiated based on the alignment of EMAs, RSI, VWAP, and the ATR's volatility filter within the designated time frame.
Exit Conditions : Includes dynamic trailing stops based on ATR, a predefined time exit strategy, and a trend reversal exit condition for risk management.
This script is a powerful tool for traders looking to leverage the NASDAQ 100's peak hours, providing a structured approach to navigating the early market hours with a robust set of criteria for making informed trading decisions.

FreedX Backtest Plus█ Our new FreedX Backtest PLUS template enhances TradingView backtesting with smart features like Mean Reversion, Flexible Volatility, Liquidation Filter, and Better Trend Filtering, making strategies more effective. It lets users set up automated alerts easily. This guide explains how to make the most of these improved features.
The Trading Date Settings feature in our TradingView script allows you to refine their backtesting parameters by specifying trading dates and hours. This feature enhances the accuracy of the backtest by aligning it with specific time frames and days, ensuring that the strategy is tested under relevant market conditions.
Features:
⚙️ Enable Trading Between Specific Dates:
🎯 Purpose:
→ Allows you to limit the backtesting of their strategy to a specific date range.
💡 How to Use:
→ Input the Start Date and End Date for the backtest period.
→ The script will execute the strategy only within this specified date range.
⚙️ Enable Trading Between Specific Hours:
🎯 Purpose:
→ Allows you to limit the backtesting of their strategy to a specific hour range.
💡 How to Use:
→ Input the start and end hour for in Trading Session section.
→ The script will execute the strategy only within this specified hour range.
⚙️ Enable Trading on Specified Days of the Week:
🎯 Purpose:
→ Gives you the option to conduct backtesting on selected days of the week, tailoring the strategy to particular market behaviours that may occur on these days.
💡 How to Use:
→ Select the days of the week for the backtest.
→ The script will activate the trading strategy only on these chosen days.
█ BUY/SELL TRIGGER SETTINGS
The Buy/Sell Trigger Settings feature is designed to provide users with flexibility in defining the conditions for 'LONG' and 'SHORT' signals based on various indicator types. This customization is crucial for tailoring strategies to different trading styles and market conditions.
Features:
⚙️ Single-Line Plotted Indicators :
🎯 Purpose:
→ Enables you to select a single-line plotted indicator as a source for backtesting. You can define specific levels to trigger 'LONG' or 'SHORT' signals.
💡 How to Use:
→ Choose a Single-Line Plotted indicator as the source.
→ Set the top and bottom levels for the indicator.
→ The script triggers 'LONG' signals at the bottom level and 'SHORT' signals at the top level.
⚙️ Two-Line Plotted Indicators :
🎯 Purpose:
→ Allows backtesting with two-line cross plot sources. Signals are generated based on the crossover of these lines.
💡 How to Use:
→ Select two lines as 'Source 1' and 'Source 2' for the indicator.
→ The script triggers a 'LONG' signal when 'Source 1' crosses above 'Source 2'.
→ Conversely, a 'SHORT' signal is triggered when 'Source 2' crosses above 'Source 1'.
⚙️ Custom Signals :
🎯 Purpose:
→ This setting enables users to define their own criteria for LONG, SHORT, and CLOSE signals based on custom indicator outputs.
💡 How to Use:
→ Select the custom source for your signals.
→ Define the output values that correspond to each signal type (e.g., “1” for 'LONG', “-1” for SHORT, and “0” for CLOSE).
→ The script will trigger signals according to these custom-defined values.
█ TP/SL SETTINGS
The TP/SL (Take Profit/Stop Loss) Settings feature is designed to give users control over their profit securing and risk mitigation strategies. This feature allows for setting custom TP and SL levels, which can be critical in managing trades effectively.
Features:
Custom TP/SL Levels for Long/Short Signals:
🎯 Purpose:
→ Enables users to set specific percentage levels for Take Profit and Stop Loss on long and short signals.
💡 How to Use:
→ In the TP/SL Settings, input the desired percentage for Take Profit (TP) and Stop Loss (SL).
→ For example, to secure a profit at a 10% price increase on LONG signals, set the “Long TP Percentage” to “10”.
█ STRATEGY SETTINGS
Strategy Settings provide a range of options to customize the trading strategy. These settings include leverage, position direction changes, and more, allowing users to tailor their strategy to their risk tolerance and market view.
Features:
⚙️ Enable Reverse Position:
🎯 Purpose:
→ Automatically closes a current position and opens a new one in the opposite direction upon detecting a signal for a market trend change.
🎯 Example:
→ If a LONG signal is received while in a SHORT position, the script will close the SHORT position and open a LONG position.
💡 How to Use:
→ Activate this feature in the Strategy Settings.
⚙️ Enable Spot Mode:
🎯 Purpose:
→ Disables short orders, using short signals only for closing long positions.
💡 How to Use:
→ Select the 'Spot Mode' option in the Strategy Settings.
⚙️ Enable Invert Signals:
🎯 Purpose:
→ Inverts all indicator signals, changing LONG signals to SHORT and vice versa.
💡 How to Use:
→ Opt for the 'Invert Signals' feature in the Strategy Settings.
⚙️ Enable Trailing Stop:
🎯 Purpose:
→ Triggers a trailing stop order on the exchange instead of a standard stop market order.
☢️ Caution:
→ The backtesting of this feature on TradingView may not accurately reflect actual strategy performance due to discrepancies between TradingView and exchange mechanisms.
💡 How to Use:
→ Select 'Trailing Stop' in the Strategy Settings.
⚙️ Enable Realistic TP & SL:
🎯 Purpose:
→ Goal is protect the user from unrealistic stop loss and take profit prices in live exchange trading conditions.
→ That feature continuously checks the take profit, stop loss and move stop loss prices to prevent unrealistic values. It changes their values according to (minimum realistic percent %)
💡 How to Use:
→ Select 'Enable Realistic TP & SL' in the Strategy Settings. Write min allowed percents.
█ LIMITER SETTINGS
Limiter Settings provide a range of options to customize the trading strategy. These settings include drawdown limits,contract limit, tradable ratio, for allowing users to tailor their strategy to their risk tolerance and market view.
⚙️ Leverage :
🎯 Purpose:
→ Allows users to apply leverage to their trades.
☢️ Caution:
→ High leverage can significantly increase the risk of liquidation.
→ High leverage and a high stop-loss price may override your fixed stoploss percentage, adjusting the stop-loss to the liquidation price.
💡 How to Use:
→ Set the desired leverage ratio in the Strategy Settings.
⚙️ Drawdown Limit:
🎯 Purpose:
→ Sets a maximum drawdown limit, automatically halting the strategy if this limit is reached, thereby controlling risk.
💡 How to Use:
→ Input the maximum drawdown limit (default: 100, min: 0, max: 100).
⚙️ Contract Limit:
🎯 Purpose:
→ Sets a maximum contract limit, beyond which the compound effect cannot be used. This is important to prevent market manipulation through large-volume orders.
💡 How to Use:
→ Input the maximum contract limit (min: 0).
⚙️ Tradable Ratio:
🎯 Purpose:
→ Sets a tradable ratio, it uses that ratio calculating entry cost for position. Main purpose is cash-out and cash-in according to balance change.
💡 How to Use:
→ Input the tradable ratio percent (default: 98, min: 0.1, max: 100).
█ CASH-OUT SETTINGS
Cash-Out Settings offer a money-saving mechanism that prevents entering positions with the entire balance due to cashed-out funds. It functions with a webhook alerts, but the 'Override Allocation %' option must be enabled.
⚙️ Cash-out Threshold %:
🎯 Purpose:
→ It is cash-out mechanism, it saves money with a target threshold.
💡 How to Use:
→ Input the threshold (min: 0).
⚙️ Cash-out Per Profitable Trades %:
🎯 Purpose:
→ It is cash-out mechanism, it saves money from every trade with a percent like commission.
💡 How to Use:
→ Input save percent% (min: 0).
█ ADAPTIVE VOLATILITY STRATEGY SETTINGS
Advanced Strategy Settings offer sophisticated methods for managing Stop Loss (SL) and Take Profit (TP) using the Average True Range (ATR). These settings are ideal for traders who want to incorporate volatility into their exit strategies.
Features:
⚙️ Enable ATR Stop Loss:
🎯 Purpose:
→ Automatically sets the Stop Loss price using the Average True Range at the time of entry.
💡 How to Use:
→ Activate 'ATR Stop Loss' to have the SL price calculated based on the current ATR.
⛓ Enable ATR Trailing Stop:
→ Dynamically updates the Stop Loss price with each new bar, according to the Average True Range.
→ Activate 'ATR Trailing Stop'.
→ Set the ATR Period to define the number of bars for ATR calculation.
→ Adjust the ATR SL Multiplier to determine the stop loss distance.
→ Modify the ATR TP Multiplier for setting the take profit distance.
⚙️ Enable ATR Take Profit:
🎯 Purpose:
→ Sets the Take Profit price based on the Average True Range at the time of entry.
💡 How to Use:
→ Choose 'ATR Take Profit' for TP price determination using ATR.
⚙️ Enable ATR Limit Entry:
🎯 Purpose:
→ Trade can not open in candle close price. Price should hit target price that based on average true range value.
💡 How to Use:
→ Choose 'ATR Limit Entry' for entry price determination using ATR.
⛓ Enable ATR Limit Entry Trailing Price:
→ Dynamically updates the entry price with each new bar, according to the Average True Range.
→ Activate 'ATR Limit Entry Trailing Price'.
→ Set the ATR Period to define the number of bars for ATR calculation.
→ Adjust the ATR SL Multiplier to determine the stop loss distance.
→ Modify the ATR TP Multiplier for setting the take profit distance.
█ TREND FILTERING SETTINGS
Trend Filtering Settings are designed to align trading strategies with the prevailing market trend, enhancing the precision of trade entries and exits. These settings utilize moving averages for trend analysis and decision-making.
Features:
⚙️ Enable Moving Average Filtering:
🎯 Purpose:
→ Limits trades based on moving average trends, blocking short trades in an uptrend and vice versa.
💡 How to Use:
→ Enable 'Trend Filtering'.
→ Set Fast and Slow MA Lengths for trend analysis.
→ Select the Timeframe for moving averages.
→ Choose the Moving Average Type for trend filtering.
🎯 Note:
→ Be cautious with timeframe selections; lower timeframes than the base may cause inconsistencies.
⛓ Exit on Trend Reversal:
→ Automatically closes a position when a market trend reversal is detected.
→ Turn on 'Exit on Trend Reversal' in the settings.
⛓ Ignore Counter Signals:
→ Ignores counter signals during trending market way.
→ If the trend way is long. All short signals will ignore and vice versa.
⛓ Enable Drawing On Chart:
→ Visually represents the trend filter directly on the chart for easy reference.
→ Activate 'Drawing On Chart' to see the trend filter overlaid on the trading chart.
⚙️ Enable Adx Filtering:
🎯 Purpose:
→ Limits trades based on adx value, blocking trades if trend strength is not enough or vice versa for invert mode.
💡 How to Use:
→ Enable 'Adx Filtering'.
→ Set Smoothing and Lengths for adx trend analysis.
→ Select level barrier for trend strength.
⚙️ Enable Custom Filtering:
🎯 Purpose:
→ Limits trades based on custom sources, blocking trades according to custom trades.
💡 How to Use:
→ Enable 'Custom Filtering'.
→ Select fast source.
→ Select slow source.
→ Enable lag mode.
█ MEAN REVERSION FILTERING SETTINGS
Mean Reversion Filtering Settings are designed to align trading strategies during accumulation market conditions. They set a distance from a line to permit trading. The purpose is to ensure that when the price strays too far from the mean line, it should revert back. In accumulation markets, price movements are generally horizontal. In such situations, mean reversion will operate like a grid, enabling profitable trades with low drawdown. However, when the market structure begins to trend, mean reversion filters may not be as profitable as in accumulation markets. For instance, let's say the price is rising and we are shorting the market until it reaches the mean price line. As the price goes up and the mean also rises, we will end up closing the position at a higher price, rendering the mean reversion system non-profitable. Therefore, consider this filter wisely; greater distances might work better in trending markets.
Features:
⚙️ Enable Kairi Filter:
🎯 Purpose:
→ Blocks trades based on distance percent between price and moving average.
💡 How to Use:
→ Enable 'Kairi Filter'.
→ Set Length and Distance Percent.
⛓ Enable Trend Drawing On Chart:
→ Visually represents the trend filter directly on the chart for easy reference.
→ Enable 'Drawing On Chart' to see the allowed regions overlaid on the trading chart with arrows.
⚙️ Enable VWAP Filter:
🎯 Purpose:
→ Blocks trades based on distance percent between price and volume weighted average price.
💡 How to Use:
→ Enable 'VWAP Filter'.
→ Set Timeframe as minutes and distance as percent.
⛓ Exit on Crossing with VWAP:
→ Automatically closes a position when the closing price of a candle crosses the VWAP.
→ Choose "Enable", 'Exit on Crossing with VWAP' in the settings.
⛓ Enable Drawing On Chart:
→ Visually represents the trend filter directly on the chart for easy reference.
→ Enable 'Drawing On Chart' to see the allowed regions overlaid on the trading chart with arrows.
█ LIQUIDATION FILTER SETTINGS
Liquidation filter compares the volume data of futures and spot markets.
Large differences in volume indicate unexpected market conditions, such as massive trading activities, which may signal liquidations.
Features:
⚙️ Enable Liquidation Filter:
🎯 Purpose:
→ Blocks trades based on extra ordinary volume differences in spot and futures market.
💡 How to Use:
→ Enable 'Liquidation Filter'.
→ Set behavior to react during that market conditions.
→ Set base amount to filter volume. This amount changes according to timeframe, you should find right amounts.
→ Liquidation candle count means, it is sum of liquidated candle count in last 20 bars.If you set 0, it means feature is disabled.
→ Detection, try to select the spot and perpetual symbols automatically, symbol names varies, it do not support all symbols, you should choose manually in that situation.
█ AUTOMATED ALERT SETTINGS
Automated Alert Settings are designed to integrate your TradingView script with webhook alerts. These settings allow for enhanced strategy execution and management.
Features:
Enable Webhook Alerts:
🎯 Purpose:
→ Trigger BUY, SELL, CHANGE_DIRECTION or MOVE_STOP_LOSS .
💡 How to Use:
→ Enable 'Webhook Alerts' in the settings.
→ Enter your Strategy Key.
→ Optionally, activate 'Override Allocation Percentage' to bypass the preset allocation percentage.
☢️ Caution:
→ Overriding the allocation percentage may result in trade entry errors due to misalignment between entry cost and available balance.
Enable Custom Alerts:
🎯 Purpose:
→ User can produce unique messages for different purposes.
💡 How to Use:
→ Enable 'Custom Alerts' in the settings.
→ Enter your message format type.
█ DEBUGGING SETTINGS
Debugging Settings are crucial for users who want to analyze and optimize their strategies. These settings provide tools for visualizing alerts on charts and accessing detailed data outputs.
Features:
⚙️ Enable Alert Plotting:
🎯 Purpose:
→ Allows users to visualize trading alerts directly on the chart, aiding in strategy analysis and refinement.
💡 How to Use:
→ Activate 'Alert Plotting' to draw alerts on the chart.
☢️ Caution:
→ It is recommended to disable this feature when creating actual trading alerts, as it can cause latency in signal processing.
⚙️ Enable Debugger Mode:
🎯 Purpose:
→ Facilitates strategy debugging by providing detailed data output in the TradingView Data Window.
💡 How to Use:
→ Turn on 'Debugger Mode' to access real-time data and metrics relevant to your strategy.
⚙️ Enable Table:
🎯 Purpose:
→ Facilitates strategy debugging by providing detailed data output in the TradingView Table on chart.
💡 How to Use:
→ Turn on 'Table' to access last closed candle data and metrics relevant to your strategy.
█ ADDITIONAL SETTINGS
⚙️ Enable Bar Magnifier
⚙️ Enable Using standard OHLC

FreedX Backtest█ Our strategy template empowers TradingView users to effortlessly backtest any indicator, enhancing their trading strategy's effectiveness. In addition, users can create automated webhook alerts from the template. This document details our template's features and how to utilize them effectively.
█ TRADE DATE SETTINGS
The Trading Date Settings feature in our TradingView script allows you to refine their backtesting parameters by specifying trading dates and hours. This feature enhances the accuracy of the backtest by aligning it with specific time frames and days, ensuring that the strategy is tested under relevant market conditions.
Features:
⚙️ Enable Trading Between Specific Dates:
🎯 Purpose:
→ Allows you to limit the backtesting of their strategy to a specific date range.
💡 How to Use:
→ Input the Start Date and End Date for the backtest period.
→ The script will execute the strategy only within this specified date range.
⚙️ Enable Trading Between Specific Hours:
🎯 Purpose:
→ Allows you to limit the backtesting of their strategy to a specific hour range.
💡 How to Use:
→ Input the start and end hour for in Trading Session section.
→ The script will execute the strategy only within this specified hour range.
⚙️ Enable Trading on Specified Days of the Week:
🎯 Purpose:
→ Gives you the option to conduct backtesting on selected days of the week, tailoring the strategy to particular market behaviours that may occur on these days.
💡 How to Use:
→ Select the days of the week for the backtest.
→ The script will activate the trading strategy only on these chosen days.
█ BUY/SELL TRIGGER SETTINGS
The Buy/Sell Trigger Settings feature is designed to provide users with flexibility in defining the conditions for 'LONG' and 'SHORT' signals based on various indicator types. This customization is crucial for tailoring strategies to different trading styles and market conditions.
Features:
⚙️ Single-Line Plotted Indicators :
🎯 Purpose:
→ Enables you to select a single-line plotted indicator as a source for backtesting. You can define specific levels to trigger 'LONG' or 'SHORT' signals.
💡 How to Use:
→ Choose a Single-Line Plotted indicator as the source.
→ Set the top and bottom levels for the indicator.
→ The script triggers 'LONG' signals at the bottom level and 'SHORT' signals at the top level.
⚙️ Two-Line Plotted Indicators :
🎯 Purpose:
→ Allows backtesting with two-line cross plot sources. Signals are generated based on the crossover of these lines.
💡 How to Use:
→ Select two lines as 'Source 1' and 'Source 2' for the indicator.
→ The script triggers a 'LONG' signal when 'Source 1' crosses above 'Source 2'.
→ Conversely, a 'SHORT' signal is triggered when 'Source 2' crosses above 'Source 1'.
⚙️ Custom Signals :
🎯 Purpose:
→ This setting enables users to define their own criteria for LONG, SHORT, and CLOSE signals based on custom indicator outputs.
💡 How to Use:
→ Select the custom source for your signals.
→ Define the output values that correspond to each signal type (e.g., “1” for 'LONG', “-1” for SHORT, and “0” for CLOSE).
→ The script will trigger signals according to these custom-defined values.
█ TP/SL SETTINGS
The TP/SL (Take Profit/Stop Loss) Settings feature is designed to give users control over their profit securing and risk mitigation strategies. This feature allows for setting custom TP and SL levels, which can be critical in managing trades effectively.
Features:
Custom TP/SL Levels for Long/Short Signals:
🎯 Purpose:
→ Enables users to set specific percentage levels for Take Profit and Stop Loss on long and short signals.
💡 How to Use:
→ In the TP/SL Settings, input the desired percentage for Take Profit (TP) and Stop Loss (SL).
→ For example, to secure a profit at a 10% price increase on LONG signals, set the “Long TP Percentage” to “10”.
█ STRATEGY SETTINGS
Strategy Settings provide a range of options to customize the trading strategy. These settings include leverage, drawdown limits, position direction changes, and more, allowing users to tailor their strategy to their risk tolerance and market view.
Features:
⚙️ Enable Leverage :
🎯 Purpose:
→ Allows users to apply leverage to their trades.
☢️ Caution:
→ High leverage can significantly increase the risk of liquidation.
→ High leverage and a high stop-loss price may override your fixed stoploss percentage, adjusting the stop-loss to the liquidation price.
💡 How to Use:
→ Set the desired leverage ratio in the Strategy Settings.
⚙️ Enable Drawdown Limit:
🎯 Purpose:
→ Sets a maximum drawdown limit, automatically halting the strategy if this limit is reached, thereby controlling risk.
💡 How to Use:
→ Input the maximum drawdown limit (default: 100, min: 0, max: 100).
⚙️ Enable Reverse Position:
🎯 Purpose:
→ Automatically closes a current position and opens a new one in the opposite direction upon detecting a signal for a market trend change.
🎯 Example:
→ If a LONG signal is received while in a SHORT position, the script will close the SHORT position and open a LONG position.
💡 How to Use:
→ Activate this feature in the Strategy Settings.
⚙️ Enable Spot Mode:
🎯 Purpose:
→ Disables short orders, using short signals only for closing long positions.
💡 How to Use:
→ Select the 'Spot Mode' option in the Strategy Settings.
⚙️ Enable Invert Signals:
🎯 Purpose:
→ Inverts all indicator signals, changing LONG signals to SHORT and vice versa.
💡 How to Use:
→ Opt for the 'Invert Signals' feature in the Strategy Settings.
⚙️ Enable Trailing Stop:
🎯 Purpose:
→ Triggers a trailing stop order on the exchange instead of a standard stop market order.
☢️ Caution:
→ The backtesting of this feature on TradingView may not accurately reflect actual strategy performance due to discrepancies between TradingView and exchange mechanisms.
💡 How to Use:
→ Select 'Trailing Stop' in the Strategy Settings.
█ ADVANCED STRATEGY SETTINGS
Advanced Strategy Settings offer sophisticated methods for managing Stop Loss (SL) and Take Profit (TP) using the Average True Range (ATR). These settings are ideal for traders who want to incorporate volatility into their exit strategies.
Features:
⚙️ Enable ATR Stop Loss:
🎯 Purpose:
→ Automatically sets the Stop Loss price using the Average True Range at the time of entry.
💡 How to Use:
→ Activate 'ATR Stop Loss' to have the SL price calculated based on the current ATR.
⚙️ Enable ATR Take Profit:
🎯 Purpose:
→ Sets the Take Profit price based on the Average True Range at the time of entry.
💡 How to Use:
→ Choose 'ATR Take Profit' for TP price determination using ATR.
⚙️ Enable ATR Trailing Stop:
🎯 Purpose:
→ Dynamically updates the Stop Loss price with each new bar, according to the Average True Range.
💡 How to Use:
→ Activate 'ATR Trailing Stop'.
→ Set the ATR Period to define the number of bars for ATR calculation.
→ Adjust the ATR SL Multiplier to determine the stop loss distance.
→ Modify the ATR TP Multiplier for setting the take profit distance.
█ TREND FILTERING SETTINGS
Trend Filtering Settings are designed to align trading strategies with the prevailing market trend, enhancing the precision of trade entries and exits. These settings utilize moving averages for trend analysis and decision-making.
Features:
⚙️ Enable Trend Filtering:
🎯 Purpose:
→ Limits trades based on moving average trends, blocking short trades in an uptrend and vice versa.
💡 How to Use:
→ Enable 'Trend Filtering'.
→ Set Fast and Slow MA Lengths for trend analysis.
→ Select the Timeframe for moving averages.
→ Choose the Moving Average Type for trend filtering.
🎯 Note:
→ Be cautious with timeframe selections; lower timeframes than the base may cause inconsistencies.
⚙️ Enable Exit on Trend Reversal:
🎯 Purpose:
→ Automatically closes a position when a market trend reversal is detected.
💡 How to Use:
→ Turn on 'Exit on Trend Reversal' in the settings.
⚙️ Enable Trend Drawing On Chart:
🎯 Purpose:
→ Visually represents the trend filter directly on the chart for easy reference.
💡 How to Use:
→ Activate 'Trend Drawing On Chart' to see the trend filter overlaid on the trading chart.
█ AUTOMATED ALERT SETTINGS
Automated Alert Settings are designed to integrate your TradingView script with webhook alerts. These settings allow for enhanced strategy execution and management.
Features:
Enable Webhook Alerts:
🎯 Purpose:
→ Trigger BUY, SELL, CHANGE_DIRECTION or MOVE_STOP_LOSS .
💡 How to Use:
→ Enable 'Webhook Alerts' in the settings.
→ Enter your Strategy ID.
→ Optionally, activate 'Override Allocation Percentage' to bypass the preset allocation percentage.
☢️ Caution:
→ Overriding the allocation percentage may result in trade entry errors due to misalignment between entry cost and available balance.
█ DEBUGGING SETTINGS
Debugging Settings are crucial for users who want to analyze and optimize their strategies. These settings provide tools for visualizing alerts on charts and accessing detailed data outputs.
Features:
⚙️ Enable Alert Plotting:
🎯 Purpose:
→ Allows users to visualize trading alerts directly on the chart, aiding in strategy analysis and refinement.
💡 How to Use:
→ Activate 'Alert Plotting' to draw alerts on the chart.
☢️ Caution:
→ It is recommended to disable this feature when creating actual trading alerts, as it can cause latency in signal processing.
⚙️ Enable Debugger Mode:
🎯 Purpose:
→ Facilitates strategy debugging by providing detailed data output in the TradingView Data Window.
💡 How to Use:
→ Turn on 'Debugger Mode' to access real-time data and metrics relevant to your strategy.
█ ADDITIONAL SETTINGS
⚙️ Enable Bar Magnifier
⚙️ Enable Using standard OHLC

Doji Trading StrategyA doji names a trading session in which a security has an open and close that are virtually equal, which resembles a candlestick on a chart. The word doji comes from the Japanese phrase meaning “the same thing.” A doji candlestick is a neutral indicator that provides little information.
Trading Day and Time SessionThis script provides options for the user to choose:
- Start date and End date
- Trade time during a day (With UTC offset)
- Which days of the week to trade
It return a condition if all the date and time conditions are true. It's very easy to integrate with any script.

Crypto BTC Correlation Scalper Gaps StrategyThis strategy is based on the gaps theory.
In this case we have the BTC futures from CME, which acts in a way similar to stocks, and we can have gaps present between close/open session, and also sometimes between same candle due to huge movements intra candle.
At the same time I have combined this with a daily moving average, to help out a bit with the trend, since we are looking at small timeframe like 1-15/30min .
On top of that we have a reverse option, where long = short and viceversa, which can be used with against BTC pairs .
Rule are simple:
For long, we have a long gap and the close of the correlated candle is above daily sma
For short, we have a short gap and the close of the correlated candle is below daily sma
For exit:
For exit, we take the highest highest values for short entry TP, meaning we get the different from the HH and rest the current open candle distance, and use that distance as a TP.
At the same time for long entry, we take the lowest low value and rest current close of the candle to that value, and we get the TP.
Can also be applied this logic for SL aswell but from the test I have found out that exiting based on a reverse condition(when tp is not being hit), gives better results/dd overall.
If you have any questions, please let me know !

Open High Low StrategyThis is a very simple, yet effective and to some extend widely followed scalping strategy to capture the underling sentiments of the counter whether it will go up or down.
What is it?
This is Open-High-Low (OLH) strategy.
As you already aware of Candlestick patterns, there is patterns called as Marubozu patterns where the sell wick or buy wick either ceases to exists (or very small). This is exactly in the same principle.
In OLH strategy: The buy signal appears when the Open Price is the Low Price. It means if you draw the candlestick, there is no bottom wick. So after the opening of the candle, the demand drives the price up to the level, some selling may or may not come and closes in green. This indicates a strong upward biasness of the underlying counter.
Similarly, a sell signal appears when the Open price is the High Price. It means there is no upper wick. So there is no buying pressure, since the opening of the candle, sellers are in force and pulls down the price to a closing.
This strategy generates the signal at the close of the candle (technically barstate.isconfirmed). Because until the bar is real-time there is no option to know the final closing or high. So you will see the bar on which it generates the buy or sell signal is actually indicates the previous bar as OLH bar.
To determine the Stop-Loss, it uses the most widely known SL calculation of:
For buy signal, it takes the low of the last 7 candles and substract the ATR (Average True Range) of 14-period.
For sell signal, it takes the high of the last 7 candles and add it to the ATR (Average True Range) of 14-period.
One can plot the SL lines as dotted green and red lines as well to see visually.
Default Risk:Reward is 1:2, Can be customizable.
What is Unique?
Of course the utter simplistic nature of this strategy is it's key point. Very easy and intuitive to understand.
There are awesome strategies in this forum that talks about the various indicators combinations and what not.
Instead of all this, in a 15m NSE:NIFTY chart, it generates a good ~ 47% profit-factor with 1:2 Risk Reward ratio. Means if you loose a trade you will loose 1% of account and if you win you will gain 2%. Means 3 trades (2 profits and 1 loss) in a trading session result 3% overall gain for the day. (Assuming you are ready with 1% draw down of your account per trade, at max).
Disclaimer:
This piece of software does not come up with any warrantee or any rights of not changing it over the future course of time.
We are not responsible for any trading/investment decision you are taking out of the outcome of this indicator.

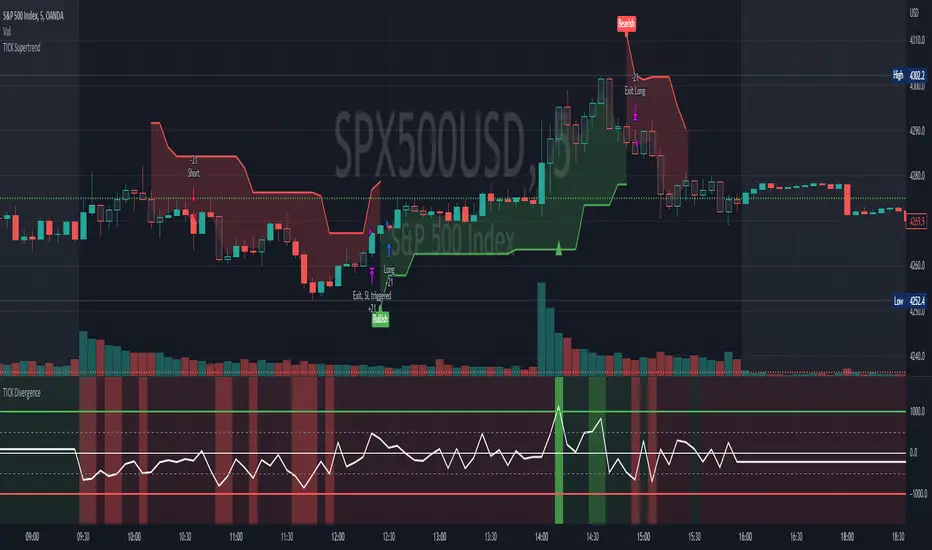
[Pt] TICK Supertrend Strategy, 5 minBackground:
It is well known that the indices such as SPY and QQQ follow/represent market sentiment. The TICK index literally represents the market sentiment as it compares the number of stocks that are rising and falling on the NYSE. By default, the TICK index is a short term indicator. Therefore it isn't reliable for swing trading or long term strategies. However, it is perfect for scalping.
Although TICK is well known, many does not know how to use it effectively. As part of the background mechanism of this script, I’ve divided TICK into 5 major zones based on the close of each candle: Overbought (neutral with bearish bias), Bullish, Neutral, Bearish, and Oversold (neutral with bullish bias). Along with the use of Heikin Ashi technique, RSI, moving averages and candle analysis, this strategy aims to provide accurate representation of market sentiment and profitable entry and exit points. *** At the time of publication, this strategy has proved to be consistently profitable. HOWEVER, this DOES NOT guarantee future profitability. So use at your own risk! ***
What is it showing?
This strategy is an intraday scalping strategy that uses TICK data to predict market directions for optimal entry and exit points. It is displayed similarly to the famous Supertrend indicator, which is one of the most common ATR based trailing stop indicators, so visually it is easy to read. This strategy is suitable for trading indices such as SPX , SPY , SPX500USD , QQQ , DJI and any other tickers that have high positive correlation with TICK.
Script is proprietary, but as mentioned it incorporates the following elements with additional candlestick analysis, pattern recognition, stop-loss and profit taking strategy:
- NYSE TICK data
- Heikin Ashi candle technique
- ATR
- RSI
- Moving Averages
Bullish trend is determined by a confluence of said indicators and analyses, and is displayed as a green line under the price action. The distance is defined by an adjustable value that is based on a percentage of the previous daily ATR value. When a long order is in play, that line also acts as the stop-loss level. Bearish trend is the opposite and is displayed in red, by default.
What's unique?
Detecting a ranging market structure and avoiding overtrading in a choppy market has always proven to be difficult, even for the most professional traders. This strategy has built-in “choppiness” and volatility filtering scripts that attempts to help reduce the number of false entries. These elements are what makes this strategy unique and different from other indictors mashup strategies.
In addition, this strategy takes previous trades into account and “learn” from past trades when determining the optimal stop-loss level to maximize profitability. This allows this strategy to better adapts to changing and evolving market conditions.
Strategy statistics
All parameters are designed for 5min time frame.
At the time of publication, this strategy has proved to be consistently profitable through limited back testing data.
Initial capital = $10000
Pyramiding = 1
Slippage = 3 ticks to account for spread
Default leverage shown = 9x
Quantity per trade = 100% of account
Back testing period at time of publication = Apr 11, 2022 - July 22, 2022
Trading Session = 1000 - 1530 Mon-Fri
Timeframe = 5 min
Gain = 1338.48%
Total trades = 253
% Profitable = 45.85%
Profit Factor = 2.506
Max Drawdown = 19.36%
Extras
This release includes default AutoView alerts for trading SPX500USD on Oanda. It includes both long and short order entry alerts, and trailing stop-loss alerts.
Please DM for free trial.
Buy Monday, Exit WednesdayStrategy to go long at end of Monday before market closes and exit before Wednesday close, or at stop loss or take profit percentages
This runs strategy on entering by weekday name and also by session time.
Implemented are also Take Profit and Stop Loss to exit position using custom inputs.
Added stop loss and take profit plot lines
IPB_JPMUPS_2022Introduction :
This indicator serves two purposes
a) It is a multi dimensional floor pivot indicator, which takes its concepts from Secrets of Pivot Boss book of Frank Ochoa. Most of the indicators suggested in the book are packed in one indicator.
b) It also has an inbuilt intraday strategy which identifies trend, direction and momentum based on CPR (Central Pivot Range) concepts and accordingly comes up with trading signals.
How this indicator is different from the published ones :
A). Role as an indicator
This indicator has all the CPR (Central Pivot Range) indicators packed together which provides a ready made solution for CPR based trading. The following are the salient features of this indicator :
1) This indicator plots daily CPR using previous day high, low and close. It also plots Support and Resistance levels based on floor pivots formula.
Moreover, it also plots developing CPR which is based on current day's high, low and close. Apart from that it also plots CPR for next day session as well which is useful for EOD analysis.
2) This indicator plots weekly CPR using previous week high, low and close. It also plots developing CPR which is based on current week's high, low and close.
3) This indicator plots monthly CPR using previous month high, low and close. It also plots developing CPR which is based on current month's high, low and close.
4) This indicator plots pivot EMA which is called PEMA. It uses three different EMAs which are customisable and uses them to plot a moving average web based on pivot points of each candle, which is called as PEMA. This also facilitates PEMA plotting for higher time frame (daily time frame) as well.
5) This indicator plots daily time frame moving average in intraday chart which can be used as a key zone during trading. The period is customisable.
B) Role as a strategy
This indicator also functions as an intraday trading strategy called JPMUPS (JP stands for author's nickname. MUPS stands for Manoj Ultimate Pivot Strategy). This strategy attempts to identify trend, direction and momentum and when all these three align together it gives buy and sell signals. The concepts are as under:
Trend identification :
Whenever a trend is established, the developing CPR starts to widen. Hence this strategy uses the width of the developing CPR and compares it with the MA of the width to identify the trend. If the width of the developing CPR crosses the 34 period MA (can be customised), it assumes a trend is developing.
Direction identification:
Whenever a direction is established, the CPR components, namely BC and TC shifts its position. Hence this strategy uses this concept to identify the direction. It computes MACD sort of histogram of the BC and TC difference and whenever the histogram slops upwards, it assumes bullish direction and vice versa.
Momentum identification :
Whenever momentum is established, the developing CPR starts sloping upwards. Hence this strategy uses this concept to identify the momentum. It computes RSI of the developing CPR and if the RSI is above the 34 period MA (can be customised) of RSI , it assumes momentum is establishing and vice versa.
When all the above are aligned together, it gives buy or sell signals suitably.
How to use it :
a) Indicator usage :
1) CPR zones are key zones which predominantly acts as support and resistance zones. Looking at the price action at these zones, one can look for trading opportunities in live market.
2) Developing CPR acts as pull back zones and is very useful in live trading and also EOD analysis for spotting opportunities by combining price action.
b) Strategy usage :
1). Strategy signals are only indicative. Users are strongly advised not to use the strategy blindly. Users are advised to go though the CPR concepts thoroughly and use this strategy signals only as a supplement for further decision making / analysis.
Markets meant for :
1). This indicator and Strategy is predominantly designed for I ndian stock markets . However it can be customised for other markets as well by changing the timings of the markets in the parameters.
Market conditions meant for :
1). This indicator is meant for all types of market conditions as its predominant role is to plot the key support and resistance zones using CPR concepts.
2). The strategy is mainly found to be effective in trending markets and predominantly indices like Nifty and Bank Nifty . Hence Users are advised to use this only as an indicative feature and not blindly trade based on signals. The strategy is found to be less effective in lower time frames like 1min / 3min, etc. 15 min time frame provides fair performance. However it doesnt mean that it will continue to perform in the same manner in the future.

3ngine Global BoilerplateABOUT THE BOILERPLATE
This strategy is designed to bring consistency to your strategies. It includes a macro EMA filter for filtering out countertrend trades,
an ADX filter to help filter out chop, a session filter to filter out trades outside of desired timeframe, alert messages setup for automation,
laddering in/out of trades (up to 6 rungs), trailing take profit , and beautiful visuals for each entry. There are comments throughout the
strategy that provide further instructions on how to use the boilerplate strategy. This strategy uses `threengine_global_automation_library`
throughout and must be included at the top of the strategy using `import as bot`. This allows you to use dot notation
to access functions in the library - EX: `bot.orderCurrentlyExists(orderID)`.
HOW TO USE THIS STRATEGY
1. Add your inputs
There is a section dedicated for adding your own inputs near the top of the strategy, just above the boilerplate inputs
2. Add your calculations
If your strategy requires calculations, place them in the `Strategy Specific Calculations` section
3. Add your entry criteria
Add your criteria to strategySpecificLongConditions (this gets combined with boilerplate conditions in longConditionsMet)
Add your criteria to strategySpecificShortConditions (this gets combined with boilerplate conditions in shortConditionsMet)
Set your desired entry price (calculated on every bar unless stored as a static variable) to longEntryPrice and shortEntryPrice. ( This will be the FIRST ladder if using laddering capabilities. If you pick 1 for "Ladder In Rungs" this will be the only entry. )
4. Plot anything you want to overlay on the chart in addition to the boilerplate plots and labels. Included in boilerplate:
Average entry price
Stop loss
Trailing stop
Profit target
Ladder rungs

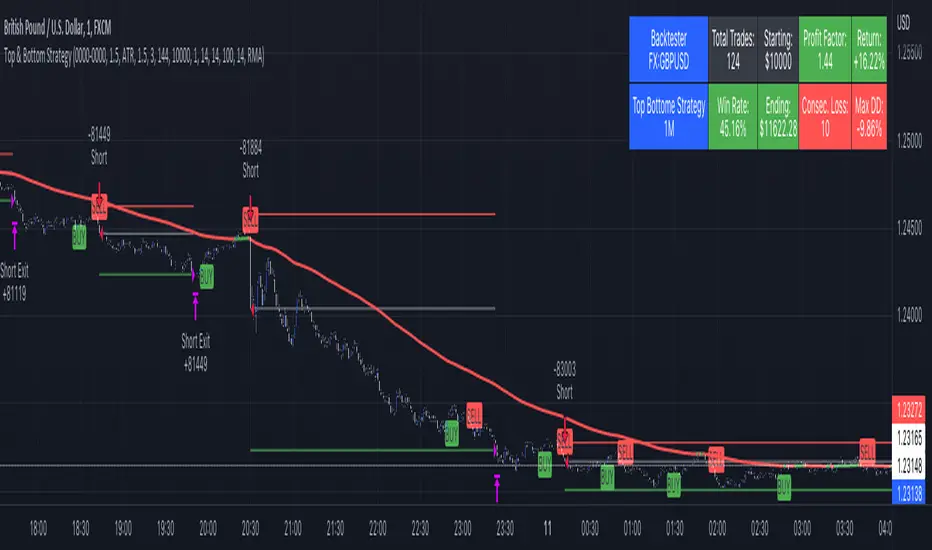
Top & Bottom Strategy by The Accumulation ZoneHey Guy's welcome back to another Strategy based on a popular Indicator!
Indicators used in this Strategy:
-> Top and Bottom by ceyhun (Basic Settings)
-> Volatility Oscillator by verifid (Basic Settings)
Long Entry Criteria:
1. New Buy Signal from the Top & Bottom Indicator
2. Bullish Spike to the upside on the Volatility Oscillator ( above the BB Bands)
3. Enter Long (SL based on ATR, RR 1.5)
Short Entry Criteria:
1. New Sell Signal from the Top & Bottom Indicator
2. Bearish Spike to the downside on the Volatility Oscillator ( below the BB Bands)
3. Enter Short (SL based on ATR, RR 1.5)
Optional Filters:
- Session Filter
- Date Filter
- EMA Filter
IMPORTANT use this only for testing purpose. Don't Risk any Money. For educational Purpose Only!
Boom Hunter Pro Strategy by The Accumulation ZoneHey guy's it's Matt from the Accumulation Zone here with a new Strategy for you guys to try out!
The Indicators used in this Strategy:
-> Boom Hunter Pro by veryfid
-> Hull Suite by InSillico
-> Volatility Oscillator by veryfid
Long Entry Conditions:
-> Bullish Crossover on Boomhunter Pro
-> Price closing above green Hull Suite
-> Volatility Spike to the upside
Short Entry Conditions:
-> Bearish Crossover on Boomhunter Pro
-> Price closing below red Hull Suite
-> Volatility Spike to the downside
Risk to Reward Ratio: 1.5
Stop/Loss Method: ATR based
Optional Filters:
- Session Filter
- Date Filter
- EMA Filter
Indicator Settings:
Hull Suite: Length = 200 , Multiplier = 3
Boom Hunter Pro: Only Quotient 2 and Quotient 1 in Style Section

Breakout Finder Strategy by The Accumulation ZoneThe Breakout Strategy:
Indicators used:
Least Squared Moving Average by Tradingview
Smoothed Moving Average by Tradingview
MACD Support Resistance by venkatachari_n
About this Strategy:
This strategy is based on spotting a particular activity pattern involving the above listed indicators:
A fast moving average that will track closely with price while still smoothing out some price chop
A slower least squared moving average to help gauge short-term momentum
MACD Support and Resistance to help identify longer-term trends and potentially serve to also guide directional bias
If all entry conditions are met, the strategy enters a position. As well as sending an alert message for the Entry, TP/SL Signals
Long Condition:
Price close above MACD S/R Line
SMMA crossed MACD S/R Line to the upside
LSMA crossed MACD S/R Line to the upside
Short Condition:
Price close below MACD S/R Line
SMMA crossed MACD S/R Line to the downside
LSMA crossed MACD S/R Line to the downside
Strategy Settings
SL based on ATR Bands (0.9 ATR Multiplier recommended*)
TP based on RR (1.5 RR recommended*)
Optional EMA Filter (If set to 0 -> disabled)
Session Filter
Custom Strategy Backtesting Dashboard (Risk = 5%*)
*Recommended for a Daily BTC/USDT Chart

MACD Willy StrategyThis strategy is mainly developed for scalping / intraday trading. It could potentially be used to identify entry/exit signals for short term options trading. It performs decently well on popular stocks when used on time frames between 5 min to 15 min using regular session bar data. It combines 3 popular indicators, EMA, MACD, and William %range, to generate both long and short signals.
EMA:
Default is 200 EMA line.
MACD:
Default is 12/26 lengths for fast/slow signal inputs.
William %R - Smoothed (Published):
This is a custom indicator that generates two moving average lines from the original William %R line.
How it works:
Entry conditions:
1. Long/short entries when bar closes above/below EMA line
2. Long/short entries when MACD line is above/below signal line (histogram > 0 for long, < 0 for short)
3. Long/short entries when William %R fast MA line is above/below slow MA line
Exit conditions:
1. Exit long when MACD line is below signal line, vise versa for exit short
2. Exit long when William %R fast MA line is below slow MA line, vise versa for exit short
3. Exit long when William %R fast MA line must in below the overbought (-20) limit, exit short when above the oversold (-80) limit.
***Note that parameters are NOT optimized for any particular stocks / instruments.
Enjoy~~!!

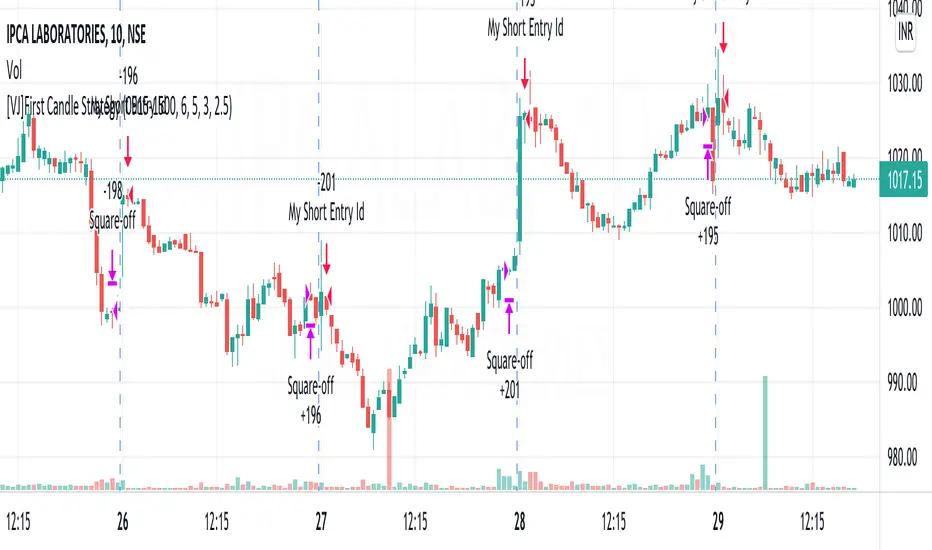
[VJ]First Candle StrategyHello Traders, this is a simple intraday strategy involving the first candle of the day with an additional twist to the traditional style . You can modify the time of candle on the stock and see what are your best picks. Comment below if you found something with good returns
Strategy: Observe the first candle of the day within any time frame. 15m works best. If the first candle is RED ,then go for buy side for the rest of the day. You could square off at close of session or have a fixed take profit and stop loss. This is a contrarian indicator where people just use this as their first entry for the day. The same holds good when a Green candle is seen you go short side.
There is stop loss and take profit that can be used to optimise your trade
The template also includes daily square off based on your time.
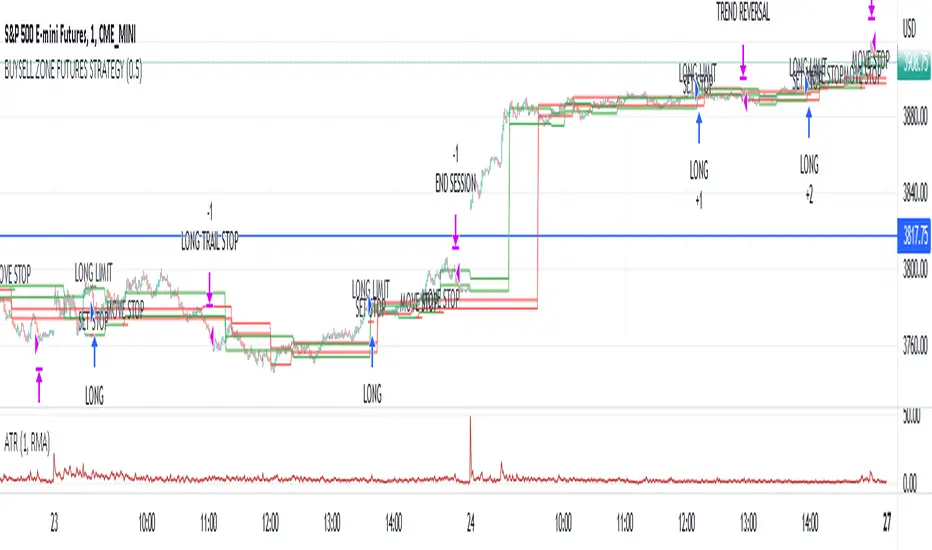
Market structure intraday ES futures strategy - BuySell ZonesThis market structure strategy for ES Mini Futures optimized for intraday market analysis ( RTH ).
Entry condition identified by bearish and bullish market structure.
Support level (Green Lines) is identified based on different variations of price fluctuations followed by the close above the range.
Resistance level (Red Lines) is identified based on different variations of price fluctuations followed by the close below the range.
The idea is to spot areas where market players were fighting for the best price and one side finally won.
Bullish trend is identified by consecutive series of support levels developing in upside direction.
Bearish trend is identified by consecutive series of resistance levels developing in downside direction.
When market develops bullish trend , strategy sets LONG limit order at fresh support level .
When market develops bearish trend , strategy sets SHORT limit order at fresh resistance level .
If there is an open position no new entries are performed.
For longs initial stop is set at previous support level adjusted by ATR.
For shorts stop is set at previous resistance level adjusted by ATR.
Stop trailing is also based on market structure.
If new support level is identified, stop moves to previous support level .
If new resistance level is identified, stop moves to previous resistance level .
There are no target. Strategy either gets stopped at current stop level or exits at session end.
Strategy calculates position size based on the previous market structure and ATR.
Strategy performs compounding position sizing so as account amount increases so does amount of traded contracts.
Usage:
Add script to your favorites and apply it on ES1! 1 minute time frame setting regular trading hours.
Script will print the limit order as well as stop levels according to the rules described above. As trade will progress, script will print levels to move the stop to.
Settings:
I added an option to disable the support and resistance lines printing if you prefer to have clean charts.
You can also change risk % to best fit your trading style.
If you just want to use the support and resistance levels as indicator you can also disable the strategy execution.
Support and Resistance indicator itself is universal and can be used on any market or timeframe.
If you want the strategy to be optimized for other markets or timeframes or have other rule set in mind feel free PM me, we will create the solution that best fits your needs and styles.
Real life trading is not get rich scheme. It is continuous process that involves various steps and dedication. If you are willing to take this path please PM me to enable the strategy for you.
Enjoy!
Pro Divergence [regular + hidden] by TradingClue█ Pro Divergence is my new divergence-based toolkit that will help you to spot lucrative opportunities in all kinds of markets.
I've developed toolkits and strategies that use divergences for many years, e.g. AutoDivergence and CCIDivergence . Pro Divergence is my latest development and benefits from those yearlong experiences.
The main algorithm to detect divergences has changed from using linear regressions and moving averages to algorithmic trendline detection like I've been using in TD Lines .
This new approach supports the detection of regular divergences but also hidden divergences can be identified.
Before going more into the details of the mechanics of Pro Divergence, let's recap, what divergences are all about when it comes to trading.
█ Regular Divergence
The basic idea is pretty simple: If price goes in the opposite direction than some other technical indicator - in most cases an oscillator - we speak of a divergence. A regular divergence might be a signal for a trend reversal. That's it.
For example, if the price is currently rising, while at the same time Momentum is falling - it might be time for a reversal and the price of an asset is about to fall soon. If there are additional indications to confirm the signal, e.g. if RSI is in the overbought area, it might be a good idea to go short on that specific asset.
Regular bullish divergences are indicated when price is forming lower lows while an oscillator shows higher lows.
Regular bearish divergences are indicated when price is forming higher highs while an oscillator shows lower highs.
█ Hidden Divergence
While regular divergences indicate trend reversals, hidden divergences indicate a trend continuation.
When the price is making higher lows and the oscillator is showing lower lows, we speak of a bullish hidden divergence. When the price is making lower highs and the oscillator shows higher highs, it's a bearish hidden divergence.
These rules for identifying divergences are pretty simple and straightforward. And they are also confusing at times. But that's what Pro Divergence is helping you with: trade based on customizable signals to identify all kinds of divergences.
You could either use the strategy settings of the toolkit to optimize the properties to show winning backtesting results. Or you use the signals as an extra confirmation to some other kind of signal/ strategy you are working with.
█ Summary of all current features
• Oscillator: choose between CCI, Momentum, MACD, or RSI. All oscillators-settings are customizable.
• RSI-filter: in some cases, the quality of the signals can be improved by an RSI filter, e.g. a bullish signal would only be valid if RSI is in the oversold area. Set the RSI period and the oversold/ overbought levels to your preferred values.
• You can display all divergences on the chart to get an idea of the current price action. Or you can pick any combination of signals you would like to include in a backtest. Possible signals are: regular bullish divergence, regular bearish divergence, hidden bullish divergence, hidden bearish divergence
• Exits: there are many ways to get exit signals - combinations of the below options are possible:
• fixed profit targets/ stop losses based on ticks
• Exit when momentum reverses
• Exit when price touches the opposite Bollinger Band (e.g. a long position will be closed when price touches the upper Bollinger Band). The settings for the Bollinger Bands are customizable.
• Entry: you can choose only to enter a trade if momentum is going in the same direction as the direction of your trade (e.g. only go long if momentum is rising)
• time and date filer
• Do a backtest only in a given time range (maybe you're not interested in the whole range of historical data when trading in a higher timeframe. Or you would like to do some kind of walk forward analysis)
• Only trade during special times of a day, e.g. only trade during the first hours of a trading session
Since this strategy is making heavy use of math and technical indicators, it is not tied to a certain asset class or timeframe. It was tested successfully on a large number of financial instruments like stocks, crypto, forex, and others.

Template Trailing Strategy (Backtester)💭 Overview
+ Title: Template Trailing Strategy (Backtester)
+ Author: Iason Nikolas (jason5480)
+ License: CC BY-NC-SA 4.0
💢 What is the "Template Trailing Strategy (Backtester)" ❓
The "Template Trailing Strategy (Backtester)" (TTS) is a back-tester orchestration framework. It supercharges the implementation-test-evaluation lifecycle of new trading strategies, by making it possible to plug in your own trading idea.
While TTS offers a vast number of configuration settings, it primarily allows the trader to:
Test and evaluate your own trading logic that is described in terms of entry, exit, and cancellation conditions.
Define the entry and exit order types as well as their target prices when the limit, stop, or stop-limit order types are used.
Utilize a variety of options regarding the placement of the stop-loss and take-profit target(s) prices and support for well-known techniques like moving to breakeven and trailing.
Provide well-known quantity calculation methods to properly handle risk management and easily evaluate trading strategies and compare them.
Alert on each trading event or any related change through a robust and fully customizable messaging system.
All of the above makes TTS a practical toolkit: once you learn it, many repetitive tasks that strategy authors usually re-implement are eliminated. Using TradingView’s built-in backtesting engine makes testing and comparing ideas straightforward.
By utilizing the TTS one can easily swap "trading logic" by testing, evaluating, and comparing each trading idea and/or individual component of a strategy.
Finally, TTS, through its per-event alert management (and debugging) system, provides an automated solution that supports live trading with brokers via webhooks.
NOTE: The "Template Trailing Strategy (Backtester)" does not dictate how you can combine different indicator types. Thus, it should not be confused as a "Trading System", because it gives its user full flexibility on that end (for better or worse).
💢 What is a "Signal Indicator" ❓
"Signal Indicator" (SI) is an indicator that can output a "signal" that follows a specific convention so that the "Template Trailing Strategy (Backtester)" can "understand" and execute the orders accordingly. The SI realizes the core trading logic signaling to the TTS when to enter, exit, or cancel an order. A SI instructs the TTS "when" to enter or exit, and the TTS determines "how" to enter and exit the position once the Signal Indicator generates a signal.
A very simple example of a Signal Indicator might be a 200-day Simple Moving Average Signal. When the price of the security closes above the 200-day SMA, a SI would provide TTS with a "long entry signal". Once TTS receives the "long entry signal", the TTS will open a long position and send an alert or automated trade message via webhook to a broker, based on the Entry settings defined in TTS. If the TTS Entry settings specify a "Market" order type, then the open long position will be executed by TTS immediately. But if the TTS Entry settings specify a "Stop" order type with a 1% Stop Distance, then when the price of the security rises by 1% after the "long entry signal" occurs, the TTS will open a long position and the Long Entry alert or webhook to the broker will be sent.
🤔 How to Guide
💢 How to connect a "signal" from a "Signal Indicator" ❓
The "Template Trailing Strategy (Backtester)" was designed to receive external signals from a "Signal Indicator". In this way, a "new trading idea" can be developed, configured, and evaluated separately from the TTS. Similarly, the SI can be held constant, and the trading mechanics can change in the TTS settings and back-tested to answer questions such as, "Am I better with a different stop loss placement method, what if I used a limit order instead of a stop order to enter, what if I used 25% margin instead of trading spot market?"
To make that possible by connecting an external signal indicator to TTS, you should:
Add both your SI (e.g. "Two MA Signal Indicator" , "Click Signal Indicator" , "Signal Adapter" , "Signal Composer" ) and the TTS script to the same chart.
Open the script's Settings / Inputs dialog for the TTS.
In the 🛠️ STRATEGY group set 𝐃𝐞𝐚𝐥 𝐂𝐨𝐧𝐝𝐢𝐨𝐧𝐬 𝐌𝐨𝐝𝐞 to 🔨External (this makes TTS listen to an external signal source).
Still inside 🛠️ STRATEGY locate the 🔌𝐒𝐢𝐠𝐧𝐚𝐥 🛈 input and choose the plotted output of your SI. The option should look like: "<SI short title>:🔌Signal to TTS" .
Verbose troubleshooting & tips
If the SI does not appear in the 🔌Signal 🛈 selector, confirm both scripts are added to the same chart and the SI exposes a plotted series (title often "🔌Signal to TTS").
When using multiple SIs, pick the SI instance that actually outputs the "🔌Signal to TTS" plotted series.
Validate on the chart: when your SI changes state, the plotted "🔌Signal" series in the TTS (visible in the data window) should change accordingly.
The TTS accepts only signals that follow the tts_convention DealConditions structure. Do not attempt to feed arbitrary scalar series without using conv.getDealConditions / conv.DealConditions.
Make sure your SI composes a DealConditions value following the TTS convention (startLong, endLong, startShort, endShort — optional cancel fields). See the template below.
If the plot is present but TTS does not react, ensure the SI plot is non-repainting (or accept realtime/backtest limitations). Test on historical bars first.
Create alerts on the strategy (see the Alerts section). Use the {{strategy.order.alert_message}} placeholder in the Create Alert dialog to forward TTS messages.
💢 How to create a custom trading logic ❓
The "Template Trailing Strategy (Backtester)" provides two ways to plug in your custom trading logic. Both of them have their advantages and disadvantages.
✍️ Develop your own Customized "Signal Indicator" 💥
The first approach is meant to be used for relatively more complex trading logic. The advantages of this approach are the full control and customization you have over the trading logic and the relatively simple configuration setup by having two scripts only. The downsides are that you have to have some experience with pinescript or you are willing to learn and experiment. You should also know the exact formula for every indicator you will use since you have to write it by yourself. Copy-pasting from existing open-source indicators will get you started quite fast though.
The idea here is either to create a new indicator script from scratch or to copy an existing non-signal indicator and make it a "Signal Indicator". To create a new script, press the "Pine Editor" button below the chart to open the "Pine Editor" and then press the "Open" button to open the drop-down menu with the templates. Select the "New Indicator" option. Add it to your chart to copy an existing indicator and press the source code {} button. Its source code will be shown in the "Pine Editor" with a warning on top stating that this is a read-only script. Press the "create a working copy". Now you can give a descriptive title and a short title to your script, and you can work on (or copy-paste) the (other) indicators of your interest. Once you have the information needed to decide, define a DealConditions object and plot it like this:
import jason5480/tts_convention/ as conv
// Calculate the start, end, cancel start, cancel end conditions
dealConditions = conv.DealConditions.new(
startLongDeal = ,
startShortDeal = ,
endLongDeal = ,
endShortDeal = ,
cnlStartLongDeal = ,
cnlStartShortDeal = ,
cnlEndLongDeal = ,
cnlEndShortDeal = )
// Use this signal in scripts like "Template Trailing Strategy (Backtester)" and "Signal Composer" that can utilize its value
// Emit the current signal value according to the TTS framework convention
plot(series = conv.getSignal(dealConditions), title = '🔌Signal to TTS', color = #808000, editable = false, display = display.data_window + display.status_line, precision = 0)
You should import the latest version of the tts_convention library and write your deal conditions appropriately based on your trading logic and put them in the code section shown above by replacing the "…" part after "=". You can omit the conditions that are not relevant to your logic. For example, if you use only market orders for entering and exiting your positions the cnlStartLongDeal, cnlStartShortDeal, cnlEndLongDeal, and cnlEndShortDeal are irrelevant to your case and can be safely omitted from the DealConditions object. After successfully compiling your new custom SI script add it to the same chart with the TTS by pressing the "Add to chart" button. If all goes well, you will be able to connect your "signal" to the TTS as described in the "How to connect a "signal" from a "Signal Indicator"?" guide.
🧩 Adapt and Combine existing non-signal indicators 💥
The second approach is meant to be used for relatively simple trading logic. The advantages of this approach are the lack of pine script and coding experience needed and the fact that it can be used with closed-source indicators as long as the decision-making part is displayed as a line in the chart. The drawback is that you have to have a subscription that supports the "indicator on indicator" feature so you can connect the output of one indicator as an input to another indicator. Please check if your plan supports that feature here
To plug in your own logic that way you have to add your indicator(s) of preference in the chart and then add the "Signal Adapter" script in the same chart as well. This script is a "Signal Indicator" that can be used as a proxy to define your custom logic in the CONDITIONS group of the "Settings/Inputs" tab after defining your inputs from your preferred indicators in the VARIABLES group. Then a "signal" will be produced, if your logic is simple enough it can be directly connected to the TTS that is also added to the same chart for execution. Check the "How to connect a "signal" from a "Signal Indicator"?" in the "🤔 How to Guide" for more information.
If your logic is slightly more complicated, you can add a second "Signal Adapter" in your chart. Then you should add the "Signal Composer" in the same chart, go to the SIGNALS group of the "Settings/Inputs" tab, and connect the "signals" from the "Signal Adapters". "Signal Composer" is also a SI so its composed "signal" can be connected to the TTS the same way it is described in the "How to connect a "signal" from a "Signal Indicator"?" guide.
At this point, due to the composability of the framework, you can add an arbitrary number (bounded by your subscription of course) of "Signal Adapters" and "Signal Composers" before connecting the final "signal" to the TTS.
💢 How to set up ⏰Alerts ❓
The "Template Trailing Strategy (Backtester)" provides a fully customizable per-event alert mechanism. This means that you may have an entirely different message for entering and exiting into a position, hitting a stop-loss or a take-profit target, changing trailing targets, etc. There are no restrictions, and this gives you great flexibility.
First enable the events you want under the "🔔 ALERT MESSAGES" module. Each enabled event exposes a text area where you can craft the message using placeholders that TTS replaces with actual values when the event occurs.
The placeholder categories (exact names used by the script) are:
Chart & instrument:
{{ticker}}
{{base_currency}}
{{quote_currency}}
Entry / exit / stop / TP prices & offsets:
{{entry_price}}
{{exit_price}}
{{stop_loss_price}}
{{take_profit_price_1}} ... {{take_profit_price_5}}
{{entry+_price}}, {{entry-_price}}, {{exit+_price}}, {{exit-_price}} — Optional offset helpers (computed using "Offset Ticks")
Quantities, percents & derived quantities:
{{entry_base_quantity}} — base units at entry (e.g. BTC)
{{entry_quote_quantity}} — quote amount at entry (e.g. USD)
{{risk_perc}} — % of capital risked for that entry (multiplied by 100 when "Percentage Range " is enabled)
{{remaining_quantity_perc}} — % of the initial position remaining at close/SL
{{remaining_base_quantity}} — remaining base units at close/SL
{{take_profit_quantity_perc_1}} ... {{take_profit_quantity_perc_5}} — % sold/bought at each TP
{{take_profit_base_quantity_1}} ... {{take_profit_base_quantity_5}} — base units closed at each TP
❗ Important: the per-event alert text is injected into the Create Alert dialog using TradingView's strategy placeholder:
{{strategy.order.alert_message}}
During the creation of a strategy alert, make sure the placeholder {{strategy.order.alert_message}} exists in the "Message" box. TradingView will substitute the per-event text you configured and enabled in TTS Settings/Inputs before sending it via webhook/notification.
Tip: For webhook/broker execution, set the proper "Condition" in the Create Alert dialog (for changing-entry/exit/SL notifications use "Order fills and alert() function calls" or "alert() function calls only" as appropriate).
💢 How to execute my orders in a broker ❓
To execute your orders in a broker that supports webhook integration, you should enable the appropriate alerts in the "Template Trailing Strategy (Backtester)" first (see the "How to set up Alerts?" guide above). Then you should go to the "Create Alert/Notifications" tab check the "Webhook URL" and paste the URL provided by your broker. You have to read the documentation of your broker for more information on what messages are expected.
Keep in mind that some brokers have deep integration with TradingView so a per-event alert approach might be overkill.
📑 Definitions
This section tries to give some definitions in terms that appear in the "Settings/Inputs" tab of the "Template Trailing Strategy (Backtester)"
💢 What is Trailing ❓
Trailing is a technique where a price target follows another "barrier" price (usually high or low) by trying to keep a maximum distance from the "barrier" when it moves in only one direction (up or down). When the "barrier" moves in the other direction the price target will not change. There are as many types of trailing as price targets, which means that there are entry trailing, exit trailing, stop-loss trailing, and take-profit trailing techniques.
💢 What is a Moonbag ❓
A Moonbag in a trade is the quantity of the position that is reserved and will not be exited even if all take-profit targets defined in the strategy are hit, the quantity will be exited only if the stop-loss is hit or a close signal is received. This makes the stop-loss trailing technique in a trend-following strategy a good candidate to take advantage of a Moonbag.
💢 What is Distance ❓
Distance is the difference between two prices.
💢 What is Bias ❓
Bias is a psychological phenomenon where you make decisions based on market sentiment. For example, when you want to enter a long position you have a long bias, and when you want to exit from the long position you have a short bias. It is the other way around for the short position.
💢 What is the Bias Distance of a price target ❓
The Bias Distance of a price target is the distance that the target will deviate from its initial price. The direction of this deviation depends on the bias of the market. For example, suppose you are in a long position, and you set a take-profit target to the local highest high. In that case, adding a bias distance of five ticks will place your take-profit target 5 ticks below this local highest high because you have a short bias when exiting a long position. When the bias is long the bias distance will be added resulting in a higher target price and when you have a short bias the bias distance will be subtracted.
⚙️ Settings
In the "Settings/Inputs" tab of the "Template Trailing Strategy (Backtester)", you can find all the customizable settings that are provided by the framework. The variety of those settings is vast; hence we will only scratch the surface here. However, for every setting, there is an information icon 🛈 where you can learn more if you mouse over it. The "Settings/Inputs" tab is divided into ten main groups. Each one of them is responsible for one module of the framework. Every setting is part of a group that is named after the module it represents. So, to spot the module of a setting find the title that appears above it comes with an emoji and uppercase letters. Some settings might have the same name but belong to different modules e.g. "Tgt Dist Mtd" (Target Distance Method). Some settings are indented, which means that they are closely related to the non-indented setting above. Usually, indented settings provide further configuration for one or more options of the non-indented setting above. The groups that correspond to each module of the framework are the following:
🗺️ Quick Module Cross-Reference (use emojis to jump to setting groups)
📆 FILTERS — session, date & weekday filters
🛠️ STRATEGY — internal vs external deal-conditions; pick the signal source
🔧 STRATEGY – INTERNAL — built-in Two MA logic for demonstration purposes
🎢 VOLATILITY — ATR / StDev update modes
🔷 ENTRY — entry order types & trailing
🎯 TAKE PROFIT — multi-step TP and trailing rules
🛑 STOP LOSS — stop placement, move-to-breakeven, trailing
🟪 EXIT — exit order types & cancel logic
💰 QUANTITY/RISK MANAGEMENT — position sizing, moonbag, limits
📊 ANALYTICS — stats, streaks, seasonal tables
🔔 ALERT MESSAGES — per-event alert templates & placeholders
😲 Caveats
💢 Does "Template Trailing Strategy (Backtester)" have repainting behavior? ❓
The answer is that the "Template Trailing Strategy (Backtester)" does not repaint as long as the "Signal Indicator" that is connected also does not repaint. If you developed your own SI make sure that you understand and know how to prevent this behavior. The publication by @PineCoders here will give you a good idea on how to avoid most of the repainting cases.
⚠️ There is an exception though, when the "Enable Trail⚠️💹" checkbox is checked, the Take Profit trailing feature is enabled, and a tick-based approach is used, meaning that after a while, when the TradingView discards all the real-time data, assumptions will be made by the backtesting engine that will cause a form of repainting. To avoid making false assumptions please disable this feature in the early stages and evaluate its usefulness in your strategy later on, after first confirming the success of the logic without this feature. In this case, consider turning on the bar magnifier feature. This way you will get more accurate backtest results when the Take Profit trailing feature is enabled.
💢 Can "Template Trailing Strategy (Backtester)" satisfy all my trading strategies ❓
While this framework can satisfy quite a large number of trading strategies there are cases where it cannot do so. For example, if you have a custom logic for your stop-loss or take-profit placement, or if you want to dollar cost average, then it might be better to start a new strategy script from scratch.
⚠️ It is not recommended to copy the official TTS code and start developing unless you are a Pine wizard! Even in that case, there is a stiff learning curve that might not be worth your time. Last, you must consider that I do not offer support for customized versions of the TTS script and if something goes wrong in the process you are all alone.
💝 Support & Feedback
For feedback, bug reports, or feature requests, contact me via TradingView PM or use the script comments.
Note: The author's personal links and contact are available on the TradingView profile.
🤗 Thanks
Special thanks to the welcoming community members, who regularly gave feedback all those years and helped me to shape the framework as it is today! Thanks everyone who contributed by either filing a "defect report" or asking questions that helped me to understand what improvements were necessary to help traders.
Enjoy!
Jason
