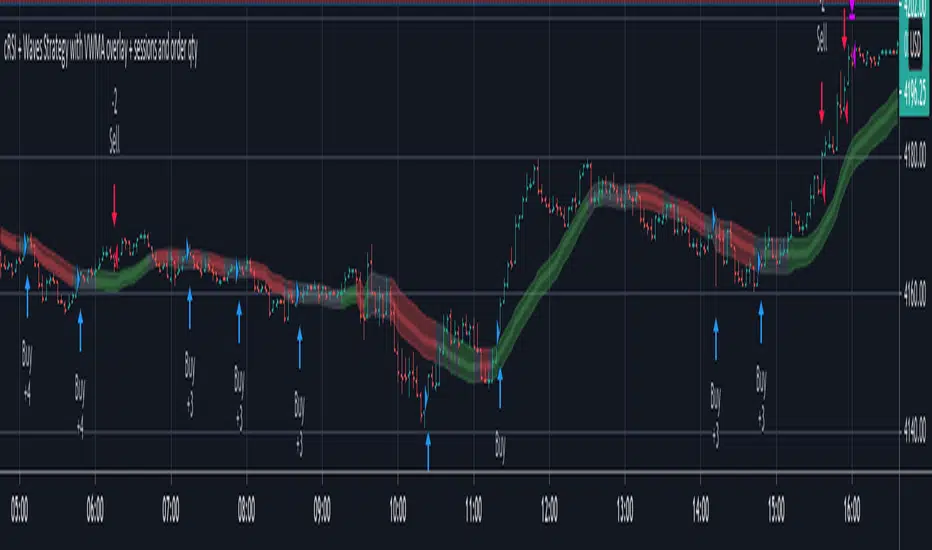
cRSI + Waves Strategy with VWMA overlay + sessions and order qtyThis is a fork of the cRSI + Waves Strategy with VWMA overlay strategy by Dr_Roboto , which adds two additional features, namely:
the ability to limit trade signals to certain defined periods of time ("Sessions") during the trading day and, optionally, to close any open position at the end of either or both "Sessions"
the ability to control the maximum order size suggested by the strategy on the "Inputs" tab of the strategy's "Settings" window
If you are trading on a daily chart (or longer) you must disable the Limit Signals to Trading Sessions? option in order for the strategy to produce signals.
All other features are identical to the original strategy (revision 2.0).
Pesquisar nos scripts por "session"
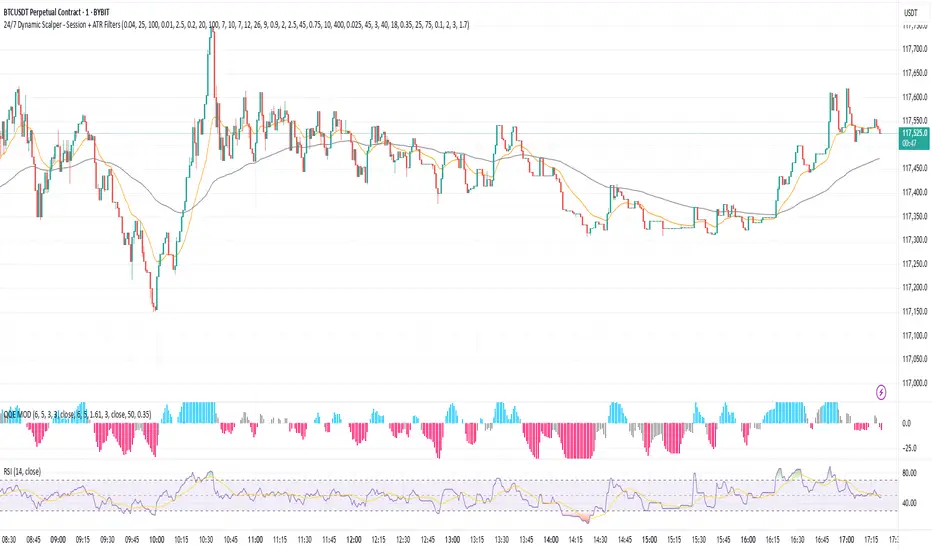
24/7 Dynamic Scalper - Session + ATR Filters24/7 Dynamic Scalper — Session + ATR Filters
The only scalping strategy you’ll need for non-stop, high-precision trading — engineered for automation and hands-off profits!
Session Filtering: Trade only during the hottest market hours (Asia Open & EU Session) — fully automatic.
ATR Stability & Dynamic Risk: Filters out chop and volatility spikes for cleaner, higher-probability entries.
Momentum & Exhaustion Protection: Built-in RSI & MACD logic blocks overbought/oversold traps and weak signals.
Time-in-Trade Auto-Exit: No more stale trades — get capped exposure for every position.
Auto Alerts: Sends structured, ready-to-automate alerts (BUY/SELL/EXIT) — perfect for webhook and bot traders.
Optional Volume/TP Filters: Toggle volume spikes, dynamic ATR-based TP, and even “big candle” protection.
Fully Customizable: Fine-tune everything from leverage to max stop loss (in USDT), bar/range filters, and much more.
Best for: Fast scalpers, algo traders, automation junkies, and anyone who wants a robust, hands-off approach to perpetual futures.
👇 How it Works (Feature Breakdown):
Session Filters: Restricts signals to the highest liquidity hours (Asia/EU), or trade 24/7 — your choice!
ATR + Range Filters: Ensures every entry has real volatility and avoids dangerous chop.
Momentum Logic: Combines EMA, MACD slope, and RSI direction to hunt for real breakouts only.
Exhaustion Safeguards: Avoids classic scalp reversals by blocking overbought/oversold and exhausted MACD/RSI momentum.
Drawdown Defense: Detects “big candle” traps, ATR surges, and lets you cap stop-loss by percent or by max USDT.
Hands-Off Management: All exits (TP/SL/trailing) are managed by your backend/bot via structured alerts — the script keeps charts clean and exits only by time cap (so no backend/strategy overlap).
Ready for Webhook Automation: Clean JSON alerts for BUY, SELL, and CLOSE — drop them straight into your bot for instant auto-trading.
No repaint, no nonsense — just cold, fast, high-frequency scalping with robust, smart filters.
🚀 Plug, Play, Automate.
Copy to your chart, tweak your session/ATR/settings, and wire up your alert to your favorite webhook bot.
Perfect for Bybit, MEXC, Binance, and anywhere you can automate.
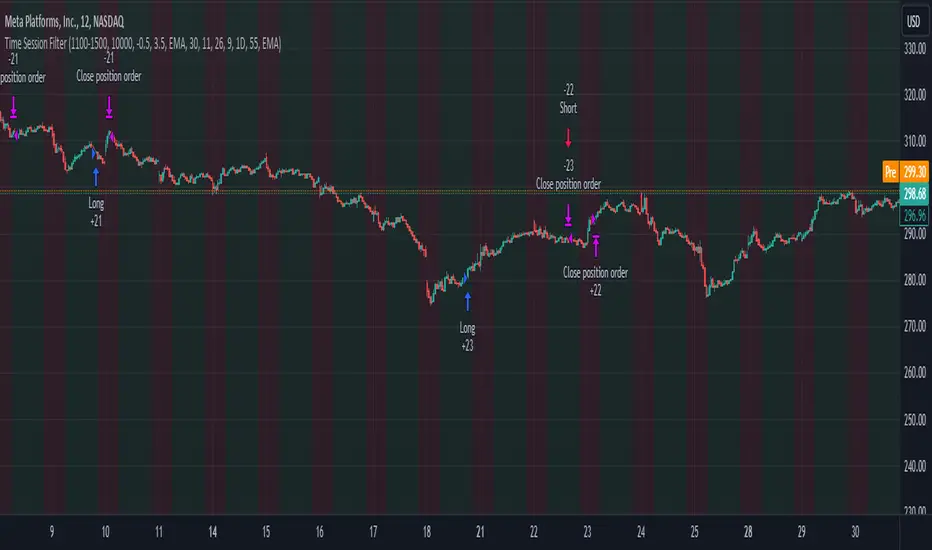
Time Session Filter - MACD exampleTime Session Filter in TradingView Strategy: A Comprehensive Guide
Welcome to this educational TradingView blog where we dive deep into the functionality and utility of the time session filter in trading strategies. It's interesting to note that the time session filter is a commonly overlooked feature in Pine Script, often not integrated into overall trading strategies. Yet, when used wisely, this tool can significantly enhance your trading approach. In essence, the session filter ensures that trades are only made within a specific, user-defined time frame. By incorporating this often-neglected building block, you can make your strategy more adaptable to various market conditions and trading preferences.
What is a Time Session Filter?
A time session filter is designed to:
Select Times of the Day to Trade: The filter allows you to choose specific hours during the day in which trades are allowed to be excecuted.
Toggle Days to Trade: You can decide which days of the week you want to trade, giving you the flexibility to avoid days that are historically not profitable for your strategy.
Close Trade When Session Ends: The filter can automatically close any open trade once the specified time session concludes, reducing the risk associated with holding positions outside your chosen time frame.
The user interface is streamlined, taking minimal space for the input sections, making it convenient to integrate with other indicators in your overall strategy script. In addition the script colors the background of the chart green when the timesession filter is on and makes the background red when the filter doesn't allow any trades. This helps you to visualise the selected timeframes in relation to chart patterns.
Best Practices for Time Selection
From my personal trading experience I share some input settings you can try to play around with:
Stocks: Trading stocks sometimes yield better results if you only trade in the mornings until lunchtime. This is the period when markets are generally more active, and traders are keenly participating.
Cryptocurrencies: For cryptocurrencies, it sometimes makes sense to avoid trading on Fridays, a day when futures contracts often expire. Various other market-moving events also typically occur on Fridays.
Random Selection: Interestingly, sometimes choosing a random selection of times and days can improve the script's performance, adding an element of unpredictability that might outperform more systematic approaches.
Strategy Overview
This strategy script incorporates various elements, including risk position size and MACD indicator, to provide a comprehensive trading strategy. For a detailed explanation of risk position sizing, please refer to this article:
For a complete understanding of the MACD indicator utilized, visit the following explanation:
Additionally, for high time frame trend filters, consult this resource for more info:
Educational Purposes and Risks
Please note that this script is for educational purposes and serves merely as an example of how to incorporate a time session filter into a trading strategy for pinescript. It is a simplified strategy without a fixed stop-loss, which can result in higher exposure to significant losses. The time session filter can be a powerful addition to your trading strategy, providing you with the tools to tailor your approach according to time-specific market conditions. By understanding its functionalities and best practices, you can make more informed trading decisions, but always remember that trading carries inherent risks.
Happy trading!
Customer Short strategy A5.1 + Session + CBL SLFor my customer.
HalfTrend Directional Framework (A5.1)
Used for primary trend recognition and breakout validation.
Session-Based Volatility Windows
Trades only occur within specific high-liquidity windows (e.g., 08:30–12:30 and 12:30–16:30), improving fill quality and reducing noise.
Three-Bar Opening Range Model
The first three 5-minute bars define:
session high
session low
These become structural breakout levels:
price > range high → long-bias
price < range low → short-bias
CBL (Guppy Count-Back Line) Stop-Loss
Instead of using ATR or static percentage stops, Libra_S relies on CBL to:
avoid premature exits during healthy pullbacks
capture trend persistence
provide structure-based invalidation

London Breakout/Session GBP/USD Forex DaytradeThis is a forex strategy suited for day traders, specialized in the london breakout session
The key elements for this strategy are the specific london time session, together with an exit time(before asian trade/at the end of new york session).
At the same time, as logic elements we only use price action inside like :
For long we have 3 ascending candles, and for short we have 3 descending candles.
For exit we have both TP/SL based on price percentage movement, or we exit if we reach the end of the day.
If you have any questions message me in private !

TJR asia session sweepThe TJR Asia Session Sweep is a liquidity-based trading strategy that focuses on the Asian session high and low range. During the London open, price often sweeps (breaks) one side of that range to grab liquidity — triggering stop hunts. After the sweep, traders look for a break of structure (BOS) and enter in the opposite direction of the sweep.
Hourly Bias on BTC in Bullish USA Session “Green Eagle”Name: Hourly Bias on BTC in Bullish USA Session
Category: Hourly Bias
Operating mode: Spot, only long
Trades duration: Intraday, 11 bars
Timeframe: 1H
Suggested usage: When the market is compressed, USA session has a bullish bias.
Entry: enter Long at 15:00 on specific days of the week. There is a volatility filter based on ATR which identifies compression.
Exit: exit at a pre-defined time at 01:00
Usage:
⁃ It can be useful to use alerts or webhooks to automate this strategy.
⁃ This is a core system that can be improved in different ways (e.g. Stop-loss, take-profit, position sizing) or studying more the behaviour in the specific days of the week or short when is red.
Configuration:
- N/A
Backtesting
⁃ Exchange: BINANCE
⁃ Pair: BTCUSDT
⁃ Timeframe: 1H
⁃ Fee 0.075%
⁃ Slippage 2
- Start : 2019-01-06
We decided to release this free BTC strategy.
How you or we can improve? Source code is open so share your ideas!

Multi-EMA Session Breakout Strategythis is a strategy that use the session high and low and the EMA LOWS 2 3 6 9 110 355 AND 480
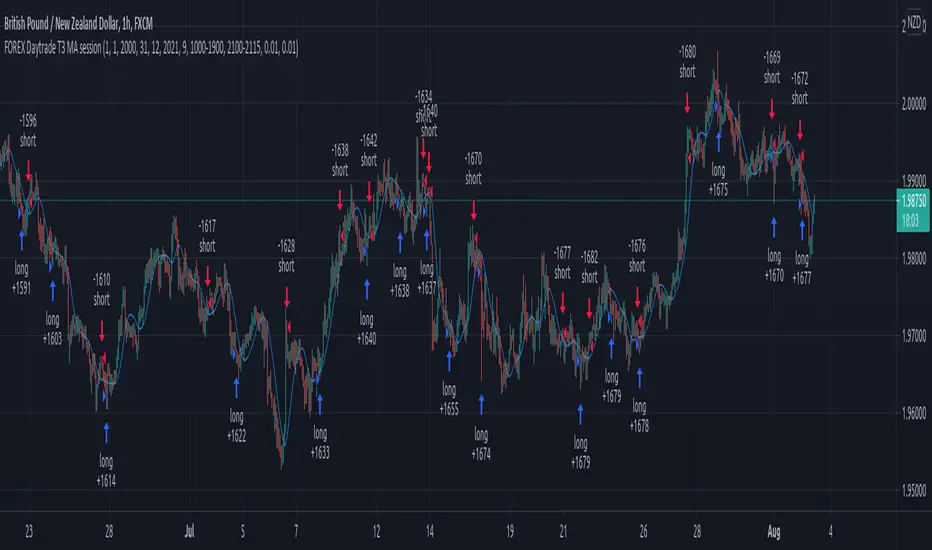
Forex Daytrade T3 MA sessionThis is a simple yet very efficient daytrading strategy for most crosses pairs, like EUR/NZD, EUR/AUD , GBP/NZD, GBP/AUD and so on.
It tends to works best with 1h and 15 min time frame charts.
Its components are :
Entry time = session that we want to trade, where we can combine for example half of London and all of NY using an hour system.
T3 Moving average
Price action.
Rules for entry
For long , we are during the hours we want to trade, current close is price is above previous high and at the same time is above moving average
For short , we are during the hours we want to trade, current close is price is below previous low and at the same time is below moving average
Rules for exit
We exit when either the opposite condition is triggered, if the hours of trading are off or based on a percentage TP/SL system movement.
For this example we use 1% movement both for TP and SL
If you have any questions, let me know !
EURUSD 5min london session strategyHey, today I bring you another strategy that I pull up together.
Its a KISS system ( keep it stupid simple )
We have 2 ma of 5 lenght each, one applied to the high and the other to low. With this we create a channel.
If the candle close above or below the channel we got a signal. Then we can optionally verify with the RSI to increase our chances.
At the same time, this system, only trades during the london session ( can be changed), and it has 2 rules, preferably no more than 5 trades / day, and no more than 2% risk of equity lost .
We also have a TP/SL system made of pips.
Enjoy it.

GC/MGC VWAP Pullback + ADX Regime (Prop-Safe)GC / MGC VWAP Pullback + ADX Regime Strategy (Prop-Safe)
This strategy is designed specifically for Gold futures (GC & MGC) and prop firm trading, where capital preservation, consistency, and avoiding chop matter more than trade frequency.
The core philosophy is simple:
Only trade gold when it is expanding, aligned, and at the right location.
Strategy Concept
Gold moves in bursts, not constantly.
Most losses come from trading compression, VWAP chop, or late momentum.
This strategy filters those environments out and trades only:
Strong intraday momentum
Clear higher-timeframe direction
First pullbacks to VWAP
Clean price rejection with follow-through
It intentionally produces fewer but higher-quality trades.
Market Regime Filter (ADX)
ADX is evaluated on the 5-minute chart
This is the trade permission filter
ADX zones:
Below 18 → No trade (compression / chop)
20–35 → Optimal trading zone
35–45 → Caution (strong trend, reduced opportunity)
Above 45 → No new entries (late expansion / news risk)
ADX does not determine direction.
It only determines whether trading is allowed.
Direction Filter (Higher Timeframe)
Direction comes from the 1-Hour chart
EMA 20 above EMA 50 → Long bias only
EMA 20 below EMA 50 → Short bias only
Optional slope confirmation for additional strictness
No counter-trend trades.
Entry Logic (5-Minute Chart)
Trades are taken using a VWAP pullback continuation model.
Long Setup
ADX between 20–35
1H EMA 20 > EMA 50
Price pulls back to VWAP
Bullish rejection candle at VWAP
Entry on break of the rejection candle high
Short Setup
ADX between 20–35
1H EMA 20 < EMA 50
Price pulls back to VWAP from below
Bearish rejection candle at VWAP
Entry on break of the rejection candle low
All entries use stop orders, not market orders, to ensure follow-through.
Risk Management
Stop loss is placed beyond the rejection candle
Partial profit at 1R
Final target at 2R
No pyramiding
One clean setup is preferred over multiple trades
This structure aligns well with prop firm rules, trailing drawdowns, and consistency requirements.
What This Strategy Avoids
VWAP chop
Range-bound sessions
Overtrading
Late entries after news spikes
Counter-trend setups
If conditions are not ideal, no trade is the correct trade.
Best Use Case
Instruments: GC, MGC
Timeframe: 5-minute
Style: Intraday, prop-firm friendly
Ideal for traders who value:
Discipline
Structure
Capital protection

Probabilistic Analysis Table - The Quant ScienceProbabilistic Analysis Table - The Quant Science ™ is the quantitative table measuring the probability of price changes and quantifies the ratio of sessions for three different assets.
This table measures the ratios of bull and bear events and measures the probability of each event through data generated automatically by the algorithm.
The data are calculated for three different assets:
1. Main asset: set on the chart.
2. Second asset: set by user interface.
3. Third asset: set by the user interface.
The timeframe is set by the chart and is the same for all three assets. You can change the timeframes directly from the chart.
The user can add tickers and adjust the analysis period directly from the user interface. The user can edit the percentage changes and the values to be analyzed for each asset, directly from the user interface.
TABLE DESCRIPTION
1. Total global trade session: are the total number of bars for each asset.
2. Total positive trade session: are the number of positive bars for each asset.
3. Probability positive trade session: is the ratio of total sessions to positive sessions.
4. Total negative trade session: are the number of negative bars for each asset.
5. Probability negative trade session: is the ratio of total sessions to negative sessions.
6. Positive trade session 0.50%: are the number of positive bars greater than 0.50% for each asset.
7. Probability positive trade session 0.50%: is the ratio of total sessions to positive sessions with increases greater than 0.50% (this value is set by default, you can change it from the user interface).
8. Negative trade session -0.50%: are the number of negative bars smaller than -0.50% for each asset.
9. Probability negative trade session -0.50%: is the ratio of total sessions to negative sessions with declines less than -0.50% (this value is set by default, you can change it from the user interface).
10. Positive trade session 1%: are the number of positive bars greater than 1% for each asset.
11. Probability positive trade session 1%: is the ratio of total sessions to positive sessions with increases greater than 1% (this value is set by default, you can change it from the user interface).
12. Negative trade session -1%: are the number of negative bars less than -1% for each asset.
13. Probability negative trade session -1%: is the ratio of total sessions to negative sessions with declines less than -1% (this value is set by default, you can change it from the user interface).
This table was created for traders and quantitative investors who need to quickly analyze session ratios and probabilities.

ORB Breakout Strategy w/ Filters - Dynamic Sizing - MTFHere is a comprehensive description of the strategy, written in a clear and structured format. You can use this for your script's "how-to-use" guide or documentation.
---
## 📈 Opening Range Breakout (ORB) Strategy
This is a comprehensive, multi-timeframe strategy built for trading opening range breakouts. It is designed with a "filters-first" approach, allowing you to validate a breakout with trend, volume, and volatility.
The strategy's core power comes from its flexibility. You can trade on a low timeframe (like a 1-minute chart) while basing your breakout levels on a higher timeframe's opening bar (e.g., the first 15-minute bar). It includes dynamic position sizing based on risk and a wide array of advanced exit management options.
### Key Features
* **Multi-Timeframe Opening Range:** The core of the strategy. You can define the "Opening Range" timeframe (5, 10, 15, 30, or 60 min) *independently* of your chart timeframe.
* **Custom Trading Session:** Define the exact session (e.g., "0930-1600" in "America/New_York") you want to trade.
* **One Trade Per Session:** The strategy will only take the *first valid breakout* signal per day to avoid over-trading.
---
### 🚦 Entry Signals & Filters
A trade is only initiated when the price closes above the Session High or below the Session Low **AND** all active filters are passed.
* **Trend Filter:** (Optional) Requires price to be above a long-term MA (e.g., 100 EMA) for long trades and below it for short trades.
* **Volume Filter:** (Optional) Requires the breakout bar's volume to be a specified multiplier (e.g., 1.5x) of the recent average volume.
* **Volatility Filter:** (Optional) Requires the current ATR to be higher than its long-term average, ensuring you only trade during periods of expanding volatility.
* **Direction Filter:** Allows you to isolate the strategy to **Long Only**, **Short Only**, or **Both**.
---
### 💰 Dynamic Position Sizing
The strategy includes a robust "Risk %" sizing model.
* **Risk-Based Sizing:** Instead of fixed contracts, it calculates the position size based on your **Account Size**, **Risk % per Trade**, and the **Stop Loss distance**.
* **Auto-Detect Point Value:** It automatically detects the correct point value for popular futures contracts (ES, NQ, MES, MNQ) and provides a manual override for other assets.
---
### 📤 Exit & Risk Management
This strategy features a multi-layered exit system, giving you complete control over how trades are managed.
#### 1. Stop Loss (SL)
Your initial stop loss can be calculated using a fixed **Tick** offset or an **ATR** multiplier. It can be anchored from two different points:
* **Breakout Level:** The stop is placed relative to the `sessionHigh` or `sessionLow` level.
* **Entry Bar:** The stop is placed relative to the high/low of the bar that *triggered* the entry.
#### 2. Take Profit (TP)
A standard Take Profit can be set using a fixed **Tick** offset or an **ATR** multiplier.
#### 3. Advanced Exit Logic
These options override the standard Take Profit to allow for more dynamic trade management:
* **Trailing Take Profit (TTP):**
* **Fixed/ATR Trail:** A standard trailing stop that activates after price moves a certain amount in your favor.
* **MA Price Cross:** Exits the trade as soon as the price closes across a fast-moving average (e.g., 9-EMA).
* **MA Crossover:** Exits the trade as soon as a fast MA crosses below a slow MA (for longs) or above (for shorts).
* **Close on Reversal:** (Optional) Exits immediately if the **very next bar** after entry closes back *inside* the opening range (a "failed breakout" signal).
* **Close on Opposite Range Cross:** (Optional) Exits a long trade if the price ever closes below the `sessionLow` (and vice-versa for shorts).
* **End of Session Exit:** All open positions are automatically closed at the end of the defined trading session.

Trend MasterOverview
The Strategy is a trend-following trading system designed for forex, stocks, or other markets on TradingView. It uses pivot points to identify support and resistance levels, combined with a 200-period Exponential Moving Average (EMA) to filter trades. The strategy enters long or short positions based on trend reversals during specific trading sessions (London or New York). It incorporates robust risk management, including position sizing based on risk percentage or fixed amount, trailing stop-losses, breakeven moves, and weekly/monthly profit/loss limits to prevent overtrading.
This script is ideal for traders who want a semi-automated approach with visual aids like colored session backgrounds, support/resistance lines, and a performance dashboard. It supports backtesting from a custom start date and can limit trades to one per session for discipline. Alerts are built-in for entries, exits, and stop-loss adjustments, making it compatible with automated trading bots.
Key Benefits:
Trend Reversal Detection: Spots higher highs/lows and lower highs/lows to confirm trend changes.
Session Filtering: Trades only during high-liquidity sessions to avoid choppy markets.
Risk Control: Automatically calculates position sizes to risk only a set percentage or dollar amount per trade.
Performance Tracking: Displays a table of weekly or monthly P&L (profit and loss) with color-coded heatmaps for easy review.
Customizable: Adjust trade direction, risk levels, take-profit ratios, and more via inputs.
The strategy uses a 1:1.2 risk-reward ratio by default but can be tweaked.
How It Works
Trend Identification:
The script calculates pivot highs and lows using left (4) and right (2) bars to detect swing points.
It identifies patterns like Higher Highs (HH), Higher Lows (HL), Lower Highs (LH), and Lower Lows (LL) to determine the trend direction (uptrend if above resistance, downtrend if below support).
Support (green dotted lines) and resistance (red dotted lines) are drawn dynamically and update on trend changes.
Bars are colored blue (uptrend) or black (downtrend) for visual clarity.
Entry Signals:
Long Entry: Price closes above the 200 EMA, trend shifts from down to up (e.g., breaking resistance), during an active session (London or NY), and no trade has been taken that session (if enabled).
Short Entry: Price closes below the 200 EMA, trend shifts from up to down (e.g., breaking support), during an active session, and no prior trade that session.
Trades can be restricted to "Long Only," "Short Only," or "Both."
Entries are filtered by a start date (e.g., from January 2022) and optional month-specific testing.
Position Sizing and Risk:
Risk per trade: Either a fixed dollar amount (e.g., $500) or percentage of equity (e.g., 1%).
Quantity is calculated as: Risk Amount / (Entry Price - Stop-Loss Price).
This ensures you never risk more than intended, regardless of market volatility.
Stop-Loss (SL) and Take-Profit (TP):
SL for Longs: Set below the recent support level, adjustable by a "reduce value" (e.g., tighten by 0-90%) and gap (e.g., add a buffer).
SL for Shorts: Set above the recent resistance level, with similar adjustments.
TP: Based on risk-reward ratio (default 1.2:1), so if SL is 100 pips away, TP is 120 pips in profit.
Visual boxes show SL (red) and TP (green) on the chart for the next 4 bars after entry.
Trade Management:
Trailing SL: Automatically moves SL to the new support (longs) or resistance (shorts) if it tightens the stop without increasing risk.
Breakeven Move: If enabled, SL moves to entry price once profit reaches a set ratio of initial risk (default 1:1). For example, if risk was 1%, SL moves to breakeven at 1% profit.
One Trade Per Session: Prevents multiple entries in the same London or NY session to avoid overtrading.
Sessions include optional weekend inclusion and are highlighted (blue for London, green for NY).
Risk Limits (Weekly/Monthly):
Monitors P&L for the current week or month.
Stops trading if losses hit a limit (e.g., -3%) or profits reach a target (e.g., +7%).
Resets at the start of each new week/month.
Alerts notify when limits are hit.
Exits:
Trades exit at TP, SL, or manually via alerts.
No time-based exits; relies on price action.
Performance Dashboard:
A customizable table (position, size, colors) shows P&L percentages for each week/month in a grid.
Rows = Years, Columns = Weeks (1-52) or Months (1-12).
Color scaling: Green for profits (darker for bigger wins), red for losses (darker for bigger losses).
Yearly totals in the last column.
Helps visualize strategy performance over time without manual calculations.
Input Parameters Explained
Here's a breakdown of the main inputs for easy customization:
Trade Direction: "Both" (default), "Long Only," or "Short Only" – Controls allowed trade types.
Test Only Selected Month: If true, backtests only the specified month from the start year.
Start Year/Month: Sets the backtest start date (default: Jan 2022).
Include Weekends: If true, sessions can include weekends (rarely useful for forex).
Only One Trade Per Session: Limits to one entry per London/NY session (default: true).
Risk Management Time Frame: "Weekly" or "Monthly" – For P&L limits.
Enable Limits: Toggle weekly/monthly stop trading on loss/profit thresholds.
Loss Limit (%)/Profit Target (%): Stops trading if P&L hits these (e.g., -3% loss or +7% profit).
London/New York Session: Enable/disable, with time ranges (e.g., London: 0800-1300 UTC).
Left/Right Bars: For pivot detection (default: 4 left, 2 right) – Higher values smooth signals.
Support/Resistance: Toggle lines, colors, style, width.
Change Bar Color: Colors bars based on trend.
TP RR: Take-profit risk-reward (default: 1.2).
Stoploss Reduce Value: Tightens SL (negative values widen it, 0-0.9 range).
Stoploss Gap: Adds a buffer to SL (e.g., 0.1% away from support).
Move to Breakeven: Enables SL move to entry at a profit ratio (default: true, 1:1).
Use Risk Amount $: If true, risks fixed $ (e.g., 500); else, % of equity (default: 1%).
EMA 3: The slow EMA period (default: 200) for trend filter.
Performance Display: Toggle table, location (e.g., Bottom Right), size, colors, scaling for heatmaps.
Setup and Usage Tips
Add to Chart: Copy the script into TradingView's Pine Editor, compile, and add to your chart.
Backtesting: Use the Strategy Tester tab. Adjust inputs and test on historical data.
Live Trading: Connect alerts to a broker or bot (e.g., via webhook). The script sends JSON-formatted alerts for entry, exit, SL moves, and limits.
Best Markets: Works well on crypto pairs like SOLUSD or RUNEUSD on 4H timeframes.
Risk Warning: This is not financial advice. Always use demo accounts first. Past performance doesn't guarantee future results. Commission is set to 0.05% by default – adjust for your broker.
Customization: Experiment with EMA length or RR ratio for your style.

ORB Fusion Adaptive🎯 ORB Fusion Adaptive Strategy
Professional Opening Range Breakout Trading System
═══════════════════════════════════════════════════════════════════════════════
The first fully-automated, multi-instrument ORB strategy on TradingView.
💡 WHAT IT DOES:
Automatically trades Opening Range breakouts and failed breakout reversals with intelligent position sizing, professional risk management, and complete trade lifecycle tracking. Built for serious backtesting and live trading.
⚡ KEY FEATURES:
✓ Automated Entry & Exit (breakouts + reversals)
✓ Adaptive Position Sizing (3 modes: Fixed, Risk-Based, Risk-Based Initial)
✓ Multi-Instrument Support (Futures, Forex, Crypto, Stocks)
✓ Advanced Risk Management (daily limits, drawdown protection)
✓ ML-Powered Breakout Filtering (pContinue/pFail scoring)
✓ Failed Breakout Detection (high-probability reversals)
✓ Native Trailing Stops (Pine Script v5)
✓ Multi-Target Management (T1, T2, T3)
✓ Real-Time Performance Dashboard
✓ Comprehensive Backtesting (5+ years tested)
🎯 STRATEGY LOGIC:
Entry Signals
The strategy enters trades on two high-probability setups:
1. ORB Breakouts
• Detects when price breaks above/below Opening Range
• Confirms with volume (configurable threshold)
• ML filter scores probability of continuation
• Enters within 3 bars of breakout (no late entries)
• Stop placed at ORB midpoint or ATR-based
• Targets at Fibonacci extensions (1.0x, 1.618x, 2.5x ORB range)
2. Failed Breakout Reversals
• Monitors for breakouts that fail and reverse
• Confirms failure after price returns inside ORB
• Automatic reversal entry with tight stops
• Three profit targets (0.5x, 1.0x, 1.5x ORB range)
• Historical 65-75% win rate on reversals
Exit Management
• Stop Loss: Multiple methods (ATR, ORB Mid, ORB Opposite, Hybrid)
• Native Trailing Stop: Activates after configurable R-multiple profit
• Profit Targets: Single target or scaled exits at T1/T2/T3
• Daily Stop: Halts trading after max daily loss
• Drawdown Protection: Circuit breaker at max drawdown threshold
🔧 ADAPTIVE POSITION SIZING:
The strategy's most powerful feature - intelligent position sizing that adapts to your instrument and account:
Mode 1: Fixed
• Simple contract/lot size
• Best for: Testing, stable position sizing
• Use case: "Always trade 2 contracts"
Mode 2: Risk-Based (Current Equity)
• Size = (Current Equity × Risk%) / (Stop Distance × Point Value)
• Compounds with wins, reduces with losses
• Best for: Aggressive compounding
• Use case: Maximize geometric growth
Mode 3: Risk-Based (Initial Capital)
• Size = (Initial Capital × Risk%) / (Stop Distance × Point Value)
• No compounding - consistent risk exposure
• Best for: Professional risk management
• Use case: Live trading with stable risk
Multi-Instrument Intelligence
Auto-detects and calculates correctly for:
• Futures: Uses contract point value (ES $50/pt, NQ $20/pt, MES $5/pt, MNQ $2/pt)
• Forex: Uses pip value per lot (Standard/Mini/Micro/Nano)
• Crypto: Uses contract multiplier (1.0 BTC, 0.001 BTC, etc)
• Stocks: Uses $1 per share
Manual override available if auto-detect fails.
📊 RISK MANAGEMENT:
Multi-Layer Protection
• Per-Trade Risk: 0.5-2% of capital (configurable)
• Daily Risk Limit: Max 4% loss per day (halts trading)
• Max Drawdown Pause: Circuit breaker at 12% drawdown
• Position Size Limits: Min/max contracts enforced
• Max Stop Distance: ATR-based hard limit (prevents catastrophic losses)
Trailing Stop System
• Uses Pine Script's native trail_price and trail_offset
• Activates after configurable R-multiple profit (default 0.5R)
• Trail distance: ATR-based (tight 0.5 ATR to loose 2.0 ATR)
• Works reliably in backtesting AND live trading
• No manual stop management needed
🌍 GLOBAL MARKET SUPPORT:
Configurable Sessions
Unlike basic ORB indicators, this strategy works globally:
• US Equities: 9:30 AM ET default
• Forex London: Custom session 08:00-08:30 GMT
• Forex NY: Custom session 13:30-14:00 GMT
• Asian Markets: Custom session with Tokyo timezone
• Crypto: 24/7 support with custom ORB windows
Timezone support includes:
America/New_York, Europe/London, Asia/Tokyo, Asia/Hong_Kong, UTC, and more.
Session ORBs
• Asian Session ORB (Tokyo open)
• London Session ORB (Forex primary)
• NY Session ORB (US market hours)
Critical for Forex traders working multiple sessions.
📈 BACKTESTING CAPABILITIES:
Realistic Simulation
• Commission: Configurable (default $1 per order)
• Slippage: 2 ticks default (adjustable)
• Volume Confirmation: Prevents unrealistic fills
• RTH Filtering: Optional Regular Trading Hours only
• Bar Magnifier: Improved intrabar execution
Performance Metrics Dashboard
Real-time statistics displayed:
• Total Trades & Win Rate
• Net P&L & Profit Factor
• Current Drawdown
• Daily P&L tracking
• Position details (if in trade)
• Position sizing mode & current size
Historical Testing
• Supports 5000+ bars of history
• Test across multiple market conditions
• Bull markets, bear markets, range-bound periods
• Optimize by day type (trend vs rotation)
🎛️ CUSTOMIZATION OPTIONS:
ORB Settings
• Timeframe: 5, 15, 30, or 60 minutes
• Confirmation: Close, Wick, or Body
• Volume: On/off with multiplier threshold
• LTF Precision: Sub-minute high/low detection
• RTH Filter: Regular Trading Hours only option
Breakout Detection
• ML Filtering: Enable/disable with thresholds
• Failed Breakout: Sensitivity (2-10 bars)
• Failure Buffer: ATR-based confirmation
• Entry Window: Bars after signal (prevents late entries)
Stop Methods
• ATR: Tight dynamic stops (recommended)
• ORB Mid: Structural stop at midpoint
• ORB Opposite: Wide stop at opposite boundary
• Hybrid: Best of ATR and structural
Target Methods
• Single: One target, full exit
• Scaled: Partial exits at T1/T2/T3 (recommended)
• Trail Only: No fixed targets, trail to exit
🔬 OPTIMIZATION GUIDE:
For Futures (ES, NQ, MNQ, MES)
• ORB: 30 min
• Confirmation: Close
• Volume: ON (1.5x)
• Stop Method: ATR (1.0x multiplier)
• Position Mode: Risk-Based (Initial)
• Risk Per Trade: 1.5%
• Failed Breakouts: ENABLE
For Forex Majors
• ORB: 60 min (or 15 min at London open)
• Confirmation: Close
• Volume: OFF (tick volume unreliable)
• Stop Method: ATR (1.5x multiplier)
• Position Mode: Risk-Based (Initial)
• Risk Per Trade: 1.0%
• Custom Session: 0800-0900 GMT
• Timezone: Europe/London
For Crypto (BTC, ETH)
• ORB: 60 min
• Confirmation: Close
• Volume: OFF or ON (1.2x)
• Stop Method: ATR (2.0x wider stops)
• Position Mode: Fixed or Risk-Based
• Risk Per Trade: 2.0% (higher volatility)
• Custom Session: Define your preferred window
For Stocks/ETF
• ORB: 15-30 min
• Confirmation: Body (most conservative)
• Volume: ON (2.0x threshold)
• Stop Method: Hybrid
• Position Mode: Risk-Based (Initial)
• Risk Per Trade: 1.0%
• RTH Only: ENABLED
• Gap Analysis: ENABLED
💎 ADVANCED FEATURES:
Initial Balance Analysis
• First hour range tracking (A + B periods)
• IB extensions at 0.5x, 1.0x, 1.5x, 2.0x
• Day type classification (Trend/Normal/Rotation)
• Adjusts strategy behavior by day type
ORB Extensions
• Fibonacci targets: 1.272x, 1.5x, 1.618x, 2.0x, 2.618x, 3.0x
• Dynamic monitoring for take-profit zones
• Extension tracking in statistics
VWAP Integration
• Institutional benchmark reference
• Standard deviation bands (1σ and 2σ)
• Breakout alignment scoring
• Context for trade quality
Gap Analysis
• Overnight gap detection
• Gap fill target projection
• Gap fill rate statistics
• Direction bias from gap type
Comprehensive Statistics
• Bull/Bear breakout win rates
• Reversal win rate (typically 65-75%)
• Day type distribution
• Extension statistics
• Gap fill rate
• Real-time performance tracking
🎨 VISUAL FEEDBACK:
Enhanced Plots
• ORB levels (High/Low/Mid continuous lines)
• Entry markers (L for long, S for short, 🔥 for reversals)
• Extension levels with labels
• Session ORBs (Asian/London/NY)
• IB levels and extensions
• VWAP with bands
• Failed breakout markers
Color-Coded Momentum Boxes
• Blue: Inside ORB (consolidation)
• Green: Above ORB (bullish momentum)
• Red: Below ORB (bearish momentum)
• Orange: Failed breakout zones
• Variable intensity based on distance
Dynamic Dashboards
• Main Dashboard: ORB status, breakout info, setup details, market context
• Strategy Dashboard: Trades, Win%, P&L, Profit Factor, Daily P&L, Drawdown, Position info
• Narrative Dashboard: Plain-language market interpretation
Three Display Modes
• Simple: Clean chart, essential ORB only
• Standard: ORB + IB + Sessions + VWAP (recommended)
• Advanced: All features + statistics
🔔 ALERT SYSTEM:
Strategy Alerts
• Breakout Entry (with ML probabilities)
• Failed Breakout Entry (with targets)
• Stop Hit (position closed)
• Target Hit (T1, T2, T3 partials)
• Extension Reached (profit zone)
• IB Break (potential trend day)
All alerts include:
• Direction and setup type
• Entry price and position size
• Stop and target levels
• ML scores (if enabled)
• Setup grade (A+ to D)
• Win rate context
⏱️ TIMEFRAMES: 1m-15m optimal (works on all)
💎 INSTRUMENTS: Futures, Forex, Crypto, Stocks, Indices
🎓 SKILL LEVEL: Intermediate to Advanced
📚 WHAT'S INCLUDED:
Comprehensive Documentation
• 200+ lines of detailed tooltips
• Every setting fully explained
• Optimization guides by market
• Position sizing calculator explanations
• Risk management framework
• Best practices and common pitfalls
Ready-to-Use Configurations
• Default settings optimized for ES/NQ
• Recommended settings for each instrument type
• Conservative vs Aggressive profiles
• Scalping vs Swing configurations
Full Transparency
• All calculations shown in dashboard
• Position sizing visible in real-time
• Strategy performance metrics live
• No black boxes or hidden logic
🚨 RISK DISCLAIMERS:
CRITICAL INFORMATION - PLEASE READ:
• This is a trading strategy that executes real trades in backtesting
• Past performance does NOT guarantee future results
• All trading involves substantial risk of loss
• Never risk money you cannot afford to lose
• This is NOT financial advice - for educational purposes only
• Requires understanding of ORB methodology and risk management
• Test thoroughly on paper/demo account before live trading
• Position sizing must be configured correctly for your account
• Stop losses are NOT guaranteed in all market conditions
• Slippage and commissions will affect live results
• Volatile markets may trigger circuit breakers (drawdown pause)
Strategy-Specific Risks:
• Opening range breakouts can fail (hence the reversal system)
• Volume confirmation may limit signals in low-volume instruments
• Custom sessions must match your market's actual hours
• Multi-instrument support requires correct point value configuration
• Trailing stops may exit early in volatile conditions
• Daily limits may prevent recovery trades
• Backtesting results may not match live execution
Position Sizing Warnings:
• Risk-Based modes can size large positions if stops are tight
• Always set max position size limits appropriate for your account
• Verify point values are correct for your instrument
• Test with small size first
• Monitor position size in dashboard before every trade
🎓 WHO THIS IS FOR:
Best Suited For:
• Traders with ORB methodology knowledge
• Those seeking a fully-automated system
• Backtesting enthusiasts
• Multi-instrument traders
• Risk-conscious systematic traders
• Traders who understand position sizing
Not Recommended For:
• Complete beginners to trading
• Those seeking "set and forget" with zero monitoring
• Traders unwilling to backtest first
• Those who don't understand risk management
• Accounts under $5,000 (position sizing too small)
💡 PRO TIPS:
Backtesting Best Practices
• Start with 2+ years of data
• Include both bull and bear markets
• Test on same timeframe you'll trade (5-min for 5-min ORB)
• Account for commissions/slippage realistically
• Verify win rate >45% and profit factor >1.3
Position Sizing
• Use Risk-Based (Initial Capital) for most consistent results
• Start with 1% risk per trade, increase to 1.5-2% if comfortable
• Set max position size to prevent oversizing
• Verify point values are correct before live trading
• Monitor dashboard for actual size before each trade
Risk Management
• NEVER disable daily loss limit
• Keep max drawdown pause at 12% or lower
• Use ATR stop method for best R:R
• Enable trailing stops for trend capturing
• Take partial profits at T1 (at least 30-40%)
Failed Breakout Trading
• These are your highest win-rate setups (65-75%)
• Always enable this feature
• Use tighter stops on reversals than breakouts
• Don't chase if you miss the entry window
• Three targets allow you to scale out profitably
ML Filtering
• Dramatically improves breakout quality
• Reduce signals but increase win rate
• Start with default thresholds (pCont≥0.55, pFail≤0.35)
• Lower signals = higher quality in choppy markets
• Can disable for more signals in strong trends
⚙️ TECHNICAL DETAILS:
Strategy Engine
• Pine Script v5
• Native strategy.entry() and strategy.exit()
• Trailing stops use trail_price/trail_offset (no repainting)
• Proper position sizing with strategy.position_size
• Realistic fills with commission and slippage
• Bar magnifier for improved intrabar execution
Performance
• Optimized for 1-minute to 15-minute charts
• Supports 5000+ bars of history
• Efficient calculations (no arrays in hot loops)
• Max 500 visual objects (boxes/lines/labels)
• No repainting - all signals confirmed on bar close
Position Sizing Engine
• Auto-detects Futures, Forex, Crypto, Stocks
• Uses syminfo.pointvalue when available
• Falls back to manual configuration
• Proper rounding to exchange increments
• Min/max limits enforced
Risk System
• Per-trade risk percentage enforced
• Daily P&L tracking
• Drawdown from peak equity
• Circuit breakers halt trading when limits hit
• Resets daily for fresh start
🔄 VERSION HISTORY:
Current Version: 1.0 (Initial Release)
• Complete ORB breakout + reversal strategy
• Adaptive position sizing (3 modes)
• Multi-instrument support
• Advanced risk management
• Native trailing stops
• ML filtering integration
• Comprehensive backtesting
• Real-time performance dashboard
Planned Updates:
• Additional session templates (Tokyo, Sydney)
• More stop methods
• Enhanced ML model training
• Volatility regime detection
• Trade journal export
═══════════════════════════════════════════════════════════════════════════════
Trade the opening range with institutional precision.
Automated entries. Intelligent sizing. Professional risk management.
Test first. Trade smart. Scale safely.
Taking you to school. — Dskyz, Trade with insight. Trade with anticipation.

Power Hour Money StrategyDescription of the Pine Script Code: "Power Hour Money Strategy"
This Pine Script strategy, "Power Hour Money Strategy," is designed to trade based on the alignment of multiple time frames (month, week, day, and hour). The strategy aims to enter long or short positions depending on whether all selected time frames are in sync (all green for long positions, all red for short positions). Additionally, the script includes configurations for trading during specific sessions and automatically closing positions at the end of the trading day.
Core Features:
1. Time Frame Sync Check:
- The strategy evaluates whether the current price is higher than the opening price for the month, week, day, and hour to determine if each time frame is "green" (bullish) or "red" (bearish).
2. Session Control:
- The user can select between different trading sessions:
- "NY Session 9:30-11:30"
- "Extended NY Session 8-4"
- "All Sessions"
- Trades are only executed if the current time falls within the selected session.
3. Trailing Stop Mechanism:
- The strategy includes an optional trailing stop mechanism for both long and short positions.
- The trailing stop is configured with a percentage loss from the current price to protect gains.
4. End-of-Day Position Management:
- An option is provided to automatically close all positions at the end of the trading day (5:45 PM Eastern Time).
Detailed Code Breakdown:
1. Input Settings:
- **Session Selection**: Allows the user to choose the trading session.
- **End-of-Day Close**: Option to automatically close positions at the end of the day.
- **Trailing Stop Loss**: Enables or disables the trailing stop loss feature and sets the percentage for long and short positions.
2. Time Frame Calculations:
- The script uses `request.security` to get the opening prices for higher time frames (monthly, weekly, daily, and hourly).
- It compares the current close price to these opening prices to determine if each time frame is green or red.
3. Session Time Definitions:
- Defines the start and end times for the NY session (9:30-11:30 AM) and the extended session (8:00 AM - 4:00 PM).
4. Trade Execution:
- The strategy checks if all selected time frames are in sync and if the current time falls within the trading session.
- If all conditions are met, it enters a long or short position.
5. Trailing Stop Loss Implementation:
- Adjusts the stop price based on the trailing percentage and the current position's size.
- Automatically exits positions if the trailing stop condition is met.
6. End-of-Day Close Implementation:
- Uses a timestamp to check if the current time is 5:45 PM Eastern Time.
- Closes all positions if the end-of-day condition is met.
7. Plotting and Logging:
- Plots indicators to visualize the green/red status of each time frame.
- Logs information about the status of each time frame for debugging and analysis.
Example Usage:
Entering a Long Position: If the month, week, day, and hour are all green and the current time is within the selected session, a long position is entered.
Entering a Short Position: If the month, week, day, and hour are all red and the current time is within the selected session, a short position is entered.
Trailing Stop: Protects gains by exiting the position if the price moves against the set trailing stop percentage.
End-of-Day Close: Automatically closes all open positions at 5:45 PM Eastern Time if enabled.
This strategy is particularly useful for traders who want to ensure that multiple time frames are in alignment before entering a trade and who wish to manage positions effectively throughout the trading day with specific session controls and trailing stops.

Hanzo Strategy - Volume & Smart Money📊 HANZO STRATEGY - Complete Description
## 🎯 Strategy Overview
The **Hanzo Strategy** is an advanced institutional trading system that combines Volume Profile analysis, Smart Money Concepts, and Price Action patterns to identify high-probability trade setups. This strategy is specifically designed for trading Gold (XAUUSD), NAS100, and US30 on the 15-minute timeframe.
---
## 🧠 Core Trading Philosophy
The Hanzo Strategy operates on the principle that **institutional money leaves footprints** in the market through:
- Volume accumulation at key price levels
- Liquidity sweeps and stop hunts
- Order block formations
- Strategic wick rejections at support/resistance
By identifying these institutional behaviors and combining them with precise volume analysis, the strategy aims to trade **with** the smart money, not against it.
---
## 🔑 Key Components
### 1️⃣ **Fixed Range Volume Profile (FRVP)**
- **What it does:** Analyzes the last 2 days of price action and calculates where the most volume traded
- **Point of Control (POC):** The price level with the highest trading volume - acts as a magnet for price
- **How we use it:** Price tends to revert to POC. When price is far from POC and starts moving toward it, we prepare for entries
- **Visual:** Yellow cross line on the chart marking the POC
### 2️⃣ **Wick Cluster Detection**
- **What it does:** Automatically identifies price levels where multiple candle wicks have rejected (2-6+ wicks)
- **Why it matters:** Multiple rejections at the same level indicate strong institutional support/resistance
- **Upper wick clusters:** Resistance zones where price was rejected downward
- **Lower wick clusters:** Support zones where price was rejected upward
- **Visual:** Dashed lines (red for resistance, green for support)
### 3️⃣ **Session Volatility Boxes**
- **London Session (8:00-16:00 UTC+3):** Captures European market volatility range
- **New York Session (13:30-20:00 UTC+3):** Captures US market volatility range
- **How we use it:** These ranges often act as support/resistance for the rest of the day
- **Visual:** Blue box for London, Orange box for New York
### 4️⃣ **Smart Money Zones**
**Order Blocks:**
- Strong institutional areas where banks and hedge funds placed large orders
- **Bullish Order Block:** Area where smart money bought heavily before a strong upward move
- **Bearish Order Block:** Area where smart money sold heavily before a strong downward move
- **Visual:** Green/Red filled boxes with "Bull OB" or "Bear OB" labels
**Liquidity Sweeps:**
- Price breaks above recent high or below recent low, then quickly reverses
- This is a "stop hunt" - institutions triggering retail stops before moving in the real direction
- **Bullish Sweep:** Price dips below support, grabs stops, then reverses up
- **Bearish Sweep:** Price pops above resistance, grabs stops, then reverses down
- **Visual:** Triangle markers (green up = bullish, red down = bearish)
### 5️⃣ **Engulfing Pattern Recognition**
- **Bullish Engulfing:** Large green candle fully engulfs the previous red candle - shows strong buying pressure
- **Bearish Engulfing:** Large red candle fully engulfs the previous green candle - shows strong selling pressure
- **How we use it:** Confirmation signal when combined with other factors
- **Visual:** Small circles below/above candles
### 6️⃣ **Trend Bias Indicator**
- Dynamically calculates market bias based on price position relative to POC
- **Bullish:** Price > 0.2% above POC
- **Neutral:** Price within 0.2% of POC
- **Bearish:** Price > 0.2% below POC
- **Visual:** Label at top of chart showing current bias
---
## 📈 Entry Signal Logic
The strategy generates **LONG** and **SHORT** signals based on confluence of multiple factors:
### 🟢 LONG ENTRY CONDITIONS:
1. **POC Break:** Price crosses above POC from below + Trend Bias is Bullish
**OR**
2. **Support Bounce:** Price touches a lower wick cluster + Bullish Engulfing pattern forms
3. **Additional Filter:** Trend Bias must NOT be Bearish
### 🔴 SHORT ENTRY CONDITIONS:
1. **POC Break:** Price crosses below POC from above + Trend Bias is Bearish
**OR**
2. **Resistance Rejection:** Price touches an upper wick cluster + Bearish Engulfing pattern forms
3. **Additional Filter:** Trend Bias must NOT be Bullish
---
## 🎯 Risk Management
### Stop Loss:
- **Calculation:** 2 × ATR(14) from entry price
- **Logic:** Uses Average True Range to adapt to current market volatility
- **Example:** If ATR = 10 points, stop loss is 20 points away
### Take Profit:
- **Calculation:** 3 × ATR(14) from entry price
- **Risk:Reward Ratio:** 1:1.5 (risking 2 ATR to make 3 ATR)
- **Example:** If ATR = 10 points, take profit is 30 points away
### Position Sizing:
- **Default:** 2% of account equity per trade
- **Adjustable:** Can be modified in strategy settings
---
## ⚙️ Strategy Settings & Customization
### Volume Profile Settings:
- **Lookback Days:** How many days to analyze (default: 2)
- **Profile Rows:** Resolution of volume calculation (default: 24)
- **POC Distance Threshold:** Minimum distance from POC for "far from POC" status (default: 0.3%)
### Wick Cluster Settings:
- **Min Wicks for Cluster:** How many wicks needed to form a cluster (default: 3)
- **Lookback Bars:** How far back to search for wicks (default: 50)
- **Tolerance %:** How close wicks must be to cluster together (default: 0.15%)
### Session Settings:
- **London Session:** 08:00-16:00 (adjustable)
- **New York Session:** 13:30-20:00 (adjustable)
- **UTC Offset:** Timezone adjustment (default: +3)
### Smart Money Settings:
- **Order Block Lookback:** How far back to search for order blocks (default: 20)
- **Toggle On/Off:** Can enable/disable order blocks and liquidity sweeps independently
---
## 📊 Performance Metrics Display
The strategy includes a real-time **Information Table** (top-right corner) showing:
| Metric | Description |
|--------|-------------|
| **Trend Bias** | Current market direction (Bullish/Neutral/Bearish) |
| **POC Price** | Current Point of Control price level |
| **Distance from POC** | How far current price is from POC (%) |
| **ATR (14)** | Current volatility measurement |
| **High Wick Clusters** | Number of resistance clusters detected |
| **Low Wick Clusters** | Number of support clusters detected |
| **Current Signal** | Active signal (LONG/SHORT/None) |
---
## 🚨 Alert System
The strategy can send alerts for:
1. **LONG Signal Triggered** - When all conditions met for long entry
2. **SHORT Signal Triggered** - When all conditions met for short entry
3. **Price Touching Support Cluster** - Warning that price at key support
4. **Price Touching Resistance Cluster** - Warning that price at key resistance
**Alert Frequency:** Once per bar (prevents spam)
---
## 📅 Best Trading Timeframes & Instruments
### ✅ Recommended Timeframes:
- **Primary Entry:** 15-minute chart
- **Trend Confirmation:** 30-minute or 1-hour chart
- **Higher Timeframe Filter:** 4-hour for major trend direction
### ✅ Recommended Instruments:
1. **Gold (XAUUSD)** - High volatility, respects key levels well
2. **NAS100 (US Tech 100)** - Strong trends, good liquidity
3. **US30 (Dow Jones)** - Reliable institutional participation
4. **EUR/USD, GBP/USD** - Can work on major forex pairs with adjustments
### ⏰ Best Trading Sessions:
- **London Open (08:00-12:00 UTC+3)** - High volatility, clear directional moves
- **New York Open (13:30-17:00 UTC+3)** - Strongest moves, highest volume
- **Overlap (13:30-16:00 UTC+3)** - Best liquidity and movement
### ⚠️ Avoid Trading:
- Asian session (low volatility)
- Major news events (first 15 minutes after high-impact news)
- Sundays and holidays (low liquidity)
---
## 💡 Pro Trading Tips
### 1. **Multiple Timeframe Confirmation**
- Check 1-hour chart for overall trend before taking 15-minute signals
- Only take LONG signals if 1-hour is bullish
- Only take SHORT signals if 1-hour is bearish
### 2. **POC Strategy**
- Best entries occur when price returns to POC after being far away
- Wait for POC touch + confirmation pattern (engulfing, order block)
- POC acts as support in uptrends, resistance in downtrends
### 3. **Wick Cluster Strategy**
- Strongest signals occur when wick clusters align with POC
- Look for 4+ wicks at the same level for highest probability
- Recent clusters (formed in last 2 days) are stronger than old ones
### 4. **Order Block Strategy**
- Fresh order blocks (just formed) are more powerful
- Wait for price to return to order block zone before entering
- Best when order block + wick cluster occur at same level
### 5. **London/NY Box Strategy**
- If price breaks above session high → look for LONG pullback entries
- If price breaks below session low → look for SHORT pullback entries
- Price often returns to session mid-point before continuing
### 6. **Risk Management Rules**
- **Never risk more than 2% per trade**
- **Don't trade more than 3 positions simultaneously**
- **If 2 losses in a row, reduce size to 1% or stop for the day**
- **Move stop to breakeven after 1:1 profit reached**
### 7. **High-Probability Setups**
Look for **CONFLUENCE** - the more factors aligned, the better:
✅ **BEST LONG SETUP:**
- Price at lower wick cluster (support)
- Price at/near POC
- Bullish order block present
- Bullish engulfing pattern forms
- Trend Bias = Bullish
- 1-hour chart = uptrend
✅ **BEST SHORT SETUP:**
- Price at upper wick cluster (resistance)
- Price at/near POC
- Bearish order block present
- Bearish engulfing pattern forms
- Trend Bias = Bearish
- 1-hour chart = downtrend
---
## 📈 Performance Expectations
### Typical Win Rate:
- **Conservative Trading (high confluence only):** 55-65% win rate
- **Moderate Trading (good setups):** 45-55% win rate
- **Aggressive Trading (all signals):** 35-45% win rate
### Typical Risk:Reward:
- **Average R:R:** 1:1.5 (with 2 ATR stop and 3 ATR target)
- **Breakeven adjusted:** Often improves to 1:2+ when stop moved to BE
### Monthly Trade Frequency (15M chart):
- **Gold:** 60-100 signals per month
- **NAS100:** 50-80 signals per month
- **US30:** 40-70 signals per month
---
## 🎓 Strategy Philosophy Summary
The Hanzo Strategy is built on three core principles:
1. **Follow the Volume** - Trade where institutions are active
2. **Respect the Levels** - Key support/resistance zones matter
3. **Confirm with Price Action** - Wait for confirmation before entering
This is NOT a holy grail - it requires:
- ✅ Discipline to wait for proper setups
- ✅ Patience to let trades play out
- ✅ Risk management to protect capital
- ✅ Emotional control to handle losses
---
## 🛠️ How to Use This Strategy
### Step 1: Initial Setup
1. Add strategy to 15-minute chart
2. Check that all components are visible (POC, clusters, boxes, etc.)
3. Adjust colors if needed for your chart theme
### Step 2: Daily Routine
1. **Pre-Market (before 8:00 AM):**
- Check POC location
- Note wick clusters from previous days
- Mark London/NY session boxes from yesterday
2. **London Session (8:00-16:00):**
- Watch for POC interactions
- Monitor for order blocks forming
- Wait for confluence setups
3. **NY Session (13:30-20:00):**
- Highest activity period
- Best signal quality
- More aggressive entries allowed
### Step 3: Trade Execution
1. Wait for signal label (LONG or SHORT) to appear
2. Check confluence factors (minimum 3)
3. Enter immediately or on next candle
4. Set stop loss at 2 × ATR from entry
5. Set take profit at 3 × ATR from entry
6. Move stop to breakeven at +1.5 ATR profit
### Step 4: Trade Management
- **Don't move stop closer** (let trade breathe)
- **Can trail stop** after 2:1 profit reached
- **Can take partial profits** at 1.5:1 and let rest run
- **Journal every trade** for future improvement
---
## ⚠️ Important Disclaimers
1. **Past performance does not guarantee future results**
2. **This strategy involves risk** - only trade with money you can afford to lose
3. **Backtest thoroughly** on your specific instruments before live trading
4. **Start small** - test with minimum position sizes first
5. **Market conditions change** - what works today may not work tomorrow
6. **Use proper risk management** - this is the #1 key to long-term success
---
## 🎯 Quick Reference Checklist
Before taking any trade, ask yourself:
- ✅ Is there a clear LONG or SHORT signal?
- ✅ Are we in London or NY session?
- ✅ Is price at/near POC or wick cluster?
- ✅ Is trend bias aligned with my direction?
- ✅ Is there an order block or engulfing pattern?
- ✅ Is my risk:reward at least 1:1.5?
- ✅ Am I risking no more than 2% of my account?
**If 5+ are YES → Take the trade!**
**If 3 or fewer YES → Skip and wait for better setup!**
---
## 🚀 Final Words
The Hanzo Strategy is a professional-grade trading system that combines institutional analysis with precise technical execution. Success comes not from taking every signal, but from taking only the **highest probability setups** with proper risk management.
**Trade smart. Trade safe. Trade like an institution.**
📊 **Good luck and profitable trading!** 📊

Final Scalping Strategy - RELAXED ENTRY, jangan gopoh braderEMA Scalping System (MTF) Guide (1HR direction, 15 min entry)
Objective
To capture small, consistent profits by entering trades when 15-minute momentum aligns with the 1-hour trend.
Trades are executed only during high-liquidity London and New York sessions to increase the probability of execution and success.
Strategy Setup
Chart Timeframe (Execution): 15-Minute (M15).
Trend Filter (HTF): 1-Hour (H1) chart data is used for the long-term EMA.
Long-Term Trend Filter: 50-Period EMA (based on H1 data).
Short-Term Momentum Signal: 20-Period EMA (based on M15 data).
Risk
Metric: 14-period ATR for dynamic Stop Loss calculation.
✅ Trading Rules🟢
Long (Buy) Entry Conditions
Session: Must be within the London (0800-1700 GMT) or New York (1300-2200 GMT) sessions.
HTF Trend: Current price must be above the 1-Hour EMA 50.
Momentum Signal: Price crosses above the 15-Minute EMA 20.
Confirmation: The bar immediately following the crossover must close above the 15-Minute EMA 20.
Ent
ry: A market order is executed on the close of the confirmation candle.
🔴 Short (Sell) Entry Conditions
Session: Must be within the London (0800-1700 GMT) or New York (1300-2200 GMT) sessions.
HTF Trend: Current price must be below the 1-Hour EMA 50.
Momentum Signal: Price crosses below the 15-Minute EMA 20.
Confirmation: The bar immediately following the crossover must close below the 15-Minute EMA 20.
Entry: A market order is executed on the close of the confirmation candle.
🛑 Trade Management & Exits
Stop Loss (SL): Placed dynamically at 2.0 times the 14-period ATR distance from the entry candle's low (for Buys) or high (for Sells).
Take Profit (TP): Placed dynamically to achieve a 1.5 Risk-Reward Ratio (RR) (TP distance = 1.5 x SL d
istance).
📊 On-Chart Visuals
Detailed Labels: A box appears on the entry bar showing the action, SL/TP prices, Risk/Reward in Pips, and the exact R:R ratio.
Horizontal Lines: Dashed lines display the calculated SL (Red) and TP (Green) levels while the trade is active.
Background: The chart background is shaded to highlight the active London and New York tradi
ng sessions.

ICT Liquidity Sweep Asia/London 1 Trade per High & Low🧠 ICT Liquidity Sweep Asia/London — 1 Trade per High & Low
This strategy is inspired by the ICT (Inner Circle Trader) concepts of liquidity sweeps and market structure, focusing on the Asia and London sessions.
It automatically identifies liquidity grabs (sweeps) above or below key session highs/lows and enters trades with a fixed risk/reward ratio (RR).
----------------------------------------------------------------------------------
----------------------------------------------------------------------------------
⚙️ Core Logic
-Asia Session: 8:00 PM – 11:59 PM (New York time)
-London Session: 2:00 AM – 5:00 AM (New York time)
-The script marks the Asia High/Low and London High/Low ranges for each day.
-When the market sweeps above a session high → potential Short setup
-When the market sweeps below a session low → potential Long setup
-A trade is triggered when the confirmation candle closes in the opposite direction of the sweep (bearish after a high sweep, bullish after a low sweep).
-Only one trade per sweep type (1 per High, 1 per Low) is allowed per session.
----------------------------------------------------------------------------------
----------------------------------------------------------------------------------
📈 Risk Management
-Configurable Risk/Reward Target (default = 2:1)
-Configurable Position Size (number of contracts)
-Each trade uses a fixed Stop Loss (beyond the wick of the sweep) and a Take Profit calculated from the RR setting.
-All trades are automatically logged in the Strategy Tester with performance metrics.
----------------------------------------------------------------------------------
----------------------------------------------------------------------------------
💡 Features
✅ Visual session highlighting (Asia = Aqua, London = Orange)
✅ Automatic liquidity line plotting (session highs/lows)
✅ Entry & exit labels (optional visual display)
✅ Customizable RR and contract size
✅ Works on any instrument (ideal for indices, futures, or forex)
✅ Compatible with all timeframes (optimized for 1M–15M)
----------------------------------------------------------------------------------
----------------------------------------------------------------------------------
⚠️ Notes
-Best used on New York time-based charts.
-Designed for educational and backtesting purposes — not financial advice.
-Use as a foundation for further optimization (e.g., SMT confirmation, FVG filter, or time-based restrictions).
----------------------------------------------------------------------------------
----------------------------------------------------------------------------------
🧩 Recommended Use
Pair this with:
-ICT’s concepts like CISD (Change in State of Delivery) and FVGs (Fair Value Gaps)
-Higher timeframe liquidity maps
-Session bias or daily narrative filters
----------------------------------------------------------------------------------
----------------------------------------------------------------------------------
Author: jygirouard
Strategy Version: 1.3
Type: ICT Liquidity Sweep Automation
Timezone: America/New_York

ATR GOD Strategy by TradeSmart (PineConnector-compatible)This is a highly-customizable trading strategy made by TradeSmart, focusing mainly on ATR-based indicators and filters. The strategy is mainly intended for trading forex , and has been optimized using the Deep Backtest feature on the 2018.01.01 - 2023.06.01 interval on the EUR/USD (FXCM) 15M chart, with a Slippage value of 3, and a Commission set to 0.00004 USD per contract. The strategy is also made compatible with PineConnector , to provide an easy option to automate the strategy using a connection to MetaTrader. See tooltips for details on how to set up the bot, and check out our website for a detailed guide with images on how to automate the strategy.
The strategy was implemented using the following logic:
Entry strategy:
A total of 4 Supertrend values can be used to determine the entry logic. There is option to set up all 4 Supertrend parameters individually, as well as their potential to be used as an entry signal/or a trend filter. Long/Short entry signals will be determined based on the selected potential Supertrend entry signals, and filtered based on them being in an uptrend/downtrend (also available for setup). Please use the provided tooltips for each setup to see every detail.
Exit strategy:
4 different types of Stop Losses are available: ATR-based/Candle Low/High Based/Percentage Based/Pip Based. Additionally, Force exiting can also be applied, where there is option to set up 4 custom sessions, and exits will happen after the session has closed.
Parameters of every indicator used in the strategy can be tuned in the strategy settings as follows:
Plot settings:
Plot Signals: true by default, Show all Long and Short signals on the signal candle
Plot SL/TP lines: false by default, Checking this option will result in the TP and SL lines to be plotted on the chart.
Supertrend 1-4:
All the parameters of the Supertrends can be set up here, as well as their individual role in the entry logic.
Exit Strategy:
ATR Based Stop Loss: true by default
ATR Length (of the SL): 100 by default
ATR Smoothing (of the SL): RMA/SMMA by default
Candle Low/High Based Stop Loss: false by default, recent lowest or highest point (depending on long/short position) will be used to calculate stop loss value. Set 'Base Risk Multiplier' to 1 if you would like to use the calculated value as is. Setting it to a different value will count as an additional multiplier.
Candle Lookback (of the SL): 50 by default
Percentage Based Stop Loss: false by default, Set the stop loss to current price - % of current price (long) or price + % of current price (short).
Percentage (of the SL): 0.3 by default
Pip Based Stop Loss: Set the stop loss to current price - x pips (long) or price + x pips (short). Set 'Base Risk Multiplier' to 1 if you would like to use the calculated value as is. Setting it to a different value will count as an additional multiplier.
Pip (of the SL): 10 by default
Base Risk Multiplier: 4.5 by default, the stop loss will be placed at this risk level (meaning in case of ATR SL that the ATR value will be multiplied by this factor and the SL will be placed that value away from the entry level)
Risk to Reward Ratio: 1.5 by default, the take profit level will be placed such as this Risk/Reward ratio is met
Force Exiting:
4 total Force exit on custom session close options: none applied by default. If enabled, trades will close automatically after the set session is closed (on next candle's open).
Base Setups:
Allow Long Entries: true by default
Allow Short Entries: true by default
Order Size: 10 by default
Order Type: Capital Percentage by default, allows adjustment on how the position size is calculated: Cash: only the set cash amount will be used for each trade Contract(s): the adjusted number of contracts will be used for each trade Capital Percentage: a % of the current available capital will be used for each trade
ATR Limiter:
Use ATR Limiter: true by default, Only enter into any position (long/short) if ATR value is higher than the Low Boundary and lower than the High Boundary.
ATR Limiter Length: 50 by default
ATR Limiter Smoothing: RMA/SMMA by default
High Boundary: 1000 by default
Low Boundary: 0.0003 by default
MA based calculation: ATR value under MA by default, If not Unspecified, an MA is calculated with the ATR value as source. Only enter into position (long/short) if ATR value is higher/lower than the MA.
MA Type: RMA/SMMA by default
MA Length: 400 by default
Waddah Attar Filter:
Explosion/Deadzone relation: Not specified by default, Explosion over Deadzone: trades will only happen if the explosion line is over the deadzone line; Explosion under Deadzone: trades will only happen if the explosion line is under the deadzone line; Not specified: the opening of trades will not be based on the relation between the explosion and deadzone lines.
Limit trades based on trends: Not specified by default, Strong Trends: only enter long if the WA bar is colored green (there is an uptrend and the current bar is higher then the previous); only enter short if the WA bar is colored red (there is a downtrend and the current bar is higher then the previous); Soft Trends: only enter long if the WA bar is colored lime (there is an uptrend and the current bar is lower then the previous); only enter short if the WA bar is colored orange (there is a downtrend and the current bar is lower then the previous); All Trends: only enter long if the WA bar is colored green or lime (there is an uptrend); only enter short if the WA bar is colored red or orange (there is a downtrend); Not specified: the color of the WA bar (trend) is not relevant when considering entries.
WA bar value: Not specified by default, Over Explosion and Deadzone: only enter trades when the WA bar value is over the Explosion and Deadzone lines; Not specified: the relation between the explosion/deadzone lines to the value of the WA bar will not be used to filter opening trades.
Sensitivity: 150 by default
Fast MA Type: SMA by default
Fast MA Length: 10 by default
Slow MA Type: SMA
Slow MA Length: 20 by default
Channel MA Type: EMA by default
BB Channel Length: 20 by default
BB Stdev Multiplier: 2 by default
Trend Filter:
Use long trend filter 1: false by default, Only enter long if price is above Long MA.
Show long trend filter 1: false by default, Plot the selected MA on the chart.
TF1 - MA Type: EMA by default
TF1 - MA Length: 120 by default
TF1 - MA Source: close by default
Use short trend filter 1: false by default, Only enter long if price is above Long MA.
Show short trend filter 1: false by default, Plot the selected MA on the chart.
TF2 - MA Type: EMA by default
TF2 - MA Length: 120 by default
TF2 - MA Source: close by default
Volume Filter:
Only enter trades where volume is higher then the volume-based MA: true by default, a set type of MA will be calculated with the volume as source, and set length
MA Type: RMA/SMMA by default
MA Length: 200 by default
Date Range Limiter:
Limit Between Dates: false by default
Start Date: Jan 01 2023 00:00:00 by default
End Date: Jun 24 2023 00:00:00 by default
Session Limiter:
Show session plots: false by default, show market sessions on chart: Sidney (red), Tokyo (orange), London (yellow), New York (green)
Use session limiter: false by default, if enabled, trades will only happen in the ticked sessions below.
Sidney session: false by default, session between: 15:00 - 00:00 (EST)
Tokyo session: false by default, session between: 19:00 - 04:00 (EST)
London session: false by default, session between: 03:00 - 11:00 (EST)
New York session: false by default, session between: 08:00 - 17:00 (EST)
Trading Time:
Limit Trading Time: true by default, tick this together with the options below to enable limiting based on day and time
Valid Trading Days Global: 123567 by default, if the Limit Trading Time is on, trades will only happen on days that are present in this field. If any of the not global Valid Trading Days is used, this field will be neglected. Values represent days: Sunday (1), Monday (2), ..., Friday (6), Saturday(7) To trade on all days use: 123457
(1) Valid Trading Days: false, 123456 by default, values represent days: Sunday (1), Monday (2), ..., Friday (6), Saturday(7) The script will trade on days that are present in this field. Please make sure that this field and also (1) Valid Trading Hours Between is checked
(1) Valid Trading Hours Between: false, 1800-2000 by default, hours between which the trades can happen. The time is always in the exchange's timezone
All other options are also disabled by default
PineConnector Automation:
Use PineConnector Automation: false by default, In order for the connection to MetaTrader to work, you will need do perform prerequisite steps, you can follow our full guide at our website, or refer to the official PineConnector Documentation. To set up PineConnector Automation on the TradingView side, you will need to do the following:
1. Fill out the License ID field with your PineConnector License ID;
2. Fill out the Risk (trading volume) with the desired volume to be traded in each trade (the meaning of this value depends on the EA settings in Metatrader. Follow the detailed guide for additional information);
3. After filling out the fields, you need to enable the 'Use PineConnector Automation' option (check the box in the strategy settings);
4. Check if the chart has updated and you can see the appropriate order comments on your chart;
5. Create an alert with the strategy selected as Condition, and the Message as {{strategy.order.comment}} (should be there by default);
6. Enable the Webhook URL in the Notifications section, set it as the official PineConnector webhook address and enjoy your connection with MetaTrader.
License ID: 60123456789 by default
Risk (trading volume): 1 by default
NOTE! Fine-tuning/re-optimization is highly recommended when using other asset/timeframe combinations.

Ramen & OJ V1Ramen & OJ V1 — Strategy Overview
Ramen & OJ V1 is a mechanical price-action system built around two entry archetypes—Engulfing and Momentum—with trend gates, session controls, risk rails, and optional interval take-profits. It’s designed to behave the same way you’d trade it manually: wait for a qualified impulse, enter with discipline (optionally on a measured retracement), and manage the position with clear, rules-based exits.
Core Idea (What the engine does)
At its heart, the strategy looks for a decisive candle, then trades in alignment with your defined trend gates and flattens when that bias is no longer valid.
Entry Candle Type
Engulfing: The body of the current candle swallows the prior candle’s body (classic momentum shift).
Momentum: A simple directional body (close > open for longs, close < open for shorts).
Body Filter (lookback): Optional guard that requires the current body to be at least as large as the max body from the last N bars. This keeps you from chasing weak signals.
Primary MA (Entry/Exit Role):
Gate (optional): Require price to be above the Primary MA for longs / below for shorts.
Exit (always): Base exit occurs when price closes back across the Primary MA against your position.
Longs: qualifying bullish candle + pass all enabled filters.
Shorts: mirror logic.
Entries (Impulse vs. Pullback)
You choose how aggressive to be:
Market/Bars-Close Entry: Fire on the bar that confirms the signal (respecting filters and sessions).
Retracement Entry (optional): Instead of chasing the close, place a limit around a configurable % of the signal candle’s range (e.g., 50%). This buys the dip/sells the pop with structure, often improving average entry and risk.
Flip logic is handled: when an opposite, fully-qualified signal appears while in a position, the strategy closes first and then opens the new direction per rules.
Exits & Trade Management
Primary Exit: Price closing back across the Primary MA against your position.
Interval Take-Profit (optional):
Pre-Placed (native): Automatically lays out laddered limit targets every X ticks with OCO behavior. Each rung can carry its own stop (per-rung risk). Clean, broker-like behavior in backtests.
Manual (legacy): Closes slices as price steps through the ladder levels intrabar. Useful for platforms/brokers that need incremental closes rather than bracketed OCOs.
Per-Trade Stop: Choose ticks or dollars, and whether the $ stop is per position or per contract. When pre-placed TP is on, each rung uses a coordinated OCO stop; otherwise a single hard stop is attached.
Risk Rails (Session P&L Controls)
Session Soft Lock: When a session profit target or loss limit is hit, the strategy stops taking new trades but does not force-close open positions.
Session Hard Lock: On reaching your session P&L limit, all orders are canceled and the strategy flattens immediately. No new orders until the next session.
These rails help keep good days good and bad days survivable.
Filters & How They Work Together
1) Trend & Bias
Primary MA Gate (optional): Only long above / only short below. This keeps signals aligned with your primary bias.
Primary MA Slope Filter (optional): Require a minimum up/down slope (in degrees over a defined bar span). It’s a simple way to force impulse alignment—green light only when the MA is actually moving up for longs (or down for shorts).
Secondary MA Filter (optional): An additional trend gate (SMA/EMA, often a 200). Price must be on the correct side of this higher-timeframe proxy to trade. Great for avoiding countertrend picks.
How to combine:
Use Secondary MA as the “big picture” bias, Primary MA gate as your local regime check, and Slope to ensure momentum in that regime. That three-layer stack cuts a lot of chop.
2) Volatility/Exhaustion
CCI Dead Zone Filter (optional): Trades only when CCI is inside a specified band (default ±200). This avoids entries when price is extremely stretched; think of it as a no-chase rule.
TTM Squeeze Filter (optional): When enabled, the strategy avoids entries during a squeeze (Bollinger Bands inside Keltner Channels). You’re effectively waiting for the release, not the compression itself. This plays nicely with momentum entries and the slope gate.
How to combine:
If you want only the clean breaks, enable Slope + Squeeze; if you want structure but fewer chases, add CCI Dead Zone. You’ll filter out a lot of low-quality “wiggle” trades.
3) Time & Market Calendar
Sessions: Up to two session windows (America/Chicago by default), with background highlights.
Good-Till-Close (GTC): When ON, trades can close outside the session window; when OFF, all positions are flattened at session end and pending orders canceled.
Market-Day Filters: Skip US listed holidays and known non-full Globex days (e.g., Black Friday, certain eves). Cleaner logs and fewer backtest artifacts.
How to combine:
Run your A-setup window (e.g., cash open hour) with GTC ON if you want exits to obey system rules even after the window, or GTC OFF if you want the book flat at the bell, no exceptions.
Practical Profiles (mix-and-match presets)
Trend Rider: Primary MA gate ON, Slope filter ON, Secondary MA ON, Retracement ON (50%).
Goal: Only take momentum that’s already moving, buy the dip/sell the pop back into trend.
Structure-First Pullback: Primary MA gate ON, Secondary MA ON, CCI Dead Zone ON, Retracement 38–62%.
Goal: Filter extremes, use measured pullbacks for better R:R.
Break-Only Mode: Slope ON + Squeeze filter ON (avoid compression), Body filter ON with short lookback.
Goal: Only catch clean post-compression impulses.
Session Scalper: Tight session window, GTC OFF, Interval TP ON (small slices, short rungs), per-trade tick stop.
Goal: Quick hits in a well-defined window, always flat after.
Automation Notes
The system is built with intrabar awareness (calc_on_every_tick=true) and supports bracket-style behavior via pre-placed interval TP rungs. For webhook automation (e.g., TradersPost), keep chart(s) open and ensure alerts are tied to your order events or signal conditions as implemented in your alert templates. Always validate live routing with a small-size shakedown before scaling.
Tips, Caveats & Good Hygiene
Intrabar vs. Close: Backtests can fill intrabar where your broker might not. The pre-placed mode helps emulate OCO behavior but still depends on feed granularity.
Slippage & Fees: Set realistic slippage/commission in Strategy Properties to avoid fantasy equity curves.
Session Consistency: Use the correct timezone and verify that your broker’s session aligns with your chart session settings.
Don’t Over-stack Filters: More filters ≠ better performance. Start with trend gates, then add one volatility filter if needed.
Disclosure
This script is for educational purposes only and is not financial advice. Markets carry risk; only trade capital you can afford to lose. Test thoroughly on replay and paper before using any automated routing.
TL;DR
Identify a decisive candle → pass trend/vol filters → (optionally) pull back to a measured limit → scale out on pre-planned rungs → exit on Primary MA break or session rule. Clear, mechanical, repeatable.

MACD + RSI + ADX Strategy (ChatGPT-powered) by TradeSmartThis is a trading strategy made by TradeSmart, using the recommendations given by ChatGPT . As an experiment, we asked ChatGPT on which indicators are the most popular for trading. We used all of the recommendations given, and added more. We ended up with a strategy that performs surprisingly well on many crypto and forex assets. See below for exact details on what logic was implemented and how you can change the parameters of the strategy.
The strategy is a Christmas special , this is how we would like to thank the support of our followers.
The strategy has performed well on Forex, tested on 43 1-hour pairs and turned a profit in 21 cases. Also it has been tested on 51 crypto pairs using the 1-hour timeframe, and turned a profit in 45 cases with a Profit Factor over 1.4 in the top-5 cases. Tests were conducted without commission or slippage, unlike the presented result which uses 0.01% commission and 5 tick slippage.
Some of the top performers were:
SNXUSDT
SOLUSDT
CAKEUSDT
LINKUSDT
EGLDUSDT
GBPJPY
TRYJPY
USDJPY
The strategy was implemented using the following logic:
Entry strategy:
Long entry:
Price should be above the Simple Moving Average (SMA)
There should be a cross up on the MACD (indicated by the color switch on the histogram, red to green)
RSI should be above the 50 level
Volume is above the selected volume-based Exponential Moving Average (EMA)
ADX should also agree to this position: below 50 and over 20, and above the Regularized Moving Average (REMA)
Short entry:
Price should be under the Simple Moving Average (SMA)
There should be a cross down on the MACD (indicated by the color switch on the histogram, red to green)
RSI should be below the 50 level
Volume is above the selected volume-based Exponential Moving Average (EMA)
ADX should also agree to this position: below 50 and over 20, and above the Regularized Moving Average (REMA)
Exit strategy:
Stop Loss will be placed based on ATR value (with 1.5 Risk)
Take profit level will be placed with a 2.5 Risk/Reward Ratio
Open positions will be closed early based on the Squeeze Momentum (Long: change to red, Short: change to green)
NOTE! : The position sizes used in the example is with 'Risk Percentage (current)', according which the position size will be determined such
that the potential loss is equal to % of the current available capital. This means that in most of the cases, the positions are calculated using leverage.
Parameters of every indicator used in the strategy can be tuned in the strategy settings as follows:
Plot settings:
Plot Signals: true by default, Show all Long and Short signals on the signal candle
Allow early TP/SL plots: false by default, Checking this option will result in the TP and SL lines to be plotted also on the signal candle rather than just the entry candle. Consider this only when manual trading, since backtest entries does not happen on the signal candle.
Entry Signal:
Fast Length: 12 by default
Slow Length: 26 by default
Source: hlcc4 by default
Signal Smoothing: 9 by default
Oscillator MA Type: EMA by default
Signal Line MA Type: EMA by default
Exit Strategy:
ATR Based Stop Loss: true by default
ATR Length (of the SL): 14 by default
ATR Smoothing (of the SL): EMA by default
Candle Low/High Based Stop Loss: false by default, recent lowest or highest point (depending on long/short position) will be used to calculate stop loss value. Set 'Base Risk Multiplier' to 1 if you would like to use the calculated value as is. Setting it to a different value will count as an additional multiplier. Please select only one active stop loss. Default value (if nothing or multiple stop losses are selected) is the 'ATR Based Stop Loss'.
Candle Lookback (of the SL): 10 by default
Base Risk Multiplier: 1.5 by default, the stop loss will be placed at this risk level (meaning in case of ATR SL that the ATR value will be multiplied by this factor and the SL will be placed that value away from the entry level)
Risk to Reward Ratio: 2.5 by default, the take profit level will be placed such as this Risk/Reward ratio is met
Force Exit based on Squeeze Momentum: true by default, a Long position will be closed when Squeeze Momentum turns red inside an open position and a Short position will be closed when Squeeze Momentum turns green inside an open position
BB Length: 20 by default
BB Mult Factor: 1.0 by default
KC Length: 20 by default
KC Mult Factor: 1.5 by default
Use True Range (KC): Yes by default
Base Setups:
Allow Long Entries: true by default
Allow Short Entries: true by default
Order Size: 1.5 by default
Order Type: Risk Percentage (current) by default, allows adjustment on how the position size is calculated: Cash: only the set cash ammount will be used for each trade Contract(s): the adjusted number of contracts will be used for each trade Capital Percentage: a % of the current available capital will be used for each trade Risk Percentage (current): position size will be determined such that the potential loss is equal to % of the current available capital Risk Percentage (initial): position size will be determined such that the potential loss is equal to % of the initial capital
Trend Filter:
Use long trend filter: true by default, only enter long if price is above Long MA
Show long trend filter: true by default, plot the selected MA on the chart
MA Type (Long): SMA by default
MA Length (Long): 100 by default
MA Source (Long): close by default
Use short trend filter: true by default, only enter long if price is under Short MA
Show short trend filter: false by default, plot the selected MA on the chart
MA Type (Short): SMA by default
MA Length (Short): 100 by default
MA Source (Short): close by default
Simple RSI Limiter:
Limit using Simple RSI: true by default, if set to 'Normal', only enter long when Simple RSI is lower then Long Boundary, and only enter short when Simple RSI is higher then Short Boundary. If set to 'Reverse', only enter long when Simple RSI is higher then Long Boundary, and only enter short when Simple RSI is lower then Short Boundary.
Simple RSI Limiter Type:
RSI Length: 14 by default
RSI Source: hl2 by default
Simple RSI Long Boundary: 50 by default
Simple RSI Short Boundary: 50 by default
ADX Limiter:
Use ADX Limiter: true by default, only enter into any position (long/short) if ADX value is higher than the Low Boundary and lower than the High Boundary.
ADX Length: 5 by default
DI Length: 5 by default
High Boundary: 50 by default
Low Boundary: 20 by default
Use MA based calculation: Yes by default, if 'Yes', only enter into position (long/short) if ADX value is higher than MA (ADX as source).
MA Type: REMA by default
MA Length: 5 by default
Volume Filter:
Only enter trades where volume is higher then the volume-based MA: true by default, a set type of MA will be calculated with the volume as source, and set length
MA Type: EMA by default
MA Length: 10 by default
Session Limiter:
Show session plots: false by default, show crypto market sessions on chart: Sidney (red), Tokyo (orange), London (yellow), New York (green)
Use session limiter: false by default, if enabled, trades will only happen in the ticked sessions below.
Sidney session: false by default, session between: 15:00 - 00:00 (EST)
Tokyo session: false by default, session between: 19:00 - 04:00 (EST)
London session: false by default, session between: 03:00 - 11:00 (EST)
New York session: false by default, session between: 08:00 - 17:00 (EST)
Date Range:
Limit Between Dates: false by default
Start Date: Jul 01 2021 00:00:00 by default
End Date: Dec 31 2022 00:00:00 by default
Trading Time:
Limit Trading Time: false by default, tick this together with the options below to enable limiting based on day and time
Valid Trading Days Global: 1234567 by default, if the Limit Trading Time is on, trades will only happen on days that are present in this field. If any of the not global Valid Trading Days is used, this field will be neglected. Values represent days: Sunday (1), Monday (2), ..., Friday (6), Saturday(7) To trade on all days use: 123457
(1) Valid Trading Days: false, 1234567 by default, values represent days: Sunday (1), Monday (2), ..., Friday (6), Saturday(7) The script will trade on days that are present in this field. Please make sure that this field and also (1) Valid Trading Hours Between is checked
(1) Valid Trading Hours Between: false, 0930-1600 by default, hours between which the trades can happen. The time is always in the exchange's timezone
Fine-tuning is highly recommended when using other asset/timeframe combinations.

Range Trading StrategyOVERVIEW
The Range Trading Strategy is a systematic trading approach that identifies price ranges
from higher timeframe candles or trading sessions, tracks pivot points, and generates
trading signals when range extremes are mitigated and confirmed by pivot levels.
CORE CONCEPT
The strategy is based on the principle that when a candle (or session) closes within the
range of the previous candle (or session), that previous candle becomes a "range" with
identifiable high and low extremes. When price breaks through these extremes, it creates
trading opportunities that are confirmed by pivot levels.
RANGE DETECTION MODES
1. HTF (Higher Timeframe) Mode:
Automatically selects a higher timeframe based on the current chart timeframe
Uses request.security() to fetch HTF candle data
Range is created when an HTF candle closes within the previous HTF candle's range
The previous HTF candle's high and low become the range extremes
2. Sessions Mode:
- Divides the trading day into 4 sessions (UTC):
* Session 1: 00:00 - 06:00 (6 hours)
* Session 2: 06:00 - 12:00 (6 hours)
* Session 3: 12:00 - 20:00 (8 hours)
* Session 4: 20:00 - 00:00 (4 hours, spans midnight)
- Tracks high, low, and close for each session
- Range is created when a session closes within the previous session's range
- The previous session's high and low become the range extremes
PIVOT DETECTION
Pivots are detected based on candle color changes (bullish/bearish transitions):
1. Pivot Low:
Created when a bullish candle appears after a bearish candle
Pivot low = minimum of the current candle's low and previous candle's low
The pivot bar is the actual bar where the low was formed (current or previous bar)
2. Pivot High:
Created when a bearish candle appears after a bullish candle
Pivot high = maximum of the current candle's high and previous candle's high
The pivot bar is the actual bar where the high was formed (current or previous bar)
IMPORTANT: There is always only ONE active pivot high and ONE active pivot low at any
given time. When a new pivot is created, it replaces the previous one.
RANGE CREATION
A range is created when:
(HTF Mode) An HTF candle closes within the previous HTF candle's range AND a new HTF
candle has just started
(Sessions Mode) A session closes within the previous session's range AND a new session
has just started
Or Range Can Be Created when the Extreme of Another Range Gets Mitigated and We Have a Pivot low Just Above the Range Low or Pivot High just Below the Range High
Range Properties:
rangeHigh: The high extreme of the range
rangeLow: The low extreme of the range
highStartTime: The timestamp when the range high was actually formed (found by looping
backwards through bars)
lowStartTime: The timestamp when the range low was actually formed (found by looping
backwards through bars)
highMitigated / lowMitigated: Flags tracking whether each extreme has been broken
isSpecial: Flag indicating if this is a "special range" (see Special Ranges section)
RANGE MITIGATION
A range extreme is considered "mitigated" when price interacts with it:
High is mitigated when: high >= rangeHigh (any interaction at or above the level)
Low is mitigated when: low <= rangeLow (any interaction at or below the level)
Mitigation can happen:
At the moment of range creation (if price is already beyond the extreme)
At any point after range creation when price touches the extreme
SIGNAL GENERATION
1. Pending Signals:
When a range extreme is mitigated, a pending signal is created:
a) BEARISH Pending Signal:
- Triggered when: rangeHigh is mitigated
- Confirmation Level: Current pivotLow
- Signal is confirmed when: close < pivotLow
- Stop Loss: Current pivotHigh (at time of confirmation)
- Entry: Short position
Signal Confirmation
b) BULLISH Pending Signal:
- Triggered when: rangeLow is mitigated
- Confirmation Level: Current pivotHigh
- Signal is confirmed when: close > pivotHigh
- Stop Loss: Current pivotLow (at time of confirmation)
- Entry: Long position
IMPORTANT: There is only ever ONE pending bearish signal and ONE pending bullish signal
at any given time. When a new pending signal is created, it replaces the previous one
of the same type.
2. Signal Confirmation:
- Bearish: Confirmed when price closes below the pivot low (confirmation level)
- Bullish: Confirmed when price closes above the pivot high (confirmation level)
- Upon confirmation, a trade is entered immediately
- The confirmation line is drawn from the pivot bar to the confirmation bar
TRADE EXECUTION
When a signal is confirmed:
1. Position Management:
- Any existing position in the opposite direction is closed first
- Then the new position is entered
2. Stop Loss:
- Bearish (Short): Stop at pivotHigh
- Bullish (Long): Stop at pivotLow
3. Take Profit:
- Calculated using Risk:Reward Ratio (default 2:1)
- Risk = Distance from entry to stop loss
- Target = Entry ± (Risk × R:R Ratio)
- Can be disabled with "Stop Loss Only" toggle
4. Trade Comments:
- "Range Bear" for short trades
- "Range Bull" for long trades
SPECIAL RANGES
Special ranges are created when:
- A range high is mitigated AND the current pivotHigh is below the range high
- A range low is mitigated AND the current pivotLow is above the range low
In these cases:
- The pivot value is stored in an array (storedPivotHighs or storedPivotLows)
- A "special range" is created with only ONE extreme:
* If pivotHigh < rangeHigh: Creates a range with rangeHigh = pivotLow, rangeLow = na
* If pivotLow > rangeLow: Creates a range with rangeLow = pivotHigh, rangeHigh = na
- Special ranges can generate signals just like normal ranges
- If a special range is mitigated on the creation bar or the next bar, it is removed
entirely without generating signals (prevents false signals)
Special Ranges
REVERSE ON STOP LOSS
When enabled, if a stop loss is hit, the strategy automatically opens a trade in the
opposite direction:
1. Long Stop Loss Hit:
- Detects when: position_size > 0 AND position_size <= 0 AND low <= longStopLoss
- Action: Opens a SHORT position
- Stop Loss: Current pivotHigh
- Trade Comment: "Reverse on Stop"
2. Short Stop Loss Hit:
- Detects when: position_size < 0 AND position_size >= 0 AND high >= shortStopLoss
- Action: Opens a LONG position
- Stop Loss: Current pivotLow
- Trade Comment: "Reverse on Stop"
The reverse trade uses the same R:R ratio and respects the "Stop Loss Only" setting.
VISUAL ELEMENTS
1. Range Lines:
- Drawn from the time when the extreme was formed to the mitigation point (or current
time if not mitigated)
- High lines: Blue (or mitigated color if mitigated)
- Low lines: Red (or mitigated color if mitigated)
- Style: SOLID
- Width: 1
2. Confirmation Lines:
- Drawn when a signal is confirmed
- Extends from the pivot bar to the confirmation bar
- Bearish: Red, solid line
- Bullish: Green, solid line
- Width: 1
- Can be toggled on/off
STRATEGY SETTINGS
1. Range Detection Mode:
- HTF: Uses higher timeframe candles
- Sessions: Uses trading session boundaries
2. Auto HTF:
- Automatically selects HTF based on current chart timeframe
- Can be disabled to use manual HTF selection
3. Risk:Reward Ratio:
- Default: 2.0 (2:1)
- Minimum: 0.5
- Step: 0.5
4. Stop Loss Only:
- When enabled: Trades only have stop loss (no take profit)
- Trades close on stop loss or when opposite signal confirms
5. Reverse on Stop Loss:
- When enabled: Hitting a stop loss opens opposite trade with stop at opposing pivot
6. Max Ranges to Display:
- Limits the number of ranges kept in memory
- Oldest ranges are purged when limit is exceeded
KEY FEATURES
1. Dynamic Pivot Tracking:
- Pivots update on every candle color change
- Always maintains one high and one low pivot
2. Range Lifecycle:
- Ranges are created when price closes within previous range
- Ranges are tracked until mitigated
- Mitigation creates pending signals
- Signals are confirmed by pivot levels
3. Signal Priority:
- Only one pending signal of each type at a time
- New signals replace old ones
- Confirmation happens on close of bar
4. Position Management:
- Closes opposite positions before entering new trades
- Tracks stop loss levels for reverse functionality
- Respects pyramiding = 1 (only one position per direction)
5. Time-Based Drawing:
- Uses time coordinates instead of bar indices for line drawing
- Prevents "too far from current bar" errors
- Lines can extend to any historical point
USAGE NOTES
- Best suited for trending and ranging markets
- Works on any timeframe, but HTF mode adapts automatically
- Sessions mode is ideal for intraday trading
- Pivot detection requires clear candle color changes
- Range detection requires price to close within previous range
- Signals are generated on bar close, not intra-bar
The strategy combines range identification, pivot tracking, and signal confirmation to
create a systematic approach to trading breakouts and reversals based on price structure, past performance does not in any way predict future performance
