ATR by Session Library [1CG]Library "ATRxSession"
This library shows you how big the bars usually are during a trading session. It looks only at the times you choose (like New York or London hours), measures the “true range” of every bar in that session, then finds the average for that session. It keeps the last N sessions and gives you their overall average, so you can quickly see how much the market typically moves per bar during your chosen session.
Call getSessionAtr(timezone, session, sessionCount) from your script, and it will return a single number: the average per-bar volatility during the chosen session, based on the last N completed sessions. This makes it easy to plug session-specific volatility into your own indicators or strategies.
getSessionAtr(_timezone, _session, _sessionCount)
getSessionAtr - Computes a session-aware ATR over completed sessions.
Parameters:
_timezone (string) : (string) - Timezone string to evaluate session timing.
_session (string) : (string) - Session time range string (e.g., "0930-1600").
_sessionCount (int) : (int) - Number of past completed sessions to include in the rolling average.
Returns: (float) - The average ATR across the last N completed sessions, or na if not enough data.
Pesquisar nos scripts por "session"

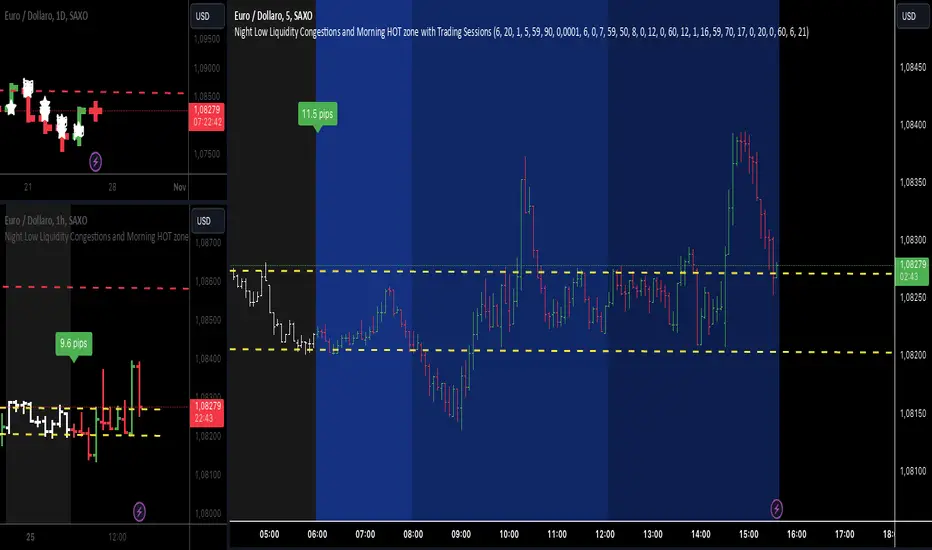
Night Low Liquidity Congestions with 4 Trading SessionsThis indicator is designed to help traders visualize and analyze key market periods of low liquidity during the night and identify high-activity zones in the morning. It also includes customizable time sessions for major global markets, including the European and American sessions, as well as the London Close session.
T he main functionalities include:
- Night Low Liquidity Phase: This highlights periods with typically low market activity during the night (default: 20:01–5:59). It also displays the total range (in pips) during this phase, allowing traders to identify potential price consolidations.
- Morning Hot Zone: This focuses on high-activity periods in the early morning (default: 6:00–7:59), providing visual cues without altering bar colors.
- European Trading Session: Displays the European market’s open hours (default: 8:00–12:00), shaded in blue, to mark increased volatility typically seen during this period.
- American Trading Session: Marks the active hours of the U.S. market (default: 12:01–16:59), where market activity tends to peak.
- London Close Area: Highlights the closing hours of the London market (default: 17:00–20:00), allowing traders to track potential liquidity shifts.
Key Features:
1. Customizable Time Sessions:
- The indicator allows for full customization of the start and end times for each market session, making it adaptable to different instruments and trading style.
- Traders can choose their preferred color and opacity for each time zone to suit their charting preferences.
2. Night Low Liquidity Pip Range Calculation:
- Automatically calculates and displays the pip range for the Night Low Liquidity phase.
- The range is colored red if it exceeds the specified threshold and green if it remains below it.
3. Alarm System:
- Customizable alerts for H1, M15, and M5 timeframes.
- Traders can set alerts to trigger just before a bar closes during specific sessions (European, American, or London Close) and on selected days of the week (Monday–Friday).
- The alarm system allows for full customization of active hours and days, giving traders full control over their notifications.
4. Clear Visual Cues:
- The indicator uses transparent shading to differentiate market sessions, making it easy to spot different phases of the trading day.
- Each session is visually distinct and can be toggled on or off based on trader preferences.
Ideal For:
- Traders who focus on intraday strategies and want to understand how market sessions affect liquidity and volatility.
- Those looking to trade during specific time windows like the Night Low Liquidity or Morning Hot Zones.
- Traders who need to automate their alerts based on specific market hours and close events for major timeframes.
ICT Killzones and Sessions W/ Silver Bullet + MacrosForex and Equity Session Tracker with Killzones, Silver Bullet, and Macro Times
This Pine Script indicator is a comprehensive timekeeping tool designed specifically for ICT traders using any time-based strategy. It helps you visualize and keep track of forex and equity session times, kill zones, macro times, and silver bullet hours.
Features:
Session and Killzone Lines:
Green: London Open (LO)
White: New York (NY)
Orange: Australian (AU)
Purple: Asian (AS)
Includes AM and PM session markers.
Dotted/Striped Lines indicate overlapping kill zones within the session timeline.
Customization Options:
Display sessions and killzones in collapsed or full view.
Hide specific sessions or killzones based on your preferences.
Customize colors, texts, and sizes.
Option to hide drawings older than the current day.
Automatic Updates:
The indicator draws all lines and boxes at the start of a new day.
Automatically adjusts time-based boxes according to the New York timezone.
Killzone Time Windows (for indices):
London KZ: 02:00 - 05:00
New York AM KZ: 07:00 - 10:00
New York PM KZ: 13:30 - 16:00
Silver Bullet Times:
03:00 - 04:00
10:00 - 11:00
14:00 - 15:00
Macro Times:
02:33 - 03:00
04:03 - 04:30
08:50 - 09:10
09:50 - 10:10
10:50 - 11:10
11:50 - 12:50
Latest Update:
January 15:
Added option to automatically change text coloring based on the chart.
Included additional optional macro times per user request:
12:50 - 13:10
13:50 - 14:15
14:50 - 15:10
15:50 - 16:15
Usage:
To maximize your experience, minimize the pane where the script is drawn. This minimizes distractions while keeping the essential time markers visible. The script is designed to help traders by clearly annotating key trading periods without overwhelming their charts.
Originality and Justification:
This indicator uniquely integrates various time-based strategies essential for ICT traders. Unlike other indicators, it consolidates session times, kill zones, macro times, and silver bullet hours into one comprehensive tool. This allows traders to have a clear and organized view of critical trading periods, facilitating better decision-making.
Credits:
This script incorporates open-source elements with significant improvements to enhance functionality and user experience.
Forex and Equity Session Tracker with Killzones, Silver Bullet, and Macro Times
This Pine Script indicator is a comprehensive timekeeping tool designed specifically for ICT traders using any time-based strategy. It helps you visualize and keep track of forex and equity session times, kill zones, macro times, and silver bullet hours.
Features:
Session and Killzone Lines:
Green: London Open (LO)
White: New York (NY)
Orange: Australian (AU)
Purple: Asian (AS)
Includes AM and PM session markers.
Dotted/Striped Lines indicate overlapping kill zones within the session timeline.
Customization Options:
Display sessions and killzones in collapsed or full view.
Hide specific sessions or killzones based on your preferences.
Customize colors, texts, and sizes.
Option to hide drawings older than the current day.
Automatic Updates:
The indicator draws all lines and boxes at the start of a new day.
Automatically adjusts time-based boxes according to the New York timezone.
Killzone Time Windows (for indices):
London KZ: 02:00 - 05:00
New York AM KZ: 07:00 - 10:00
New York PM KZ: 13:30 - 16:00
Silver Bullet Times:
03:00 - 04:00
10:00 - 11:00
14:00 - 15:00
Macro Times:
02:33 - 03:00
04:03 - 04:30
08:50 - 09:10
09:50 - 10:10
10:50 - 11:10
11:50 - 12:50
Latest Update:
January 15:
Added option to automatically change text coloring based on the chart.
Included additional optional macro times per user request:
12:50 - 13:10
13:50 - 14:15
14:50 - 15:10
15:50 - 16:15
ICT Sessions and Kill Zones
What They Are:
ICT Sessions: These are specific times during the trading day when market activity is expected to be higher, such as the London Open, New York Open, and the Asian session.
Kill Zones: These are specific time windows within these sessions where the probability of significant price movements is higher. For example, the New York AM Kill Zone is typically from 8:30 AM to 11:00 AM EST.
How to Use Them:
Identify the Session: Determine which trading session you are in (London, New York, or Asian).
Focus on Kill Zones: Within that session, focus on the kill zones for potential trade setups. For instance, during the New York session, look for setups between 8:30 AM and 11:00 AM EST.
Silver Bullets
What They Are:
Silver Bullets: These are specific, high-probability trade setups that occur within the kill zones. They are designed to be "one shot, one kill" trades, meaning they aim for precise and effective entries and exits.
How to Use Them:
Time-Based Setup: Look for these setups within the designated kill zones. For example, between 10:00 AM and 11:00 AM for the New York AM session .
Chart Analysis: Start with higher time frames like the 15-minute chart and then refine down to 5-minute and 1-minute charts to identify imbalances or specific patterns .
Macros
What They Are:
Macros: These are broader market conditions and trends that influence your trading decisions. They include understanding the overall market direction, seasonal tendencies, and the Commitment of Traders (COT) reports.
How to Use Them:
Understand Market Conditions: Be aware of the macroeconomic factors and market conditions that could affect price movements.
Seasonal Tendencies: Know the seasonal patterns that might influence the market direction.
COT Reports: Use the Commitment of Traders reports to understand the positioning of large traders and commercial hedgers .
Putting It All Together
Preparation: Understand the macro conditions and review the COT reports.
Session and Kill Zone: Identify the trading session and focus on the kill zones.
Silver Bullet Setup: Look for high-probability setups within the kill zones using refined chart analysis.
Execution: Execute the trade with precision, aiming for a "one shot, one kill" outcome.
By following these steps, you can effectively use ICT sessions, kill zones, silver bullets, and macros to enhance your trading strategy.
Usage:
To maximize your experience, shrink the pane where the script is drawn. This minimizes distractions while keeping the essential time markers visible. The script is designed to help traders by clearly annotating key trading periods without overwhelming their charts.
Originality and Justification:
This indicator uniquely integrates various time-based strategies essential for ICT traders. Unlike other indicators, it consolidates session times, kill zones, macro times, and silver bullet hours into one comprehensive tool. This allows traders to have a clear and organized view of critical trading periods, facilitating better decision-making.
Credits:
This script incorporates open-source elements with significant improvements to enhance functionality and user experience. All credit goes to itradesize for the SB + Macro boxes

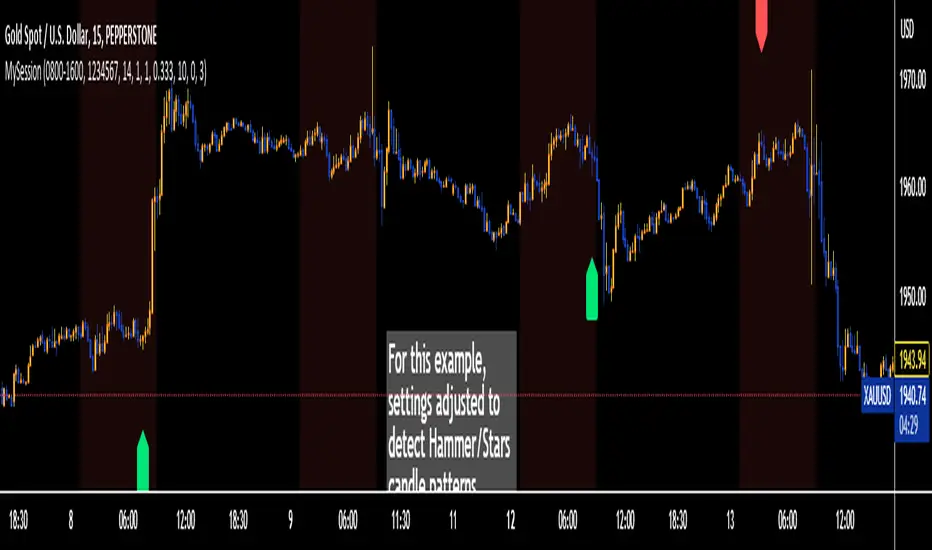
Trading Session TemplateDescription:
The Trading Session Template Indicator is a powerful script that allows traders to customize their own trading session time range on a chart. With this indicator, you have the flexibility to define specific hours during which you prefer to focus your trading activities. The example chart showcases the New York session hours, but you can easily adapt it to any desired time range based on your trading strategy and preferences.
Key Features:
Customizable Trading Session: The indicator empowers you to define your own trading session time range, tailored to your preferred market sessions or specific trading hours. This flexibility ensures that the indicator aligns with your unique trading strategy.
Highlighted Trading Session: When a new trading day begins, the script automatically scans for the specified time range. Once the first candle within the range begins printing, the background color of the chart is highlighted, indicating the beginning of the trading session. When the last candle within the range is closed, the background color returns to normal.
Focus on Specific Market Sessions: This indicator is particularly useful for traders who prefer to trade certain market sessions or specific hours during the day. By customizing the trading session, you can better align your trading activities with specific market conditions and trading opportunities.
Candle Pattern Detection: The indicator includes the ability to detect candle patterns such as Doji, Engulfing, Hammer, and Shooting Star. You can activate the desired candle patterns and set up alerts for them. When an alert is triggered, indicating the formation of a specific candle pattern, you can further analyze the market and make informed trading decisions.
ATR Filter: The indicator offers an ATR (Average True Range) filter to limit noise and focus on candle patterns with a size comparable to the ATR. You can set a minimum and maximum size for a candle compared to the ATR. This helps you filter out smaller or larger candles that may not align with your trading preferences.
Stop Loss (SL) and Take Profit (TP) Levels: When a candle pattern is detected, based on the ATR, the indicator can display suggested Stop Loss and Take Profit levels. This feature provides additional guidance for risk management and potential profit targets.
User-Friendly Interface: The indicator provides a user-friendly interface with adjustable settings and switches for customization. Tooltips are available to guide you through the various options and configurations, making it easy to adapt the indicator to your trading style and preferences.
Note:
The Trading Session Template Indicator is designed for timeframes lower than 1D. It does not plot any information on timeframes of 1D and higher.
Disclaimer:
The Trading Session Template Indicator is provided for informational and educational purposes only. Trading in the financial markets involves risk, and you should only trade with funds that you can afford to lose. The indicator's past performance is not indicative of future results. Always conduct your own research and due diligence before making any investment decisions. The creator of this indicator shall not be held responsible for any losses or damages incurred from the use of this indicator.
Intraday Pivot Highs & Lows (Asia London NY)Intraday Pivot Highs & Lows (Asia London NY)
Script Description
This TradingView indicator is optimized for Forex, scalping, intraday, and day trading strategies. It accurately plots Pivot Points and levels, high/low, support and resistance levels. These are clearly identified to aid the trader during killzone sessions and session opens. Ideal for scalp trading, intraday sessions, and leveraging SMT (Smart Money Techniques). Utilize these Price Levels effectively during London Open, NY Open, and the Asia Session, utilizing Market Structure to pinpoint key levels and reversal zones for successful trading. Improve your Trade Setups, recognize reliable Chart Patterns, identify critical Price Pivots, and trade confidently off Institutional Levels.
This script marks the intraday pivot highs, lows and midpoints retracement levels for
Asia
London
New York
It also plots the previous day's high, low, midpoint, and 0.618 Fibonacci retracement levels, providing traders with critical price reference points for making intraday trading decisions.
Originality & Usefulness
This indicator uniquely integrates pivot calculations across three major Forex sessions (Asia, London, NY), clearly delineating session boundaries.
It enhances visibility by using distinct styling
solid for New York
dashed for London
dotted lines for Asia
And colour co-ordinated labeling, improving traders' ability to identify important intraday price action zones efficiently. Unlike standard pivot indicators, this script emphasizes session-specific trading dynamics.
### Key Features ###
Session-Based Levels: Automatically plots high, low, midpoint, and Fibonacci (.618) levels for each major session (Asia, London, NY).
Distinct Visual Cues: Lines and labels use session-specific styles and colors to easily differentiate between sessions.
Previous Day Reference: Clearly plots and labels yesterday's high, low, midpoint, and Fibonacci levels.
Flexible Visibility: Traders can set timeframe visibility to maintain clean charts on higher timeframes.
### How It Works
At the start of next day's session, previous session lines are cleared, ensuring the chart remains uncluttered.
High, low, midpoint, and Fibonacci retracement levels (.618) are dynamically calculated and displayed at the close of each session.
All session levels remain visible until the start of the next respective session, providing continuous actionable insights.
Trading Application:
Session highs and lows act as strong intraday support and resistance zones.
Midpoints and Fibonacci levels are effective for identifying potential reversal zones and retracements.
Daily levels provide a broader context, useful for gauging intraday volatility and range.
### Limitations and Considerations ##
Best used on liquid assets with clear session-based price action, such as Forex major pairs, if used on indexes make sure they contain 24 hour price action not just New York session.
This indicator is designed to streamline intraday trading by clearly marking essential pivot points and session-based levels, significantly improving traders' market context and decision-making accuracy. Can be used to enhance SMT decision making when scalping killzones.

Week designationThe script is primarily used for visualizing the beginning and end of the week. It is particularly helpful when working with time intervals shorter than one day. In a very simple and clear manner, you can see when a specific week has started. This makes it easier to assess the market sentiment in a short timeframe.
Here are the operating principles of this script:
Initialization:
The script begins with initialization, where basic parameters and settings such as line colors and line style are defined.
Determining the Session Start:
The startSession(hour, minute) function is used to calculate the starting time of a session on the chart. Sessions can be divided into different time intervals, such as the daily session (D), weekly session (W), and monthly session (M).
Checking for Session Start:
The script checks if a new session is starting. If so, a vertical line is inserted on the chart to mark the beginning of that session.
isSessionStart checks for the start of the daily session.
isSessionStart_2 checks for the start of the weekly session.
isSessionStart_3 checks for the start of the monthly session.
Marking Mondays:
The script checks if the current day is Monday (the day of the week number 2 represents Monday).
If the current session is starting or it is Monday, a vertical line is inserted on the chart with the day designation (color color_day).
Marking Lines on the Chart:
The lines inserted on the chart are vertical and have a specified style and color, which can be customized in the settings.

Four Trading SessionsIve adapted this from someone else's script to include 4 sessions instead of 3
TradingView Indicator Description: Trading Sessions
Overview:
The "Trading Sessions" indicator, written in Pine Script v5, visually highlights major forex trading sessions (Tokyo, London, New York, and Sydney) on intraday charts. It displays session ranges as colored boxes, with optional open/close lines, average price lines, and labels showing session names, tick ranges, and average prices. Users can customize session times, time zones, colors, and display options.
Key Features:
Customizable Sessions: Supports up to four trading sessions (Tokyo, London, New York, Sydney) with user-defined names, time ranges, and time zones (e.g., "Asia/Tokyo", "America/New_York").
Visual Elements:
Draws semi-transparent boxes to mark session price ranges (high/low).
Optional dashed lines for session open and close prices.
Optional dotted line for the session's average price.
Labels displaying session name, tick range, and/or average price (configurable).
Time Zone Support: Specify time zones using IANA database names (e.g., "Australia/Sydney") or GMT notation, with a recommendation for IANA to handle daylight savings.
Display Options: Toggle session names, open/close lines, tick range, and average price visibility.
Intraday Restriction: Works only on intraday timeframes, with an error for daily/weekly/monthly charts.
Performance Optimized: Limits boxes, lines, and labels to 500 each to ensure smooth performance.
Inputs:
General Settings:
Show session names, open/close lines, tick range, and average price (all enabled by default).
Per Session (Tokyo, London, New York, Sydney):
Enable/disable session display.
Custom session name (e.g., "Tokyo").
Session time range (e.g., "0900-1500" for Tokyo).
Time zone (e.g., "Asia/Tokyo").
Session color (semi-transparent blue, orange, green, purple by default).
How It Works:
The script checks if the current bar falls within a session’s time range (adjusted for the specified time zone).
For each active session, it creates a box spanning the session’s high/low and updates it bar-by-bar.
Optional open/close lines and an average price line are drawn and updated dynamically.
Labels display user-selected metrics (name, range, average price) at the bottom of each session box.
Sessions reset daily, ensuring accurate representation across days.
Use Case:
Ideal for forex traders who want to analyze price action during specific trading sessions. The indicator helps identify session-specific volatility, key price levels, and trends, with clear visual cues and customizable settings.
Limitations:
Only works on intraday timeframes.
Limited to 500 boxes, lines, and labels to prevent performance issues.
Requires accurate time zone settings for proper session alignment.
Example:
Enable the Tokyo and New York sessions, set their respective time zones, and toggle on all display options to see colored boxes, open/close lines, average price lines, and labels with tick ranges and averages for each session.

J&A Sessions & NewsProject J&A: Session Ranges is a precision-engineered tool designed for professional traders who operate based on Time & Price. Unlike standard session indicators that clutter the chart with background colors, this tool focuses on Dynamic Price Ranges to help you visualize the Highs, Lows, and liquidity pools of each session.
It is pre-configured for Frankfurt Time (Europe/Berlin) but is fully customizable for any global location.
Key Features
1. Dynamic Session Ranges (The Boxes) Instead of vertical stripes, this indicator draws Boxes that encapsulate the entire price action of a session.
Real-Time Tracking: The box automatically expands to capture the Highest High and Lowest Low of the current session.
Visual Clarity: Instantly see the trading range of Asia, London, and New York to identify breakouts or range-bound conditions.
2. The "Lunch Break" Logic (Unique Feature) Institutional volume often dies down during lunch hours. This indicator allows you to Split the Session to account for these breaks.
Enabled: The script draws two separate boxes (Morning Session vs. Afternoon Session), allowing you to see fresh ranges after the lunch accumulation.
Disabled: The script draws one continuous box for the full session.
3. Manual High-Impact News Scheduler Never get caught on the wrong side of a spike. Since TradingView scripts cannot access live calendars, this tool includes a Manual Scheduler for risk management.
Input: Simply input the time of high-impact events (e.g., CPI, NFP) from ForexFactory into the settings.
Visual: A dashed line appears on the chart at the exact news time.
Audio Alert: The system triggers an alarm 10 minutes before the event, giving you time to manage positions or exit trades.
Default Configuration (Frankfurt Time)
Asian Session: 01:00 - 10:00 (Lunch disabled)
London Session: 09:00 - 17:30 (Lunch: 12:00-13:00)
New York Session: 14:00 - 22:00 (Lunch: 18:00-19:00)
How to Use
Setup: Apply the indicator. The default timezone is Europe/Berlin. If you live elsewhere, simply change the "Your Timezone" setting to your local time (e.g., America/New_York), and the boxes will align automatically.
Daily Routine: Check the economic calendar in the morning. If there is a "Red Folder" event at 14:30, open the indicator settings and enter 14:30 into the News Scheduler.
Trade: Use the Session Highs and Lows as liquidity targets or breakout levels.
Settings & Customization
Timezone: Full support for major global trading hubs.
Colors: Customize the Box fill and Border colors for every session.
Labels: Rename sessions (e.g., "Tokyo" instead of "Asia") via the settings menu.

Previous session High/Low – Asia London USA Overview
This indicator automatically plots the Previous Day’s (PD) session Highs and Lows for the Asia (Tokyo), London, and USA (New York) trading sessions.
Each session is color-coded for clarity:
🟩 Asia (Green)
🟥 London (Red)
🟦 USA (Blue)
At the close of each session, the indicator records that session’s high and low, draws horizontal lines across the chart, and labels them neatly in the center of each range — above the high and below the low for perfect visual balance.
⚙️ How It Works
The script continuously tracks the current high and low within each session.
When a session closes, those values are locked in as the PD High and PD Low.
Clean lines and centered labels are drawn immediately.
The labels automatically offset slightly above or below the line to avoid overlap, with user-controlled spacing.
This helps traders quickly identify where price interacts with the previous session’s structure, a core concept for many session-based and liquidity-based strategies.
🧭 Sessions and Timezones
Each market session runs in its native timezone, so you can align them perfectly to your chart or your preferred trading hours:
Asia Session: Default 08:30 – 11:00 (Australia/Adelaide time)
London Session: Default 08:00 – 10:00 (Europe/London)
USA Session: Default 09:30 – 16:00 (America/New_York)
You can change each session’s hours and timezone from the Inputs panel.
🎨 Customization
In the Inputs menu you can:
Toggle each session on or off
Choose line color and thickness
Enable or disable labels
Adjust vertical offset (ticks) for label spacing
“High label offset” – moves label further above the high line
“Low label offset” – moves label further below the low line
These adjustments make it easy to keep charts clean and readable on any instrument or timeframe.
📈 Practical Use
This indicator is ideal for:
Session traders who mark PD Highs/Lows as liquidity zones
London or NY session scalpers who watch for breakouts, fakeouts, or reversals
ICT / Smart Money Concepts users wanting automatic session reference levels
Anyone wanting a quick visual map of inter-session structure

Casa_SessionsLibrary "Casa_Sessions"
Advanced trading session management library that enhances TradingView's default functionality:
Key Features:
- Accurate session detection for futures markets
- Custom session hour definitions
- Drop-in replacements for standard TradingView session functions
- Flexible session map customization
- Full control over trading windows and market hours
Perfect for traders who need precise session timing, especially when working
with futures markets or custom trading schedules.
SetSessionTimes(session_type_input, custom_session_times_input, syminfo_type, syminfo_root, syminfo_timezone)
Parameters:
session_type_input (simple string) : Input string for session selection:
- 'Custom': User-defined session times
- 'FX-Tokyo': Tokyo forex session
- 'FX-London': London forex session
- 'FX-New York': NY forex session
- 'Overnight Session (ON)': After-hours trading
- 'Day Session (RTH)': Regular trading hours
custom_session_times_input (simple string) : Session parameter for custom time windows
Only used when session_type_input is 'Custom'
syminfo_type (simple string)
syminfo_root (simple string)
syminfo_timezone (simple string)
Returns:
session_times: Trading hours for selected session
session_timezone: Market timezone (relevant for forex)
getSessionMap()
Get futures trading session hours map
Keys are formatted as 'symbol:session', examples:
- 'ES:market' - Regular trading hours (RTH)
- 'ES:overnight' - Extended trading hours (ETH)
- 'NQ:market' - NASDAQ futures RTH
- 'CL:overnight' - Crude Oil futures ETH
Returns: Map
Key: Symbol:session identifier
Value: Session hours in format "HH:MM-HH:MM"
getSessionString(session, symbol, sessionMap)
Returns a session string representing the session hours (and days) for the requested symbol (or the chart's symbol if the symbol value is not provided). If the session string is not found in the collection, it will return a blank string.
Parameters:
session (string) : A string representing the session hour being requested. One of: market (regular trading hours), overnight (extended/electronic trading hours), postmarket (after-hours), premarket
symbol (string) : The symbol to check. Optional. Defaults to chart symbol.
sessionMap (map) : The map of futures session hours. Optional. Uses default if not provided.
inSession(session, sessionMap, barsBack)
Returns true if the current symbol is currently in the session parameters defined by sessionString.
Parameters:
session (string) : A string representing the session hour being requested. One of: market (regular trading hours), overnight (extended/electronic trading hours), postmarket (after-hours), premarket
sessionMap (map) : The map of futures session hours. Optional. Uses default if not provided.
barsBack (int) : Private. Only used by futures to check islastbar. Optional. The default is 0.
ismarket(sessionMap)
Returns true if the current bar is a part of the regular trading hours (i.e. market hours), false otherwise. Works for futures (TradingView's methods do not).
Parameters:
sessionMap (map) : The map of futures session hours. Optional. Uses default if not provided.
Returns: bool
isfirstbar()
Returns true if the current bar is the first bar of the day's session, false otherwise. If extended session information is used, only returns true on the first bar of the pre-market bars. Works for futures (TradingView's methods do not).
Returns: bool
islastbar()
Returns true if the current bar is the last bar of the day's session, false otherwise. If extended session information is used, only returns true on the last bar of the post-market bars. Works for futures (TradingView's methods do not).
Returns: bool
ispremarket(sessionMap)
Returns true if the current bar is a part of the pre-market, false otherwise. On non-intraday charts always returns false. Works for futures (TradingView's methods do not).
Parameters:
sessionMap (map) : The map of futures session hours. Optional. Uses default if not provided.
Returns: bool
ispostmarket(sessionMap)
Returns true if the current bar is a part of the post-market, false otherwise. On non-intraday charts always returns false. Works for futures (TradingView's methods do not).
Parameters:
sessionMap (map) : The map of futures session hours. Optional. Uses default if not provided.
Returns: bool
isfirstbar_regular(sessionMap)
Returns true on the first regular session bar of the day, false otherwise. The result is the same whether extended session information is used or not. Works for futures (TradingView's methods do not).
Parameters:
sessionMap (map) : The map of futures session hours. Optional. Uses default if not provided.
Returns: bool
islastbar_regular(sessionMap)
Returns true on the last regular session bar of the day, false otherwise. The result is the same whether extended session information is used or not. Works for futures (TradingView's methods do not).
Parameters:
sessionMap (map) : The map of futures session hours. Optional. Uses default if not provided.
Returns: bool
isovernight(sessionMap)
Returns true if the current bar is a part of the pre-market or post-market, false otherwise. On non-intraday charts always returns false.
Parameters:
sessionMap (map) : The map of futures session hours. Optional. Uses default if not provided.
Returns: bool
getSessionHighAndLow(session, sessionMap)
Returns a tuple containing the high and low print during the specified session.
Parameters:
session (string) : The session for which to get the high & low prints. Defaults to market.
sessionMap (map) : The map of futures session hours. Optional. Uses default if not provided.
Returns: A tuple containing
getSessionHigh(session, sessionMap)
Convenience function to return the session high. Necessary if you want to call this function from within a request.security expression where you can't return a tuple.
Parameters:
session (string) : The session for which to get the high & low prints. Defaults to market.
sessionMap (map) : The map of futures session hours. Optional. Uses default if not provided.
Returns: The high of the session
getSessionLow(session, sessionMap)
Convenience function to return the session low. Necessary if you want to call this function from within a request.security expression where you can't return a tuple.
Parameters:
session (string) : The session for which to get the high & low prints. Defaults to market.
sessionMap (map) : The map of futures session hours. Optional. Uses default if not provided.
Returns: The low of the session

AllDay Session TimesIndicator: Custom Session Times
This indicator is designed to assist traders by visualizing specific trading session times on the TradingView platform. It highlights two important trading sessions: the Day Session and the Evening Session, providing a visual aid that helps traders navigate the markets with greater accuracy.
Day Session Time Range:
Starts: 10:55 UTC+2
Ends: 13:30 UTC+2
Evening Session Time Range:
Starts: 16:55 UTC+2
Ends: 18:30 UTC+2
How It Works:
Colors and Backgrounds: This indicator uses background colors to differentiate the sessions. The green background appears during the Day Session, while the blue background indicates the Evening Session.
Lines: Session time ranges are also marked with clear lines on the chart, making it easier to identify the specific session periods.
Time Zone: The time zone is set to UTC+2 (Europe/Helsinki), but it can easily be adjusted to match your local time zone.
Why Use This Indicator?
This indicator is especially useful for traders who focus on specific market sessions. For example:
The Day Session might be when the market is more active, and trends are clearer.
The Evening Session could be a good time to observe market adjustments based on the events of the day and find potential trading opportunities.
By visualizing these specific time frames, the indicator helps reduce distractions and enables a more focused approach to trading.
Use Cases:
This indicator is ideal for:
Day traders and swing traders who want to focus on certain market sessions.
Technical analysts who prefer to visualize market behavior within specific time frames.
Strategy optimization and a more precise assessment of market conditions.
Features:
Visual session markers that help traders focus on key trading periods.
Easy customization of time zone and session time ranges.
Background colors and lines that improve chart readability and session tracking.
Made By AllDayEsa

RCV Essentials════════════════════════════════════════════
RCV ESSENTIALS - MULTI-TIMEFRAME & SESSION ANALYSIS TOOL
════════════════════════════════════════════
📊 WHAT THIS INDICATOR DOES
This professional-grade indicator combines two powerful analysis modules:
1. TRADING SESSION TRACKER - Visualizes high/low ranges for major global market sessions (NY Open, London Open, Asian Session, etc.)
2. MULTI-TIMEFRAME CANDLE DISPLAY - Shows up to 8 higher timeframes simultaneously on your chart (15m, 30m, 1H, 4H, 1D, 1W, 1M, 3M)
════════════════════════════════════════════
🎯 KEY FEATURES
════════════════════════════════════════════
TRADING SESSIONS MODULE:
✓ Track up to 6 custom trading sessions simultaneously
✓ Real-time high/low range detection during active sessions
✓ Pre-configured for NYO (7-9am), LNO (2-3am), Asian Session (4:30pm-12am)
✓ 60+ global timezone options
✓ Customizable colors, labels, and transparency
✓ Daily divider lines (optional Sunday skip for traditional markets)
✓ Only displays on ≤30m timeframes for optimal clarity
MULTI-TIMEFRAME CANDLES MODULE:
✓ Display 1-8 higher timeframes with up to 10 candles each
✓ Real-time candle updates (non-repainting)
✓ Fully customizable colors (separate bullish/bearish for body/border/wick)
✓ Adjustable candle width, spacing, and positioning
✓ Smart label system (top/bottom/both, aligned or follow candles)
✓ Automatic timeframe validation (only shows TFs higher than chart)
✓ Memory-optimized with automatic cleanup
════════════════════════════════════════════
🔧 HOW IT WORKS
════════════════════════════════════════════
TECHNICAL IMPLEMENTATION:
Session Tracking Algorithm:
• Detects session start/end using time() function with timezone support
• Continuously monitors and updates high/low during active session
• Finalizes range when session ends using var persistence
• Draws boxes using real-time bar_index positioning
• Maintains session ranges across multiple days for reference
Multi-Timeframe System:
• Uses ta.change(time()) detection to identify new MTF candle formation
• Constructs candles using custom Type definitions (Candle, CandleSet, Config)
• Stores OHLC data in arrays with automatic size management
• Renders using box objects (bodies) and line objects (wicks)
• Updates current candle every tick; historical candles remain static
• Calculates dynamic positioning based on user settings (offset, spacing, width)
Object-Oriented Architecture:
• Custom Type "Candle" - Stores OHLC values, timestamps, visual elements
• Custom Type "CandleSet" - Manages arrays of candles + settings per timeframe
• Custom Type "Config" - Centralizes all display configuration
• Efficient memory management via unshift() for new candles, pop() for old
Performance Optimizations:
• var declarations minimize recalculation overhead
• Conditional execution (sessions only on short timeframes)
• Maximum display limits prevent excessive object creation
• Timeframe validation at barstate.isfirst reduces redundant checks
════════════════════════════════════════════
📈 HOW TO USE
════════════════════════════════════════════
SETUP:
1. Add indicator to chart (works best on 1m-30m timeframes)
2. Open Settings → "Trading Sessions" group
- Enable desired sessions (NYO, LNO, AS, or custom)
- Select your timezone from 60+ options
- Adjust colors and transparency
3. Open Settings → "Multi-TF Candles" group
- Enable timeframes (TF1-TF8)
- Configure each timeframe and display count
- Customize colors and layout
READING THE CHART:
• Session boxes show high/low ranges during active sessions
• MTF candles display to the right of current price
• Labels identify each timeframe (15m, 1H, 4H, etc.)
• Real-time updates on the most recent MTF candle
TRADING APPLICATIONS:
Session Breakout Strategy:
→ Identify session high/low (e.g., Asian session 16:30-00:00)
→ Wait for break above/below range
→ Confirm with higher timeframe candle close
→ Enter in breakout direction, stop at opposite side of range
Multi-Timeframe Confirmation:
→ Spot setup on primary chart (e.g., 5m)
→ Verify 15m, 1H, 4H candles align with trade direction
→ Only take trades where higher TFs confirm
→ Exit when higher TF candles show reversal
Combined Session + MTF:
→ Asian session establishes range overnight
→ London Open breaks Asian high
→ Confirm with bullish 15m + 1H candles
→ Enter long with stop below Asian high
════════════════════════════════════════════
🎨 ORIGINALITY & INNOVATION
════════════════════════════════════════════
What makes this indicator original:
1. INTEGRATED DUAL-MODULE DESIGN
Unlike separate session or MTF indicators, this combines both in a single performance-optimized script, enabling powerful correlation analysis between session behavior and timeframe structure.
2. ADVANCED RENDERING SYSTEM
Uses custom Pine Script v5 Types with dynamic box/line object management instead of basic plot functions. This enables:
• Precise visual control over positioning and spacing
• Real-time updates without repainting
• Efficient memory handling via automatic cleanup
• Support for 8 simultaneous timeframes with independent settings
3. INTELLIGENT SESSION TRACKING
The algorithm continuously recalculates ranges bar-by-bar during active sessions, then preserves the final range. This differs from static zone indicators that simply draw fixed boxes at predefined levels.
4. MODULAR ARCHITECTURE
Custom Type definitions (Candle, CandleSet, Config) create extensible, maintainable code structure while supporting complex multi-timeframe operations with minimal performance impact.
5. PROFESSIONAL FLEXIBILITY
Extensive customization: 6 configurable sessions, 8 timeframe slots, 60+ timezones, granular color/sizing/spacing controls, multiple label positioning modes—adaptable to any market or trading style.
6. SMART VISUAL DESIGN
Automatic timeframe validation, dynamic label alignment options, and intelligent spacing calculations ensure clarity even with multiple timeframes displayed simultaneously.
════════════════════════════════════════════
⚙️ CONFIGURATION OPTIONS
════════════════════════════════════════════
TRADING SESSIONS:
• Session 1-6: On/Off toggles
• Time Ranges: Custom start-end times
• Labels: Custom text for each session
• Colors: Individual color per session
• Timezone: 60+ options (Americas, Europe, Asia, Pacific, Africa)
• Range Transparency: 0-100%
• Outline: Optional border
• Label Display: Show/hide session names
• Daily Divider: Dotted lines at day changes
• Skip Sunday: For traditional markets vs 24/7 crypto
MULTI-TF CANDLES:
• Timeframes 1-8: Enable/disable individually
• Timeframe Selection: Any TF (seconds to months)
• Display Count: 1-10 candles per timeframe
• Bullish Colors: Body/Border/Wick (independent)
• Bearish Colors: Body/Border/Wick (independent)
• Candle Width: 1-10+ bars
• Right Margin: 0-200+ bars from edge
• TF Spacing: Gap between timeframe groups
• Label Color: Any color
• Label Size: Tiny/Small/Normal/Large/Huge
• Label Position: Top/Bottom/Both
• Label Alignment: Follow Candles or Align
════════════════════════════════════════════
📋 TECHNICAL SPECIFICATIONS
════════════════════════════════════════════
• Pine Script Version: v5
• Chart Overlay: True
• Max Boxes: 500
• Max Lines: 500
• Max Labels: 500
• Max Bars Back: 5000
• Update Frequency: Real-time (every tick)
• Timeframe Compatibility: Chart TF must be lower than selected MTFs
• Session Display: Activates only on ≤30 minute timeframes
• Memory Management: Automatic cleanup via array operations

Relative Performance Areas [LuxAlgo]The Relative Performance Areas tool enables traders to analyze the relative performance of any asset against a user-selected benchmark directly on the chart, session by session.
The tool features three display modes for rescaled benchmark prices, as well as a statistics panel providing relevant information about overperforming and underperforming streaks.
🔶 USAGE
Usage is straightforward. Each session is highlighted with an area displaying the asset price range. By default, a green background is displayed when the asset outperforms the benchmark for the session. A red background is displayed if the asset underperforms the benchmark.
The benchmark is displayed as a green or red line. An extended price area is displayed when the benchmark exceeds the asset price and is set to SPX by default, but traders can choose any ticker from the settings panel.
Using benchmarks to compare performance is a common practice in trading and investing. Using indexes such as the S&P 500 (SPX) or the NASDAQ 100 (NDX) to measure our portfolio's performance provides a clear indication of whether our returns are above or below the broad market.
As the previous chart shows, if we have a long position in the NASDAQ 100 and buy an ETF like QQQ, we can clearly see how this position performs against BTSUSD and GOLD in each session.
Over the last 15 sessions, the NASDAQ 100 outperformed the BTSUSD in eight sessions and the GOLD in six sessions. Conversely, it underperformed the BTCUSD in seven sessions and the GOLD in nine sessions.
🔹 Display Mode
The display mode options in the Settings panel determine how benchmark performance is calculated. There are three display modes for the benchmark:
Net Returns: Uses the raw net returns of the benchmark from the start of the session.
Rescaled Returns: Uses the benchmark net returns multiplied by the ratio of the benchmark net returns standard deviation to the asset net returns standard deviation.
Standardized Returns: Uses the z-score of the benchmark returns multiplied by the standard deviation of the asset returns.
Comparing net returns between an asset and a benchmark provides traders with a broad view of relative performance and is straightforward.
When traders want a better comparison, they can use rescaled returns. This option scales the benchmark performance using the asset's volatility, providing a fairer comparison.
Standardized returns are the most sophisticated approach. They calculate the z-score of the benchmark returns to determine how many standard deviations they are from the mean. Then, they scale that number using the asset volatility, which is measured by the asset returns standard deviation.
As the chart above shows, different display modes produce different results. All of these methods are useful for making comparisons and accounting for different factors.
🔹 Dashboard
The statistics dashboard is a great addition that allows traders to gain a deep understanding of the relationship between assets and benchmarks.
First, we have raw data on overperforming and underperforming sessions. This shows how many sessions the asset performance at the end of the session was above or below the benchmark.
Next, we have the streaks statistics. We define a streak as two or more consecutive sessions where the asset overperformed or underperformed the benchmark.
Here, we have the number of winning and losing streaks (winning means overperforming and losing means underperforming), the median duration of each streak in sessions, the mode (the number of sessions that occurs most frequently), and the percentages of streaks with durations equal to or greater than three, four, five, and six sessions.
As the image shows, these statistics are useful for traders to better understand the relative behavior of different assets.
🔶 SETTINGS
Benchmark: Benchmark for comparison
Display Mode: Choose how to display the benchmark; Net Returns: Uses the raw net returns of the benchmark. Rescaled Returns: Uses the benchmark net returns multiplied by the ratio of the benchmark and asset standard deviations. Standardized Returns: Uses the benchmark z-score multiplied by the asset standard deviation.
🔹 Dashboard
Dashboard: Enable or disable the dashboard.
Position: Select the location of the dashboard.
Size: Select the dashboard size.
🔹 Style
Overperforming: Enable or disable displaying overperforming sessions and choose a color.
Underperforming: Enable or disable displaying underperforming sessions and choose a color.
Benchmark: Enable or disable displaying the benchmark and choose colors.

European and American Trading Sessions (Blue)The European and American trading sessions, in particular, are known for their volatility and volume, making them key periods for traders to watch.
This Pine Script indicator, "European and American Trading Sessions," helps traders visually distinguish these sessions directly on their charts by shading the background during active hours. We use this indicator in combination with the one that highlights the nighttime phases in white.
Here's a breakdown of how the indicator works:
Key Features of the Script:
Timezone Configuration:
The script allows users to select a timezone from a predefined list that includes UTC, London, Rome, New York, and Tokyo. This flexibility ensures that the session times are accurately displayed regardless of the server or local time of the user.
European Session Parameters:
Users can set the start and end times for the European session. By default, the session runs from 08:00 to 12:00, but the input options make it customizable down to the minute. The European session is highlighted with a light blue background (36% opacity) to avoid overwhelming the chart while still providing a clear visual cue.
American Session Parameters:
Similar to the European session, the American session can be customized. The default times are set from 12:01 to 20:59. This session is highlighted in a slightly darker blue (80% opacity), providing a distinct visual difference from the European session.
Session Timing Calculation:
The script calculates the start and end times for each session based on the selected timezone. It uses the timestamp() function to account for year, month, day, hour, and minute, ensuring that session timings are accurately applied to each day’s trading activity.
Background Highlighting:
Once the session times are defined, the script checks if the current chart time (time) falls within the European or American trading session. If the condition is true, the corresponding background color is applied, visually highlighting the active session directly on the chart. This feature makes it easy to identify when the European or American markets are in play.
Benefits for Traders:
Clear Session Visibility: The color-coded background makes it effortless for traders to identify when key trading sessions are active without needing to constantly check the clock.
Customizable to Your Needs:
With full control over the start and end times for both sessions, traders can adapt the indicator to fit their specific trading hours or preferences.
Timezone Flexibility:
No matter where you're trading from, the ability to set the timezone ensures that the sessions are displayed correctly according to your local time.
Explanation of the Code:
Timezone Selection:
Allows the user to select a timezone from predefined options such as Europe/Rome, America/New_York, etc. This timezone will be used to calculate session start and end times.
Session Timing Inputs:
The script takes user inputs for the start and end times of the European and American trading sessions. These inputs include the hour and minute for both sessions.
Colors:
The color of the European session is set to a blue shade with 36% opacity.
The American session is also colored blue but with a higher opacity of 80%.
Timestamp Calculation:
The timestamp() function converts the input hours and minutes into a time value, accounting for the selected timezone.
Session Conditions:
The script checks if the current time (time) falls within the European or American session. If true, it applies the respective background color for that session. This approach creates clear visual highlights on the chart, marking the active hours of the European and American trading sessions based on user inputs.
Outside Candle Session Breakout [CHE]Outside Candle Session Breakout
Session - anchored HTF levels for clear market-structure and precise breakout context
Summary
This indicator is a relevant market-structure tool. It anchors the session to the first higher-timeframe bar, then activates only when the second bar forms an outside condition. Price frequently reacts around these anchors, which provides precise breakout context and a clear overview on both lower and higher timeframes. Robustness comes from close-based validation, an adaptive volatility and tick buffer, first-touch enforcement, optional retest, one-signal-per-session, cooldown, and an optional trend filter.
Pine version: v6. Overlay: true.
Motivation: Why this design?
Short-term breakout tools often trigger during noise, duplicate within the same session, or drift when volatility shifts. The core idea is to gate signals behind a meaningful structure event: a first-bar anchor and a subsequent outside bar on the session timeframe. This narrows attention to structurally important breaks while adaptive buffering and debouncing reduce false or mid-run triggers.
What’s different vs. standard approaches?
Baseline: Simple high-low breaks or fixed buffers without session context.
Architecture: Session-anchored first-bar high/low; outside-bar gate; close-based confirmation with an adaptive ATR and tick buffer; first-touch enforcement; optional retest window; one-signal-per-session and cooldown; optional EMA trend and slope filter; higher-timeframe aggregation with lookahead disabled; themeable visuals and a range fill between levels.
Practical effect: Cleaner timing at structurally relevant levels, fewer redundant or late triggers, and better multi-timeframe situational awareness.
How it works (technical)
The chart timeframe is mapped to an analysis timeframe and a session timeframe.
The first session bar defines the anchor high and low. The setup becomes active only after the next bar forms an outside range relative to that first bar.
While active, the script tracks these anchors and checks for a breakout beyond a buffered threshold, using closing prices or wicks by preference.
The buffer scales with volatility and is limited by a minimum tick floor. First-touch enforcement avoids mid-run confirmations.
Optional retest requires a pullback to the raw anchor followed by a new close beyond the buffered level within a user window.
Optional trend gating uses an EMA on the analysis timeframe, including an optional slope requirement and price-location check.
Higher-timeframe data is requested with lookahead disabled. Values can update during a forming higher-timeframe bar; waiting and confirmation mitigate timing shifts.
Parameter Guide
Enable Long / Enable Short — Direction toggles. Default: true / true. Reduces unwanted side.
Wait Candles — Minimum bars after outside confirmation before entries. Default: five. More waiting increases stability.
Close-based Breakout — Confirm on candle close beyond buffer. Default: true. For wick sensitivity, disable.
ATR Buffer — Enables adaptive volatility buffer. Default: true.
ATR Multiplier — Buffer scaling. Default: zero point two. Increase to reduce noise.
Ticks Buffer — Minimum buffer in ticks. Default: two. Protects in quiet markets.
Cooldown Bars — Blocks new signals after a trigger. Default: three.
One Signal per Session — Prevents duplicates within a session. Default: true.
Require Retest — Pullback to raw anchor before confirming. Default: false.
Retest Window — Bars allowed for retest completion. Default: five.
HTF Trend Filter — EMA-based gating. Default: false.
EMA Length — EMA period. Default: two hundred.
Slope — Require EMA slope direction. Default: true.
Price Above/Below EMA — Require price location relative to EMA. Default: true.
Show Levels / Highlight Session / Show Signals — Visual controls. Default: true.
Color Theme — “Blue-Green” (default), “Monochrome”, “Earth Tones”, “Classic”, “Dark”.
Time Period Box — Visibility, size, position, and colors for the info box. (Optional)
Reading & Interpretation
The two level lines represent the session’s first-bar high and low. The filled band illustrates the active session range.
“OUT” marks that the outside condition is confirmed and the setup is live.
“LONG” or “SHORT” appears only when the breakout clears buffer, debounce, and optional gates.
Background tint indicates sessions where the setup is valid.
Alerts fire on confirmed long or short breakout events.
Practical Workflows & Combinations
Trend-following: Keep close-based validation, ATR buffer near the default, one-signal-per-session enabled; add EMA trend and slope for directional bias.
Retest confirmation: Enable retest with a short window to prioritize cleaner continuation after a pullback.
Lower-timeframe scalping: Reduce waiting and cooldown slightly; keep a small tick buffer to filter micro-whips.
Swing and position context: Increase ATR multiplier and waiting; maintain once-per-session to limit duplicates.
Timeframe Tiers and Trader Profiles
The script adapts its internal mapping based on the chart timeframe:
Under fifteen minutes → Analysis: one minute; Session: sixty minutes. Useful for scalpers and high-frequency intraday reads.
Between fifteen and under sixty minutes → Analysis: fifteen minutes; Session: one day. Suits day traders who need intraday alignment to the daily session.
Between sixty minutes and under one day → Analysis: sixty minutes; Session: one week. Serves intraday-to-swing transitions and end-of-day planning.
Between one day and under one week → Analysis: two hundred forty minutes; Session: two weeks. Fits swing traders who monitor multi-day structure.
Between one week and under thirty days → Analysis: one day; Session: three months. Supports position traders seeking quarterly context.
Thirty days and above → Analysis: one day; Session: twelve months. Provides a broad annual anchor for macro context.
These tiers are designed to keep anchors meaningful across regimes while preserving responsiveness appropriate to the trader profile.
Behavior, Constraints & Performance
Signals can be validated on closed bars through close-based logic; enabling this reduces intrabar flicker.
Higher-timeframe values may evolve during a forming bar; waiting parameters and the outside-bar gate reduce, but do not remove, this effect.
Resource footprint is light; the script uses standard indicators and a single higher-timeframe request per stream.
Known limits: rare setups during very quiet periods, sensitivity to gaps, and reduced reliability on illiquid symbols.
Sensible Defaults & Quick Tuning
Start with close-based validation on, ATR buffer on with a multiplier near zero point two, tick buffer two, cooldown three, once-per-session on.
Too many flips: increase the ATR multiplier and cooldown; consider enabling the EMA filter and slope.
Too sluggish: reduce the ATR multiplier and waiting; disable retest.
Choppy conditions: keep close-based validation, increase tick buffer, shorten the retest window.
What this indicator is—and isn’t
This is a visualization and signal layer for session-anchored breakouts with stability gates. It is not a complete trading system, risk framework, or predictive engine. Combine it with structured analysis, position sizing, and disciplined risk controls.
Disclaimer
The content provided, including all code and materials, is strictly for educational and informational purposes only. It is not intended as, and should not be interpreted as, financial advice, a recommendation to buy or sell any financial instrument, or an offer of any financial product or service. All strategies, tools, and examples discussed are provided for illustrative purposes to demonstrate coding techniques and the functionality of Pine Script within a trading context.
Any results from strategies or tools provided are hypothetical, and past performance is not indicative of future results. Trading and investing involve high risk, including the potential loss of principal, and may not be suitable for all individuals. Before making any trading decisions, please consult with a qualified financial professional to understand the risks involved.
By using this script, you acknowledge and agree that any trading decisions are made solely at your discretion and risk.
Do not use this indicator on Heikin-Ashi, Renko, Kagi, Point-and-Figure, or Range charts, as these chart types can produce unrealistic results for signal markers and alerts.
Best regards and happy trading
Chervolino

ICT Silver Bullet [LuxAlgo]The ICT Silver Bullet indicator is inspired from the lectures of "The Inner Circle Trader" (ICT) and highlights the Silver Bullet (SB) window which is a specific 1-hour interval where a Fair Value Gap (FVG) pattern can be formed.
When a FVG is formed during the Silver Bullet window, Support & Resistance lines will be drawn at the end of the SB session.
There are 3 different Silver Bullet windows (New York local time):
The London Open Silver Bullet (3 AM — 4 AM ~ 03:00 — 04:00)
The AM Session Silver Bullet (10 AM — 11 AM ~ 10:00 — 11:00)
The PM Session Silver Bullet (2 PM — 3 PM ~ 14:00 — 15:00)
🔶 USAGE
The ICT Silver Bullet indicator aims to provide users a comprehensive display as similar as possible to how anyone would manually draw the concept on their charts.
It's important to use anything below the 15-minute timeframe to ensure proper setups can display. In this section, we are purely using the 3-minute timeframe.
In the image below, we can see a bullish setup whereas a FVG was successfully retested during the Silver Bullet session. This was then followed by a move upwards to liquidity as our target.
Alternatively, you can also see below a bearish setup utilizing the ICT Silver Bullet indicator outlined.
At this moment, the indicator has removed all other FVGs within the Silver Bullet session & has confirmed this FVG as the retested one.
There is also a support level marked below to be used as a liquidity target as per the ICT Silver Bullet concept suggests.
In the below chart we can see 4 separate consecutive examples of bullish & bearish setups on the 3-minute chart.
🔶 CONCEPTS
This technique can visualize potential support/resistance lines, which can be used as targets.
The script contains 2 main components:
• forming of a Fair Value Gap (FVG)
• drawing support/resistance (S/R) lines
🔹 Forming of FVG
1 basic principle: when a FVG at the end of the SB session is not retraced, it will be made invisible.
Dependable on the settings, different FVG's will be shown.
• 'All FVG': all FVG's are shown, regardless the trend
• 'Only FVG's in the same direction of trend': Only FVG's are shown that are similar to the trend at that moment (trend can be visualized by enabling ' Show ' -> ' Trend ')
-> only bearish FVG when the trend is bearish vs. bullish FVG when trend is bullish
• 'strict': Besides being similar to the trend, only FVG's are shown when the closing price at the end of the SB session is:
– below the top of the FVG box (bearish FVG)
– above bottom of the FVG box (bullish FVG)
• 'super-strict': Besides being similar to the trend, only FVG's are shown when the FVG box is NOT broken
in the opposite direction AND the closing price at the end of the SB session is:
– below bottom of the FVG box (bearish FVG)
– above the top of the FVG box (bullish FVG)
' Super-Strict ' mode resembles ICT lectures the most.
🔹 Drawing support/resistance lines
When the SB session has ended, the script draws potential support/resistance lines, again, dependable on the settings.
• Previous session (any): S/R lines are fetched between current and previous session.
For example, when current session is ' AM SB Session (10 AM — 11 AM) ', then previous session is
' London Open SB (3 AM — 4 AM) ', S/R lines between these 2 sessions alone will be included.
• Previous session (similar): S/R lines are fetched between current and previous - similar - session.
For example, when current session is ' London Open SB (3 AM — 4 AM)' , only S/R lines between
current session and previous ' London Open SB (3 AM — 4 AM) ' session are included.
When a new session starts, S/R lines will be removed, except when enabling ' Keep lines (only in strict mode) '
This is not possible in ' All FVG ' or ' Only FVG's in the same direction of trend ' mode, since the chart would be cluttered.
Note that in ' All FVG ' or ' Only FVG's in the same direction of trend ' mode, both, Support/Resistance lines will be shown,
while in Strict/Super-Strict mode:
• only Support lines will be shown if a bearish FVG appears
• only Resistance lines if a bullish FVG is shown
The lines will still be drawn the the end of the SB session, when a valid FVG appears,
but the S/R lines will remain visible and keep being updated until price reaches that line.
This publication contains a "Minimum Trade Framework (mTFW)", which represents the best-case expected price delivery, this is not your actual trade entry - exit range.
• 40 ticks for index futures or indices
• 15 pips for Forex pairs.
When on ' Strict/Super-Strict ' mode, only S/R lines will be shown which are:
• higher than the lowest FVG bottom + mTFW, in a bullish scenario
• lower than the highest FVG bottom - mTFW, in a bearish scenario
When on ' All FVG/Only FVG's in the same direction of trend ' mode, or on non-Forex/Futures/Indices symbols, S/R needs to be higher/lower than SB session high/low.
🔶 SETTINGS
(Check CONCEPTS for deeper insights and explanation)
🔹 Swing settings (left): Sets the length, which will set the lookback period/sensitivity of the Zigzag patterns (which directs the trend)
🔹 Silver Bullet Session; Show SB session: show lines and labels of SB session
Labels can be disabled separately in the ' Style ' section, color is set at the ' Inputs ' section.
🔹 FVG
– Mode
• All FVG
• Only FVG's in the same direction of trend
• Strict
• Super-Strict
– Colors
– Extend: extend till last bar of SB session
🔹 Targets – support/resistance lines
– Previous session (any): S/R lines fetched between current and previous SB session
– Previous session (similar): S/R lines fetched between current and previous similar SB session
– Colors
– Keep lines (only in strict mode)
🔹 Show
– MSS ~ Session: Show Market Structure Shift , only when this happens during a SB session
– Trend: Show trend (Zigzag, colored ~ trend)

Asian, UK & NY SessionTimes and Day Highs and LowsWhat It Does
The Asian, UK & NY Sessions indicator automatically identifies and highlights the three major global trading sessions on your chart.
For each session, it:
Detects session time in its local timezone.
Tracks the session’s highest and lowest prices.
Plots colored horizontal lines to show those levels throughout the trading day.
Optionally shades each session’s background in its signature color for instant visual context:
🟡 Asian Session: Yellow background
🔴 London Session: Red background
🔵 New York Session: Blue background
This helps traders see how price reacts within and between sessions — spotting overlaps, liquidity zones, and daily ranges.
⚙️ Inputs and Variables
Input Description
Extend lines until next session start (extendLines) Extends each session’s high/low lines forward until the next session begins.
Show prices in scale column (showScaleValues) Controls whether the price labels for session highs/lows appear on the chart’s right-hand price scale.
Show All Session Highs & Lows (showAllHighsLows) Master switch — turn this off to hide all session lines instantly, keeping the chart clean.
Show Session Backgrounds (showBackgrounds) Turns all background shading on or off. When off, all session colors disappear.
Background Opacity (bgOpacityAll) Adjusts the transparency for all session backgrounds (0 = solid, 100 = fully transparent).
🎨 Visual Color Scheme
Session Background High/Low Line
Asian Yellow Green
London Red Red
New York Blue Blue
Each color has a consistent role — making it easy to distinguish sessions even in replay or live view.
Price Tracking:
For each session, the indicator resets High and Low when the new session starts, then updates them as bars print.
Display Control:
If lines or backgrounds are disabled via settings, they’re completely hidden (no clutter, no partial transparency).
💡 How Traders Use It
Identify daily ranges in each global session.
Compare volatility between markets.
Align entries or exits with session transitions.
Observe how price respects previous session highs/lows.

RTH/ETH Session RangesSimple script that adds a table to the bottom left of the chart - shows the high and low of the Full Session with range, and shows the high and low of the RTH/USA session with same calculations.
This simple script enhances your charting experience by adding a comprehensive table to the bottom left corner of your trading chart. The table is designed to provide key market data at a glance, specifically focusing on the high and low metrics for different trading sessions. Here's a breakdown of what the script offers:
Features of the Script
Full Session Data:
High: The highest price point reached during the entire trading session.
Low: The lowest price point reached during the entire trading session.
Range: The difference between the high and low prices, providing insight into the session's volatility.
RTH/USA Session Data (Regular Trading Hours):
High: The highest price point reached during the RTH, typically reflecting the most active part of the trading day.
Low: The lowest price point reached during the RTH.
Range: The difference between the high and low prices during the RTH, indicating the session's intraday volatility.
How to Use the Script for Trading
Identify Key Levels:
Use the high and low points to identify significant support and resistance levels. These levels can guide your entry and exit points, helping you make informed trading decisions.
Gauge Market Volatility:
The range values for both the Full Session and RTH provide a quick snapshot of market volatility. Higher ranges suggest more significant price movements, which can inform your risk management strategies and position sizing.
Compare Sessions:
By comparing the Full Session data with the RTH data, you can identify differences in price behavior between the broader market hours and the more active trading periods. This comparison can help in understanding market dynamics and planning trades accordingly.
Unique Aspects of the Script
Ease of Access: The table's placement in the bottom left corner ensures that it is always visible without obstructing the main chart view, allowing for quick reference without disrupting your analysis.
Comprehensive Insights: By covering both the Full Session and RTH, the script provides a holistic view of the market, catering to traders who focus on different timeframes.
Customization Potential: Although simple, the script can be customized further to include additional metrics or visual tweaks to better suit individual trading strategies.
Practical Example
Imagine you're trading a particular stock and want to decide on a potential breakout strategy. By using this script, you can quickly identify the high of the Full Session as a potential breakout point. If the price approaches this level during the RTH, you can prepare to enter a trade with the confidence that this level has previously acted as a significant resistance. Conversely, knowing the low of the RTH can help you set stop-loss orders to manage risk effectively.

Main Market Opener Breakout [RH]Based on my observations while analyzing the crypto and forex charts, particularly BTCUSDT and EURUSD, I have noticed that the prices exhibit significant movements during most stock market sessions, particularly during New York main market session.
With the aim of capturing these moves, I embarked on extensive research. Through this research, I discovered that by considering the very first "15m" or "30m" candle of the main market trading session and marking that first candle's high and low points, we can create potential trigger points.
A break above the high point indicates a bullish signal, while a break below the low point suggests a bearish signal. To further refine our analysis and filter out some noise, we can incorporate the Average True Range (ATR) value of that candle.
Candle time is very important here. We will mark the candle when the actual trading begins in New York stock exchange. The trading hours for the New York Stock Exchange (NYSE) typically begin at 9:30 AM and end at 4:00 PM Eastern Time (ET), Monday through Friday. This is known as the "NYSE Regular Trading Session." However, it's important to note that there are also pre-market and after-hours trading sessions that occur outside of these core hours. We will not consider these pre and after-hours.
Example:
First break-above and break-below is marked automatically and alerts are also available for first breaks.
Example:
I have also added the option to add the, London Stock Exchange Main Market and Tokyo Stock Exchange Regular Trading Session. You can add those sessions also and test with different symbols.
Stocks symbols from different stock exchanges just mark the very first candle of the day(main market trading session).
Alerts are available.

DR/IDR Candles [LuxAlgo]This indicator displays defining ranges (DR) and implied defining ranges (IDR) constructed from two user set sessions (RDR/ODR) as graphical candles on the chart. The script introduces additional graphical elements to the original DR/IDR concept and as such can be thought as a graphical method in addition to a technical indicator.
Additionally, this script can display various Fibonacci retracements from the constructed DR/IDR if enabled within the settings.
Settings
Regular Session: Enable/disable regular session's DR/IDR alongside setting the session time. By default, 09:30 - 10:30 am.
Overnight Session: Enable/disable overnight session's DR/IDR alongside setting the session time. By default, 03:00 - 04:00 am.
UTC Offset: UTC offset for the time zone, by default -5 (EST)
Retracements
Reverse: Inverts source range upper/lower value for constructing the retracements.
From: Source range used to construct the retracements, by default DR is used.
By default, the 0.5 retracement (average line) is displayed.
Usage
The used sessions are highlighted by a gray background. DRs are highlighted by dashed lines while IDRs are highlighted by solid ones. The maximum/minimum price between each user set session is highlighted by solid wicks.
The color of the DRs/IDRs/wicks are determined by the price position relative to the DR; if price is above the DR maximum, then a blue color is used. If price is below, then an orange color is used, and if price is within the DR range, then a gray color is used.
Additionally, the area of the DR range is used to highlight the number of time price is located within the DR, with a longer background highlighting a higher number of occurrences. This can help highlight if the DR levels were potentially useful as support/resistance.
When price is outside the IDR range, the area between the price and IDR is highlighted, in blue if price is above the IDR, and orange if it is under.
The original author of the DR/IDR concept describes 3 rules using the price position relative to the DR/IDR levels:
1.) If price on the 5-minute timeframe closes above the DR high after 10:30 AM or 04:00 AM then the DR low will likely be the low of the trading session.
2.) If price on the 5-minute timeframe closes below the DR low after 10:30 AM or 04:00 AM then the DR high will likely be the high of the trading session.
3.) If price closes above the IDR high after 10:30 AM or 04:00 AM it is an early indication that the low of the DR will be the low of the day and vice versa.
We can see that the above rules are cases of conditional probabilities.
There is no significant data supporting or regarding any statistical probability of the above rules to be true, which are more than uncertain given the stochastic nature of prices. The lack of precision of these rules is also a concern (time zone dependance, applicable markets, etc...).
Credits
Credits to trader TheMas7er who originally created the DR/IDR concept in November of 2022. This script was derived from his proposed session times & rules for trading.

TBL Session Highs&LowsBL Session Highs&Lows is a versatile intraday tool that highlights key price levels within up to 11 configurable trading sessions. It displays session highs, lows, and optional open levels, with customizable lines, labels, and boxes — perfect for tracking price behavior across sessions like Asia, London, and New York.
🔧 Key Features
🧩 Up to 11 fully customizable sessions
📍 High, Low, and Open lines with adjustable color, style, and width
🧱 Optional boxes showing session range, dynamically colored based on price movement
🏷️ Session labels for visual orientation
🔁 Extendable lines to project levels beyond the session
🌐 Custom time zone support for each session
🎨 Fully customizable visuals for clear chart integration
📈 Designed for:
Intraday session tracking (e.g., Asia, London, NY)
Session-based strategies (breakouts, reversals, liquidity zones)
Open-level reference (e.g., NY open)
Visual separation of trading periods
Example Scenarios:
🟦 "Asia" session: 18:00–00:00 GMT-4 with full box and lines
🟩 "London" session: 00:00–06:00 with high/low lines only
🟥 Segmented NY sessions (Q1–Q4) for fine-grained intraday tracking
✅ Tip: Enable only the sessions you need to keep your chart clean and focused.
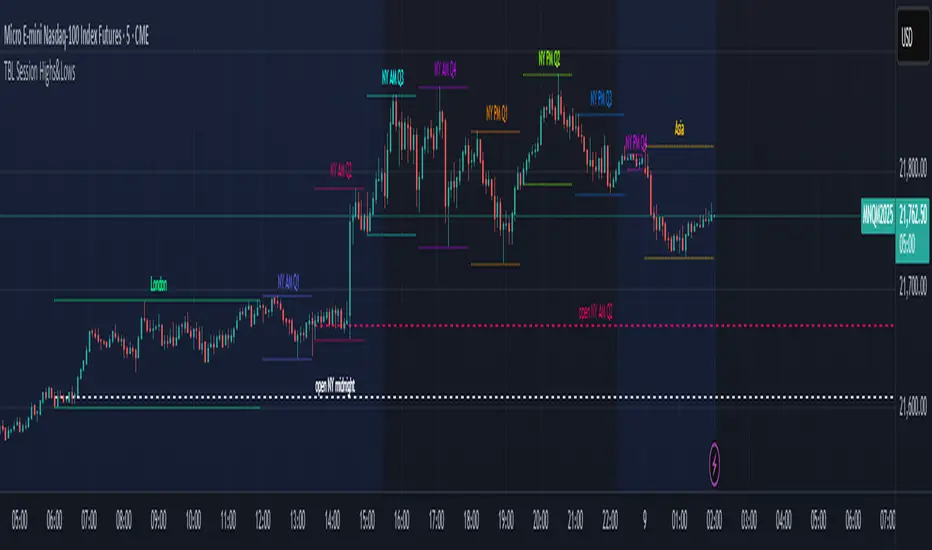
Trading Sessions Background ColorTrading Sessions Background Color
This indicator provides a visual representation of the major trading sessions — Asia, London, and USA — by applying distinct background colors to the chart. It allows traders to easily identify active market hours and session overlaps.
Features:
Customizable Sessions: Users can modify time ranges, and colors according to their preferences.
Predefined Major Trading Sessions: The indicator includes Asia, London, and USA sessions by default.
Time Zone Adjustment: A configurable UTC offset ensures accurate session display.
Clear Visual Differentiation: Background colors indicate when each session is active.
Usage Instructions:
Apply the indicator to a TradingView chart.
Adjust session settings and time zone offset as needed.
The chart background will update dynamically to reflect the active trading session.

Correlation HeatMap [TradingFinder] Sessions Data Science Stats🔵 Introduction
n financial markets, correlation describes the statistical relationship between the price movements of two assets and how they interact over time. It plays a key role in both trading and investing by helping analyze asset behavior, manage portfolio risk, and understand intermarket dynamics. The Correlation Heatmap is a visual tool that shows how the correlation between multiple assets and a central reference asset (the Main Symbol) changes over time.
It supports four market types forex, stocks, crypto, and a custom mode making it adaptable to different trading environments. The heatmap uses a color-coded grid where warmer tones represent stronger negative correlations and cooler tones indicate stronger positive ones. This intuitive color system allows traders to quickly identify when assets move together or diverge, offering real-time insights that go beyond traditional correlation tables.
🟣 How to Interpret the Heatmap Visually ?
Each cell represents the correlation between the main symbol and one compared asset at a specific time.
Warm colors (e.g. red, orange) suggest strong negative correlation as one asset rises, the other tends to fall.
Cool colors (e.g. blue, green) suggest strong positive correlation both assets tend to move in the same direction.
Lighter shades indicate weaker correlations, while darker shades indicate stronger correlations.
The heatmap updates over time, allowing users to detect changes in correlation during market events or trading sessions.
One of the standout features of this indicator is its ability to overlay global market sessions such as Tokyo, London, New York, or major equity opens directly onto the heatmap timeline. This alignment lets traders observe how correlation structures respond to real-world session changes. For example, they can spot when assets shift from being inversely correlated to moving together as a new session opens, potentially signaling new momentum or macro flow. The customizable symbol setup (including up to 20 compared assets) makes it ideal not only for forex and crypto traders but also for multi-asset and sector-based stock analysis.
🟣 Use Cases and Advantages
Analyze sector rotation in equities by tracking correlation to major indices like SPX or DJI.
Monitor altcoin behavior relative to Bitcoin to find early entry opportunities in crypto markets.
Detect changes in currency alignment with DXY across trading sessions in forex.
Identify correlation breakdowns during market volatility, signaling possible new trends.
Use correlation shifts as confirmation for trade setups or to hedge multi-asset exposure
🔵 How to Use
Correlation is one of the core concepts in financial analysis and allows traders to understand how assets behave in relation to one another. The Correlation Heatmap extends this idea by going beyond a simple number or static matrix. Instead, it presents a dynamic visual map of how correlations shift over time.
In this indicator, a Main Symbol is selected as the reference point for analysis. In standard modes such as forex, stocks, or crypto, the symbol currently shown on the main chart is automatically used as the main symbol. This allows users to begin correlation analysis right away without adjusting any settings.
The horizontal axis of the heatmap shows time, while the vertical axis lists the selected assets. Each cell on the heatmap shows the correlation between that asset and the main symbol at a given moment.
This approach is especially useful for intermarket analysis. In forex, for example, tracking how currency pairs like OANDA:EURUSD EURUSD, FX:GBPUSD GBPUSD, and PEPPERSTONE:AUDUSD AUDUSD correlate with TVC:DXY DXY can give insight into broader capital flow.
If these pairs start showing increasing positive correlation with DXY say, shifting from blue to light green it could signal the start of a new phase or reversal. Conversely, if negative correlation fades gradually, it may suggest weakening relationships and more independent or volatile movement.
In the crypto market, watching how altcoins correlate with Bitcoin can help identify ideal entry points in secondary assets. In the stock market, analyzing how companies within the same sector move in relation to a major index like SP:SPX SPX or DJ:DJI DJI is also a highly effective technique for both technical and fundamental analysts.
This indicator not only visualizes correlation but also displays major market sessions. When enabled, this feature helps traders observe how correlation behavior changes at the start of each session, whether it's Tokyo, London, New York, or the opening of stock exchanges. Many key shifts, breakouts, or reversals tend to happen around these times, and the heatmap makes them easy to spot.
Another important feature is the market selection mode. Users can switch between forex, crypto, stocks, or custom markets and see correlation behavior specific to each one. In custom mode, users can manually select any combination of symbols for more advanced or personalized analysis. This makes the heatmap valuable not only for forex traders but also for stock traders, crypto analysts, and multi-asset strategists.
Finally, the heatmap's color-coded design helps users make sense of the data quickly. Warm colors such as red and orange reflect stronger negative correlations, while cool colors like blue and green represent stronger positive relationships. This simplicity and clarity make the tool accessible to both beginners and experienced traders.
🔵 Settings
Correlation Period: Allows you to set how many historical bars are used for calculating correlation. A higher number means a smoother, slower-moving heatmap, while a lower number makes it more responsive to recent changes.
Select Market: Lets you choose between Forex, Stock, Crypto, or Custom. In the first three options, the chart’s active symbol is automatically used as the Main Symbol. In Custom mode, you can manually define the Main Symbol and up to 20 Compared Symbols.
Show Open Session: Enables the display of major trading sessions such as Tokyo, London, New York, or equity market opening hours directly on the timeline. This helps you connect correlation shifts with real-world market activity.
Market Mode: Lets you select whether the displayed sessions relate to the forex or stock market.
🔵 Conclusion
The Correlation Heatmap is a robust and flexible tool for analyzing the relationship between assets across different markets. By tracking how correlations change in real time, traders can better identify alignment or divergence between symbols and gain valuable insights into market structure.
Support for multiple asset classes, session overlays, and intuitive visual cues make this one of the most effective tools for intermarket analysis.
Whether you’re looking to manage portfolio risk, validate entry points, or simply understand capital flow across markets, this heatmap provides a clear and actionable perspective that you can rely on.
