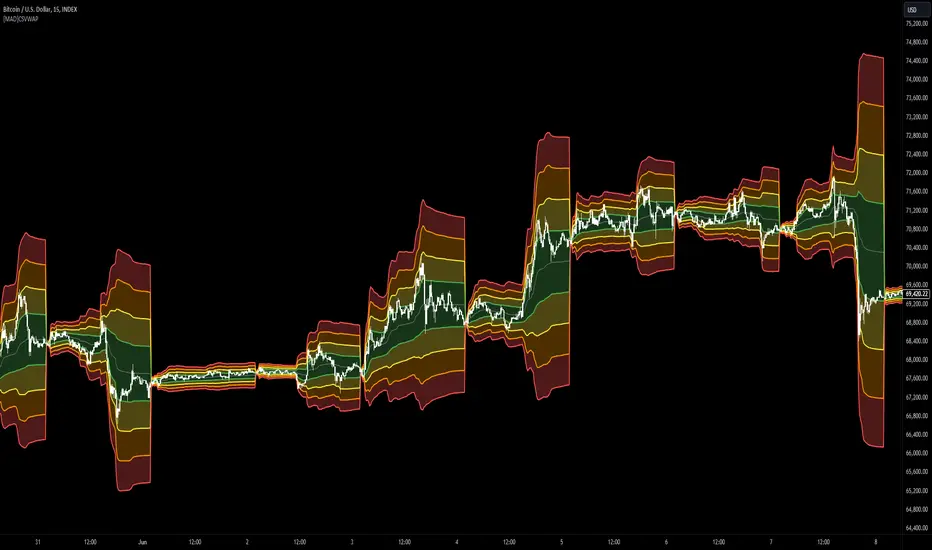
[MAD] Custom Session VWAP BandsOverview
This indicator helps visualize the Volume Weighted Average Price (VWAP) and its associated standard deviation bands over specified time periods, providing traders with a clear understanding of price trends, volatility, and potential support/resistance levels.
Inputs
Deviation
StDev mult 1: Multiplier for the first standard deviation band (Default: 1.0)
StDev mult 2: Multiplier for the second standard deviation band (Default: 2.0)
StDev mult 3: Multiplier for the third standard deviation band (Default: 3.0)
StDev mult 4: Multiplier for the fourth standard deviation band (Default: 4.0)
Line width: Width of the lines for the bands (Default: 2)
Custom Vwap session reset settings
Many different options are considered when a session is going to be reset.
Plot and Fill Options
Enable Fills: Enable/disable filling between bands.
Plot +4: Enable/disable plotting the +4 standard deviation band.
Plot +3: Enable/disable plotting the +3 standard deviation band.
Plot +2: Enable/disable plotting the +2 standard deviation band.
Plot +1: Enable/disable plotting the +1 standard deviation band.
Plot VWAP: Enable/disable plotting the VWAP line.
Plot -1: Enable/disable plotting the -1 standard deviation band.
Plot -2: Enable/disable plotting the -2 standard deviation band.
Plot -3: Enable/disable plotting the -3 standard deviation band.
Plot -4: Enable/disable plotting the -4 standard deviation band.
How to Use the Indicator
Adding the Indicator
Add the indicator to your chart through your trading platform's indicator menu.
Configuring the VWAP Reset
Specify reset intervals based on time, days of the week, or specific dates.
Adjust the time zone if necessary.
Customizing Standard Deviation Bands
Set the multipliers for the standard deviation bands.
Choose line width for better visualization.
Enabling Plots and Fills
Select which bands to display.
Enable or disable fills between the bands.
Practical Application of VWAP Bands
Understanding VWAP
VWAP is a trading benchmark that calculates the average price a security has traded at throughout the day based on volume and price. It is primarily used for intraday trading but can also offer insights during end-of-day reviews.
Using VWAP for Trading
Intraday Trading
Entry and Exit Points: VWAP can help identify optimal buy and sell points. Buy when the price is above VWAP and sell when it's below.
Support and Resistance: VWAP often acts as a dynamic support/resistance level. Prices tend to revert to VWAP, making it a crucial level for intraday traders.
Trend Confirmation
Uptrends and Downtrends: In an uptrend, the price will generally stay above VWAP. Conversely, in a downtrend, it will stay below. Use this to confirm market direction.
Combining with Other Indicators
Moving Averages and Bollinger Bands: Combining VWAP with these indicators can provide a more robust trading signal, confirming trends and potential reversals.
Setting Stop-Loss and Profit Targets
Conservative Stop Orders: Place stop orders at recent lows for pullback trades.
Profit Targets: Use daily highs or Fibonacci extension levels to set profit targets.
Strategies for Using VWAP
Pullback Strategy
Buy during pullbacks to VWAP in an uptrend, and sell during rallies to VWAP in a downtrend.
Breakout Strategy
Look for breakouts above/below VWAP after the market open to capitalize on new trends.
Momentum Trading
Use VWAP to confirm the strength of a trend. Buy when the price is consistently above VWAP and sell when it's consistently below.
Institutional Strategies
Institutional traders use VWAP to execute large orders without causing significant market impact, ensuring trades are made around the average price.
By incorporating these strategies, traders can better understand market dynamics, make informed trading decisions, and manage their risk effectively.
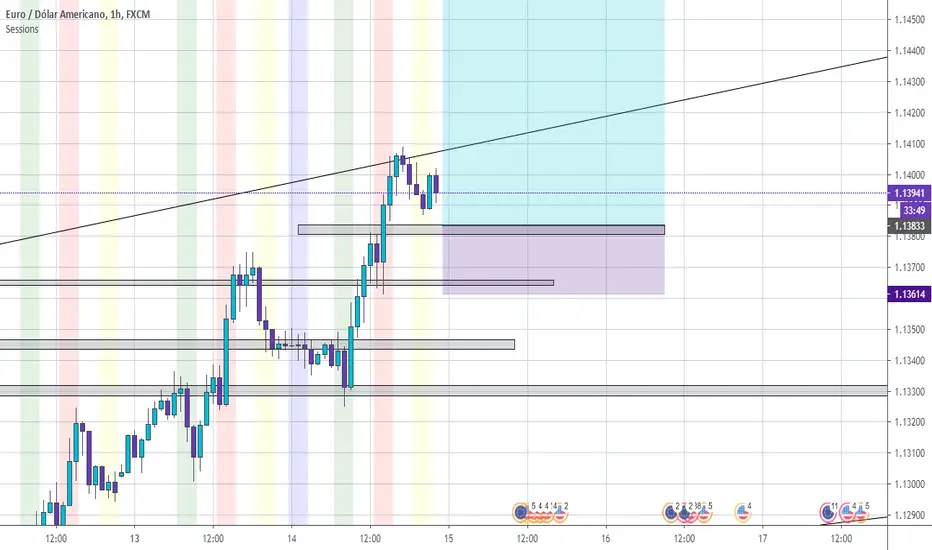
Some setup possibilities
Pesquisar nos scripts por "session"
Flexible timezone-aware session rangeAllows you to define session range with local time and its timezone, also can toggle session visibility any day of week.


Trading Session IndicatorFollowing time zones showing:
Asia Session - Red
London Open - White
London Session - Blue
NY Open - White

ASIA | LONDON | NEW YORK - Session Range [Entry Lab]This free community indicator automatically plots the highs and lows of each trading session, helping you clearly identify where liquidity is likely to be swept. Fully customisable to your personal time zone, it removes the manual work and keeps your focus on what matters most: structure, context, and timing.
Built by the EntryLab team for traders who want better entries, deeper market understanding, and a repeatable edge. Our mission is simple — make winning a common occurrence, not a rare one.
#EntryLab

Session High-Low Box,
Session High-Low Box Session High-Low Box indicatorSession High-Low BoxSession High-Low BoxSession High-Low BoxSession High-Low BoxSession High-Low BoxSession High-Low BoxSession High-Low BoxSession High-Low BoxSession High-Low BoxSession High-Low BoxSession High-Low BoxSession High-Low BoxSession High-Low BoxSession High-Low BoxSession High-Low BoxSession High-Low BoxSession High-Low BoxSession High-Low BoxSession High-Low BoxSession High-Low BoxSession High-Low BoxSession High-Low Boxwrtvtrvwrtv4v2tr2Session High-Low Box24v2v2Session High-Low Box
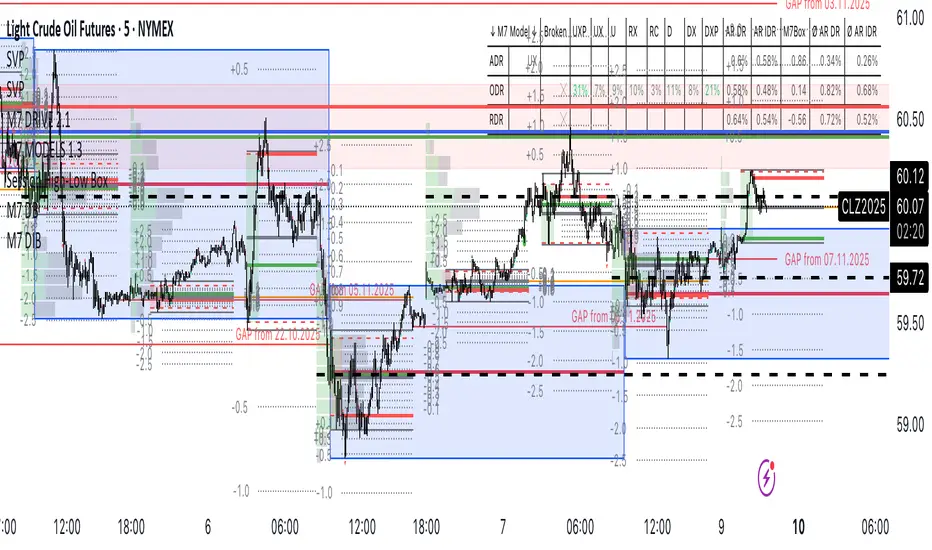
Session times for London (UTC 07:00–16:00 UTC)Session times for London (UTC 07:00–16:00 UTC). Shows the trading hours for the London Session Mon-Fri

Forex Session High/Low TrackerThis indicator maps out each Forex session along with their relative highs and lows.

ICT Index Futures Session LinesICT Index Futures Session Lines
Description:
The script is based on one of ICT's concepts on trading Index Futures. The script lays out the daily range from an intraday basis.
Range:
00:00 - New York Midnight
08:30 – New York Open (News events come out)
12:00/13:00 - New York Lunch (No trade time period)
13:30 - (Algorithm)
16:30 - Close
* The open, high and low lines are plotted from 00:00 to 08:30
How To Use:
You will need to check the daily bias. Prior to 8:30 you are to look for previous swing points where liquidity may exist. During the open you want to see if a high or low is taken out, and then wait for an energetic break/displacement for a potential FVG/imbalance retracement entry.
Strategy is for LTF (1 to 15m)
Default time zone is set to America/New_York (UTC New York), so lines will be plotted correctly regardless of user’s local UTC chart setting.


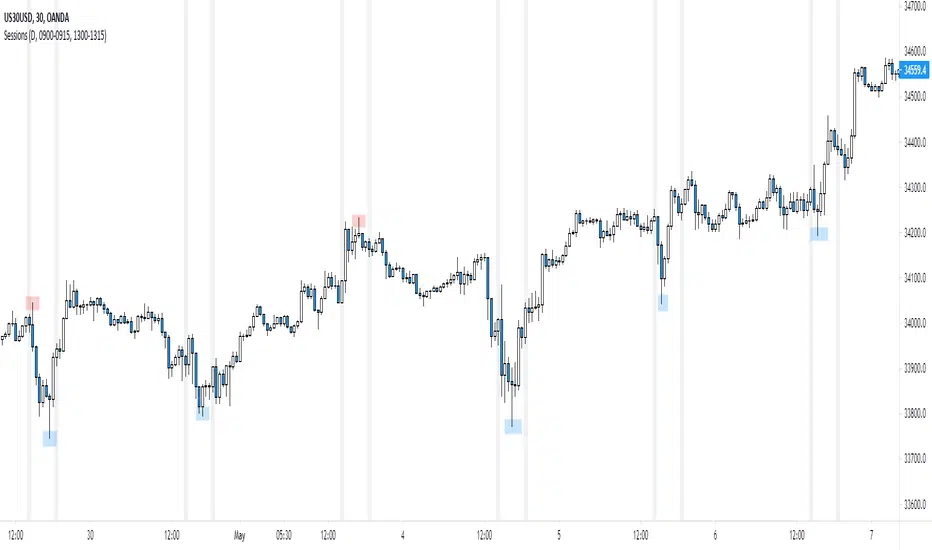
NY Session
Script to highlight the new york session trading hours
-The most volatile hours for us30 & the time in which it's most likely to make a significant high/low
Wavetrend strategy with trading session for any time chartHello there
Today I am glad to provide you a strategy based on the wave trend oscillator. If you want to use it as an indicator, just disable long and short to not make any shops.
It works on all time frames.
The way it works its like an RSI .
We have overbought and oversold levels, and together with a channel and length we calculate the wave trend.
And then like in RSI, when we cross those lines we buy or sell depending on which lines we cross.
For risk management, so far its not implemented, but it can be done in many ways.
The only thing I applied is to always close a trade at the end of friday day. At the same time it can be applied the rule to sell when % of equity is lost, or at the end of a trading session like london,neywork and so on.
For any questions or doubts, let me know.
Hope you enjoy it :)

[FN] Session Range & Date Range For BacktestingThis has been done before in different ways, however, my goal is to publish a single, simplified copy/paste version of the idea so you can quickly and easily incorporate it into your strategy backtesting.
You can designate weekdays, weekdays + weekends for 24/7 markets, and also session range.
So, you trade bitcoin? It works. CME futures? It works. You are a discretionary trader so the only signals that matter are the ones that happen when you're awake? It works. Copy and paste.
The goal is that its that easy. You'll have to let me know if it is. glhf everyone.
If I'm not mistaken, you should be able to copy/paste this directly into your strategy script (Paste it in before your entry declarations). Just leave out the last 2 lines where the bgcolor() is declared... unless you want the background color lit up, that's up to you. It's just for demonstration purposes in this script.
After you've pasted it in, then in your strategy.entry() function you are adding: to the strategy.entry() function.
e.g:
strategy.entry("Long", strategy.long, qty=1, when = ENTRY_SIGNAL and signal_backtest())
Shoutouts to @zenandtheartoftrading and @allanster for providing the basis of this code that I put together here. We stand on the shoulders of giants.

[STRATEGY][RS]Open Session Breakout TraderEXPERIMENTAL: use at your own discretion.
custom session breakout strategy, it uses a percentage of daily atr to set breakout limits. strategy only viable for intraday timeframes and is suggested under 1hour.


Session Opens: 09:00 + 23:00 (Rolling Days, Stop at Now)Session Opening Times for 10 AM open and Midnight Open, but for central time.

Session P4L SNIPERSsession separator only for the operation of the academy. by its time margin. added the asian range for a power of three

SessionBarThis PineScript is designed to display various visual elements on a chart to help traders track session activity within the lower time frames, specifically for the USA main session. Here's a breakdown of the script's functionality:
Session Tracking
The script tracks the USA main session, defined as 9:30 AM to 4:00 PM ET, Monday through Friday.
Visual Elements
The script displays various visual elements, including:
1. Session Open and Close Lines: Lines marking the open and close of the USA main session.
2. Session High and Low Lines: Lines marking the high and low of the USA sessions.
3. Active Session Bar: A Realtime Candle as the current session bar.
4. Overnight Session Bar: A Realtime Candle as the overnight session bar.
5. Session Timer: A label displaying the time left until the next session.
6. Background Colors: Colors indicating different session periods, such as pre-market, post-market, and active session.
Customization
The script allows users to customize various aspects, including:
1. Session Time: Users can adjust the session time.
2. Colors: Users can choose colors for different visual elements.
3. Display Options: Users can toggle the display of various visual elements.
Overall, this script provides a educational tool for traders to track session activity and visualize key market data.

SessionBoxLibrary "SessionBox"
This library provides functions to manage and visualize session boxes and labels on chart. A session box is a visual representation of a trading session with properties like time, name, color and the ability to track the high and low price within that session.
SessionBox
SessionBox: stores session data and provides methods to manage that data and visualize it on the chart.
Fields:
session_time (series bool)
session_name (series string)
session_color (series color)

SessionsThis is an advanced level sessions indicator.
Not so much an indicator, more of an auto way of plotting levels rather than drawing levels by hand every day.
It maps out the London and New York Sessions.
It also maps out the closing time and price for future reference.
Daily high and low of the past few days are laid out.
Each setting can be turned on and off in the settings if you don't require that session info.
The time settings are setup according to NY time. It should work straight without any modifications.
If you are a price action trader using sessions, this indicator will help you track price movement between sessions and give you possible support and resistance levels based on the previous session close.
This indicator does require allot of sessions based trading knowledge but if you understand it, it can be of major use to you.
Best used on GBP and USD currency pairs
Best timeframes 5Min - 1Hour
Best trading style would be day trading

SessionsThis indicator highlights the New York After Hours and Pre-Market session and visually defines its structure on the chart.
The session runs from 18:00 to 09:30 New York time, covering the full overnight and pre-market trading window leading into the regular cash open.
During this period, the script tracks and marks the high and low of the New York pre-market, allowing traders to clearly see the overnight range that often acts as key liquidity, support, and resistance during the regular trading session.
The session range can be displayed as a shaded background or as a high/low range, depending on user preference.
For clarity and precision, the indicator is visible only on intraday timeframes:
5-minute
30-minute
1-hour
This makes it especially useful for futures, index, and intraday traders who incorporate pre-market structure into their trading plans.