Breakout + Retest StrategyThe Breakout + Retest Strategy is a proven price action approach used by professional traders to catch high-probability market moves after key levels are broken. This strategy aims to enter the market after confirmation — reducing false breakouts and improving entry accuracy.
🔍 Strategy Logic:
Identify a Key Support or Resistance Level
These could be recent swing highs/lows, consolidation zones, or session highs.
Wait for a Clean Breakout
Price must decisively break above resistance or below support with strong momentum.
Watch for the Retest
After the breakout, wait for the price to pull back to the broken level (now flipped support/resistance).
Enter on Retest Confirmation
Look for signs like rejection wicks, bullish/bearish engulfing candles, or strong volume on the retest.
Set Risk-Managed Stops and Targets
Stop loss goes below (for long) or above (for short) the retested level.
Target is usually set at a 1:2 or higher risk-to-reward ratio, or based on structure.
✅ Why It Works:
Filters out fake breakouts
Uses market structure and liquidity traps to your advantage
Combines both momentum and confirmation
⚙️ Best Timeframes:
15-minute to 1-hour for intraday setups
4-hour and daily for swing trades
📊 Ideal for:
Futures (NQ, ES, Gold)
Forex pairs
Crypto
Stocks near key earnings or breakout zones
Pesquisar nos scripts por "session high"

KEY MARKET SESSION EU/US RANGE LEVELS - KLT🔹 KEY MARKET SESSION EU/US RANGE LEVELS - KLT
This indicator highlights critical trading levels during the European and U.S. sessions, with Overbought (OB) and Oversold (OS) markers derived from each session's price range.
It’s designed to support traders in identifying key zones of interest and historical price reactions across sessions.
✳️ Features
🕒 Session Recognition
European Session (EU): 08:00 to 14:00 UTC
United States Session (US): 14:30 to 21:00 UTC
The indicator automatically detects the current session and updates levels in real time.
📈 Overbought / Oversold (OB/OS) Levels
Helps identify potential reversal or reaction zones.
🔁 Previous Session OB/OS Crosses
OB/OS levels from the previous session are plotted as white crosses during the opposite session:
EU OB/OS shown during the US session
US OB/OS shown during the EU session
These levels act as potential price targets or reaction areas based on prior session behavior.
🎨 Session-Based Color Coding
EU Session
High/Low: Orange / Fuchsia
OB/OS: Orange / Lime
Previous OB/OS: White crosses during the US session
US Session
High/Low: Aqua / Teal
OB/OS: Aqua / Lime
Previous OB/OS: White crosses during the EU session
🧠 How to Use
Use the OB/OS levels to gauge potential turning points or extended moves.
Watch for previous session crosses to spot historically relevant zones that may attract price.
Monitor extended High/Low lines as potential magnets for price continuation.
🛠 Additional Notes
No repainting; levels are session-locked and tracked in real time.
Optimized for intraday strategies, scalping, and session-based planning.
Works best on assets with clear session behavior (e.g., forex, indices, major commodities).

Profitable Loser Model [MMT]Profitable Loser Model
Overview
The Profitable Loser Model is a powerful PineScript v6 indicator designed to enhance your trading by visualizing key price levels, session open zones, Fibonacci retracements, and premium/discount zones. This overlay indicator provides traders with a customizable toolkit to analyze market structure across any timeframe, making it ideal for intraday and swing trading strategies.
Features
Open Zone Visualization
- Plots a box based on the open and close of the first candle in a user-defined timeframe (default: 5-minute).
- Customizable box color, projection offset, and label size (Tiny, Small, Normal, Large).
- Displays a timeframe label (e.g., "5m Open Zone") for quick reference, toggleable on/off.
Session Open Lines
- Optionally draws horizontal lines at key session opens (8:30 AM, 9:30 AM, 1:30 PM, Midnight, New York time).
- Customize line color, style (Solid, Dashed, Dotted), width, and label size for each session.
- Perfect for identifying critical intraday price levels.
Premium and Discount Zones
- Highlights premium (above midpoint) and discount (below midpoint) zones based on session high/low.
- Toggleable with customizable colors and projection offsets.
- Helps traders spot overbought/oversold areas for potential mean-reversion trades.
Fibonacci Retracement Levels
- Plots user-defined Fibonacci levels (default: 0.23, 0.35, 0.5, 0.62, 0.705, 0.79, 0.886, 1, 1.1).
- Customizable line style, width, color, and labels (showing percentage and/or price).
- Dynamically adjusts based on price movement relative to the open zone.
Take Profit (TP) and Stop Loss (SL) Levels
- Highlights TP (default: 0.23) and SL (default: 1.1) Fibonacci levels with distinct colors.
- Fully customizable to align with your risk-reward strategy.
How It Works
- Session Detection : Resets daily (or per user-defined timeframe) to capture the first candle's open, high, low, and close.
- Open Zone : Draws a box between the open and close, extended forward by the projection offset.
- Session Lines : Plots lines at specified session opens with customizable styles and labels.
- Fibonacci Retracement : Adjusts levels dynamically based on session high/low and price action.
- Premium/Discount Zones : Calculated from the session range midpoint, updated in real-time.
Settings
- Open Zone :
- Timeframe (default: 5m), Calculate Timeframe (default: Daily).
- Toggle label, adjust size, box color, and projection offset.
- Session Open Lines :
- Enable/disable lines for 8:30 AM, 9:30 AM, 1:30 PM, Midnight.
- Customize color, style, width, label size, and vertical offset.
- Premium/Discount Zones :
- Toggle visibility, set colors, and adjust projection offset.
- Fibonacci Retracement :
- Toggle visibility, set custom levels, line style, width, color, and label options.
- Adjust projection offset.
- TP/SL :
- Set TP/SL Fibonacci levels and colors.
Use Cases
- Intraday Trading : Use session open lines and open zones to trade key market hours.
- Swing Trading : Leverage Fibonacci levels for potential reversal or continuation zones.
- Risk Management : Set precise TP/SL levels based on Fibonacci retracements.
- Market Structure : Identify overbought/oversold zones with premium/discount areas.
Notes
- Optimized with `dynamic_requests = true` for efficient real-time data handling.
- Visual elements (boxes, lines, labels) are cleaned up at the start of each new session.
- Session lines use New York time (`America/New_York`) for alignment with major markets.

Session Visualizer by Timezone (Fixed)Session Visualizer by Timezone (Asia, London, New York)
This indicator highlights the Asian, London, and New York trading sessions directly on your chart — adjusted to your local timezone (via UTC offset).
🔧 Key Features:
Session times automatically adjust based on your chosen UTC offset
Toggle each session on/off individually
Custom background colors for each session
Designed for all intraday timeframes (1m – 4H)
📍 Sessions Covered:
Asian Session – Generally lower volatility and slower price movement; ideal for range traders and pre-positioning
London Session – Marked increase in volatility as European markets open
New York Session – Highest volume and volatility, especially during the London-New York overlap
🕓 Time Offset Setting:
Input your local UTC offset (e.g., UTC+10 for Sydney, UTC+1 for Berlin, UTC-5 for New York). The indicator adjusts session display accordingly.

Rapid Killzone BreakoutFinal Indicator Title: Rapid Killzone Break & HTF Levels
Overview
Welcome to the Rapid Killzone Break & HTF Levels, an all-in-one trading toolkit designed for precision and context. This indicator was built to solve a common problem for day traders: how to combine a precise, lower-timeframe (LTF) entry model with the essential context of higher-timeframe (HTF) levels.
This tool is founded on a session-based breakout strategy, leveraging the volatility and liquidity generated during specific market hours (the "Killzones"). It then layers critical HTF support and resistance levels onto your chart, allowing you to make more informed trading decisions without ever needing to switch timeframes.
Whether you trade Forex, Gold, or major Indices, this indicator provides a comprehensive framework for identifying high-probability breakout opportunities.
The Core Strategy
The methodology is a powerful three-step process based on session liquidity and qualified breakouts:
The Killzone Range: The indicator first identifies the high and low established during a specific, high-volatility trading session (e.g., the first hour of London or New York). This range acts as a pool of liquidity. The core idea is that the market will often seek to "sweep" or run the liquidity resting above the session high or below the session low.
The Qualified Breakout: This is not just any breakout strategy. A valid entry signal only appears when price closes decisively outside the Killzone range with significant momentum. To ensure the quality of the signal, the breakout must meet several user-defined criteria:
The Killzone must have a minimum pip range.
The breakout candle must have a strong body-to-wick ratio.
The breakout must be accompanied by a spike in volume.
Higher Timeframe Confluence: A breakout is more likely to succeed if it aligns with the HTF narrative. This indicator plots the previous higher-timeframe candle's high and low directly onto your chart. These levels act as powerful magnets for price or as formidable support/resistance zones. A breakout on the LTF that targets the HTF previous high is a much higher-probability setup than one trading directly into it.
Key Features
📊 DST-Aware Killzones: Automatically adjusting session boxes for London and New York. The timezones are fully configurable (e.g., Europe/London, America/New_York) and automatically handle Daylight Saving Time changes so you never have to manually adjust them.
📈 Killzone Pivots: Automatically draws the High, Low, and a dotted Midpoint from each Killzone session, acting as key intraday levels.
🏛️ Higher Timeframe (HTF) Levels: Plots the previous HTF candle's High and Low as dashed lines on your chart, providing critical context for support, resistance, and targets.
🕯️ HTF Mini-Candles: Displays a visual summary of the last three HTF candles on the right side of your chart, so you can see the HTF trend at a glance.
⏰ Custom Vertical Timestamps: Up to three configurable vertical lines with labels to mark key events like other session opens (e.g., "Sydney Open").
🎛️ Advanced Breakout Filters: Fine-tune your signals with filters for minimum Killzone range, minimum candle body percentage, and volume spikes. (Important: The volume filter requires a data feed that provides real volume, such as OANDA, FXCM, or futures/stock data).
✅ Dynamic Entry Advice Table: After a signal, a table provides a suggested entry technique (e.g., "50% retrace to signal candle") based on how far price has moved from the breakout level.
📋 Killzone Range Stats Table: A clean table shows the current and average pip range for both the London and New York sessions, helping you gauge current volatility.
🛠️ Fully Customizable: Nearly every visual element can be toggled on/off or have its color and style changed to suit your personal chart theme.
How to Use This Indicator
This tool is designed to provide a clear, step-by-step workflow for your trading sessions.
Setup: In the settings, choose your desired Reference Timeframe (e.g., 240 for 4-Hour). Configure your Killzone session times and colors.
Context is King: Before the session begins, take note of where price is in relation to the dashed HTF High/Low lines. Is price consolidating below the previous HTF low? A breakout might target it. Is price approaching the HTF high? This could be a take-profit area or a point of resistance.
Wait for the Range: Allow the London or New York Killzone (the colored box) to form completely.
Anticipate the Breakout: Once the session box is closed, the indicator is now hunting for a valid breakout.
Validate the Signal: When a "Long" or "Short" label appears, this is your entry signal. Check the Info-Box data (RSI, volume, candle body %) to confirm the strength of the move.
Manage the Trade: Use the Killzone pivots and the HTF High/Low lines as potential areas to manage your trade, take partial profits, or identify a final target. Check the Entry Advice table for ideas on refined entries if you miss the initial move.
Applicable Markets
This strategy is most effective on instruments known for their session-based volatility. It has been tested and works exceptionally well on:
Forex Majors: EUR/USD, GBP/USD, etc.
Gold: XAU/USD
Indices: NASDAQ 100 (NQ100), S&P 500 (SPX500)
It is best used on lower timeframes (such as the 5-minute or 15-minute chart) for trade execution.

Sessions By petranThis indicator highlights the key trading sessions on the chart: Asian, Frankfurt, London, and New York. It helps traders visually track when each session begins and ends, making it easier to analyze price action, volume, and volatility during specific times of the day.
Key features:
Customizable session start and end times
Up to 4 major sessions highlighted
Best used on intraday timeframes (1-minute to 1-hour)
Clean, minimal design with adjustable colors and transparency
No repainting – reliable for both live trading and backtesting
Ideal for intraday traders and anyone who wants to better understand market dynamics during different trading sessions.

TrendMaster Pro 2.3 with Alerts
Hello friends,
A member of the community approached me and asked me how to write an indicator that would achieve a particular set of goals involving comprehensive trend analysis, risk management, and session-based trading controls. Here is one example method of how to create such a system:
Core Strategy Components
Multi-Moving Average System - Uses configurable MA types (EMA, SMA, SMMA) with short-term (9) and long-term (21) periods for primary signal generation through crossovers
Higher Timeframe Trend Filter - Optional trend confirmation using a separate MA (default 50-period) to ensure trades align with broader market direction
Band Power Indicator - Dynamic high/low bands calculated using different MA types to identify price channels and volatility zones
Advanced Signal Filtering
Bollinger Bands Volatility Filter - Prevents trading during low-volatility ranging markets by requiring sufficient band width
RSI Momentum Filter - Uses customizable thresholds (55 for longs, 45 for shorts) to confirm momentum direction
MACD Trend Confirmation - Ensures MACD line position relative to signal line aligns with trade direction
Stochastic Oscillator - Adds momentum confirmation with overbought/oversold levels
ADX Strength Filter - Only allows trades when trend strength exceeds 25 threshold
Session-Based Trading Management
Four Trading Sessions - Asia (18:00-00:00), London (00:00-08:00), NY AM (08:00-13:00), NY PM (13:00-18:00)
Individual Session Limits - Separate maximum trade counts for each session (default 5 per session)
Automatic Session Closure - All positions close at specified market close time
Risk Management Features
Multiple Stop Loss Options - Percentage-based, MA cross, or band-based SL methods
Risk/Reward Ratio - Configurable TP levels based on SL distance (default 1:2)
Auto-Risk Calculation - Dynamic position sizing based on dollar risk limits ($150-$250 range)
Daily Limits - Stop trading after reaching specified TP or SL counts per day
Support & Resistance System
Multiple Pivot Types - Traditional, Fibonacci, Woodie, Classic, DM, and Camarilla calculations
Flexible Timeframes - Auto-adjusting or manual timeframe selection for S/R levels
Historical Levels - Configurable number of past S/R levels to display
Visual Customization - Individual color and display settings for each S/R level
Additional Features
Alert System - Customizable buy/sell alert messages with once-per-bar frequency
Visual Trade Management - Color-coded entry, SL, and TP levels with fill areas
Session Highlighting - Optional background colors for different trading sessions
Comprehensive Filtering - All signals must pass through multiple confirmation layers before execution
This approach demonstrates how to build a professional-grade trading system that combines multiple technical analysis methods with robust risk management and session-based controls, suitable for algorithmic trading across different market sessions.
Good luck and stay safe!

[TehThomas] - Previous Day/Week/Month High, Low, Open, CloseThis script is a powerful visual tool designed to automatically plot the key high, low, open, and close levels from the previous day, previous week, and previous month directly onto your active chart. These historical price levels are some of the most significant reference points for traders, often acting as natural magnets for price, areas of liquidity, or decision points where reversals, continuations, or fakeouts commonly occur.
Whether you’re a scalper working off intraday charts or a swing trader using higher timeframes, having these levels marked automatically keeps your chart structured and your strategy grounded in recent price behavior.
What This Script Displays on Your Chart
Once added to your chart, this script draws horizontal lines at the exact price levels where the previous day, week, and month ended or found their highs and lows. For each timeframe, you have full control over what’s shown, with toggle switches to enable or disable specific lines like:
Previous Day High and Low
Previous Day Open and Close
Previous Week High and Low
Previous Week Open and Close
Previous Month High and Low
Each level is color-coded, clearly labeled, and extended a set number of candles into the future so you can quickly identify which level is which. The labels are minimalist and clean, placed directly next to each line so they don’t distract from price action. This keeps your workspace visually organized without sacrificing context.
Why These Levels Are Important
These historical levels serve as psychological and technical anchors for the market. Traders and algorithms alike often react to the highs and lows of previous sessions, and open/close levels serve as polarity zones where support becomes resistance or vice versa.
Here are just a few practical uses:
Support and Resistance: Previous session highs and lows frequently act as strong areas where price reacts or consolidates.
Liquidity Zones: These levels often sit just above or below pools of stop-loss orders, making them common targets for liquidity grabs.
Market Context: Having previous opens and closes lets you see if price is trading above or below prior value areas, helping define bullish or bearish bias.
Entry and Exit Planning: Knowing where major levels sit helps refine your entries, manage risk, or take partial profits at high-probability reversal areas.
By automatically drawing these reference points, the script helps traders stay objective, focus on structure, and avoid emotional trading decisions.
How It Works Behind the Scenes
At the core, the script tracks the most recent completed daily, weekly, and monthly candles. It records the high, low, open, and close of those time periods and scans recent price history to find the exact bar where those levels were printed. Once found, it draws clean, extendable horizontal lines from those points forward on your chart.
The script includes built-in cleanup logic to ensure that only the latest relevant levels are visible. Whenever new session data becomes available, it removes old lines and replaces them with updated levels so your chart stays clean and accurate without any manual effort. You can also adjust how far these lines extend into the future, change their width, and personalize the colors to match your charting style.
This makes it a fully automatic, no-maintenance tool that always keeps your chart aligned with current session structure.
Whether you're watching for stop hunts at the previous week's high, looking for reaction zones around the prior day's close, or simply want to align your bias with institutional reference points, this script delivers the clean structure and clarity you need to trade more confidently and effectively.
Special thanks to: meddymarkusvanhala
For helping me optimise the script for faster load times

ORB-HL1. Opening Range Detection
Automatically calculates the high and low of the first 15 minutes after the selected session opens.
Supported sessions:
New York (Futures): 08:30–08:45 EST
New York (Equities): 09:30–09:45 EST
London: 03:00–03:15 GMT
Asia: 19:00–19:15 JST
Plots ORB high/low lines for the rest of the day.
2. Breakout Signals
Highlights the first valid breakout above or below the ORB range on the:
5-minute timeframe
15-minute timeframe
Green arrows = breakout up (long)
Red arrows = breakout down (short)
3. 1-Minute Projection
When a breakout is confirmed on a higher timeframe (5m or 15m), a projection label (e.g., "5m", "15m") appears on the 1-minute chart.
Purple label = 5m breakout
Teal label = 15m breakout
Helps you confirm momentum in real time while on the 1-minute chart.
4. Trailing Stop System
Uses ATR to create an adaptive trailing stop after breakout.
Turns green when price is above stop (bullish), red when below (bearish).
Optional Buy / Sell signal labels appear on crossover events.
5. Session High/Low Visualization
Tracks and displays the previous session’s High and Low for:
Tokyo
London
New York
Lines extend into the current session to act as S/R reference.
Labels like "NY High", "Asia Low" are placed at the end of each line.
6. Alerts
Built-in alerts for:
First 5m or 15m breakout (long/short)
Trailing stop Buy/Sell crossover
7. Customization Options
Turn session H/L lines on/off per session
Customize projection visibility
Adjust ATR period and sensitivity
Set how far each session line extends using bar offsets

Time-based LiquidityThis indicator automatically marks important time-based liquidity levels on your chart, helping you stay aware of where major price reactions may occur and the market is forced to show its hand.
Key Features:
Previous Month’s, Week’s, and Day’s Highs and Lows: Displays PMH/PML, PWH/PWL, and PDH/PDL — key reference points where liquidity often accumulates.
Intraday Session Highs and Lows: Divides the trading day into quarters (00:00–06:00, 06:00–12:00, etc. following Day’s Quarterly Theory) and tracks session highs and lows dynamically across these periods.
Current Session 90-Minute Quarters: Splits the active session into 90-minute intervals to highlight short-term liquidity structures and potential reaction zones.
Level Alerts: Tracks when each liquidity level is reached and enables customizable alerts so you don’t miss important price movements.
Use Case:
This tool provides an organized, time-based framework for identifying where liquidity is likely to concentrate across different timeframes and intraday cycles. Use these levels for forming bias, planning entries, exits, or anticipating price reactions at key points in the market structure.
Customization Options:
Enable/disable liquidity levels to display (Daily, Weekly, Monthly, Sessions, Session Quarters)
Customize the appearance of each level (color, style, line width)
Enable or disable tracking and alerts for level interactions

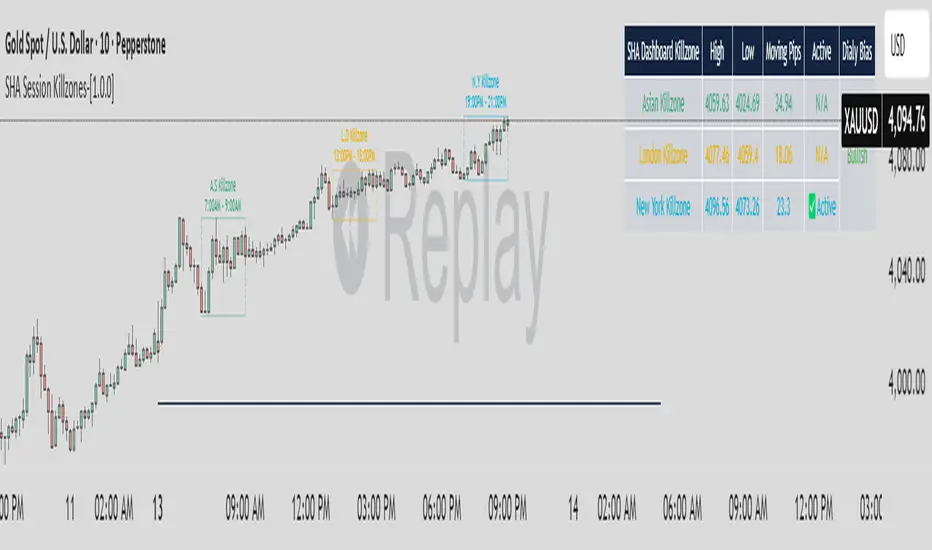
SHA Session Killzones-[1.0.0]
🔰 SHA Session Killzones
Created by:
Version: 1.0.0
Timeframes: Optimized for 5m,10m, 15m, 30m, and 1h
✨ Description:
The SHA Session Killzones indicator automatically highlights the most volatile market hours — the Asian, London, and New York sessions — directly on your chart. Each killzone is color-coded and visually boxed to help you identify:
- 🟧 Asian Killzone (07:00–09:00)
- 🟦 London Killzone (13:00–15:00)
- 🟪 New York Killzone (19:00–21:00)
This indicator helps you:
- 🔍 Focus only on high-probability trading windows
- 🚫 Avoid low-liquidity traps
- 🔄 Plan breakout/reversal strategies during peak hours
- 📊 Use session highs/lows as key intraday S/R levels
⚙️ Features:
- Adjustable time zones (default: UTC+7)
- Automatic session labeling
- Clean and minimal visuals for optimal chart clarity
- Compatible with all instruments, especially Gold (XAUUSD)
🧠 How to Use:
- Use with your trading strategy to filter out noise
- Apply on 10m–30m timeframes for maximum precision
📌 Tip:
Use in confluence with market structure, volume spikes, or news catalysts for more effective entries.
Market Session Boxes with Volume Delta [algo_aakash]This script highlights four key forex trading sessions — Tokyo, London, New York, and Sydney — by drawing color-coded boxes directly on the chart. For each session, it shows:
High and low of the session
Total volume traded
Volume delta (bullish vs bearish pressure)
Optional extension of session highs/lows into future candles
Cleanly labeled time range and stats
Users can:
Select which sessions to display
Customize session times (in UTC+0)
Choose colors per session
Toggle session labels and extension lines
Use Case: Designed to help intraday and short-term traders visualize market rhythm, liquidity zones, and session-based volatility. The volume delta metric adds an extra layer of sentiment analysis.
This tool works best on intraday timeframes like 15m, 30m, or 1H.
Disclaimer:
This indicator is for educational and visual analysis purposes. It does not constitute trading advice or guarantee results. Always conduct your own analysis before making trading decisions.

London Session 15-min Range – Clean AEST Timestamp Fix (w/ EMAs)London Session 15-min Range – Clean AEST Timestamp Fix (with EMAs)
What it does:
This script is made for traders who want to track the high and low of the first 15-minute candle of the London session, using AEST (UTC+10) as the time reference. It also plots the 50 EMA and 200 EMA to help identify trend direction.
How it works:
Session Timing:
The London session is defined as starting at 6:00 PM AEST.
The session ends at 2:00 AM AEST the next day.
Detects the first 15 minutes of the London session:
During this time, it records the highest and lowest price.
Draws lines once the 15-minute window is over:
A red horizontal line is drawn at the session high.
A green horizontal line is drawn at the session low.
These lines extend 50 bars into the future.
It only draws these once per day/session.
Includes EMAs:
A 50-period EMA is calculated and plotted in yellow.
A 200-period EMA is calculated and plotted in white.
Why use it:
It helps visualise important price levels from the start of the London session and pairs that with moving averages to spot trends or potential breakouts.

Shadow EdgeShadow Edge Indicator
Overview
Shadow Edge is an advanced technical analysis tool that visualizes key price levels and statistical patterns based on multiple timeframe analysis. It helps traders identify potential support, resistance, and expansion zones by tracking historical price behavior at specific hours of the trading day.
This indicator offers unique statistical insights by calculating average expansion levels and tracking market behavior patterns on an hourly basis. Unlike standard technical indicators, Shadow Edge combines historical price analysis with proprietary statistical calculations to identify high-probability zones for market reactions.
Key Features
• Previous High/Low Visualization : Displays previous session high and low levels with configurable line styles
• Mean Expansion Levels : Calculates and displays average price expansion levels (MuEH/MuEL) based on historical data
• Manipulation/Distribution Levels : Shows potential manipulation and distribution zones calculated from price action patterns
• Sweep Detection : Alerts when price sweeps previous high or low levels with customizable offset
• Multi-timeframe Analysis : Analyzes higher timeframe data and projects it onto your current chart
• Statistical Tracking : Maintains a database of price behavior by hour to identify recurring patterns
• Fully Customizable Visuals : Adjust colors, line styles, and transparency to match your chart setup
Settings
• Customize appearance of all elements including candles, lines, and labels
• Toggle visibility of different price levels
• Set alert conditions for level tests and sweeps
• Configure historical bar lookback period
• Optional stats display showing reliability percentages by hour
Use Cases
• Identify potential reversal zones at previous highs/lows
• Anticipate likely price expansion based on statistical averages
• Recognize manipulation and distribution patterns in price action
• Set precise alerts for sweep events at key levels
• Enhance your trading strategy with multi-timeframe analysis
How to Use It
1. Initial Setup : Apply the indicator to your chart and configure the higher timeframe setting (default is 60 min) to match your trading style.
2. Level Identification :
• Previous High (PH) and Previous Low (PL) levels show where price previously found support/resistance
• Mean Expansion High (MuEH) and Low (MuEL) levels indicate statistically likely price boundaries
• The Previous EQ level represents the equilibrium point between previous high and low
3. Trading Strategy Applications :
• Look for price reactions when testing previous high/low levels
• Use expansion levels (MuEH/MuEL) as potential take-profit targets
• Monitor manipulation (-M, +M) and distribution (-D, +D) levels for potential reversal zones
• Set alerts for sweeps of previous high/low levels to identify potential stop hunts
4. Statistical Analysis :
• The optional stats table shows reliability percentages for different hours
• Higher percentages indicate historically stronger adherence to the projected levels
• Use this data to adjust your trade timing and risk management
5. Visual Customization :
• Adjust colors and line styles to create a clean, easy-to-read chart
• Toggle different elements on/off based on your specific trading approach
• Reduce transparency settings if you prefer a more subtle visual overlay
Important Notes
• This indicator uses statistical calculations to identify price levels; past performance does not guarantee future results
• For best results, use on liquid markets during their primary trading sessions
• While the indicator provides statistical projections, always combine these signals with your own analysis and risk management strategy
• The code containing the proprietary algorithms is protected as closed source to maintain its integrity
Limitations
• The indicator requires sufficient historical data to calculate accurate statistical levels
• Performance may vary depending on market volatility and trading conditions
• Level projections work best on standard chart types (not Heikin Ashi, Renko, etc.)
• Sweep detections should be confirmed with price action before taking action
Note : Contact me for a version of this indicator that can work on any Higher Timeframe.
Prev Day, Premarket, 5m OpenDescription of the Script
This script is a Pine Script (version 5) indicator designed for use in TradingView. It overlays customizable price range lines and backgrounds on a chart to highlight key trading ranges based on different time periods and sessions. The indicator focuses on the following ranges:
Daily Range: Displays the high and low prices from the previous trading day (9:30 AM to 4:00 PM ET).
Premarket Range: Shows the high and low prices during the premarket session (4:00 AM to 9:29 AM ET) of the current day.
5-Minute Opening Range: Captures the high and low prices during the first 5 minutes of the regular trading session (9:30 AM to 9:35 AM ET).
GC Sessions (Gold Commodity): Optionally displays the high and low of the previous day's GC session (9:00 AM to 2:30 PM ET) and London Fix windows (5:00–6:00 AM and 9:30–10:30 AM ET on the current day).
CL Sessions (Crude Oil): Optionally displays the high and low of the previous day's CL session (9:00 AM to 2:30 PM ET) and the EIA window (10:00–11:00 AM ET on Wednesdays).
Each range is represented by horizontal lines (top and bottom) with customizable colors, styles (solid, dashed, dotted), and widths. Background shading between the high and low lines can also be enabled with adjustable colors and transparency. Labels are added to identify each range (e.g., "PDH" for Previous Day High, "PMH" for Premarket High, etc.). The script adjusts for time zones via a user-defined offset and allows manual override of the previous trading day.
Instructions for Setting the Inputs
The script provides a variety of customizable inputs grouped by range type. Below are instructions for setting each input category:
General Settings
Timezone Offset (hours): Adjusts the script's time calculations to your local timezone relative to UTC. Enter the number of hours to subtract from UTC (e.g., -4 for Eastern Time during Daylight Saving Time, -5 during Standard Time). Range: -12 to +12.
Previous Day Settings
Previous Trading Day Override (YYYY-MM-DD): Allows manual specification of the previous trading day in "YYYY-MM-DD" format (e.g., "2025-03-19"). Leave blank for automatic detection (defaults to the prior day). This override expires at midnight ET the next day.
Daily Range Customization
Daily Top Line Color: Choose the color for the previous day's high line (default: green).
Daily Top Line Style: Select the line style (solid, dashed, dotted; default: solid).
Daily Top Line Width: Set the line thickness (1 to 5; default: 2).
Daily Bottom Line Color: Choose the color for the previous day's low line (default: red).
Daily Bottom Line Style: Select the line style (solid, dashed, dotted; default: solid).
Daily Bottom Line Width: Set the line thickness (1 to 5; default: 2).
Daily Show Background?: Enable/disable background shading between the high and low (default: true).
Daily Background Color: Choose the background color (default: orange).
Daily Background Transparency: Set transparency level (0 = opaque, 100 = fully transparent; default: 92).
Premarket Range Customization
Premarket Top Line Color: Choose the color for the premarket high line (default: green).
Premarket Top Line Style: Select the line style (solid, dashed, dotted; default: solid).
Premarket Top Line Width: Set the line thickness (1 to 5; default: 2).
Premarket Bottom Line Color: Choose the color for the premarket low line (default: red).
Premarket Bottom Line Style: Select the line style (solid, dashed, dotted; default: solid).
Premarket Bottom Line Width: Set the line thickness (1 to 5; default: 2).
Premarket Show Background?: Enable/disable background shading (default: true).
Premarket Background Color: Choose the background color (default: blue).
Premarket Background Transparency: Set transparency level (0 to 100; default: 92).
5-Minute Opening Range Customization
5min Opening Top Line Color: Choose the color for the opening range high line (default: black).
5min Opening Top Line Style: Select the line style (solid, dashed, dotted; default: solid).
5min Opening Top Line Width: Set the line thickness (1 to 5; default: 2).
5min Opening Bottom Line Color: Choose the color for the opening range low line (default: black).
5min Opening Bottom Line Style: Select the line style (solid, dashed, dotted; default: solid).
5min Opening Bottom Line Width: Set the line thickness (1 to 5; default: 2).
GC Special Sessions
Show GC Session Range (9:00 AM - 2:30 PM ET)?: Enable/disable the GC session range from the previous day (default: false).
GC Session Top Color: Choose the color for the GC session high line (default: green).
GC Session Bottom Color: Choose the color for the GC session low line (default: red).
Show London Fix Windows (5-6 AM, 9:30-10:30 AM ET)?: Enable/disable the London Fix windows for the current day (default: false).
London Fix Top Color: Choose the color for the London Fix high line (default: green).
London Fix Bottom Color: Choose the color for the London Fix low line (default: red).
CL Special Sessions
Show CL Session Range (9:00 AM - 2:30 PM ET)?: Enable/disable the CL session range from the previous day (default: false).
CL Session Top Color: Choose the color for the CL session high line (default: green).
CL Session Bottom Color: Choose the color for the CL session low line (default: red).
Show EIA Window (Wed, 10-11 AM ET)?: Enable/disable the EIA window for Wednesdays (default: false).
EIA Window Top Color: Choose the color for the EIA high line (default: green).
EIA Window Bottom Color: Choose the color for the EIA low line (default: red).
How to Use
Add to Chart: Copy the script into TradingView's Pine Editor, then add it to your chart.
Adjust Inputs: Open the indicator settings by double-clicking it on the chart. Modify the inputs as described above to suit your preferences.
Verify Timezone: Ensure the "Timezone Offset" matches your desired timezone for accurate range calculations.
Optional Overrides: Use the "Previous Trading Day Override" if you need to analyze a specific past day, ensuring the format is correct (e.g., "2025-03-19").
This indicator is particularly useful for traders who rely on key price levels from previous sessions, premarket activity, or specific commodity-related time windows (GC and CL).

Live SessionsLive sessions plots the highs and lows of the previous for sessions.
It also marks when these are broken by price.
Default Time Frames are:
London Session = "0000-0600", "UTC-4"
New York Session = "0830-1230", "UTC-4"
Asia Session = "1800-0000", "UTC-4"
New York Close Session = "1330-1630", "UTC-4"
Useful for highlighting when price has gone through a previous session high or low and quickly seeing where liquidity still lies.
Highs, Lows & SessionsHigh Low & Sessions Indicator - Purpose & Usage
The High Low & Sessions indicator is designed to provide key price levels and session-based market insights to help traders make informed decisions. It focuses on daily highs/lows, weekly highs/lows, and major trading sessions to identify support, resistance, and volatility patterns.
Key Functions of the High Low & Sessions Indicator:
Tracks Daily & Weekly Highs and Lows
Previous Day’s High & Low: Helps traders identify breakout points and potential reversals.
Previous Week’s High & Low: Provides key resistance/support levels for swing trading strategies.
Trading Session Zones
London Session: High volatility, often setting the daily trend.
New York Session: Strong liquidity, continuation or reversal of the London move.
Asian Session (Tokyo & Sydney): Lower volatility, potential accumulation phase.

Casa_SessionsLibrary "Casa_Sessions"
Advanced trading session management library that enhances TradingView's default functionality:
Key Features:
- Accurate session detection for futures markets
- Custom session hour definitions
- Drop-in replacements for standard TradingView session functions
- Flexible session map customization
- Full control over trading windows and market hours
Perfect for traders who need precise session timing, especially when working
with futures markets or custom trading schedules.
SetSessionTimes(session_type_input, custom_session_times_input, syminfo_type, syminfo_root, syminfo_timezone)
Parameters:
session_type_input (simple string) : Input string for session selection:
- 'Custom': User-defined session times
- 'FX-Tokyo': Tokyo forex session
- 'FX-London': London forex session
- 'FX-New York': NY forex session
- 'Overnight Session (ON)': After-hours trading
- 'Day Session (RTH)': Regular trading hours
custom_session_times_input (simple string) : Session parameter for custom time windows
Only used when session_type_input is 'Custom'
syminfo_type (simple string)
syminfo_root (simple string)
syminfo_timezone (simple string)
Returns:
session_times: Trading hours for selected session
session_timezone: Market timezone (relevant for forex)
getSessionMap()
Get futures trading session hours map
Keys are formatted as 'symbol:session', examples:
- 'ES:market' - Regular trading hours (RTH)
- 'ES:overnight' - Extended trading hours (ETH)
- 'NQ:market' - NASDAQ futures RTH
- 'CL:overnight' - Crude Oil futures ETH
Returns: Map
Key: Symbol:session identifier
Value: Session hours in format "HH:MM-HH:MM"
getSessionString(session, symbol, sessionMap)
Returns a session string representing the session hours (and days) for the requested symbol (or the chart's symbol if the symbol value is not provided). If the session string is not found in the collection, it will return a blank string.
Parameters:
session (string) : A string representing the session hour being requested. One of: market (regular trading hours), overnight (extended/electronic trading hours), postmarket (after-hours), premarket
symbol (string) : The symbol to check. Optional. Defaults to chart symbol.
sessionMap (map) : The map of futures session hours. Optional. Uses default if not provided.
inSession(session, sessionMap, barsBack)
Returns true if the current symbol is currently in the session parameters defined by sessionString.
Parameters:
session (string) : A string representing the session hour being requested. One of: market (regular trading hours), overnight (extended/electronic trading hours), postmarket (after-hours), premarket
sessionMap (map) : The map of futures session hours. Optional. Uses default if not provided.
barsBack (int) : Private. Only used by futures to check islastbar. Optional. The default is 0.
ismarket(sessionMap)
Returns true if the current bar is a part of the regular trading hours (i.e. market hours), false otherwise. Works for futures (TradingView's methods do not).
Parameters:
sessionMap (map) : The map of futures session hours. Optional. Uses default if not provided.
Returns: bool
isfirstbar()
Returns true if the current bar is the first bar of the day's session, false otherwise. If extended session information is used, only returns true on the first bar of the pre-market bars. Works for futures (TradingView's methods do not).
Returns: bool
islastbar()
Returns true if the current bar is the last bar of the day's session, false otherwise. If extended session information is used, only returns true on the last bar of the post-market bars. Works for futures (TradingView's methods do not).
Returns: bool
ispremarket(sessionMap)
Returns true if the current bar is a part of the pre-market, false otherwise. On non-intraday charts always returns false. Works for futures (TradingView's methods do not).
Parameters:
sessionMap (map) : The map of futures session hours. Optional. Uses default if not provided.
Returns: bool
ispostmarket(sessionMap)
Returns true if the current bar is a part of the post-market, false otherwise. On non-intraday charts always returns false. Works for futures (TradingView's methods do not).
Parameters:
sessionMap (map) : The map of futures session hours. Optional. Uses default if not provided.
Returns: bool
isfirstbar_regular(sessionMap)
Returns true on the first regular session bar of the day, false otherwise. The result is the same whether extended session information is used or not. Works for futures (TradingView's methods do not).
Parameters:
sessionMap (map) : The map of futures session hours. Optional. Uses default if not provided.
Returns: bool
islastbar_regular(sessionMap)
Returns true on the last regular session bar of the day, false otherwise. The result is the same whether extended session information is used or not. Works for futures (TradingView's methods do not).
Parameters:
sessionMap (map) : The map of futures session hours. Optional. Uses default if not provided.
Returns: bool
isovernight(sessionMap)
Returns true if the current bar is a part of the pre-market or post-market, false otherwise. On non-intraday charts always returns false.
Parameters:
sessionMap (map) : The map of futures session hours. Optional. Uses default if not provided.
Returns: bool
getSessionHighAndLow(session, sessionMap)
Returns a tuple containing the high and low print during the specified session.
Parameters:
session (string) : The session for which to get the high & low prints. Defaults to market.
sessionMap (map) : The map of futures session hours. Optional. Uses default if not provided.
Returns: A tuple containing
getSessionHigh(session, sessionMap)
Convenience function to return the session high. Necessary if you want to call this function from within a request.security expression where you can't return a tuple.
Parameters:
session (string) : The session for which to get the high & low prints. Defaults to market.
sessionMap (map) : The map of futures session hours. Optional. Uses default if not provided.
Returns: The high of the session
getSessionLow(session, sessionMap)
Convenience function to return the session low. Necessary if you want to call this function from within a request.security expression where you can't return a tuple.
Parameters:
session (string) : The session for which to get the high & low prints. Defaults to market.
sessionMap (map) : The map of futures session hours. Optional. Uses default if not provided.
Returns: The low of the session

goose's session + killzone indicatorA powerful, multi-functional TradingView script designed for forex traders. It visually delineates major market sessions—Asia, London, and New York—on the chart, provides customizable session ranges, pip range counters, and configurable “killzone” markers. The indicator allows users to switch between a traditional line-and-fill style and a historical box style for session visualization, offering both real-time and historical context of market ranges.
Key Features:
1. Session Visualization Options:
• Lines & Fill Style:
• Highlights active sessions using dynamic lines and filled areas that update in real-time.
• Displays session high, low, and mid-range boundaries with customizable colors, border widths, and line styles.
• Historical Boxes Style:
• Creates and retains boxes for each past session, enabling users to review historical session ranges over extended periods.
• Each session box is drawn with user-defined fill and border colors, opacity, and line styles, anchored to the session’s high, low, and timeframe.
• Supports viewing multiple historical sessions at once, up to a configurable limit.
2. Pip Range Counters:
• Displays the range of pips for each active session, anchored to a fixed position near the bottom-right corner of the session.
• Uses arrow-style labels (label.style_label_up/down) to maintain a stable visual offset relative to the session, minimizing movement during vertical zoom.
• Customizable text size, color, and vertical offset, ensuring the pip counter remains legible and unobtrusive.
3. Killzone Lines:
• Allows users to define up to 15 custom “killzone” times with specific line colors, styles, and optional labels.
• Each killzone is drawn precisely when the price crosses the user-specified time, marking important market events or transitions.
4. User Configurations:
• Session Times: Fully adjustable start and end times for Asian, London, and New York sessions.
• Color & Style Settings:
• Customizable fill and border colors (with adjustable opacity) for each session style.
• User-friendly dropdowns and checkboxes for setting line styles, widths, and text sizes.
• Display Mode Selector:
• A dropdown (sessionStyle) lets users toggle between “Lines & Fill” and “Historical Boxes” for session visualization.
• Pip Counter and Killzone Settings:
• Options to show or hide pip counters, match label colors to session fills, and configure killzone appearance individually.
5. Robust Utility Functions:
• Functions to parse user-input times, determine if the current time falls within a session, and calculate session ranges.
• Historical session logic that detects session transitions and creates/upgrades boxes accordingly.
How It Works:
• Session Style Selection:
• Users choose their preferred visualization style via the sessionStyle dropdown.
• If “Lines & Fill” is selected, the indicator plots dynamic lines and fills during active sessions.
• If “Boxes” is selected, the indicator creates historical boxes that outline the range of each past session, persisting on the chart until session boundaries change.
• Pip Counter Labeling:
• During an active session, the pip counter calculates the range between the session’s high and low and displays it as text positioned just below the bottom-right corner of the session.
• The use of arrow-style labels ensures the text remains at a stable visual distance from the session’s outline, even when zooming vertically.
• Killzones:
• Users can define specific times (“killzones”) where important market events occur.
• When the price crosses these times, the script draws lines and optional labels with user-defined appearance settings.
Ideal Use Cases:
• Real-Time Trading: Quickly identify current session ranges, pip sizes, and crucial killzone markers during live trading.
• Historical Analysis: Switch to Historical Boxes to review past session ranges over days, weeks, or months, aiding in pattern recognition and strategy refinement.
• Customization: Tailor the appearance to match personal preferences or chart themes, including colors, styles, line widths, and label sizes.
This comprehensive indicator combines real-time session tracking with historical range visualization and customizable killzones. Its dual display modes, extensive settings, and stable pip counter labels make it a versatile tool for forex traders seeking to analyze market sessions both in the moment and retrospectively.

Globex Trap ZoneGlobex Trap Indicator
A powerful tool designed to identify potential trading opportunities by analyzing the relationship between Globex session ranges and Supply & Demand zones during regular trading hours.
Key Features
Tracks and visualizes Globex session price ranges
Identifies key Supply & Demand zones during regular trading hours
Highlights potential trap areas where price might experience significant reactions
Fully customizable time ranges and visual settings
Clear labeling of Globex highs and lows
How It Works
The indicator tracks two key periods:
Globex Session (Default: 6:00 PM - 9:30 AM)
Monitors overnight price action
Marks session high and low
Helps identify potential range breakouts
Supply & Demand Zone (Default: 8:00 AM - 11:00 AM)
Tracks price action during key market hours
Identifies potential reaction zones
Helps spot institutional trading areas
Best Practices for Using This Indicator
Use on 1-hour timeframe or lower for optimal visualization
Best suited for futures and other instruments traded during Globex sessions
Pay attention to areas where Globex range and Supply/Demand zones overlap
Use in conjunction with your existing trading strategy for confirmation
Recommended minimum of 10 days of historical data for context
Settings Explanation
Globex Session: Customizable time range for overnight trading session
Supply & Demand Zone: Adjustable time range for regular trading hours
Days to Look Back: Number of historical days to display (default: 10)
Visual Settings: Customizable colors and transparency for both zones
Important Notes
All times are based on exchange timezone
The indicator respects overnight sessions and properly handles timezone transitions
Historical data requirements: Minimum 10 days recommended
Performance impact: Optimized for smooth operation with minimal resource usage
Disclaimer
Past performance is not indicative of future results. This indicator is designed to be used as part of a comprehensive trading strategy and should not be relied upon as the sole basis for trading decisions.
Updates and Support
I actively maintain this indicator and welcome feedback from the trading community. Please feel free to leave comments or suggestions for improvements.

Algos Asia Sweep"Algos Asia Sweep" Indicator is here to help "Asia sweep" traders with statistics and technical analysis.
This indicator includes three main parts:
1. It shows the three major sessions (Asia, London, and New York) as three boxes on the chart, so users can easily find the difference in volume and volatility in each session and use it to take trades with their own strategy.
2. It displays a "statistics table" in the upper-right corner of the chart with information about the breakouts of Asia session highs and lows during the last X days (the number of days used for the calculations can be changed depending on different timeframes and the TradingView edition the user has; it appears in the "session counted" row).
3. It indicates on each day if the Asia session high/low has been broken by creating a circle above the first bar that breaks the Asia high and below the first bar that breaks the Asia low. In addition, it creates a horizontal line at the last session's Asia low and high if they have not yet been broken.
HOW THE CALCULATIONS WORK?
Every day, the script finds each session's high and low. The script counts the number of Asia sessions that have occurred since it started working, and on each day, it identifies if the Asia session high/low/both have been broken. At the end, the indicator divides the number of times the Asia session high/low/both have been broken by the number of sessions executed.
-The indicator is set to GMT+3. Change it to your timezone.
-The indicator can't be used in higher timeframes than 4H, and it is not recommended to use it in higher timeframes than 1H.
-Everything you get from this indicator is NOT considered trading advice. The programmer is not a financial advisor. Any action/decision you make based on this indicator is at your own discretion. Always do your own research and trade only based on your personal judgment.
I would like to know your opinion about using this indicator. Please let me know in the comments.

[AlbaTherium] Sessional & Daily's liquidities - Beta Sessional & Daily Liquidities - Beta: Harnessing the Power of the Institutional Funding Candle (IFC) in Trading
Introduction:
The Sessional & Daily Liquidities - Beta indicator places the Institutional Funding Candle (IFC) at its core. Within the realm of trading, the IFC stands as a key signal for identifying Points of Interest (POIs) , offering traders invaluable insights into market dynamics. This document aims to illuminate the central role of the IFC within the Sessional & Daily Liquidities - Beta indicator, explaining how it can be effectively utilized to spot significant changes in the market and seize trading opportunities.
Chapter 1: Sessional Liquidity concepts
The forex market can be broken up into four major trading sessions: the Sydney session, the Tokyo session, the London session, and Trump’s favorite time to tweet (before he was banned), the New York session.
Historically, the forex market has three peak trading sessions. Traders often focus on one of the three trading periods, rather than attempt to trade the markets 24 hours per day. This is known as the “forex 3-session system“. These sessions consist of the Asian, European, and North American sessions, which are also called Tokyo, London, and New York sessions.
For that reason, a lot of trader put their stoploss right at the High or Low of their session, filling these price levels with liquidities. The market loves liquidities, they are like the “fuel” of the market. Price usually goes to these levels, takes out all the liquidities, and then returns to its original direction. This price behaviour indicates the presence of players – banks, institutions,... – driving the market to their own profit.
The same logic applies with Daily, Weekly and Monthly high/low levels.
Chapter 2: Deciphering the Institutional Funding Candle
2.1 Unveiling the Essence of the Institutional Funding Candle (IFC)
- IFC concept is the core of this indicator. It is recommended to use this indicator on high timeframes, like 1H or 4H charts, as those are the timeframes which big players look at.
- The presence of IFC candles means a significant amount of stop loss is triggered, and price have a tendency to reverse.
2.2 Criteria for IFC Identification
The definition of specific conditions that characterize an IFC within the Sessional & Daily Liquidities - Beta indicator:
- A breach of Previous day, Previous week, or Previous month’s High or Low levels or a breach of major Session Highs or Lows.
- Price made an immediate reverse, creating a decent distance from the wicks.
Chapter 2: Trading Strategies with the IFC
User should treat these signals with cautions, and only take trades with multi confluences.
This pictures below demonstrate a strategy to trade with this indicator, taking 1H HTF trend and 5m LTF ChoCh and Single Candle Order Block as confluences.
Conclusion:
The Sessional & Daily Liquidities - Beta indicator, centered around the Institutional Funding Candle (IFC), stands as a potent tool for traders, offering them the means to spot critical inflection points in the market. By understanding the role of the IFC in violating significant swing highs or lows and major session highs or lows, traders can make informed decisions and seize opportunities within the ever-evolving realm of financial markets. It's crucial to note that while IFC candle colors can provide insights, they do not unilaterally dictate market direction. Furthermore, candle closure can be a valuable consideration in specific situations, particularly when evaluating other High Time Frame POIs.
The real-world examples presented in this document within the Sessional & Daily Liquidities - Beta indicator offer a tangible insight into the world of IFC trading. Harness the potential of the Institutional Funding Candle within the Sessional & Daily Liquidities - Beta indicator to elevate your trading strategies and make well-informed decisions in the dynamic landscape of financial markets.

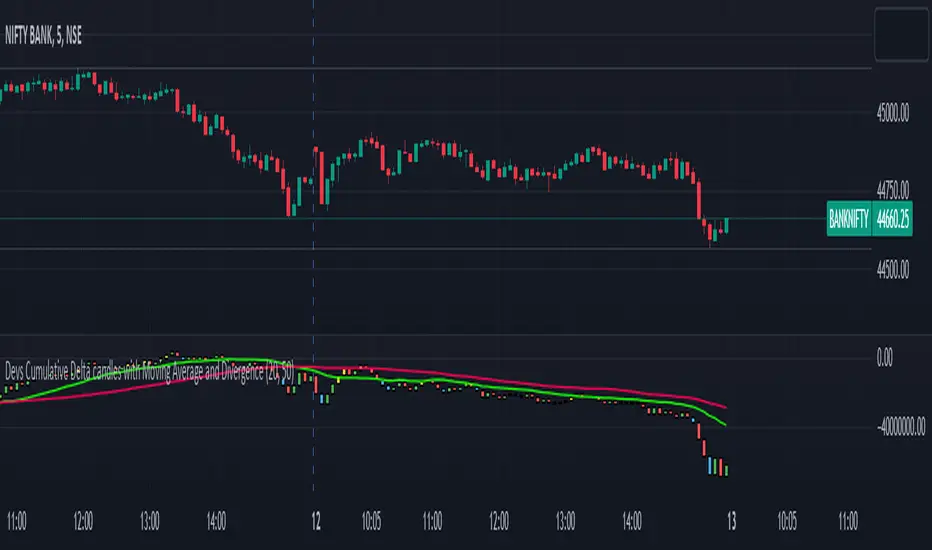
Devs Cumulative Delta candles with Moving Average and DivergenceDELTA = BUY Volume – SELL Volumes
Delta = Positive => Aggressiveness on the Buy side
Delta = Negative => Aggressiveness on the Sell side
If delta is greater than 0 you have more buying than selling pressure. If delta is less than 0, you have more selling than buying pressure.
When there is more Buying than Selling (Delta=Positive), the price candle is Green and when there is more Selling than Buying (Delta=Negative), the price candle is Red. We use delta to understand the relationship between buying or selling pressure and price.
Let’s imagine a price bar that reached the low for the day but delta was actually positive and the bar closed higher than it opened.
In simple terms we can describe this as:
Price made a new low
The bar closed higher
Delta demonstrated more buying than selling : Volume delta is a key metric to understand when making trading decisions based on volume and order flow. However, on its own it can be too much information to interpret quickly when trading in a volatile market.
What are Delta Bars?
Delta Bars is a candlestick representation of Delta. In other words, it has an Open, High (also called Delta Max), Low (also called Delta Min) and Close point in every candle (1min, 5min, 30min etc.)
The Delta Open in every candle is always 0
The Delta Close is the cumulative BUY less cumulative SELL at the close if the candle
The Delta Max is the maximum value of Delta during the candle session (lowest Delta Max possible = 0)
The Delta Min is the minimum value of Delta during the candle session (highest Delta Min possible = 0) The Delta bars are uncorrelated to the Tick Multiplier of the symbol.
Generally you would expect Price to move UP when Delta is positive and Price to move DOWN when Delta is negative. So what happens when the above rule is not followed. We have Divergence
Divergence:
Any two parameters that should be in sync (Price and Delta in this case) towards supporting a particular move (Up or Down) but are in reality not (in sync) form a Divergence
Cumulative volume delta takes the delta values for every bar and successively adds them together to visually provide as seen in the chart.
While volume delta is great for comparing delta bar to bar, cumulative volume delta is useful when determining buying or selling pressure at different price levels such as swing highs or lows. I just gave you a details regarding delta and delta bars.
What details would you see in the indicator??
When you apply this indicator on the chart, you will find the CD(Cumulative delta) candles, which move up and down the way price moves in a chart. Moreover, in case of a divergence, you will find a change in colour of delta candles. If the price is still green but the delta is negative, you will find a bullish divergence, marked with Yellow colour and if the price is red and you have a positive delta, you will have a bearish divergence, marked with blue coloured delta candle. Usually it has been seen that a repeated divergence generally depicts end of a trend or slow down of a trend.
Moreover, I have placed 2 moving averages in the script which you can customize as per your needs. I prefer 20 and 50 day MA for better accuracy as most reversals happen at 20 and 50 day MA.
This indicator works in almost all index, stocks, currencies excepting few where the volume past is invisible. This indicator purely works taking the buying and selling volume into consideration. Sometimes when you change the timeframe in chart, you may have to manually adjust for the display in chart.