S&P Short-Range Oscillator**SHOULD BE USED ON THE S&P 500 ONLY**
The S&P Short-Range Oscillator (SRO), inspired by the principles of Jim Cramer's oscillator, is a technical analysis tool designed to help traders identify potential buy and sell signals in the stock market, specifically for the S&P 500 index. The SRO combines several market indicators to provide a normalized measure of market sentiment, assisting traders in making informed decisions.
The SRO utilizes two simple moving averages (SMAs) of different lengths: a 5-day SMA and a 10-day SMA. It also incorporates the daily price change and market breadth (the net change of closing prices). The 5-day and 10-day SMAs are calculated based on the closing prices. The daily price change is determined by subtracting the opening price from the closing price. Market breadth is calculated as the difference between the current closing price and the previous closing price.
The raw value of the oscillator, referred to as SRO Raw, is the sum of the daily price change, the 5-day SMA, the 10-day SMA, and the market breadth. This raw value is then normalized using its mean and standard deviation over a 20-day period, ensuring that the oscillator is centered and maintains a consistent scale. Finally, the normalized value is scaled to fit within the range of -15 to 15.
When interpreting the SRO, a value below -5 indicates that the market is potentially oversold, suggesting it might be a good time to start buying stocks as the market could be poised for a rebound. Conversely, a value above 5 suggests that the market is potentially overbought. In this situation, it may be prudent to hold on to existing positions or consider selling if you have substantial gains.
The SRO is visually represented as a blue line on a chart, making it easy to track its movements. Red and green horizontal lines mark the overbought (5) and oversold (-5) levels, respectively. Additionally, the background color changes to light red when the oscillator is overbought and light green when it is oversold, providing a clear visual cue.
By incorporating the S&P Short-Range Oscillator into your trading strategy, you can gain valuable insights into market conditions and make more informed decisions about when to buy, sell, or hold your stocks. However, always consider other market factors and perform your own analysis before making any trading decisions.
The S&P Short-Range Oscillator is a powerful tool for traders looking to gain insights into market sentiment. It provides clear buy and sell signals through its combination of multiple indicators and normalization process. However, traders should be aware of its lagging nature and potential complexity, and use it in conjunction with other analysis methods for the best results.
Disclaimer
The S&P Short-Range Oscillator is for informational purposes only and should not be considered financial advice. Trading involves risk, and you should conduct your own research or consult a financial advisor before making investment decisions. The author is not responsible for any losses incurred from using this indicator. Use at your own risk.
Pesquisar nos scripts por "sentiment"

Cumulative Volume Difference MapThe "Cumulative Volume Difference Map" is designed to help traders and market analysts understand volume trends over various timeframes. This script analyzes the difference between cumulative positive and negative volume to provide a trend outlook based on volume changes compared to previous bars, by calculating the cumulative positive and negative volume, then deriving a ratio that represents the difference between these volumes. By examining this ratio over different timeframes, the indicator helps identify whether the market sentiment is trending positively or negatively.
Key Features
Volume Analysis:
The script accumulates volume for periods where the closing price is higher or lower than the previous bar, providing a clear picture of buying versus selling pressure.
Trend Detection:
It evaluates the volume ratio over multiple look-back periods, allowing users to see how the trend develops over different timeframes. This multi-period analysis helps in identifying consistent trends and potential reversals.
Visual Representation:
The indicator plots trend signals on the chart, visually representing whether the volume trend is positive or negative over various historical periods.
How to Use
Trend Identification:
Use this indicator to identify periods of sustained buying or selling pressure. Positive trends indicate more cumulative buying volume, while negative trends suggest more cumulative selling volume.
Multi-Period Analysis:
Analyze the trend signals over different timeframes to understand both short-term and long-term volume trends. This can help in making informed trading decisions based on the overall market sentiment.
Chart Integration:
The plotted signals can be used alongside other technical indicators to confirm trends or spot divergences, enhancing your overall market analysis strategy.

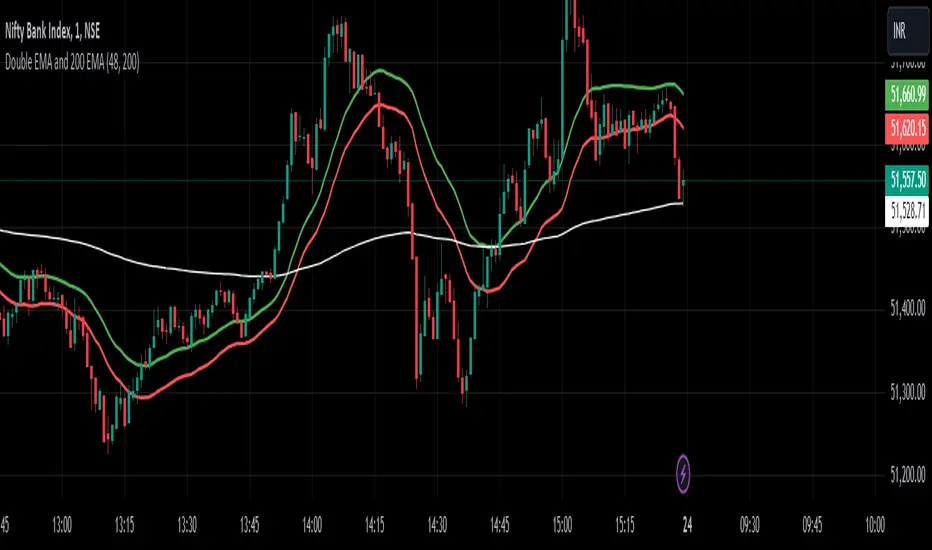
Jikdi Double EMA and 200 EMA Double EMA and 200 EMA Indicator
Overview:
The Double EMA and 200 EMA indicator combines two exponential moving averages (EMA) to provide insights into short-term and longer-term trends in a financial instrument's price movements.
Components:
Double EMA:
Calculation: The Double EMA is derived by applying the EMA formula twice to a given price series. First, an EMA is calculated based on a specified length (parameter). Then, a second EMA is computed on the first EMA result, resulting in a smoother moving average that reacts more quickly to recent price changes compared to a single EMA.
Purpose: The Double EMA helps traders identify short-term trends by smoothing out price fluctuations, making it easier to spot potential entry and exit points based on momentum shifts.
200 EMA:
Calculation: The 200 EMA is calculated by applying the EMA formula to the closing prices of the financial instrument over a longer period, typically 200 periods.
Purpose: The 200 EMA is widely used by traders and analysts to assess the long-term trend direction of an asset. It acts as a key support or resistance level and is considered significant in determining the overall market sentiment and potential reversals.
Usage:
Short-term Trading: Traders use the Double EMA to identify short-term trends and trade opportunities. When the Double EMA crosses above the price, it may signal a bullish trend, while a cross below the price could indicate a bearish trend.
Long-term Analysis: The 200 EMA serves as a reference for long-term trend analysis. Prices trading above the 200 EMA suggest a bullish bias, while trading below it indicates a bearish sentiment.
Interpretation:
Crossovers: Crosses between the Double EMA and the 200 EMA or crosses of the Double EMA with the price can be potential signals for entry or exit positions, depending on the trading strategy employed.
Trend Confirmation: Traders often look for confluence between short-term (Double EMA) and long-term (200 EMA) trends to confirm the strength of a trend or to identify potential reversals.
Conclusion:
The Double EMA and 200 EMA indicator provides a comprehensive view of both short-term momentum and longer-term trend direction. By combining these moving averages, traders can make informed decisions based on the dynamics of price movements and trend confirmations.
Wall Street Cheat Sheet IndicatorThe Wall Street Cheat Sheet Indicator is a unique tool designed to help traders identify the psychological stages of the market cycle based on the well-known Wall Street Cheat Sheet. This indicator integrates moving averages and RSI to dynamically label market stages, providing clear visual cues on the chart.
Key Features:
Dynamic Stage Identification: The indicator automatically detects and labels market stages such as Disbelief, Hope, Optimism, Belief, Thrill, Euphoria, Complacency, Anxiety, Denial, Panic, Capitulation, Anger, and Depression. These stages are derived from the emotional phases of market participants, helping traders anticipate market movements.
Technical Indicators: The script uses two key technical indicators:
200-day Simple Moving Average (SMA): Helps identify long-term market trends.
50-day Simple Moving Average (SMA): Aids in recognizing medium-term trends.
Relative Strength Index (RSI): Assesses the momentum and potential reversal points based on overbought and oversold conditions.
Clear Visual Labels: The current market stage is displayed directly on the chart, making it easy to spot trends and potential turning points.
Usefulness:
This indicator is not just a simple mashup of existing tools. It uniquely combines the concept of market psychology with practical technical analysis tools (moving averages and RSI). By labeling the psychological stages of the market cycle, it provides traders with a deeper understanding of market sentiment and potential future movements.
How It Works:
Disbelief: Detected when the price is below the 200-day SMA and RSI is in the oversold territory, indicating a potential bottom.
Hope: Triggered when the price crosses above the 50-day SMA, with RSI starting to rise but still below 50, suggesting an early uptrend.
Optimism: Occurs when the price is above the 50-day SMA and RSI is between 50 and 70, indicating a strengthening trend.
Belief: When the price is well above the 50-day SMA and RSI is between 70 and 80, showing strong bullish momentum.
Thrill and Euphoria: Identified when RSI exceeds 80, indicating overbought conditions and potential for a peak.
Complacency to Depression: These stages are identified based on price corrections and drops relative to moving averages and declining RSI values.
Best Practices:
High-Time Frame Focus: This indicator works best on high-time frame charts, specifically the 1-week Bitcoin (BTCUSDT) chart. The longer time frame provides a clearer picture of the overall market cycle and reduces noise.
Trend Confirmation: Use in conjunction with other technical analysis tools such as trendlines, Fibonacci retracement levels, and support/resistance zones for more robust trading strategies.
How to Use:
Add the Indicator: Apply the Wall Street Cheat Sheet Indicator to your TradingView chart.
Analyze Market Stages: Observe the dynamic labels indicating the current stage of the market cycle.
Make Informed Decisions: Use the insights from the indicator to time your entries and exits, aligning your trades with the market sentiment.
This indicator is a valuable tool for traders looking to understand market psychology and make informed trading decisions based on the stages of the market cycle.

CPR by MTThe CPR indicator, or Central Pivot Range indicator, is a technical analysis tool used in trading to identify potential support and resistance levels based on the price action of a security. Developed by pivot point theory, it is particularly popular among day traders and swing traders. The CPR indicator consists of three lines:
1. **Pivot Point (PP):** This is the central line and is calculated as the average of the high, low, and closing prices from the previous trading period.
\
2. **Top Central Pivot (TC):** This is calculated by subtracting the low from the PP and then adding the result to the PP.
\
3. **Bottom Central Pivot (BC):** This is calculated by subtracting the high from the PP and then adding the result to the PP.
\
### How to Use the CPR Indicator
- **Trend Identification:** A wide CPR range indicates low volatility and a potential sideways or consolidation phase. A narrow CPR range indicates high volatility and a potential strong trending move.
- **Support and Resistance:** The top and bottom central pivots act as immediate resistance and support levels. If the price is above the TC, it indicates a bullish sentiment, while if it is below the BC, it indicates a bearish sentiment.
- **Entry and Exit Points:** Traders use the CPR lines to determine optimal entry and exit points. For example, if the price breaks above the TC and sustains, it may signal a buy opportunity, whereas a drop below the BC may signal a sell opportunity.
### Practical Example
Suppose a stock had a high of $105, a low of $95, and a closing price of $100 on the previous day. The CPR levels for the next day would be calculated as follows:
1. **Pivot Point (PP):**
\
2. **Top Central Pivot (TC):**
\
3. **Bottom Central Pivot (BC):**
\
The levels for the next day would be PP = $100, TC = $110, and BC = $90. Traders would then use these levels to assess potential trading strategies based on where the price moves relative to these levels.
### Conclusion
The CPR indicator is a useful tool for traders looking to understand market conditions and make informed decisions about entry and exit points. Its effectiveness comes from its ability to highlight key price levels derived from historical price data, helping traders predict potential market movements.

Oscillator Suite [KFB Quant]Oscillator Suite is a indicator designed to revolutionize your trading strategy. Developed by kikfraben, this innovative tool aggregates eleven powerful oscillators into one intuitive interface, providing you with a comprehensive view of market sentiment like never before.
Originality and Innovation:
Unlike traditional indicators that focus on single aspects of market analysis, Oscillator Suite stands out by integrating multiple oscillators, making it a pioneering solution in technical analysis. This unique approach empowers traders to gain deeper insights into market dynamics and make more informed trading decisions.
Functionality:
Oscillator Suite calculates signals for each selected oscillator based on its specific formula, offering a diverse range of market insights. Whether you're assessing trend strength, market momentum, or price movements, this indicator has you covered.
Aggregated Score:
The indicator combines signals from all chosen oscillators into an aggregated score, providing a holistic assessment of market sentiment. This aggregated score serves as a powerful tool for identifying trends and potential trading opportunities.
Customization and Ease of Use:
With customizable parameters such as colors, smoothing options, and oscillator settings, Oscillator Suite can be tailored to suit your unique trading style and preferences. Its user-friendly interface makes it easy to interpret and act upon the information presented.
How to Use:
Identify Trends: Analyze the aggregated score and individual oscillator signals to identify prevailing market trends.
Confirm Trade Signals: Use multiple oscillator alignments to strengthen the conviction behind trade signals.
Manage Risk: Gain insight into potential reversals or trend continuations to effectively manage risk.
This is not financial advice. Trading is risky & most traders lose money. Past performance does not guarantee future results. This indicator is for informational & educational purposes only.

Uptrick: MultiMA_VolumePurpose:
The "Uptrick: MultiMA_Volume" indicator, identified by its abbreviated title 'MMAV,' is meticulously designed to provide traders with a comprehensive view of market dynamics by incorporating multiple moving averages (MAs) and volume analysis. With adjustable inputs and customizable visibility options, traders can tailor the indicator to their specific trading preferences and strategies, thereby enhancing its utility and usability.
Explanation:
Input Variables and Customization:
Traders have the flexibility to adjust various parameters, including the lengths of different moving averages (SMA, EMA, WMA, HMA, and KAMA), as well as the option to show or hide each moving average and volume-related components.
Customization options empower traders to fine-tune the indicator according to their trading styles and market preferences, enhancing its adaptability across different market conditions.
Moving Averages and Trend Identification:
The script computes multiple types of moving averages, including Simple (SMA), Exponential (EMA), Weighted (WMA), Hull (HMA), and Kaufman's Adaptive (KAMA), allowing traders to assess trend directionality and strength from various perspectives.
Traders can determine potential price movements by observing the relationship between the current price and the plotted moving averages. For example, prices above the moving averages may suggest bullish sentiment, while prices below could indicate bearish sentiment.
Volume Analysis:
Volume analysis is integrated into the indicator, enabling traders to evaluate volume dynamics alongside trend analysis.
Traders can identify significant volume spikes using a customizable threshold, with bars exceeding the threshold highlighted to signify potential shifts in market activity and liquidity.
Determining Potential Price Movements:
By analyzing the relationship between price and the plotted moving averages, traders can infer potential price movements.
Bullish biases may be suggested when prices are above the moving averages, accompanied by rising volume, while bearish biases may be indicated when prices are below the moving averages, with declining volume reinforcing the potential for downward price movements.
Utility and Potential Usage:
The "Uptrick: MultiMA_Volume" indicator serves as a comprehensive tool for traders, offering insights into trend directionality, strength, and volume dynamics.
Traders can utilize the indicator to identify potential trading opportunities, confirm trend signals, and manage risk effectively.
By consolidating multiple indicators into a single chart, the indicator streamlines the analytical process, providing traders with a concise overview of market conditions and facilitating informed decision-making.
Through its customizable features and comprehensive analysis, the "Uptrick: MultiMA_Volume" indicator equips traders with actionable insights into market trends and volume dynamics. By integrating trend analysis and volume assessment into their trading strategies, traders can navigate the markets with confidence and precision, thereby enhancing their trading outcomes.

[BT] NedDavis Series: CPI Minus 5-Year Moving Average🟧 GENERAL
The script works on the Monthly Timeframe and has 2 main settings (explained in FEATURES ). It uses the US CPI data, reported by the Bureau of Labour Statistics.
🔹Functionality 1: The main idea is to plot the distance between the CPI line and the 5 year moving average of the CPI line. This technique in mathematics is called "deviation from the moving average". This technique is used to analyse how has CPI previously acted and can give clues at what it might do in the future. Economic historians use such analysis, together with specific period analysis to predict potential risks in the future (see an example of such analysis in HOW TO USE section. The mathematical technique is a simple subtraction between 2 points (CPI - 5yr SMA of CPI).
▶︎Interpretation for deviation from a moving average:
Positive Deviation: When the line is above its moving average, it indicates that the current value is higher than the average, suggesting potential strength or bullish sentiment.
Negative Deviation: Conversely, when the line falls below its moving average, it suggests weakness or bearish sentiment as the current value is lower than the average.
▶︎Applications:
Trend Identification: Deviations from moving averages can help identify trends, with sustained deviations indicating strong trends.
Reversal Signals: Significant deviations from moving averages may signal potential trend reversals, especially when combined with other technical indicators.
Volatility Measurement: Monitoring the magnitude of deviations can provide insights into market volatility and price movements.
Remember the indicator is applying this only for the US CPI - not the ticker you apply the indicator on!
🔹Functionality 2: It plots on a new pane below information about the Consumer Price Index. You can also find the information by plotting the ticker symbol USACPIALLMINMEI on TradingView, which is a Monthly economic data by the OECD for the CPI in the US. The only addition you would get from the indicator is the plot of the 5 year Simple Moving Average.
🔹What is the US Consumer Price Index?
Measures the change in the price of goods and services purchased by consumers;
Traders care about the CPI because consumer prices account for a majority of overall inflation. Inflation is important to currency valuation because rising prices lead the central bank to raise interest rates out of respect for their inflation containment mandate;
It is measured as the average price of various goods and services are sampled and then compared to the previous sampling.
Source: Bureau of Labor Statistics;
FEATURES OF INDICATOR
1) The US Consumer Price Index Minus the Five Year Moving Average of the same.
As shown on the picture above and explained in previous section. Here a more detailed view.
2) The actual US Consumer Price Index (Annual Rate of change) and the Five year average of the US Consumer Price Index. Explained above and shown below:
To activate 2) go into settings and toggle the check box.
HOW TO USE
It can be used for a fundamental analysis on the relationship between the stock market, the economy and the Feds decisions to hike or cut rates, whose main mandate is to control inflation over time.
I have created this indicator to show my analysis in this idea:
What does a First Fed Rate cut really mean?
CREDITS
I have seen such idea in the past posted by the institutional grade research of NedDavis and have recreated it for the TradingView platform, open-source for the community.

Uptrick: TrendVol IndicatorPurpose:
The "Uptrick: TrendVol Indicator," known by its abbreviated title 'U:TVI,' is meticulously crafted to offer traders insights into both trend strength and volume dynamics within the market. By visualizing trend strength relative to a moving average, analyzing volume activity, and assessing potential price movements, traders can make informed decisions and navigate the markets more effectively.
Explanation:
Moving Averages and Trend Direction:
The script computes a moving average (MA) over a specified period, allowing traders to gauge the prevailing trend direction.
Trend strength is assessed by measuring the distance between the closing price and the moving average, providing a quantitative representation of market momentum.
By comparing the current price relative to the moving average, traders can determine potential price directionality, with prices above the MA suggesting bullish sentiment and prices below indicating bearish sentiment.
Volatility Analysis:
Volatility is measured using the Average True Range (ATR) indicator over a user-defined period, aiding traders in assessing the potential range of price movements.
By plotting the ATR value alongside trend strength, traders gain valuable insights into both trend stability and potential breakout opportunities.
Additional Moving Averages and Multiple Time Frame Analysis:
The script incorporates another moving average (MA2) over a different period, enabling traders to conduct multiple time frame analysis and validate trend signals across different time frames.
The inclusion of MA2 enhances the robustness of trend identification and facilitates a more comprehensive understanding of market trends.
Volume Analysis:
Volume analysis is conducted by computing a moving average of volume over a specified period, allowing traders to discern patterns of increasing or decreasing volume activity.
Bars with volume exceeding a predefined threshold are highlighted, providing traders with insights into significant volume spikes that may accompany price movements.
Determining Potential Price Movements:
Traders can utilize the "Uptrick: TrendVol Indicator" to assess the likelihood of potential price movements.
A bullish bias may be inferred when the current price is above both the moving average and the volume-weighted average price (VWAP), accompanied by rising volume.
Conversely, a bearish bias may be indicated when the price is below both the moving average and the VWAP, with declining volume reinforcing the potential for downward price movements.
Utility and Potential Usage:
The indicator serves as a powerful tool for traders, offering a holistic view of market dynamics encompassing trend strength, volume activity, and potential price movements.
Traders can leverage the insights provided by the indicator to identify trading opportunities, manage risk effectively, and capitalize on emerging market trends with confidence.
Through its comprehensive design and advanced features, the "Uptrick: TrendVol Indicator" equips traders with actionable insights into market dynamics, enabling them to make well-informed trading decisions and navigate the markets with precision.

Uptrick: EMA SMA Support Resistance HistogramPurpose:
The "Uptrick: EMA SMA Support Resistance Histogram" indicator, known by its short title 'UESH,' is meticulously crafted to offer traders a comprehensive view of potential support and resistance levels, leveraging the crossovers between the Exponential Moving Average (EMA) and Simple Moving Average (SMA). Its distinctive feature lies in the visualization of these crossovers through histogram bars, providing traders with an intuitive representation of market momentum and possible reversal points.
Explanation:
Input Parameters:
Traders benefit from the flexibility to tailor the length of both the SMA and EMA according to their trading strategies and market preferences.
The 'Source' parameter allows users to select the data series upon which the calculations are based, typically the closing price.
Additionally, the option to toggle the visibility of the histogram enhances the indicator's adaptability to different analytical approaches.
Moving Averages:
The script diligently computes both the SMA and EMA based on the specified lengths and the chosen data source.
The SMA (Simple Moving Average) acts as a smoothing mechanism, averaging price data over a defined period to discern underlying trends.
On the other hand, the EMA (Exponential Moving Average) places greater weight on recent price data, making it more responsive to short-term price fluctuations.
Cross Detection:
A hallmark of this indicator is its adeptness in identifying crossover and crossunder events between the EMA and SMA, signaling potential shifts in market sentiment.
A green color is assigned to the EMA when it crosses above the SMA (crossover), indicating bullish momentum.
Conversely, a red color is applied when the EMA crosses below the SMA (crossunder), signaling bearish momentum.
In the absence of a crossover, both lines are colored blue, denoting a neutral state.
Support and Resistance Visualization through Histogram Bars:
A notable feature of this indicator is its ability to delineate potential support and resistance levels through histogram bars.
The script calculates the disparity between the source data and the SMA, effectively capturing deviations from the prevailing trend.
Positive deviations (source above SMA) are represented by green histogram bars, highlighting potential support zones.
Conversely, negative deviations (source below SMA) manifest as red histogram bars, indicating potential resistance areas.
The length of the histogram bars is customizable, allowing traders to fine-tune the sensitivity to price movements based on their preferences and trading strategies.
In summary through it's dynamic features and meticulous design, this indicator empowers traders with actionable insights into market dynamics, facilitating informed trading decisions with regards to potential support and resistance levels. The inclusion of histogram bars enhances its analytical prowess, providing a visual representation of price deviations and reinforcing traders' ability to interpret market sentiment effectively.

Trend Fusion: ADX&EMA+IchimokuTrend Fusion: ADX & EMA+Ichimoku is an innovative indicator designed to provide traders with comprehensive insights into market trends. Combining the power of the Average Directional Index (ADX) with Exponential Moving Averages (EMA) and the Ichimoku Cloud, this indicator offers a sophisticated approach to trend analysis.
This indicator stands out for its unique integration of multiple trend-following indicators, offering traders a holistic view of market dynamics. Unlike traditional trend indicators that focus solely on price movements, Trend Fusion incorporates the ADX, EMA, and Ichimoku Cloud to provide a more nuanced understanding of trend strength and direction. By combining these indicators, traders can make more informed decisions and enhance their trading strategies.
How it works:
Trend Fusion generates buy and sell signals based on the convergence of these indicators. A combination of strong ADX readings, EMA crossovers, and alignment with the Ichimoku Cloud confirms trend direction and provides entry and exit points for traders.
Average Directional Index (ADX): Measures the strength of the prevailing trend by analyzing price movements. A rising ADX indicates a strengthening trend, while a falling ADX suggests weakening momentum.
Exponential Moving Averages (EMA): Detects potential trend reversals through crossover signals. A bullish crossover (fast EMA crossing above slow EMA) suggests an uptrend, while a bearish crossover indicates a downtrend.
Ichimoku Cloud: Provides support and resistance levels along with trend direction. Price movements above the cloud indicate bullish sentiment, while movements below the cloud suggest bearish sentiment.
How to use
Colour codes:
Green Candles: Represent a strong uptrend, indicating robust buying momentum. The intensity of green color deepens with increasing trend strength.
Red Candles: Indicate a strong downtrend, signaling significant selling pressure in the market. The intensity of red color deepens with increasing trend strength.
Yellow Candles: Suggest a weak trend, characterized by indecision and lack of clear direction. The intensity of yellow color varies based on the strength of the trend, with lighter shades indicating weaker trends and darker shades suggesting slightly stronger trends.
Trend Strength: Monitor the ADX to gauge the strength of the prevailing trend. Higher ADX values indicate stronger trends, while lower values suggest weaker trends.
Trend Direction: Confirm trend direction using EMA crossovers and Ichimoku Cloud signals. Look for bullish crossovers and price movements above the cloud for uptrends, and bearish crossovers and movements below the cloud for downtrends.
Entry and Exit Signals: Enter trades when all components align, signaling a strong trend. Use EMA crossovers and cloud confirmations to identify potential entry points, and consider exiting trades when these signals reverse.
The ADX calculation and signal logic are based on the ADX script by PineCoders, with modifications to integrate it into this indicator.
The EMA crossover logic is adapted from the GDAX EMA Cross script by stefano98.
The Ichimoku Cloud calculation and plotting are adapted from the Ichimoku Cloud script by lonesometheblue.
Trading involves risk, and past performance is not indicative of future results. It is recommended to use this indicator alongside other technical analysis tools and risk management strategies.

Fib Pivot Points HLThis TradingView indicator allows users to select a specific timeframe (TF) and then analyzes the high, low, and closing prices from the past period within that TF to calculate a central pivot point. The pivot point is determined using the formula (High + Close + Low) / 3, providing a key level around which the market is expected to pivot or change direction.
In addition to the central pivot point, the indicator enhances its utility by incorporating Fibonacci levels. These levels are calculated based on the range from the low to the high of the selected timeframe. For instance, a Fibonacci level like R0.38 would be calculated by adding 38% of the high-low range to the pivot point, giving traders potential resistance levels above the pivot.
Key features of this indicator include:
Timeframe Selection: Users can choose their desired timeframe, such as weekly, daily, etc., for analysis.
Pivot Point Calculation: The indicator calculates the pivot point based on the previous period's high, low, and closing prices within the selected timeframe.
Fibonacci Levels: Adds Fibonacci retracement levels to the pivot point, offering traders additional layers of potential support and resistance based on the natural Fibonacci sequence.
This indicator is particularly useful for traders looking to identify potential turning points in the market and key levels of support and resistance based on historical price action and the Fibonacci sequence, which is widely regarded for its ability to predict market movements.
Example:
Suppose you're analyzing the EUR/USD currency pair using this indicator with a weekly timeframe setting. The previous week's price action showed a high of 1.2100, a low of 1.1900, and the week closed at 1.2000.
Using the formula ( High + Close + Low ) / 3 (High+Close+Low)/3, the pivot point would be calculated as ( 1.2100 + 1.2000 + 1.1900 ) / 3 = 1.2000. Thus, the central pivot point for the current week is at 1.2000.
The range from the low to the high is 1.2100 − 1.1900 = 0.0200 1.2100−1.1900=0.0200.
To calculate a specific Fibonacci level, such as R0.38, you would add 38% of the high-low range to the pivot point: 1.2000 + ( 0.0200 ∗ 0.38 ) = 1.2076 1.2000+(0.0200∗0.38)=1.2076. Thus, the R0.38 Fibonacci resistance level is at 1.2076.
Similarly, you can calculate other Fibonacci levels such as S0.38 (Support level at 38% retracement) by subtracting 38% of the high-low range from the pivot point.
Traders can use the pivot point as a reference for the market's directional bias: prices above the pivot point suggest bullish sentiment, while prices below indicate bearish sentiment. The Fibonacci levels act as potential stepping stones for price movements, offering strategic points for entry, exit, or placing stop-loss orders.

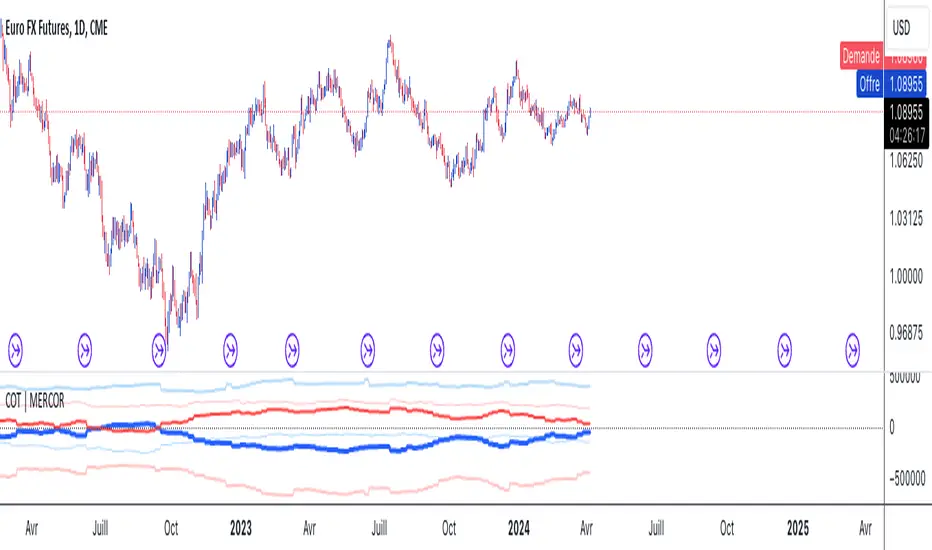
COT | MERCORThis Pine Script is designed for use on the TradingView platform to visualize various Commitment of Traders (COT) data for trading analysis. The COT reports provide a breakdown of each Tuesday’s open interest in the futures markets, which is valuable for understanding market sentiment. This script specifically focuses on displaying the positions of commercial and noncommercial traders (large speculators), both in long and short positions, as well as their net positions. Here’s a breakdown of the script’s components and how to use it:
Script Components
Indicator Declaration: The script begins by declaring a custom indicator using indicator() function, naming it "COT | MERCOR", and setting a short title and precision.
Library Import: It imports a library TradingView/LibraryCOT/2 as cot, which is likely a mock representation for the purpose of this description, assuming a library that provides COT data functions.
User Inputs:
shortNegative: A boolean input that allows users to choose whether short positions are displayed as negative numbers.
invertColors: A boolean input for users to decide if they want to invert the default colors of the plot lines.
lineWidth: An integer input that lets users adjust the width of the plotted lines.
COT Data Requests: The script requests COT data for both commercial and noncommercial traders' long and short positions using cot.COTTickerid() function. This includes constructing identifiers for these data points based on the user's input and predefined criteria (like "Commercial Positions" or "Noncommercial Positions", and direction "Long" or "Short").
Data Plotting: The script plots the retrieved data points on the chart, using different colors and line styles to distinguish between commercial and noncommercial positions, as well as between long, short, and net positions. It includes options to adjust the appearance based on user inputs (like inverting colors or changing line width).
Zero Line: A horizontal line (hline) is plotted at zero to provide a baseline for comparison.
How to Use
Adding the Script to Your Chart:
On TradingView, open the Pine Editor.
Paste this script into the Pine Editor.
Save and add the script to your chart.
Customizing the Display:
You can toggle whether short positions are displayed as negative numbers through the "Show Shorts as Negative Numbers?" checkbox.
Use the "Invert Colors?" checkbox to swap the colors used for plotting the positions.
Adjust the "Line Width" option to change the thickness of the plotted lines according to your preference.
Analyzing the Data:
The plotted lines represent the long, short, and net positions of commercial and noncommercial traders.
Commercial positions are typically considered the positions of entities involved in the production, processing, or merchandising of a commodity, whereas noncommercial positions represent large speculators, such as hedge funds.
The net positions (long minus short) provide insight into the overall bullish or bearish sentiment among these trader categories.
By examining these positions, traders can gain insights into potential market moves based on the behaviors of key market participants.
This script is a powerful tool for traders who want to incorporate COT report data into their market analysis on TradingView. By visualizing the trading positions of significant market players, it aids in making informed trading decisions.
Sequencer [LuxAlgo]The Sequencer indicator is a tool that is able to highlight sequences of prices based on their relative position to past prices, which allows a high degree of customization from the user.
Two phases are included in this script, a "Preparation" phase and a "Lead-Up" phase, each with a customizable amount of steps, as well as other characteristics.
Users can also highlight the last step leading to each phase completion with a level, this level can eventually be used as a key price point.
🔶 USAGE
The script highlights two phases, each being based on a sequence of events requiring prices to be higher/lower than prices various bars ago.
The completion of the preparation phase will lead to the evaluation of the lead-up phase, however, it isn't uncommon to see a reversal occurring after the completion of a preparation phase. In the script, bullish preparations are highlighted in green, while bearish preparations are highlighted in red.
Completion of a "Lead-Up" phase is indicative of a potential reversal, with a bullish reversal for the completion of a bullish lead-up (in blue), and a bearish reversal for the completion of a bearish lead-up (in orange).
Using a higher length for the preparation/lead-up phases can allow the detection of longer-term reversals.
Users wishing to display levels based on specific phases completion can do so from the settings in the "Preparation/Lead-Up Completion Levels" settings group.
The "Show Last" settings determine the amount of respective levels to display on the chart.
🔶 PREPARATION PHASE
The "Preparation" phase precedes the "Lead-Up" phase. The completion of this phase requires N successive prices to be lower than the closing price P bars ago for a bullish phase, and for prices to be higher than the closing price P bars ago for a bearish phase, where N is the user set "Preparation Phase Length" and P the user set "Comparison Period".
🔹 Refined Preparations
Sequences of the preparation phase can either be "Standard" or "Refined". Unlike the standard preparation previously described a refined preparation requires the low prices from the user-specified steps in "Refined Preparation Steps" to be above the low price of the last step for a bullish preparation phase, and for the high prices specified in the refined preparation steps to be below the high price of the last step for a bearish preparation phase.
🔶 LEAD-UP PHASE
The "Lead-Up" phase is initiated by the completion of the "Preparation" phase.
Completion of this phase requires the price to be lower than the low price P bars ago N times for a bullish phase, and for prices to be higher than the high price P bars ago N times for a bearish phase, where N is the user set "Lead-Up Phase Length" and P the user set "Comparison Period".
Unlike with the "Preparation" phase these conditions don't need to be successive for them to be valid and can occur at any time.
🔹 Lead-Up Cancellation
Incomplete "Lead-Up" phases can be canceled and removed from the chart once a preparation of the opposite sentiment is completed, avoiding lead-ups to be evaluated after completion of complete preparations.
This can be disabled by toggling off "Apply Cancellation".
🔹 Lead-Up Suspension
Like with refined preparations, we can require specific steps from the lead-up phase to be higher/lower than the price on the last step. This can be particularly important since we do not require lead-up steps to be successive.
For a bullish lead-up, the low of the last step must be lower than the minimum closing prices of the user-specified steps for it to be valid, while for a bearish lead-up, the high of the last step must be higher than the maximum closing prices of the user-specified steps for it to be valid.
This effectively allows for eliminating lead-up phases getting completed on opposite trends.
🔶 SETTINGS
🔹 Preparation Phase
Preparation Phase Length: Length of the "Preparation" phase.
Comparison Period: Offset used to compare current prices to past ones.
Preparation Type: Type of preparation to evaluate, options include "Standard" or "Refined"
Refined Preparations Steps: Steps to evaluate when preparation type is "Refined"
🔹 Lead-Up Phase
Lead-Up Phase Length: Length of the "Lead-Up" phase.
Comparison Period: Offset used to compare current prices to past ones.
Suspension: Applies suspension rule to evaluate lead-up completion.
Suspension Steps: Specifies the steps evaluated to determine if the lead-up referral is respected. Multiple steps are supported and should be comma-separated.
Apply Cancellation: Cancellation will remove any incomplete lead-up upon the completion of a new preparation phase of the opposite sentiment.
🔹 Levels
Bullish Preparations Levels: When enabled display price levels from completed bullish preparations.
Show Last: Number of most recent bullish preparations levels to display.
Bearish Preparations Levels: When enabled display price levels from completed bearish preparations.
Show Last: Number of most recent bearish preparations levels to display.
Heikin Ashi TSI and OTT [Erebor]TSI (True Strength Index)
The TSI (True Strength Index) is a momentum-based trading indicator used to identify trend direction, overbought/oversold conditions, and potential trend reversals in financial markets. It was developed by William Blau and first introduced in 1991.
Here's how the TSI indicator is calculated:
• Double Smoothed Momentum (DM): This is calculated by applying double smoothing to the price momentum. First, the single smoothed momentum is calculated by subtracting the smoothed closing price from the current closing price. Then, this single smoothed momentum is smoothed again using an additional smoothing period.
• Absolute Smoothed Momentum (ASM): This is calculated by applying smoothing to the absolute value of the price momentum. Similar to DM, ASM applies a smoothing period to the absolute value of the difference between the current closing price and the smoothed closing price.
• TSI Calculation: The TSI is calculated as the ratio of DM to ASM, multiplied by 100 to express it as a percentage. Mathematically, TSI = (DM / ASM) * 100.
The TSI indicator oscillates around a centerline (typically at zero), with positive values indicating bullish momentum and negative values indicating bearish momentum. Traders often look for crossovers of the TSI above or below the centerline to identify shifts in momentum and potential trend reversals. Additionally, divergences between price and the TSI can signal weakening trends and potential reversal points.
Pros of the TSI indicator:
• Smoothed Momentum: The TSI uses double smoothing techniques, which helps to reduce noise and generate smoother signals compared to other momentum indicators.
• Versatility: The TSI can be applied to various financial instruments and timeframes, making it suitable for both short-term and long-term trading strategies.
• Trend Identification: The TSI is effective in identifying the direction and strength of market trends, helping traders to align their positions with the prevailing market sentiment.
Cons of the TSI indicator:
• Lagging Indicator: Like many momentum indicators, the TSI is a lagging indicator, meaning it may not provide timely signals for entering or exiting trades during rapidly changing market conditions.
• False Signals: Despite its smoothing techniques, the TSI can still produce false signals, especially during periods of low volatility or ranging markets.
• Subjectivity: Interpretation of the TSI signals may vary among traders, leading to subjective analysis and potential inconsistencies in trading decisions.
Overall, the TSI indicator can be a valuable tool for traders when used in conjunction with other technical analysis tools and risk management strategies. It can help traders identify potential trading opportunities and confirm trends, but it's essential to consider its limitations and incorporate additional analysis for more robust trading decisions.
Heikin Ashi Candles
Let's consider a modification to the traditional “Heikin Ashi Candles” where we introduce a new parameter: the period of calculation. The traditional HA candles are derived from the open , high low , and close prices of the underlying asset.
Now, let's introduce a new parameter, period, which will determine how many periods are considered in the calculation of the HA candles. This period parameter will affect the smoothing and responsiveness of the resulting candles.
In this modification, instead of considering just the current period, we're averaging or aggregating the prices over a specified number of periods . This will result in candles that reflect a longer-term trend or sentiment, depending on the chosen period value.
For example, if period is set to 1, it would essentially be the same as traditional Heikin Ashi candles. However, if period is set to a higher value, say 5, each candle will represent the average price movement over the last 5 periods, providing a smoother representation of the trend but potentially with delayed signals compared to lower period values.
Traders can adjust the period parameter based on their trading style, the timeframe they're analyzing, and the level of smoothing or responsiveness they prefer in their candlestick patterns.
Optimized Trend Tracker
The "Optimized Trend Tracker" is a proprietary trading indicator developed by TradingView user ANIL ÖZEKŞİ. It is designed to identify and track trends in financial markets efficiently. The indicator attempts to smooth out price fluctuations and provide clear signals for trend direction.
The Optimized Trend Tracker uses a combination of moving averages and adaptive filters to detect trends. It aims to reduce lag and noise typically associated with traditional moving averages, thereby providing more timely and accurate signals.
Some of the key features and applications of the OTT include:
• Trend Identification: The indicator helps traders identify the direction of the prevailing trend in a market. It distinguishes between uptrends, downtrends, and sideways consolidations.
• Entry and Exit Signals: The OTT generates buy and sell signals based on crossovers and direction changes of the trend. Traders can use these signals to time their entries and exits in the market.
• Trend Strength: It also provides insights into the strength of the trend by analyzing the slope and momentum of price movements. This information can help traders assess the conviction behind the trend and adjust their trading strategies accordingly.
• Filter Noise: By employing adaptive filters, the indicator aims to filter out market noise and false signals, thereby enhancing the reliability of trend identification.
• Customization: Traders can customize the parameters of the OTT to suit their specific trading preferences and market conditions. This flexibility allows for adaptation to different timeframes and asset classes.
Overall, the OTT can be a valuable tool for traders seeking to capitalize on trending market conditions while minimizing false signals and noise. However, like any trading indicator, it is essential to combine its signals with other forms of analysis and risk management strategies for optimal results. Additionally, traders should thoroughly back-test the indicator and practice using it in a demo environment before applying it to live trading.
The following types of moving average have been included: "SMA", "EMA", "SMMA (RMA)", "WMA", "VWMA", "HMA", "KAMA", "LSMA", "TRAMA", "VAR", "DEMA", "ZLEMA", "TSF", "WWMA". Thanks to the authors.
Thank you for your indicator “Optimized Trend Tracker”. © kivancozbilgic
Thank you for your programming language, indicators and strategies. © TradingView
Kind regards.
© Erebor_GIT
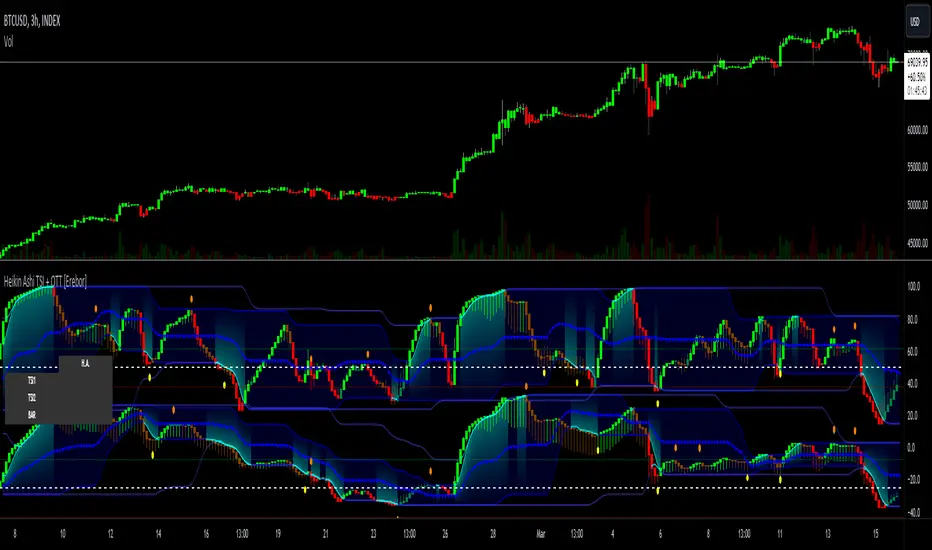
Heikin Ashi and Optimized Trend Tracker and PVSRA [Erebor]Heikin Ashi Candles
Let's consider a modification to the traditional “Heikin Ashi Candles” where we introduce a new parameter: the period of calculation. The traditional HA candles are derived from the open , high low , and close prices of the underlying asset.
Now, let's introduce a new parameter, period, which will determine how many periods are considered in the calculation of the HA candles. This period parameter will affect the smoothing and responsiveness of the resulting candles.
In this modification, instead of considering just the current period, we're averaging or aggregating the prices over a specified number of periods . This will result in candles that reflect a longer-term trend or sentiment, depending on the chosen period value.
For example, if period is set to 1, it would essentially be the same as traditional Heikin Ashi candles. However, if period is set to a higher value, say 5, each candle will represent the average price movement over the last 5 periods, providing a smoother representation of the trend but potentially with delayed signals compared to lower period values.
Traders can adjust the period parameter based on their trading style, the timeframe they're analyzing, and the level of smoothing or responsiveness they prefer in their candlestick patterns.
Optimized Trend Tracker
The "Optimized Trend Tracker" is a proprietary trading indicator developed by TradingView user ANIL ÖZEKŞİ. It is designed to identify and track trends in financial markets efficiently. The indicator attempts to smooth out price fluctuations and provide clear signals for trend direction.
The Optimized Trend Tracker uses a combination of moving averages and adaptive filters to detect trends. It aims to reduce lag and noise typically associated with traditional moving averages, thereby providing more timely and accurate signals.
Some of the key features and applications of the OTT include:
• Trend Identification: The indicator helps traders identify the direction of the prevailing trend in a market. It distinguishes between uptrends, downtrends, and sideways consolidations.
• Entry and Exit Signals: The OTT generates buy and sell signals based on crossovers and direction changes of the trend. Traders can use these signals to time their entries and exits in the market.
• Trend Strength: It also provides insights into the strength of the trend by analyzing the slope and momentum of price movements. This information can help traders assess the conviction behind the trend and adjust their trading strategies accordingly.
• Filter Noise: By employing adaptive filters, the indicator aims to filter out market noise and false signals, thereby enhancing the reliability of trend identification.
• Customization: Traders can customize the parameters of the OTT to suit their specific trading preferences and market conditions. This flexibility allows for adaptation to different timeframes and asset classes.
Overall, the OTT can be a valuable tool for traders seeking to capitalize on trending market conditions while minimizing false signals and noise. However, like any trading indicator, it is essential to combine its signals with other forms of analysis and risk management strategies for optimal results. Additionally, traders should thoroughly back-test the indicator and practice using it in a demo environment before applying it to live trading.
PVSRA (Price, Volume, S&R Analysis)
“PVSRA” (Price, Volume, S&R Analysis) is a trading methodology and indicator that combines the analysis of price action, volume, and support/resistance levels to identify potential trading opportunities in financial markets. It is based on the idea that price movements are influenced by the interplay between supply and demand, and analyzing these factors together can provide valuable insights into market dynamics.
Here's a breakdown of the components of PVSRA:
• Price Action Analysis: PVSRA focuses on analyzing price movements and patterns on price charts, such as candlestick patterns, trendlines, chart patterns (like head and shoulders, triangles, etc.), and other price-based indicators. Traders using PVSRA pay close attention to how price behaves at key support and resistance levels and look for patterns that indicate potential shifts in market sentiment.
• Volume Analysis: Volume is an essential component of PVSRA. Traders monitor changes in trading volume to gauge the strength or weakness of price movements. An increase in volume during a price move suggests strong participation and conviction from market participants, reinforcing the validity of the price action. Conversely, low volume during price moves may indicate lack of conviction and potential reversals.
• Support and Resistance (S&R) Analysis: PVSRA incorporates the identification and analysis of support and resistance levels on price charts. Support levels represent areas where buying interest is expected to be strong enough to prevent further price declines, while resistance levels represent areas where selling interest may prevent further price advances. These levels are often identified using historical price data, trendlines, moving averages, pivot points, and other technical analysis tools.
The PVSRA methodology combines these three elements to generate trading signals and make trading decisions. Traders using PVSRA typically look for confluence between price action, volume, and support/resistance levels to confirm trade entries and exits. For example, a bullish reversal signal may be considered stronger if it occurs at a significant support level with increasing volume.
It's important to note that PVSRA is more of a trading approach or methodology rather than a specific indicator with predefined rules. Traders may customize their analysis based on their preferences and trading style, incorporating additional technical indicators or filters as needed. As with any trading strategy, risk management and proper trade execution are essential components of successful trading with PVSRA.
The following types of moving average have been included: "SMA", "EMA", "SMMA (RMA)", "WMA", "VWMA", "HMA", "KAMA", "LSMA", "TRAMA", "VAR", "DEMA", "ZLEMA", "TSF", "WWMA". Thanks to the authors.
Thank you for your indicator “Optimized Trend Tracker”. © kivancozbilgic
Thank you for your indicator “PVSRA Volume Suite”. © creengrack
Thank you for your programming language, indicators and strategies. © TradingView
Kind regards.
© Erebor_GIT

Market Internals & InfoThis script provides various information on Market Internals and other related info. It was a part of the Daily Levels script but that script was getting very large so I decided to separate this piece of it into its own indicator. I plan on adding some additional features in the near future so stay tuned for those!
The script provides customizability to show certain market internals, tickers, and even Market Profile TPO periods.
Here is a summary of each setting:
NASDAQ and NYSE Breadth Ratio
- Ratio between Up Volume and Down Volume for NASDAQ and NYSE markets. This can help inform about the type of volume flowing in and out of these exchanges.
Advance/Decline Line (ADL)
The ADL focuses specifically on the number of advancing and declining stocks within an index, without considering their trading volume.
Here's how the ADL works:
It tracks the daily difference between the number of stocks that are up in price (advancing) and the number of stocks that are down in price (declining) within a particular index.
The ADL is a cumulative measure, meaning each day's difference is added to the previous day's total.
If there are more advancing stocks, the ADL goes up.
If there are more declining stocks, the ADL goes down.
By analyzing the ADL, investors can get a sense of how many stocks are participating in a market move.
Here's what the ADL can tell you:
Confirmation of Trends: When the ADL moves in the same direction as the underlying index (e.g., ADL rising with a rising index), it suggests broad participation in the trend and potentially stronger momentum.
Divergence: If the ADL diverges from the index (e.g., ADL falling while the index is rising), it can be a warning sign. This suggests that fewer stocks are participating in the rally, which could indicate a weakening trend.
Keep in mind:
The ADL is a backward-looking indicator, reflecting past market activity.
It's often used in conjunction with other technical indicators for a more complete picture.
TRIN Arms Index
The TRIN index, also called the Arms Index or Short-Term Trading Index, is a technical analysis tool used in the stock market to gauge market breadth and sentiment. It essentially compares the number of advancing stocks (gaining in price) to declining stocks (losing price) along with their trading volume.
Here's how to interpret the TRIN:
High TRIN (above 1.0): This indicates a weak market where declining stocks and their volume are dominating the market. It can be a sign of a potential downward trend.
Low TRIN (below 1.0): This suggests a strong market where advancing stocks and their volume are in control. It can be a sign of a potential upward trend.
TRIN around 1.0: This represents a more balanced market, where it's difficult to say which direction the market might be headed.
Important points to remember about TRIN:
It's a short-term indicator, primarily used for intraday trading decisions.
It should be used in conjunction with other technical indicators for a more comprehensive market analysis. High or low TRIN readings don't guarantee future price movements.
VIX/VXN
VIX and VXN are both indexes created by the Chicago Board Options Exchange (CBOE) to measure market volatility. They differ based on the underlying index they track:
VIX (Cboe Volatility Index): This is the more well-known index and is considered the "fear gauge" of the stock market. It reflects the market's expectation of volatility in the S&P 500 index over the next 30 days.
VXN (Cboe Nasdaq Volatility Index): This is a counterpart to the VIX, but instead gauges volatility expectations for the Nasdaq 100 index over the coming 30 days. The tech-heavy Nasdaq can sometimes diverge from the broader market represented by the S&P 500, hence the need for a separate volatility measure.
Both VIX and VXN are calculated based on the implied volatilities of options contracts listed on their respective indexes. Here's a general interpretation:
High VIX/VXN: Indicates a high level of fear or uncertainty in the market, suggesting investors expect significant price fluctuations in the near future.
Low VIX/VXN: Suggests a more complacent market with lower expectations of volatility.
Important points to remember about VIX and VXN:
They are forward-looking indicators, reflecting market sentiment about future volatility, not necessarily current market conditions.
High VIX/VXN readings don't guarantee a market crash, and low readings don't guarantee smooth sailing.
These indexes are often used by investors to make decisions about portfolio allocation and hedging strategies.
Inside/Outside Day
This provides a quick indication of it we are still trading inside or outside of yesterdays range and will show "Inside Day" or "Outside Day" based upon todays range vs. yesterday's range.
Custom Ticker Choices
Ability to add up to 5 other tickers that can be tracked within the table
Show Market Profile TPO
This only shows on timeframes less than 30m. It will show both the current TPO period and the remaining time within that period.
Table Customization
Provided drop downs to change the text size and also the location of the table.

Fair Value Gaps Mitigation Oscillator [LuxAlgo]The Fair Value Gaps Mitigation Oscillator is an oscillator based on the traditional Fair Value Gaps (FVGs) imbalances. The oscillator displays the current total un-mitigated values for the number of FVGs chosen by the user.
The indicator also displays each New FVG as a bar representing the current ratio of the New FVG in relation to the current un-mitigated total for its direction.
🔶 USAGE
When an FVG forms, it is often interpreted as strong market sentiment in the direction of the gap. For example, an upward FVG during an uptrend is typically seen as a confirmation of the strength and continuation of the trend, as it indicates that buyers are willing to purchase at higher prices without much resistance, suggesting strong demand and positive sentiment.
By analyzing the mitigation (or lack thereof), we can visualize the increase of directional strength in a trend. This is where the proposed oscillator is useful.
🔶 DETAILS
The oscillator's values are expressed as Percentages (%). Each FVG is allocated 100% of the total of its width with a max potential value of 100 and minimum potential value of 0.
Based on the "FVG Lookback" Input, the FVGs are scaled to fit within the range of +1 to -1. Using a higher "FVG Lookback" value will allow you to get indications of longer-term trends.
A higher value of the normalized bullish FVG areas suggest a stronger and cleaner uptrend, while lower values of the bearish the normalized bullish FVG areas suggest a stronger and cleaner downtrend.
+1 or -1 indicates that there is a Full Lookback of FVGs, and each one is fully un-mitigated, and the opposite direction of FVGs is entirely Mitigated.
When the price closes over/under or within an FVG it begins to get mitigated, when this happens the % of mitigation is subtracted from the total.
When a New FVG is formed, a Histogram bar is created representing the ratio of the current FVG's width to the total width off all un-mitigated FVGs.
The entire bar represents 100% of total un-mitigated FVG Width.
The filled area represents the current FVG's width relative to the whole.
A 50% hash mark is also displayed for reference.
🔶 SETTINGS
FVG Lookback - Determines the number of FVGs (Bullish and Bearish Pairs) to keep in memory for analysis.

Volume-Based Reversal and Breakout [The_lurker]Indicator Overview:
The "Volume-Based Reversal and Breakout Indicator" is designed for use on the TradingView platform. Its primary function is to identify potential reversal candles using volume and price criteria and to mark significant breakout points. This tool is particularly valuable for traders who incorporate reversal patterns and volume analysis in their trading strategies.
Detailed Functionality:
Customizable Label Color:
Traders can choose the color of the labels that mark breakout points, allowing for personalization and better visibility on different chart backgrounds.
Volume Multiplier Input:
Users can set a 'Volume Multiplier' to define what constitutes significant trading volume. This multiplier is used to compare the current candle's volume with that of the previous candle. A higher volume on the current candle, as defined by this multiplier, is indicative of a significant trading activity.
Reversal Candle Criteria:
The script identifies a candle as a reversal candle if it meets the following conditions:
The closing price of the candle is lower than its opening price, indicating a bearish sentiment.
The trading volume of the candle is greater than the product of the previous candle's volume and the user-set volume multiplier. This implies increased trading activity during the formation of this candle.
The length of the candle's lower tail is greater than its body, suggesting a rejection of lower prices and potential bullish sentiment building up.
Breakout Identification and Marking:
Upon detecting a reversal candle, the indicator draws lines at the high and low of this candle.
These lines represent potential breakout levels. A breakout is confirmed if the price crosses above the high (indicating a bullish breakout) or below the low (indicating a bearish breakout) of the reversal candle.
When a breakout occurs, the indicator places an arrow marker at the breakout point. The direction of the arrow (upwards or downwards) and its color (customizable by the user) indicate the nature of the breakout.
Breakout Alerts:
The indicator includes an alert condition that notifies traders when a breakout occurs. This feature helps traders to quickly react to potential trading opportunities.
Practical Application:
The indicator is best used in markets with distinct volume patterns, as volume is a key component of its analysis.
It can be combined with other technical analysis tools, such as trend lines or moving averages, for additional confirmation of trading signals.
Traders should consider adjusting the volume multiplier based on the typical volume characteristics of the specific asset they are analyzing.
Conclusion:
This "Volume-Based Reversal and Breakout Indicator" is a robust tool that aids traders in identifying potential reversals and breakouts with an emphasis on volume analysis. It's customizable and alert-enabled features make it a versatile addition to a trader's toolkit, suitable for various trading styles and market conditions.
Disclaimer:
This indicator is provided "as is" without any warranties, either express or implied. The information and data contained within this indicator do not constitute investment advice or a recommendation to buy or sell any security. Users assume full responsibility for any trading decisions made based on the use of this indicator.
Past performance of indicators does not guarantee future results. Investing in financial markets involves risks, including the potential loss of capital. It is strongly advised to consult with a qualified financial advisor before making any investment decisions.
The development of this indicator does not constitute an endorsement or recommendation by TradingView or any other entity. All trademarks and trade names mentioned herein are the property of their respective owners.
Fibonacci Averages Trend OscillatorOverview:
The Fibonacci Averages Trend Oscillator is a unique technical indicator that leverages Fibonacci numbers to analyze market trends. It calculates the average trend sentiment over periods determined by Fibonacci numbers and smooths the result to create an oscillator.
Key Features:
Uses Fibonacci sequences for trend analysis.
Smooths the trend data to create a clear oscillator.
Offers adjustable oversold and overbought levels for customized analysis.
Inputs:
Max Fib Number: Select the highest Fibonacci number for trend calculation.
Smooth: Adjust the smoothness of the oscillator line.
Using the Oscillator:
A rising oscillator indicates a bullish trend, while a falling oscillator suggests bearish sentiment.
Oversold and overbought levels help identify potential reversal points.
Use the oscillator in conjunction with other indicators for comprehensive market analysis.
Tips for Effective Use:
Adjusting Fibonacci Levels: Experiment with different 'Max Fib Number' settings to find the one that best matches your trading style and the asset's characteristics. Higher Fibonacci numbers consider longer periods, which might be more suitable for long-term trend analysis.
Smoothing Level: The 'Smooth' input helps in reducing noise. A higher smooth level results in a less responsive but smoother line, which can be useful for identifying the overall trend direction.
Interpreting Overbought/Oversold: Watch for the oscillator reaching overbought or oversold levels. These points could signal potential trend reversals or consolidation phases.
Combination with Other Tools: For best results, combine the Fibonacci Averages Trend Oscillator with other technical tools like moving averages, RSI, or MACD to validate the signals and develop a robust trading strategy.
Conclusion:
The Fibonacci Averages Trend Oscillator offers a unique approach to trend analysis by incorporating Fibonacci numbers into its calculation. Its adjustable settings allow for customization to fit various trading styles and market conditions, making it a versatile tool for traders seeking to enhance their technical analysis capabilities.

Market Health MonitorThe Market Health Monitor is a comprehensive tool designed to assess and visualize the economic health of a market, providing traders with vital insights into both current and future market conditions. This script integrates a range of critical economic indicators, including unemployment rates, inflation, Federal Reserve funds rates, consumer confidence, and housing market indices, to form a robust understanding of the overall economic landscape.
Drawing on a variety of data sources, the Market Health Monitor employs moving averages over periods of 3, 12, 36, and 120 months, corresponding to quarterly, annual, three-year, and ten-year economic cycles. This selection of timeframes is specifically chosen to capture the nuances of economic movements across different phases, providing a balanced view that is sensitive to both immediate changes and long-term trends.
Key Features:
Economic Indicators Integration: The script synthesizes crucial economic data such as unemployment rates, inflation levels, and housing market trends, offering a multi-dimensional perspective on market health.
Adaptability to Market Conditions: The inclusion of both short-term and long-term moving averages allows the Market Health Monitor to adapt to varying market conditions, making it a versatile tool for different trading strategies.
Oscillator Thresholds for Recession and Growth: The script sets specific thresholds that, when crossed, indicate either potential economic downturns (recessions) or periods of growth (expansions), allowing traders to anticipate and react to changing market conditions proactively.
Color-Coded Visualization: The Market Health Monitor employs a color-coding system for ease of interpretation:
-- A red background signals unhealthy economic conditions, cautioning traders about potential risks.
-- A bright red background indicates a confirmed recession, as declared by the NBER, signaling a critical time for traders to reassess risk exposure.
-- A green background suggests a healthy market with expected economic expansion, pointing towards growth-oriented opportunities.
Comprehensive Market Analysis: By combining various economic indicators, the script offers a holistic view of the market, enabling traders to make well-informed decisions based on a thorough understanding of the economic environment.
Key Criteria and Parameters:
Economic Indicators:
Labor Market: The unemployment rate is a critical indicator of economic health.
High or rising unemployment indicates reduced consumer spending and economic stress.
Inflation: Key for understanding monetary policy and consumer purchasing power.
Persistent high inflation can lead to economic instability, while deflation can signal weak
demand.
Monetary Policy: Reflected by the Federal Reserve funds rate.
Changes in the rate can influence economic activity, borrowing costs, and investor
sentiment.
Consumer Confidence: A predictor of consumer spending and economic activity.
Reflects the public’s perception of the economy
Housing Market: The housing market often leads the economy into recession and recovery.
Weakness here can signal broader economic problems.
Market Data:
Stock Market Indices: Reflect overall investor sentiment and economic
expectations. No gains in a stock market could potentially indicate that economy is
slowing down.
Credit Conditions: Indicated by the tightness of bank lending, signaling risk
perception.
Commodity Insight:
Crude Oil Prices: A proxy for global economic activity.
Indicator Timeframe:
A default monthly timeframe is chosen to align with the release frequency of many economic indicators, offering a balanced view between timely data and avoiding too much noise from short-term fluctuations. Surely, it can be chosen by trader / analyst.
The Market Health Monitor is more than just a trading tool—it's a comprehensive economic guide. It's designed for traders who value an in-depth understanding of the economic climate. By offering insights into both current conditions and future trends, it encourages traders to navigate the markets with confidence, whether through turbulent times or in periods of growth. This tool doesn't just help you follow the market—it helps you understand it.

The Flash-Strategy with Minervini Stage Analysis QualifierThe Flash-Strategy (Momentum-RSI, EMA-crossover, ATR) with Minervini Stage Analysis Qualifier
Introduction
Welcome to a comprehensive guide on a cutting-edge trading strategy I've developed, designed for the modern trader seeking an edge in today's dynamic markets. This strategy, which I've honed through my years of experience in the trading arena, stands out for its unique blend of technical analysis and market intuition, tailored specifically for use on the TradingView platform.
As a trader with a deep passion for the financial markets, my journey began several years ago, driven by a relentless pursuit of a trading methodology that is both effective and adaptable. My background in trading spans various market conditions and asset classes, providing me with a rich tapestry of experiences from which to draw. This strategy is the culmination of that journey, embodying the lessons learned and insights gained along the way.
The cornerstone of this strategy lies in its ability to generate precise long signals in a Stage 2 uptrend and equally accurate short signals in a Stage 4 downtrend. This approach is rooted in the principles of trend following and momentum trading, harnessing the power of key indicators such as the Momentum-RSI, EMA Crossover, and Average True Range (ATR). What sets this strategy apart is its meticulous design, which allows it to adapt to the ever-changing market conditions, providing traders with a robust tool for navigating both bullish and bearish scenarios.
This strategy was born out of a desire to create a trading system that is not only highly effective in identifying potential trade setups but also straightforward enough to be implemented by traders of varying skill levels. It's a reflection of my belief that successful trading hinges on clarity, precision, and disciplined execution. Whether you are a seasoned trader or just beginning your journey, this guide aims to provide you with a comprehensive understanding of how to harness the full potential of this strategy in your trading endeavors.
In the following sections, we will delve deeper into the mechanics of the strategy, its implementation, and how to make the most out of its features. Join me as we explore the nuances of a strategy that is designed to elevate your trading to the next level.
Stage-Specific Signal Generation
A distinctive feature of this trading strategy is its focus on generating long signals exclusively during Stage 2 uptrends and short signals during Stage 4 downtrends. This approach is based on the widely recognized market cycle theory, which divides the market into four stages: Stage 1 (accumulation), Stage 2 (uptrend), Stage 3 (distribution), and Stage 4 (downtrend). By aligning the signal generation with these specific stages, the strategy aims to capitalize on the most dynamic and clear-cut market movements, thereby enhancing the potential for profitable trades.
1. Long Signals in Stage 2 Uptrends
• Characteristics of Stage 2: Stage 2 is characterized by a strong uptrend, where prices are consistently rising. This stage typically follows a period of accumulation (Stage 1) and is marked by increased investor interest and bullish sentiment in the market.
• Criteria for Long Signal Generation: Long signals are generated during this stage when the technical indicators align with the characteristics of a Stage 2 uptrend.
• Rationale for Stage-Specific Signals: By focusing on Stage 2 for long trades, the strategy seeks to enter positions during the phase of strong upward momentum, thus riding the wave of rising prices and investor optimism. This stage-specific approach minimizes exposure to less predictable market phases, like the consolidation in Stage 1 or the indecision in Stage 3.
2. Short Signals in Stage 4 Downtrends
• Characteristics of Stage 4: Stage 4 is identified by a pronounced downtrend, with declining prices indicating prevailing bearish sentiment. This stage typically follows the distribution phase (Stage 3) and is characterized by increasing selling pressure.
• Criteria for Short Signal Generation: Short signals are generated in this stage when the indicators reflect a strong bearish trend.
• Rationale for Stage-Specific Signals: Targeting Stage 4 for shorting capitalizes on the market's downward momentum. This tactic aligns with the natural market cycle, allowing traders to exploit the downward price movements effectively. By doing so, the strategy avoids the potential pitfalls of shorting during the early or late stages of the market cycle, where trends are less defined and more susceptible to reversals.
In conclusion, the strategy’s emphasis on stage-specific signal generation is a testament to its sophisticated understanding of market dynamics. By tailoring the long and short signals to Stages 2 and 4, respectively, it leverages the most compelling phases of the market cycle, offering traders a clear and structured approach to aligning their trades with dominant market trends.
Strategy Overview
At the heart of this trading strategy is a philosophy centered around capturing market momentum and trend efficiency. The core objective is to identify and capitalize on clear uptrends and downtrends, thereby allowing traders to position themselves in sync with the market's prevailing direction. This approach is grounded in the belief that aligning trades with these dominant market forces can lead to more consistent and profitable outcomes.
The strategy is built on three foundational components, each playing a critical role in the decision-making process:
1. Momentum-RSI (Relative Strength Index): The Momentum-RSI is a pivotal element of this strategy. It's an enhanced version of the traditional RSI, fine-tuned to better capture the strength and velocity of market trends. By measuring the speed and change of price movements, the Momentum-RSI provides invaluable insights into whether a market is potentially overbought or oversold, suggesting possible entry and exit points. This indicator is especially effective in filtering out noise and focusing on substantial market moves.
2. EMA (Exponential Moving Average) Crossover: The EMA Crossover is a crucial component for trend identification. This strategy employs two EMAs with different timeframes to determine the market trend. When the shorter-term EMA crosses above the longer-term EMA, it signals an emerging uptrend, suggesting a potential long entry. Conversely, a crossover below indicates a possible downtrend, hinting at a short entry opportunity. This simple yet powerful tool is key in confirming trend directions and timing market entries.
3. ATR (Average True Range): The ATR is instrumental in assessing market volatility. This indicator helps in understanding the average range of price movements over a given period, thus providing a sense of how much a market might move on a typical day. In this strategy, the ATR is used to adjust stop-loss levels and to gauge the potential risk and reward of trades. It allows for more informed decisions by aligning trade management techniques with the current volatility conditions.
The synergy of these three components – the Momentum-RSI, EMA Crossover, and ATR – creates a robust framework for this trading strategy. By combining momentum analysis, trend identification, and volatility assessment, the strategy offers a comprehensive approach to navigating the markets. Whether it's capturing a strong trend in its early stages or identifying a potential reversal, this strategy aims to provide traders with the tools and insights needed to make well-informed, strategically sound trading decisions.
Detailed Component Analysis
The efficacy of this trading strategy hinges on the synergistic functioning of its three key components: the Momentum-RSI, EMA Crossover, and Average True Range (ATR). Each component brings a unique perspective to the strategy, contributing to a well-rounded approach to market analysis.
1. Momentum-RSI (Relative Strength Index)
• Definition and Function: The Momentum-RSI is a modified version of the classic Relative Strength Index. While the traditional RSI measures the velocity and magnitude of directional price movements, the Momentum-RSI amplifies aspects that reflect trend strength and momentum.
• Significance in Identifying Trend Strength: This indicator excels in identifying the strength behind a market's move. A high Momentum-RSI value typically indicates strong bullish momentum, suggesting the potential continuation of an uptrend. Conversely, a low Momentum-RSI value signals strong bearish momentum, possibly indicative of an ongoing downtrend.
• Application in Strategy: In this strategy, the Momentum-RSI is used to gauge the underlying strength of market trends. It helps in filtering out minor fluctuations and focusing on significant movements, providing a clearer picture of the market's true momentum.
2. EMA (Exponential Moving Average) Crossover
• Definition and Function: The EMA Crossover component utilizes two exponential moving averages of different timeframes. Unlike simple moving averages, EMAs give more weight to recent prices, making them more responsive to new information.
• Contribution to Market Direction: The interaction between the short-term and long-term EMAs is key to determining market direction. A crossover of the shorter EMA above the longer EMA is an indicator of an emerging uptrend, while a crossover below signals a developing downtrend.
• Application in Strategy: The EMA Crossover serves as a trend confirmation tool. It provides a clear, visual representation of the market's direction, aiding in the decision-making process for entering long or short positions. This component ensures that trades are aligned with the prevailing market trend, a crucial factor for the success of the strategy.
3. ATR (Average True Range)
• Definition and Function: The ATR is an indicator that measures market volatility by calculating the average range between the high and low prices over a specified period.
• Role in Assessing Market Volatility: The ATR provides insights into the typical market movement within a given timeframe, offering a measure of the market's volatility. Higher ATR values indicate increased volatility, while lower values suggest a calmer market environment.
• Application in Strategy: Within this strategy, the ATR is instrumental in tailoring risk management techniques, particularly in setting stop-loss levels. By accounting for the market's volatility, the ATR ensures that stop-loss orders are placed at levels that are neither too tight (risking premature exits) nor too loose (exposing to excessive risk).
In summary, the combination of Momentum-RSI, EMA Crossover, and ATR in this trading strategy provides a comprehensive toolkit for market analysis. The Momentum-RSI identifies the strength of market trends, the EMA Crossover confirms the market direction, and the ATR guides in risk management by assessing volatility. Together, these components form the backbone of a strategy designed to navigate the complexities of the financial markets effectively.
1. Signal Generation Process
• Combining Indicators: The strategy operates by synthesizing signals from the Momentum-RSI, EMA Crossover, and ATR indicators. Each indicator serves a specific purpose: the Momentum-RSI gauges trend momentum, the EMA Crossover identifies the trend direction, and the ATR assesses the market’s volatility.
• Criteria for Signal Validation: For a signal to be considered valid, it must meet specific criteria set by each of the three indicators. This multi-layered approach ensures that signals are not only based on one aspect of market behavior but are a result of a comprehensive analysis.
2. Conditions for Long Positions
• Uptrend Confirmation: A long position signal is generated when the shorter-term EMA crosses above the longer-term EMA, indicating an uptrend.
• Momentum-RSI Alignment: Alongside the EMA crossover, the Momentum-RSI should indicate strong bullish momentum. This is typically represented by the Momentum-RSI being at a high level, confirming the strength of the uptrend.
• ATR Consideration: The ATR is used to fine-tune the entry point and set an appropriate stop-loss level. In a low volatility scenario, as indicated by the ATR, the stop-loss can be set tighter, closer to the entry point.
3. Conditions for Short Positions
• Downtrend Confirmation: Conversely, a short position signal is indicated when the shorter-term EMA crosses below the longer-term EMA, signaling a downtrend.
• Momentum-RSI Confirmation: The Momentum-RSI should reflect strong bearish momentum, usually seen when the Momentum-RSI is at a low level. This confirms the bearish strength of the market.
• ATR Application: The ATR again plays a role in determining the stop-loss level for the short position. Higher volatility, as indicated by a higher ATR, would warrant a wider stop-loss to accommodate larger market swings.
By adhering to these mechanics, the strategy aims to ensure that each trade is entered with a high probability of success, aligning with the market’s current momentum and trend. The integration of these indicators allows for a holistic market analysis, providing traders with clear and actionable signals for both entering and exiting trades.
Customizable Parameters in the Strategy
Flexibility and adaptability are key features of this trading strategy, achieved through a range of customizable parameters. These parameters allow traders to tailor the strategy to their individual trading style, risk tolerance, and specific market conditions. By adjusting these parameters, users can fine-tune the strategy to optimize its performance and align it with their unique trading objectives. Below are the primary parameters that can be customized within the strategy:
1. Momentum-RSI Settings
• Period: The lookback period for the Momentum-RSI can be adjusted. A shorter period makes the indicator more sensitive to recent price changes, while a longer period smoothens the RSI line, offering a broader view of the momentum.
• Overbought/Oversold Thresholds: Users can set their own overbought and oversold levels, which can help in identifying extreme market conditions more precisely according to their trading approach.
2. EMA Crossover Settings
• Timeframes for EMAs: The strategy uses two EMAs with different timeframes. Traders can modify these timeframes, choosing shorter periods for a more responsive approach or longer periods for a more conservative one.
• Source Data: The choice of price data (close, open, high, low) used in calculating the EMAs can be varied depending on the trader’s preference.
3. ATR Settings
• Lookback Period: Adjusting the lookback period for the ATR impacts how the indicator measures volatility. A longer period may provide a more stable but less responsive measure, while a shorter period offers quicker but potentially more erratic readings.
• Multiplier for Stop-Loss Calculation: This parameter allows traders to set how aggressively or conservatively they want their stop-loss to be in relation to the ATR value.
Here are the standard settings:

Smart MAThe Smart MA indicator is a tool designed for traders seeking insights into market trends, with its foundation rooted in moving averages. It offers two distinctive color options, with "Crossing" as the default choice and "Direction" as an alternative. Let's delve deeper into these options:
1. "Crossing" Color Option (Default):
Key Features:
Utilizes the interaction between fast and slow moving averages.
The color of the base moving average (MA) line dynamically changes based on crossovers between these moving averages.
Offers real-time visual signals for potential shifts in market sentiment.
Interpretation:
With the "Crossing" color option as the default setting, the base MA line's color responds to the interaction of the fast and slow moving averages.
A crossover where the fast MA crosses above the slow MA may prompt the base MA line to change to a bullish color (e.g., teal), indicating a potential bullish trend.
Conversely, if the fast MA crosses below the slow MA, the base MA line's color may alter to represent a bearish sentiment (e.g., red). This color shift provides a visual marker for a potential bearish trend, potentially guiding traders towards shorting opportunities.
2. "Direction" Color Option:
Key Features:
Focuses on the directional trend of the base moving average (MA).
The color of the base MA line signifies the direction in which the base MA is moving.
Aids in quickly identifying the prevailing market trend.
Interpretation:
Uptrend - Bullish Direction: When the base MA slopes upward, indicating an average price increase over the chosen base MA length, the base MA line's color may shift to a bullish hue (e.g., teal). This visual cue signals a potential uptrend, suggesting favorable long positions.
Downtrend - Bearish Direction: If the base MA slopes downward, signifying an average price decrease over the selected base MA length, the base MA line could change to a bearish shade (e.g., red). This color shift acts as an indicator of a potential downtrend, implying possible opportunities for shorting.
Customization:
Both color options allow traders to adjust the indicator's parameters, including base MA length, MA type, fast MA length, and slow MA length, to align with their trading strategies and preferred timeframes.
In summary, the Smart MA indicator, based on moving averages, provides traders with two color options: the default "Crossing" and "Direction" as an alternative. The "Crossing" option leverages fast and slow moving averages to offer real-time visual cues for dynamic market shifts. The "Direction" option simplifies trend analysis by focusing on the directional trend of the base MA. The choice between these options depends on your trading style and the depth of analysis you require. With the Smart MA indicator, you're equipped to make informed trading decisions in today's financial markets.
