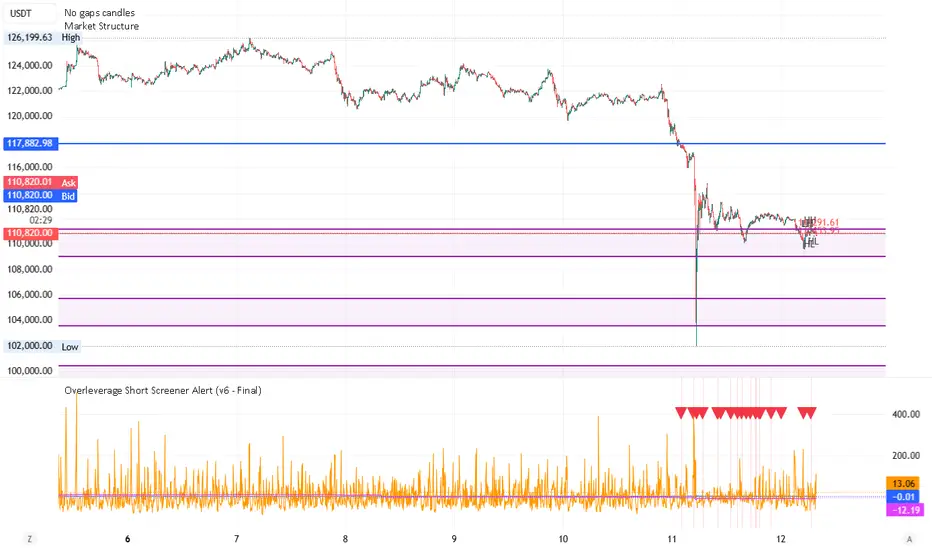
Overleverage Short Screener Alert Overleverage Short Screener Alert Guide (inspired by a posting "an on-chain trader nicknamed "Calm Order King" has reportedly made over $10 million in porfit this month - mainly by shorting BTC and SOL at precise reversal points", this script tries to guess his work.
🎯 Purpose of the Script
The script aims to identify potential **shorting opportunities** in derivatives markets (Perpetual Futures).
It looks for a setup often associated with a "long squeeze" or "blow-off top" by checking three criteria simultaneously: **High Excitement**, **Liquidity Buildup**, and the start of a **Price Dip**.
***
### 🛠️ Customize Inputs (Settings)
Access the indicator's settings window to adjust the following values:
Funding Rate Threshold (%):** Controls the required bar momentum (proxy for excitement). *Adjust between 0.01 and 0.05.*
OI MA Period:** Sets the lookback period for the Open Interest/Volume trend. *Use 7 to 14.*
OI Spike % Above MA:** Defines how far above its trend the Volume/OI must be to signal high liquidity buildup. *Try 20.0 to 50.0.*
Price Drop % From X-Period High:** Sets the minimum percentage drop required from the recent high to confirm the setup. *Use 3.0 to 7.0.*
High Timeframe:** The period used to calculate the "recent high." *Use '7D' (7 Days) or '1D' (1 Day).*
***
🔔 Reading the Signal and Setting Alerts
Visual Signal (Short\_Alert):** A **red triangle down** will appear at the top of the indicator pane when all three conditions are met. The background will also turn light red.
Signal Confirmation:**
* The **FR Proxy % (Blue Line)** must be **above** its blue threshold line.
* The **OI Spike % (Orange Line)** must be **above** its orange threshold line.
* The **Price Drop % (Fuchsia Line)** must be **below** its fuchsia threshold line.
Setting Alerts:**
1. Click the **"Alert"** button (bell icon) on the chart.
2. Set the **Condition** to the indicator's name: **"Overleverage Short Screener Alert
3. Set the specific condition to: **"Overleverage Short Alert"**.
4. The default alert message includes the current percentage values for all three factors for quick review.
Pesquisar nos scripts por "screener"
RSI-CCI Momentum ScreenerRSI-CCI Momentum Screener;
How to Use:
Apply this script to 1H or 4H timeframe
Works well for NSE stocks, crypto, or forex
Look for a green label “BUY” that shows when the screener conditions are met

Pradeep Vad - Quallamaggie Stock ScreenerBelow is a Pine Script that implements a custom stock screener based on your requirements. This script uses TradingView's Pine Script version 5 and allows you to screen stocks using the Pine Screener with the specified features and customization options.

Peak & Valley Screener RadarThis Pine Script indicator is designed to help traders and investors analyze the percentage distance of stock prices from their recent All-Time High (ATH) and All-Time Low (ALH) over a user-defined number of bars.
It functions as a multi-stock screener, scanning a customizable list of stocks (default: 40 BIST 500 stocks) and displaying results in a dynamic table on the chart.
The script identifies stocks that have pulled back more than a specified percentage from their ATH (potential buying opportunities) or risen less than a specified percentage from their ALH (potential caution zones).
Key Features:
Customizable Stock List: Users can input a comma-separated list of stock tickers (e.g., "AAPL,GOOGL,MSFT") to scan any symbols available on TradingView.
User-Defined Parameters: Adjust the lookback period (bars back, default 250), ATH pullback threshold (default 10%), and ALH rise threshold (default 10%).
Dynamic Table Display: Results are shown in a table with two columns: "Distance to TOP" (ATH pullbacks in red) and "Distance to BOTTOM" (ALH rises in green). The table includes input parameters for quick reference and can be positioned anywhere on the chart (top/bottom left/center/right).
Optional Plots: Toggle plots to visualize the percentage distances for the current chart symbol (red for ATH, green for ALH).
Efficient Data Handling: Uses request.security with tuples for optimized multi-symbol data fetching, supporting up to ~80 stocks without exceeding Pine Script limits (adjust table rows if needed for more).
Real-Time Updates: The table updates only on the last bar for performance efficiency.
How It Works:
The script calculates the highest high and lowest low over the specified bars for each stock.
It computes the percentage difference from the current close: negative for ATH (pullback) and positive for ALH (rise).
Stocks meeting the thresholds are listed in the table with their exact percentages.
Usage Tips:
Apply this indicator to any chart (e.g., a BIST index or stock) to run the screener in the background.
Ideal for swing traders scanning for undervalued stocks near ATH or overbought near ALH.
Note: Performance may vary with large stock lists due to TradingView's security call limits (~40-50 calls per script). Test with smaller lists if needed.
You can bypass the 40-stock limit by adding the indicator twice to the chart, entering 40 different stocks in the second indicator and setting a different table position from the first one, allowing you to scan 80 stocks simultaneously. In fact, this way, you can scan as many stocks as your plan's limits allow.
This script is released under the Mozilla Public License 2.0. Feedback and suggestions are welcome, but please adhere to TradingView's House Rules—no guarantees of profitability, use at your own risk.Disclaimer: This is not financial advice. Past performance does not predict future results. Always conduct your own research.

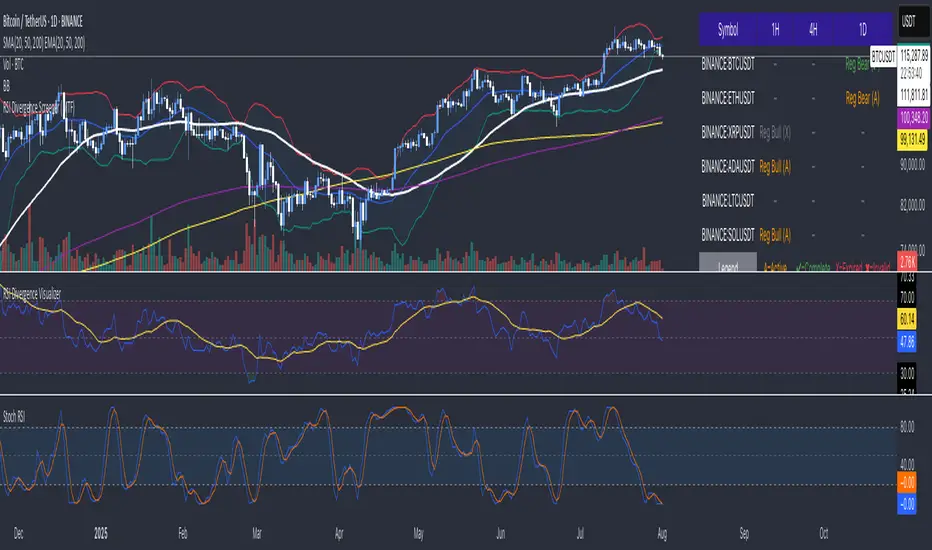
RSI Divergence Screener (MTF)
This powerful screener identifies RSI divergences across multiple symbols and timeframes, presenting the results in a clean, easy-to-read table. It screens for both regular bullish and bearish divergences, allowing you to quickly spot potential trend reversals.
The screener tracks the status of each divergence, categorizing it as:
Active (A): A divergence has formed and is still developing.
Complete (✔): The divergence has been confirmed (optionally, by the RSI crossing the 50 midpoint).
Expired (X): The divergence has persisted for too long without confirmation.
Invalidated (✖): A new high or low has been made, nullifying the divergence.
With customizable settings for RSI length, divergence sensitivity, and the ability to select up to six symbols and three timeframes, this tool is ideal for traders who want to monitor multiple markets efficiently.
Future Features
Expanded Divergence Types: The indicator will be enhanced to detect Hidden Bullish and Hidden Bearish divergences, which signal trend continuation. This will provide a more comprehensive view of potential trading opportunities.
Advanced Completion Flags: Users will have greater control over how a divergence is confirmed. New options will include:
RSI Level Confirmation: The ability to specify any RSI level (e.g., 30 or 70) for completion, rather than being limited to the midpoint of 50.
Breakout/Breakdown Confirmation: A divergence will be marked as complete when the price breaks out above the previous pivot high for a bullish divergence, or breaks down below the previous pivot low for a bearish divergence. This is a powerful signal that the trend has reversed.
TTM Squeeze Value OscillatorThis indicator is specifically designed for use with TradingView's Stock Screener, not for chart analysis. It provides numerical values and binary signals that allow traders to efficiently scan stocks for specific TTM Squeeze conditions, momentum patterns, and EMA alignments.
What It Does
The TTM Squeeze Value Oscillator converts the popular TTM Squeeze indicator into a screenable format by outputting specific numerical values and binary signals (1 or 0) that can be filtered in TradingView's screener tool.
Key Features
1. TTM Squeeze Compression Levels
Value 0: Low Compression (Black) - Bollinger Bands inside outer Keltner Channels
Value 1: Mid Compression (Red) - Bollinger Bands inside middle Keltner Channels
Value 2: High Compression (Orange) - Bollinger Bands inside inner Keltner Channels
Value 3: Squeeze Fired (Green) - Bollinger Bands outside Keltner Channels
2. Momentum Analysis
Four distinct momentum conditions based on TTM Squeeze methodology:
Buy Momentum Increasing - Positive momentum growing stronger
Buy Momentum Decreasing - Positive momentum weakening
Sell Momentum Increasing - Negative momentum growing stronger
Sell Momentum Decreasing - Negative momentum weakening
3. EMA Stacking Analysis
Three EMA alignment patterns using 8, 21, and 48 period EMAs:
EMA Stacked Bullish - 8 EMA > 21 EMA > 48 EMA (uptrend alignment)
EMA Stacked Bearish - 8 EMA < 21 EMA < 48 EMA (downtrend alignment)
EMA Mixed - EMAs not in clear bullish or bearish alignment
4. Consecutive Day Counters
Tracks how many consecutive days each squeeze condition has persisted:
Low Compression Days
Mid Compression Days
High Compression Days
Squeeze Fired Days
5. Combined Signal Analysis
Pre-calculated combinations of squeeze conditions with momentum:
All squeeze levels combined with all four momentum conditions
16 total combined signals for advanced screening

Altcoin Screener | QuantumResearchAltcoin Screener | QuantumResearch
🔍 Multi-Factor Asset Ranking & Portfolio Allocator for Altcoins
This screener is an advanced tool designed to help crypto investors identify the strongest-performing altcoins among a custom selection of up to 40 assets. It evaluates multiple factors across trend strength, momentum, relative performance, and risk-adjusted returns — then allocates a portfolio accordingly.
🔬 How it Works:
Each altcoin is scored using a blend of custom-built indicators developed by QuantumResearch:
Beta (volatility relative to BTC) – Measures how much an asset moves compared to Bitcoin. Higher beta = higher volatility.
Alpha – Measures the asset’s excess return versus Bitcoin (BTC is the required benchmark for this model).
ARSI – Adaptative RSI signal score to determine directional strength.
AVWO – Adaptative Volume-weighted momentum oscillator detecting momentum
Uni1 – Universal algorithme 1
Uni2 – Universal algorithme 2
7D ROC – 7-day rate of change (short-term momentum).
Relative Strength Matrix – Evaluates price ratio behavior between all selected assets.
Omega Ratio – A refined risk/reward filter favoring stable upside.
All scores are aggregated into a Final Score, which determines each token’s overall rank in the current environment.
⚠️ Important Requirements:
This script must be applied to the BTCor TOTAL chart, as BTC/TOTAL is used as the benchmark to compute accurate Beta and Alpha values.
All selected assets must have at least 300 bars of price history to ensure the filters function properly (especially for Alpha, Beta, and Omega computations).
💼 Portfolio Allocation Modes:
Choose how you'd like to allocate based on your risk preference:
🧠 Conservative → Top 3 assets (50% / 30% / 20%)
⚖️ Mix → Top 2 assets (80% / 20%)
🔥 Aggressive → Top 1 asset (100%)
The result is a simple and powerful table showing your top allocations, backed by sound multi-factor analysis.
📊 Key Features:
Supports up to 40 customizable assets from any exchange
Displays performance stats like Beta, Alpha, and Omega
Color-coded tables highlight winners, metrics, and risk zones
Automatically updates allocation tables based on rankings
View mean & median values for deeper benchmarking
🧠 Use Cases:
Build a custom altcoin portfolio with solid statistical backing
Identify strong trends early with momentum + ratio blend
Visualize volatility and risk-adjusted strength versus BTC
Allocate based on signals, not social hype
🔧 Built by QuantumResearch
📈 Engineered for strategic signal discovery
⚠️ For research and educational purposes only — not financial advice.

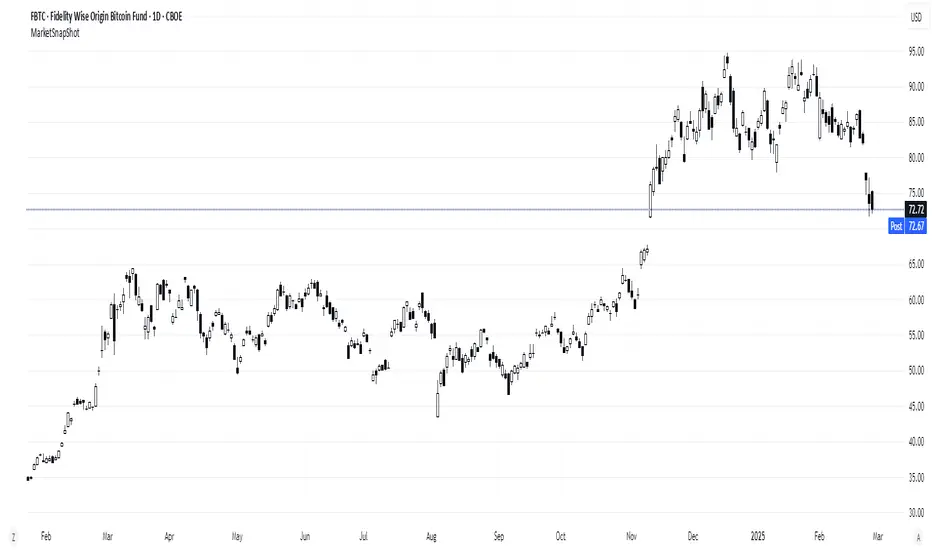
Market Snap Shot with Pine ScreenerMarket Snap Shot
The Market Snap Shot is a comprehensive technical analysis tool designed to track and display key price metrics across multiple timeframes, including daily, weekly, monthly, quarterly, and yearly data. This script provides a range of essential calculations for traders and investors, enabling them to assess price action, volatility, and market trends at a glance.
Features:
Daily Metrics: Includes the daily percentage change, closing range relative to the daily high/low.
Weekly Metrics: Tracks weekly open, close, range, and calculates week-to-date performance for a broader market view.
Monthly Metrics: Provides similar calculations for monthly price action, offering insights into monthly performance.
Quarter-to-Date (QTD): Displays performance for the current quarter, offering insights into quarterly price movements.
Year-to-Date (YTD): Calculates year-to-date price change, helping users track performance relative to the start of the year.
52-Week High/Low: Displays the current price's distance from the 52-week high and low, giving context to long-term price levels.
Usage:
Traders can use this screener to quickly assess the current market position and make informed decisions based on short-term and long-term trends.
Investors can leverage the 52-week and YTD metrics to gauge the overall strength of an asset in the market.
The tool is versatile for both active traders looking for real-time performance data and for those focusing on longer-term market trends.
Instructions:
This script displays multiple metrics such as percentage changes and range data for daily, weekly, monthly, quarterly, and yearly timeframes. It is designed to be used as a screener tool to assess price action and monitor performance across these key time periods.
Warning:
The "Market Snap Shot" does not provide buy or sell signals but rather serves as a performance tracking tool. Users are encouraged to use this data in conjunction with other technical and fundamental analysis tools.
Average Price Range Screener [KFB Quant]Average Price Range Screener
Overview:
The Average Price Range Screener is a technical analysis tool designed to provide insights into the average price volatility across multiple symbols over user-defined time periods. The indicator compares price ranges from different assets and displays them in a visual table and chart for easy reference. This can be especially helpful for traders looking to identify symbols with high or low volatility across various time frames.
Key Features:
Multiple Symbols Supported:
The script allows for analysis of up to 10 symbols, such as major cryptocurrencies and market indices. Symbols can be selected by the user and configured for tracking price volatility.
Dynamic Range Calculation:
The script calculates the average price range of each symbol over three distinct time periods (default are 30, 60, and 90 bars). The price range for each symbol is calculated as a percentage of the bar's high-to-low difference relative to its low value.
Range Visualization:
The results are visually represented using:
- A color-coded table showing the calculated average ranges of each symbol and the current chart symbol.
- A line plot that visually tracks the volatility for each symbol on the chart, with color gradients representing the range intensity from low (red/orange) to high (blue/green).
Customizable Inputs:
- Length Inputs: Users can define the time lengths (default are 30, 60, and 90 bars) for calculating average price ranges for each symbol.
- Symbol Inputs: 10 symbols can be tracked at once, with default values set to popular crypto pairs and indices.
- Color Inputs: Users can customize the color scheme for the range values displayed in the table and chart.
Real-Time Ranking:
The indicator ranks symbols by their average price range, providing a clear view of which assets are exhibiting higher volatility at any given time.
Each symbol's range value is color-coded based on its relative volatility within the selected symbols (using a gradient from low to high range).
Data Table:
The table shows the average range values for each symbol in real-time, allowing users to compare volatility across multiple assets at a glance. The table is dynamically updated as new data comes in.
Interactive Labels:
The indicator adds labels to the chart, showing the average range for each symbol. These labels adjust in real-time as the price range values change, giving users an immediate view of volatility rankings.
How to Use:
Set Time Periods: Adjust the time periods (lengths) to match your trading strategy's timeframe and volatility preference.
Symbol Selection: Add and track the price range for your preferred symbols (cryptocurrencies, stocks, indices).
Monitor Volatility: Use the visual table and plot to identify symbols with higher or lower volatility, and adjust your trading strategy accordingly.
Interpret the Table and Chart: Ranges that are color-coded from red/orange (lower volatility) to blue/green (higher volatility) allow you to quickly gauge which symbols are most volatile.
Disclaimer: This tool is provided for informational and educational purposes only and should not be considered as financial advice. Always conduct your own research and consult with a licensed financial advisor before making any investment decisions.

Multiple Indicators Screener v2After taking the approval of Mr. QuantNomad
Multiple Indicators Screener by QuantNomad
New lists have been modified and added
Built-in indicators:
RSI (Relative Strength Index): Provides trading opportunities based on overbought or oversold market conditions.
MFI (Cash Flow Index): Measures the flow of cash into or from assets, which helps in identifying buying and selling areas.
Williams Percent Range (WPR): Measures how high or low the price has been in the last time period, giving signals of periods of saturation.
Supertrend: Used to determine market direction and potential entry and exit locations.
Volume Change Percentage: Provides an analysis of the volume change percentage, which helps in identifying demand and supply changes for assets.
How to use:
Users can choose which symbols they want to monitor and analyze using a variety of built-in indicators.
The indicator provides visual signals that help traders identify potential trading opportunities based on the selected settings.
RSI in purple = buy weak liquidity (safe entry).
MFI in yellow = Liquidity
WPR in blue = RSI, MFI and WPR in oversold areas for all.
Allows users to customize the display locations and appearance of the cursor to their personal preferences.
Disclaimer
Please remember that past performance may not be indicative of future results.
Due to various factors, including changing market conditions, the strategy may no longer perform as well as in historical backtesting.
This post and the script don’t provide any financial advice.
=========================================================================
فاحص لمؤشرات متعددة مع مخرجات جدول شاملة لتسهيل مراقبة الكثير من العملات تصل الى 99 في وقت واحد
بختصر الشرح
ظهور اللون البنفسجي يعني كمية الشراء ضعف السيولة .
ظهور اللون الازرق جميع المؤشرات وصلة الى مرحلة التشبع البيعي ( دخول آمن )
ظهور اللون الاصفر يعني السيولة ضعفين الشراء ( عكس اتجاه قريب ) == ركزو على هاللون خصوصا مع عملات الخفيفة

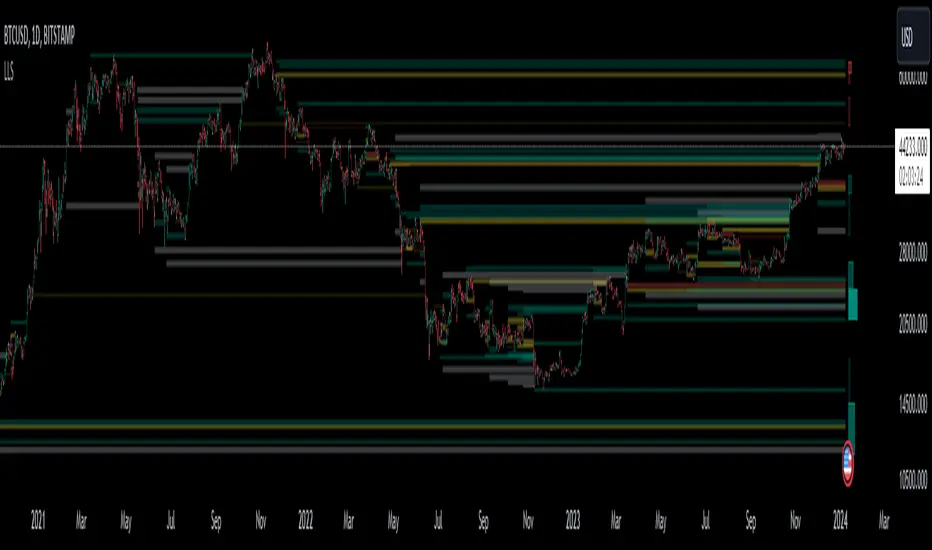
Liquidation Level ScreenerThe Liquidation Level Screener is an analytical tool designed for traders who seek a comprehensive view of potential liquidation zones in the market. This script, adaptable to almost any timeframe from 1 minute to 3 days, offers a unique perspective by mapping out key liquidation levels where significant market actions could occur.
Key Features:
Multi-Exchange Data Aggregation: Unlike many other indicators, the Liquidation Levels Indicator compiles data from multiple leading exchanges including Binance, Bitmex, Kraken, and Bitfinex. This approach ensures a more holistic and accurate representation of market sentiment, providing insights into potential liquidation points across various platforms.
Customizable Timeframes and Modes: The script is versatile, working effectively across various timeframes. It operates in two distinct modes:
Actual Levels Display: Visually represents potential liquidation levels.
Settings Mode: Showcases an open interest (OI) oscillator. When OI is exceptionally high, indicating a surge in opened positions at a specific candle, it signals traders to be vigilant about upcoming liquidation levels.
Three-Tier Liquidation System: The indicator categorizes liquidation levels into three distinct tiers based on open interest levels—1, 2, and 3—with Level 3 representing the highest concentration of open positions. This tiered approach allows traders to gauge the significance of each level and adjust their strategies accordingly.
Histogram Visualization: A novel feature of this script is the histogram on the chart's right side, representing the concentration of liquidation levels in specific market zones. This visual aid helps traders identify crucial areas that warrant close attention, enhancing decision-making.
Customizable Options:
Moving Averages: Choose from a wide range of moving average types, including VWMA, SMA, EMA, and more, to tailor the indicator to your analysis style.
Histogram Settings: Adjust the number of histograms, lookback bars, and their proximity to the latest candle, allowing for a personalized density and range of visualization.
Liquidation Level Sensitivity: Set thresholds for different liquidation levels, fine-tuning the indicator to detect varying degrees of market leverage.
Color Coding: Customize the color scheme for different leverage levels, enhancing visual clarity and ease of interpretation.
The Liquidation Level Screener offers a unique edge by highlighting potential zones where significant market movements can occur due to liquidations. By consolidating data from multiple exchanges, it provides a more rounded view of market behavior, which is essential in today’s interconnected trading environment. The tiered liquidation system and histogram feature equip traders with the ability to identify and focus on key market segments where high activity is expected. This tool is particularly valuable for traders who base their strategies on market liquidity and leverage dynamics.
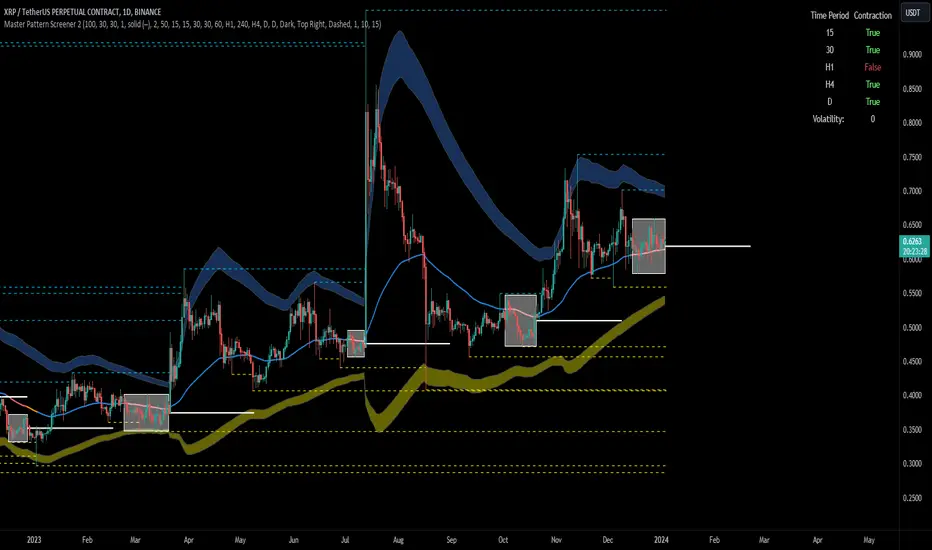
Forex Master Pattern Screener 2Overview
The Forex Master Pattern Screener 2 is based on the Master Pattern, which includes contraction, expansion, and trend phases. This indicator is designed to identify and visualize market volatility, market phases, multi-timeframe contractions, liquidity points, and pivot calculations. It provides a clear image of the market's expansion and contraction phases. It's based on an alternative form of technical analysis that reveals the psychological patterns of financial markets through three phases.
Unlike the other master pattern indicators that just use highs and lows and aren't as accurate for finding contractions, this one uses actual measures of volatility to find extremely low levels of volatility and has customizable parameters depending on what you want to do.
What is the Forex Master Pattern?
The Forex Master Pattern is a framework that revolves around understanding market cycles, comprising the three main phases: contraction, expansion, and trend.
Contraction Phase: During this phase, the market has low volatility and is consolidating within a narrow range. Institutional volume tends to be low, and it's suggested to avoid trade entries during this period.
Expansion Phase: Volatility starts to increase, and there start to be bigger moves in price. Institutional traders start accumulating positions in this phase, and they might manipulate prices to draw in retail traders, creating liquidity for their own buying or selling goals.
Trend Phase: This final phase completes the market cycle. Institutional traders begin taking profits, leading to a reversal. This triggers panic among retail traders, resulting in liquidations and stops. This generates liquidity for institutional traders to profit, leaving retail traders with overvalued positions.
Value Line:
The "value line" acts as the fair value zone or the neutral belief zone where buyers and sellers agree on fair value. It can be likened to the center of gravity and is created during contraction zones.
Applications:
Identifying these phases and understanding the value lines can help traders determine the market's general direction and make better trading decisions.
This isn't a strategy but a concept explaining market behavior, allowing traders to develop various strategies based on these principles
The contractions, which are based on volatility calculations, can help you find out when big moves will occur, known as expansions.
How traders can use this indicator
1. Identifying Market Phases:
Contraction Phase: Look for periods where the market has low volatility and is contracting, indicated by a narrow range and highlighted by the contraction box. During this phase, traders prepare for a breakout but usually avoid making new trades until a clearer trend emerges.
Expansion Phase: When the indicator signals an expansion, it suggests that the market is moving out of consolidation and may be beginning a new trend. Traders might look for entry points here, anticipating a continuation of the trend.
Trend Phase: As the market enters this phase, traders look for signs of sustained movement in one direction and consider positions that benefit from this trend.
2. Multi-Timeframe Analysis:
By looking at multiple timeframes, traders can get a broader view of the market. For instance, a contraction phase in a shorter timeframe within an expansion phase in a longer timeframe might suggest a pullback in an overall uptrend. This indicator comes with a MTF contraction screener that is customizable.
2. Fair Value Lines:
The fair value acts like a "center of gravity.". Traders could use this as a reference point for understanding market sentiment and potential reversal points. This indicator shows these values in the middle of the contraction boxes.
3. Volatility Analysis:
This indicator's volatility settings can help traders understand the market's current volatility state. High volatility indicates a more active market with larger, faster moves, while low volatility might suggest caution and tighter stop-losses or take-profits. If volatility is contracting, then an expansion is imminent. This indicator shows the volatility with percentile ranks in 0-100 values and also alerts you when volatility is contracting, aka the contraction phase.
Volatility Calculations:
This indicator uses a geometric standard deviation to measure volatility based on historical price data. This metric quantifies the variability of price changes over a specified lookback period and then computes a percentile rank within a defined sample period. This percentile calculation helps evaluate the current volatility compared to historical levels.
Based on the percentile rank, the indicator sets thresholds to determine whether the current volatility is within a range considered "contraction" or not. For example, if there are really low levels of volatility on the percentile rank, then there is currently a contraction phase. The indicator also compares the volatility value against a moving average, where values above the current moving average value signal the expansion phase.
Multi-Timeframe Analysis (MTF):
This indicator comes with a multi-timeframe table that shows contractions for 5 different timeframes, and the table is customizable.
Bands:
This indicator comes with bands that are constructed based on the statistical calculations of the standard deviation applied to the log-transformed closing prices. It is commonly assumed that the distribution of prices fits some type of right-skewed distribution. To remove most of the skewness, you can use a log transformation , which makes the distribution more symmetrical and easier to analyze, thus the use of these bands . These bands are in the 2 standard deviation range. You can use these bands to trade at extreme levels. The band parameter is based on the contraction volatility lookback, which is in the Volatility Model Settings tab.
Ways the bands could be used with the contractions:
1. Identifying Breakout trades:
Contraction Zones: These zones indicate periods of low volatility where the market is consolidating. There are usually narrow price ranges, which are considered a build-up phase before a significant price move in any direction.
Bands: When the contraction zone occurs, you might notice the bands tightening around the price on smaller lookback periods, reflecting the decreased volatility. A continuous widening of the bands could then signal the beginning of an expansion phase, indicating a potential breakout opportunity.
2. Enhancing Trade Timing:
Before the Breakout: During the contraction phase, the bands might move closer together, reflecting the lower volatility. You can monitor this phase closely and prepare for a potential expansion. The bands can provide additional confirmation; for instance, a price move toward one of the bands might show an extreme occurrence and might show what the direction of the breakout could be.
After the breakout: Once the price breaks out of the contraction zone and goes to the expansion phase, and if it coincides with the bands widening significantly, it could reinforce the strength and potential sustainability of the new trend, providing a clearer entry.
3. Price-touching bands during a contraction:
If the price repeatedly touches one of the bands during a contraction phase, it might suggest a buildup of pressure in that direction. For example, if the price is consistently touching the upper band even though the bands are narrow, it might suggest bullish pressure that could occur once the expansion phase begin.
4. Price at the band extreme levels during Expansion:
If the price is at the extreme levels of the bands once the expansion phase occurs, it might indicate unsustainable levels and a low probability of the price continuing beyond those levels. Potentially signaling that a reversal will occur. Some trades could use these extremes to place entries during the expansion phases.
Liquidity Levels:
This script comes with liquidity points, whose functionality goes towards identifying pivotal levels in price action, focusing on swing highs and swing lows in the market. These points represent areas where significant buying (for swing lows) or selling (for swing highs) activity has occurred, implying potential levels or resistance in the price movement.
These liquidity points, often identified as highs and lows, are points where market participants have shown interest in the past. These levels can act as psychological indications where traders might place orders, leading to increased trading activity when these levels are approached or breached. When used with the Forex Master Pattern phases, liquidity levels can enhance trades placed with this indicator. For instance, if the market is expanding and approaches a significant liquidity level, there might be a higher chance of a breakout or reversal, showing a possible entry or exit point.
Liquidity Levels in the Contraction Phase:
Accumulation and Distribution: During the contraction phase, liquidity levels can indicate where huge positions are likely accumulating or distributing quietly. If price is near a known liquidity level and in a contraction phase, it might suggest that a large market player is building a position in anticipation of the next move.
Breakout Points: Liquidity levels can also give clues about where price could go after the breakout from the contraction phase. A break above a liquidity level might indicate a strong move to come as the market overcomes significant selling pressure.
Liquidity Levels in Expansion Phase:
Direct Confirmation: As the expansion phase begins, breaking through liquidity levels can confirm the new trend's direction. If the price moves past these levels with huge volume, it might indicate that the market has enough momentum to continue the trend.
Target Areas: Liquidity levels can act as target areas during the expansion phase. Traders using this indicator could look to take profits if the price approaches these levels, possibly expecting a reaction from the market.
Cuban's Range PositioningCuban's Range Positioning is the primary backbone of Cuban's Asset Screener and a fantastic standalone market screening tool.
Range Positioning allows the trader to monitor the positioning of over 200+ Binance and Bybit Futures assets within a single window, with a standard measurement of performance, and also with custom watchlist support.
The range calculation itself uses the unique logic of Cuban's Donchian Suite, retaining highs and lows until the opposite side of the range is tagged.
When viewed historically, the Range Positioning screener allows traders to monitor any assets that are continually pushing range highs and lows, identify outliers, and track trending sectors relative to the rest of the market. This script makes this identification easier for the user by making assets that aren't approaching highs or lows, transparent.
Included within this indicator is the option to redenominate the quote asset of all assets on screen using the current chart ticker.
Within the user inputs, the user gains the ability to customize the following:
Range lookback
Asset redenomination
Location of the asset table
Percentage of assets highlighted or made transparent
Dynamic labelling offset
Over 200+ Binance and Bybit Futures assets
TO DO:
Customize number of assets on screen
Allow values beyond the initial range

Nasdaq 100 ScreenerNasdaq 100 screener is comprehensive table displaying the following parameters :
Op = Open Price of the Day.
LaP = Last Price.
O-L = Open Price of the Day - Last Price.
ROC = Rate of Change .
SMA20 = Simple Moving Average 20 period.
S20d = Last Price - SMA 20.
SMA50 = Simple Moving Average 50 period.
S50d = Last Price - SMA 50.
SMA200 = Simple Moving Average 200 period.
S200d = Last Price - SMA 200.
ADX(14) = Average Directional Index.
RSI(14) = Relative Strength Index.
CCI(20) = Commodity Channel Index.
ATR(14) = Average True Range.
MOM(10) = Momentum.
AcDis(K) = Accumulation/Distribution.
CMF(20) = Chaikin Money Flow.
MACD = Moving Average Convergence Divergence.
Sig = MACD signal.
Nasdaq 100 stocks are divided into following alphabetical grouping for input access purpose under “Options” in “Settings” menu.
A to B 21 stocks “Input symbols” are listed under the “Options” in “Input A to B”
C to E 18 stocks “Input symbols” are listed under the head “Options” in “Input C to E”
F to L 19 stocks “Input symbols” are listed under the head “Options” in “Input F to L”
M to P 22 stocks “Input symbols” are listed under the head “Options” in “Input M to P”
R to Z 20 stocks “Input symbols” are listed under the head “Options” in “Input R to Z”
A to Z 100 stocks “Input symbols” are listed under the head “Options” in “Input A to Z”
User after visiting the “Settings” menu simply is required to select the “input symbol” from the stock listed under respective alphabetical Input lists to which the particular stock belongs. The resultant data is tabulated under respective row in Table .At a time User can see 5 different stocks i.e one each in different alphabetical lists in respective alphabetical order rows stated in the Table. User can scroll in each list to access and shift to any other stock in the list. In addition a Master list of all 100 stocks is given under “ Input A to Z “ at the last row of table.
Nasdaq 100 screener is a simple table , which facilitate to view 6 different stocks at a time (inclusive one from Master list of “Input A to Z” with a display of 19 parameters.

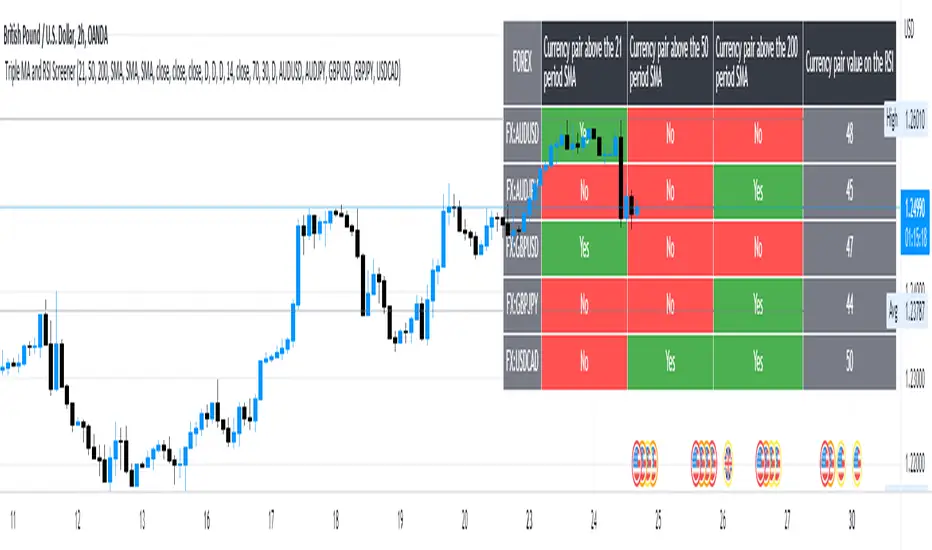
5 Symbol screener with triple MA and RSIBelow is a simple screener script fitted with 5 different symbols in the first column and in the other 4 columns the screener displays the respective moving averages and the RSI, the user has the ability to change between timeframes and different moving averages such as the SMA, EMA, RMA and WMA .
Market Sector Scanner/Screener With MOM + RSI + MFI + DMI + MACDMARKET SECTOR SCANNER/SCREENER MOM + RSI + MFI + DMI + MACD FOR STOCKS CRYPTO & FOREX
This script scans 9 markets constantly and returns the values of 5 different popular indicators.
This indicator helps you see when one of your favorite stocks is bullish or bearish when you are not watching that chart so you can always catch the big moves as they happen.
***HOW TO USE***
A great way to use this market screener is to set up separate chart layouts for each sector you like to trade. Such as the top 9 stocks in the S & P 500, top 9 stocks in the XLF etf, etc. Make sure to set up separate chart layouts in Tradingview so you don’t have to change the symbols constantly. This will give you a good idea in real time if that entire sector is bullish, bearish or mixed. When the entire grid goes red or green, those are very strong signs of market direction across that entire sector, so trades in the corresponding direction are quite safe.
This can be done for crypto as well, using the top 9 cryptocurrencies by market cap. Watch the grid and wait for the entire lot to turn green or red and then take a position in that direction.
You can also use this with a variety of your favorite tickers so you can see when specific markets are looking strong in either direction, instead of constantly changing charts or missing good opportunities because you weren’t watching that specific chart.
This grid can also be used to determine how long to hold a position as well. If the entire grid is still green or red, according to your trade direction, you can usually expect price to continue in that direction until you see some conflicting colors start to pop up on the grid. As it starts to give mixed signals, you can expect the market to be indecisive or reverse which is a good time to get out.
If you have your scanner setup to show similar markets in one sector, be careful taking trades when the grid is very mixed in color. This shows signs of indecision and will likely have choppy price action until the market decides a direction so make sure to use caution when the grid is mixed. It is best to wait for the entire grid to turn green or red and then take position.
***COLOR MEANINGS***
When each indicator value is in bullish territory, the background of that value will turn green.
When each indicator value is in bearish territory, the background of that value will turn red.
When each indicator value is in neutral territory, the background of that value will turn blue.
When all 5 indicators for a ticker are bullish, the ticker background will turn green.
When all 5 indicators for a ticker are bearish, the ticker background will turn red.
When there is a mixture of bullish and bearish values, the ticker background will turn blue.
***CUSTOMIZATION***
You can customize which tickers are in your scanner including stocks, crypto, futures and forex, the source of the indicators, the length of the indicator settings and the smoothing parameters.
***INDICATORS USED***
The indicators used for each ticker are as follows:
Momentum(MOM) - Default length is 14. Bullish is above zero, bearish is below zero.
Relative Strength Index(RSI) - Default length is 14. Bullish is above 50, bearish is below 50.
Money Flow Index(MFI) - Default length is 14. Bullish is above 50, bearish is below 50.
Directional Movement Index(DMI) - Default length is 14 and smoothing is 14. Calculated by subtracting di minus from di plus. If the value is positive, it is bullish. If the value is negative, it is bearish.
Moving Average Convergence & Divergence(MACD) - Default settings are 12, 26, 9. If the short line is greater than the long line, then it is bullish. If the short line is less than the long line, it is bearish.
***MARKETS***
This market scanner can be used as a signal on all markets, including stocks, crypto, futures and forex.
***TIMEFRAMES***
This scanner can be used on all timeframes and pulls data from other tickers using the same timeframe as what your current chart is set to.
***TIPS***
Try using numerous indicators of ours on your chart so you can instantly see the bullish or bearish trend of multiple indicators in real time without having to analyze the data. Some of our favorites are Trend Friend Scalp & Swing Signals, Auto Fibonacci, Directional Movement Index, Volume Profile With Buy/Sell Pressure, Auto Support And Resistance and Money Flow Index in combination with this Scanner. They all have real time Bullish and Bearish labels as well so you can immediately understand each indicator's trend.

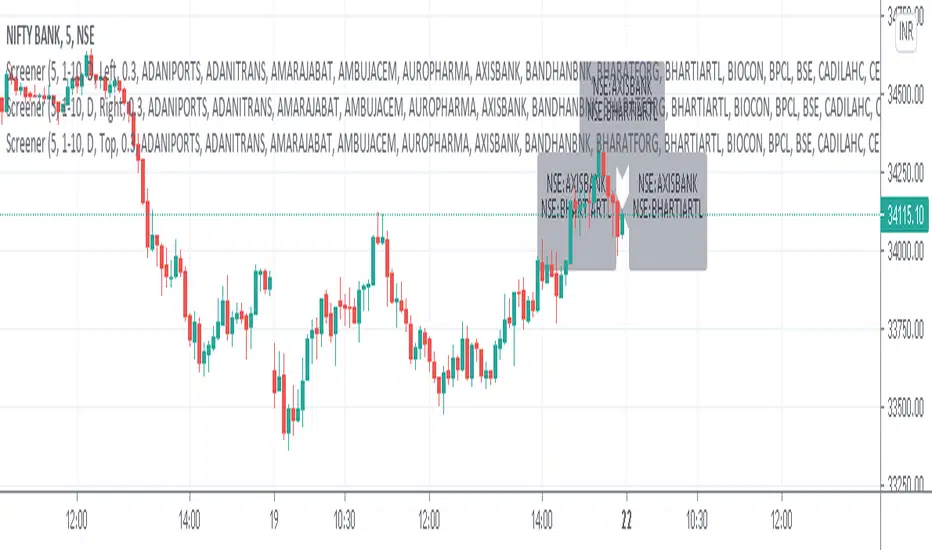
PDH/PDL ScreenerHello Fellow Traders,
This is a Real-Time Screener for stocks trading near previous day's high/low and day before previous day's high/low (default), you can select previous week also.
Screener scans stocks in batches of 10 on defined time-frame (preset- 5 min).
As of now total 100 stocks can be added out of which i've added 80 scripts i.e 8 batches to scan out.
Bits slower due to long code please give some seconds to load.
Happy Trading ...
"Dua me yaad rakhna :-)"
-Nitin
Indices Sector SigmaSpikes█ OVERVIEW
“The benchmark Dow Jones Industrial Average is off nearly 300 points as of midday today...”
“So what? Is that a lot or a little? Should we care?”
-Adam H Grimes-
This screener aims to provide Bird-Eye view across sector indices, to find which sector is having significant or 'out-of-norm' move in either direction.
The significance of the move is measured based on Sigma Spikes, a method proposed by Adam H. Grimes, where Standard Deviation of returns used as a baseline.
*You can google his blog or read his book, got some gold in there, especially on how he use indicators for trading
█ Understanding Sigma Spikes
As described by Grimes, moves in markets are only meaningful when we consider what “normal” is for that market.
Without that baseline, the daily change number, and even the percent change on the day doesn’t really mean much.
To overcome that problem, Sigma Spikes, as a measure of volatility, attempt to put todays change in price (aka return) in context of the standard deviation of 20 days daily's return.
Refer chart below:
1. The blue bars refer to each days return
2. The orange line is 1 time standard deviation of past 20days daily's return (today not included)
3. The red line is 2 time standard deviation of past 20days daily's return (today not included)
Using the ratio of today's return over the Std Deviation, determining your threshold (1,2,3,etc) will be the key that tells if today's move is significant or not.
*Threshold referring to times standard deviation, and different market may require different threshold.
*20 Days period are based on the Lookback Period, adjustable from user input window.
█ Features
- Scan up to 13 symbols at a time (Bursa (MYX) indices are defaulted, but you may change to any symbols/index from the user input setting)
█ Limitation
- Due to multiple use of security() function required to call other symbols, expect the screener to be slow at certain times
- Custom Timeframe currently accept only Daily and Weekly. I'll try to include lower timeframe in the next update
█ Disclaimer
Past performance is not an indicator of future results.
My opinions and research are my own and do not constitute financial advice in any way whatsoever.
Nothing published by me constitutes an investment recommendation, nor should any data or Content published by me be relied upon for any investment/trading activities.
I strongly recommends that you perform your own independent research and/or speak with a qualified investment professional before making any financial decisions.
Any ideas to further improve this indicator are welcome :)

Patternz Screener DBPPatternz Screener is Breakout of box
This indicator forms triangle based on candle open close and then paints it breakout either on upside or downside
it is impossible to scan each stocks whether it have broken breakout so i have used his script and converted into screener
This indicator helps you identify which stocks are breaking above or below patternz box
Multi timeframe - 5,15,30,60,120,240,Day,Week and Month
Can add upto 40 - Stocks , commodities ,indices

BlueswimmersMinorsBoxV1sloth288Something different to what you usually see in the pine world Part 2
This is an add on to BlueswimmersMajorBoxV1sloth288.
Custom currency screener, to be used with BlueswimmerDoesPine at the same time. to get an idea of whats going on change lookback setting to 0, and go to minute candles.
But in a nutshell.
With lookback being 1, and if currency pair says NEUTRAL LONG, it means last close of candle the long signal happened.
With lookback being 0, and if currency pair says NEUTRAL LONG, it means last candle was neutral and current candle is sitting at long.
If scalping minute candles. Have trading screen split in two, BlueswimmersMajorsBoxV1sloth288 on one side, and BlueswimmerDoesPine on the other. that way when flicking between different charts the indicator does not need to load security data over and over again. This is also the reason why the time frame setting is there, so on the screener it can be just loaded to low time frames, and to double check a trade on the other screen you can zoom out to larger time frames and not reloading data over and over again.

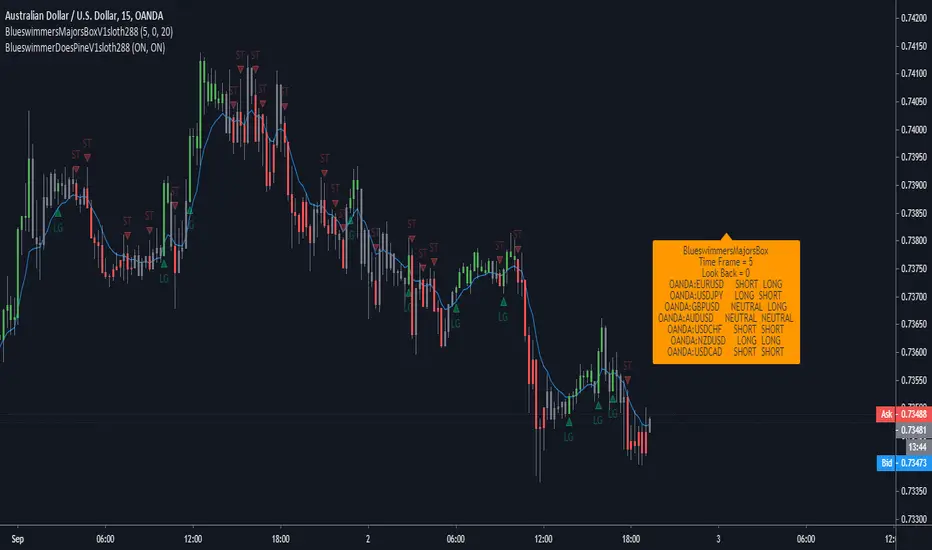
BlueswimmersMajorsBoxV1sloth288Something different to what you usually see in the pine world.
Custom currency screener, to be used with BlueswimmerDoesPine at the same time. to get an idea of whats going on change lookback setting to 0, and go to minute candles.
But in a nutshell.
With lookback being 1, and if currency pair says NEUTRAL LONG, it means last close of candle the long signal happened.
With lookback being 0, and if currency pair says NEUTRAL LONG, it means last candle was neutral and current candle is sitting at long.
If scalping minute candles. Have trading screen split in two, BlueswimmersMajorsBoxV1sloth288 on one side, and BlueswimmerDoesPine on the other. that way when flicking between different charts the indicator does not need to load security data over and over again. This is also the reason why the time frame setting is there, so on the screener it can be just loaded to low time frames, and to double check a trade on the other screen you can zoom out to larger time frames and not reloading data over and over again.
Short Squeeze Screener _ SYLGUYO//@version=5
indicator("Short Squeeze Screener — Lookup Table", overlay=false)
// ===========================
// TABLEAU INTERNE DES DONNÉES
// ===========================
// Exemple : remplace par tes données réelles
var string tickers = array.from("MARA", "BBBYQ", "GME")
var float short_float_data = array.from(28.5, 47.0, 22.3)
var float dtc_data = array.from(2.3, 15.2, 5.4)
var float oi_growth_data = array.from(12.0, 22.0, 4.0)
var float pcr_data = array.from(0.75, 0.45, 1.1)
// ===========================
// CHARGEMENT DU TICKER COURANT
// ===========================
string t = syminfo.ticker
var float short_f = na
var float dtc = na
var float oi = na
var float pcr = na
// Trouve le ticker dans la base
for i = 0 to array.size(tickers) - 1
if array.get(tickers, i) == t
short_f := array.get(short_float_data, i)
dtc := array.get(dtc_data, i)
oi := array.get(oi_growth_data, i)
pcr := array.get(pcr_data, i)
// ===========================
// SCORE SHORT SQUEEZE
// ===========================
score = 0
score += (short_f >= 30) ? 1 : 0
score += (dtc >= 7) ? 1 : 0
score += (oi >= 10) ? 1 : 0
score += (pcr <= 1) ? 1 : 0
plot(score, "Short Squeeze Score", linewidth=2)

Perfect Trade Screener – Merthan KRYPTO PRO (v6) for cryptoPerfect Trade Screener – Merthan KRYPTO PRO (v6) for crypto
