OB - MentorXOB - MentorX
Advanced OrderBlock Detection with Smart Alerts
🎯 Key Features:
- Smart OrderBlock Detection: Identifies bullish/bearish OrderBlocks using fractal breaks
- Multi-Timeframe Alerts: Get instant notifications on 1m, 3m, 5m, 15m, 30m, 1h, 4h
- Strength Filter: Only alerts on significant OrderBlocks (ATR-based strength)
- Visual Confirmation: Alerts sync perfectly with drawn OrderBlock lines
- Customizable Settings: Adjust line styles, colors, and alert preferences
🔔 Alert System:
How It Works:
- OrderBlock detected → Lines drawn → Alert triggered
- No false signals - only alerts when OrderBlock is visible on chart
- Strength filter prevents noise alerts on weak OrderBlocks
Alert Examples:
🔴 Bearish OrderBlock Created
Timeframe: 15m
High: 1.2345
Low: 1.2300
Strength: 2.45% ATR
🟢 Bullish OrderBlock Created
Timeframe: 1h
High: 1.2400
Low: 1.2350
Strength: 3.20% ATR
⚙️ Setup:
1. Enable "Enable Alerts" in settings
2. Select desired timeframes (1m, 3m, 5m, 15m, 30m, 1h, 4h)
3. Adjust "Minimum OB Strength" (0.1-5.0% ATR)
4. Create TradingView alert with "Any alert() function call"
🎨 Customization:
- Line styles: Solid, Dashed, Dotted
- Colors: Customize bearish/bullish line colors
- Fractal filters: 3-bar or 5-bar fractals
- FVG filtering: Optional Fair Value Gap confirmation
📊 Perfect for:
- Scalping
- Swing trading
- Multi-timeframe analysis
- Professional trading strategies
Perfect for scalping, swing trading, and multi-timeframe analysis!
Pesquisar nos scripts por "scalping"
[Top] Simple ATR TP/SLSimple TP/SL from ATR (Locked per Bar) - Advanced Position Management Tool
What This Indicator Does:
Automatically calculates and displays Take Profit (TP) and Stop Loss (SL) levels based on Average True Range (ATR)
Locks ATR values and direction signals at the start of each bar to prevent repainting and provide consistent levels
Offers multiple direction detection modes including real-time candle-based positioning for dynamic trading approaches
Displays entry, TP, and SL levels as clean horizontal lines that extend from the current bar
Original Features That Make This Script Unique:
Bar-Locked ATR System: ATR values are captured and frozen at bar open, ensuring levels remain stable throughout the bar's progression
Multi-Modal Direction Detection: Four distinct modes for determining TP/SL positioning - Trend Following (EMA-based), Bullish Only, Bearish Only, and real-time Candle Based
Real-Time Candle Flipping: In Candle Based mode, TP/SL levels flip immediately when the current candle changes from bullish to bearish or vice versa
Persistent Line Management: Uses efficient line object management to prevent ghost lines and maintain clean visual presentation
Flexible Base Price Selection: Choose between Open (static), Close (dynamic), or midpoint (H+L)/2 for entry level calculation
How The Algorithm Works:
ATR Calculation: Captures ATR value at each bar open using specified length parameter, maintaining consistency throughout the bar
Direction Determination: Uses different methods based on selected mode - EMA crossover for trend following, or real-time candle color for dynamic positioning
Level Calculation: TP level = Base Price + (Direction × TP Multiplier × ATR), SL level = Base Price - (Direction × SL Multiplier × ATR)
Visual Management: Creates persistent line objects once, then updates their positions every bar for optimal performance
Direction Modes Explained:
Trend Following: Uses 5-period and 12-period EMA relationship to determine trend direction (locked at bar open)
Bullish Only: Always places TP above and SL below entry (traditional long setup)
Bearish Only: Always places TP below and SL above entry (traditional short setup)
Candle Based: Dynamically adjusts based on current candle direction - flips in real-time as candle develops
Key Input Parameters:
ATR Length: Period for ATR calculation (default 14) - longer periods provide smoother volatility measurement
TP Multiplier: Take profit distance as multiple of ATR (default 1.0) - higher values target larger profits
SL Multiplier: Stop loss distance as multiple of ATR (default 1.0) - higher values allow more room for price movement
Base Price: Reference point for level calculations - Open for static entry, Close for dynamic tracking
Direction Mode: Method for determining whether TP goes above or below entry level
How To Use This Indicator:
For Position Sizing: Use the displayed SL distance to calculate appropriate position size based on your risk tolerance
For Entry Timing: Wait for price to approach the entry level before taking positions
For Risk Management: Set your actual stop loss orders at or near the displayed SL level
For Profit Taking: Use the TP level as initial profit target, consider scaling out at this level
Mode Selection: Choose Candle Based for scalping and quick reversals, Trend Following for swing trading
Visual Style Customization:
Line Colors: Customize TP line color (default teal) and SL line color (default orange) for easy identification
Line Widths: Adjust TP/SL line thickness (1-5) and entry line thickness (1-3) for visibility preferences
Clean Display: Lines extend 3 bars forward from current bar and update position dynamically
Best Practices:
Use on clean charts without multiple overlapping indicators for clearest visual interpretation
Combine with volume analysis and key support/resistance levels for enhanced decision making
Adjust ATR length based on your trading timeframe - shorter for scalping, longer for position trading
Test different TP/SL multipliers based on the volatility characteristics of your chosen instruments
Consider using Trend Following mode during strong trending periods and Candle Based during ranging markets

Smart Money Trades Pro [BOSWaves]Smart Money Trades Pro – Advanced Market Structure & Liquidity Visualizer
Overview
Smart Money Trades Pro is a comprehensive trading tool designed for traders seeking an in-depth understanding of market structure, liquidity dynamics, and institutional flow. The indicator systematically identifies key market turning points, including break of structure (BOS) and change of character (CHoCH) events, and overlays these with adaptive visualizations to highlight high-probability trade setups. By integrating ATR-based risk zones, progressive take-profit levels, and real-time trade analytics, Smart Money Trades Pro transforms complex price action into an interpretable framework suitable for multiple trading styles, including scalping, intraday, and swing trading.
Unlike traditional static indicators, Smart Money Trades Pro adapts continuously to market conditions. It evaluates swing highs and lows over a configurable lookback period, then determines structural breaks using customizable confirmation methods (candle body or wick). The resulting signals are augmented with dynamic entry, stop-loss, and target levels, allowing traders to analyze potential trade opportunities with both precision and context. The indicator’s design ensures that each visual element—trend-colored candles, signal markers, and risk/reward boxes—reflects real-time market conditions, offering an actionable interpretation of institutional activity.
How It Works
The indicator’s foundation is built upon market structure analysis. By calculating pivot highs and lows over a specified period, Smart Money Trades Pro identifies potential points of liquidity accumulation and exhaustion. When price breaks a pivot high or low, the indicator evaluates whether this constitutes a BOS or a CHoCH, signaling trend continuation or reversal. These events are marked on the chart with distinct visual cues, allowing traders to quickly discern shifts in market sentiment without manually analyzing historical price action.
Once a structural break is confirmed, the indicator automatically determines entry levels, stop-loss placements, and progressive take-profit zones (TP1, TP2, TP3). These calculations are based on ATR-derived volatility, ensuring that targets scale with current market conditions. Risk and reward zones are plotted as shaded boxes, providing a clear visual representation of potential profit relative to risk for each trade setup. This system allows traders to maintain discipline and consistency, with dynamic trade management baked directly into the visualization.
Trend direction is further reinforced by color-coded candles, which reflect the prevailing market bias. Bullish trends are represented by one color, bearish trends by another, and neutral conditions are displayed in muted tones. This continuous visual feedback simplifies the process of trend assessment and helps confirm the validity of trade setups alongside BOS and CHoCH markers.
Signals and Breakouts
Smart Money Trades Pro includes structured visual signals to indicate actionable price movements:
Bullish Break Signals – Triangular markers below the candle appear when a swing high is broken, suggesting potential long opportunities.
Bearish Break Signals – Triangular markers above the candle appear when a swing low is broken, indicating potential short setups.
Change of Character (CHoCH) – Special markers highlight trend reversals, showing where momentum shifts from bullish to bearish or vice versa.
These markers are strategically spaced to prevent overlap and remain clear during high-volatility periods. Traders can use them in combination with trend-colored candles, risk/reward zones, and ATR-based targets to assess the strength and reliability of each setup. The integrated table provides live trade information, including entry price, stop-loss level, take-profit levels, risk/reward ratio, and trade direction, ensuring that trade decisions are informed and data-driven.
Interpretation
Trend Analysis : The indicator’s trend coloring, combined with BOS and CHoCH detection, provides an immediate view of market direction. Rising structures indicate bullish momentum, while falling structures signal bearish momentum. CHoCH markers highlight potential trend reversals or significant liquidity sweeps.
Volatility and Risk Assessment : ATR-based calculations determine stop-loss distances and target levels, giving a quantitative measure of risk relative to market volatility. Wide ATR readings indicate periods of high price fluctuation, whereas narrow readings suggest consolidation and reduced risk exposure.
Market Structure Insights : By monitoring swing highs and lows alongside break confirmations, traders can identify where institutional players are likely active. Areas with multiple structural breaks or overlapping targets can indicate liquidity hotspots, potential reversal zones, or areas of market congestion.
Trade Management : The built-in trade zones allow traders to visualize entry, risk, and reward simultaneously. Progressive targets (TP1, TP2, TP3) reflect incremental profit-taking strategies, while dynamic stop-loss levels help preserve capital during adverse moves.
Strategy Integration
Smart Money Trades Pro supports a range of trading approaches:
Trend Following : Enter trades in the direction of confirmed BOS while using CHoCH markers and trend-colored candles to validate momentum.
Pullback Entries : Use failed breakout retests or minor reversals toward broken structure levels for lower-risk entries.
Mean Reversion : In consolidated zones with narrow ATR and repeated BOS/CHoCH activity, anticipate reversals or short-term corrective moves.
Multi-Timeframe Confirmation : Overlay signals on higher or lower timeframes to filter noise and improve trade accuracy.
Stop-loss levels should be placed just beyond the opposing structural point, while take-profit targets can be scaled using the ATR-based zones. Progressive targets allow for partial exits or scaling out of trades while maintaining exposure to larger moves.
Advanced Techniques
Traders seeking greater precision can combine Smart Money Trades Pro with volume, momentum, or volatility indicators to validate signals. Observing sequences of BOS and CHoCH markers across multiple timeframes provides insight into liquidity accumulation and depletion trends. Tracking the expansion or contraction of ATR-based zones helps anticipate shifts in volatility, enabling better timing for entries and exits.
Customizing the structure period and confirmation type allows the indicator to adapt to different asset classes and timeframes. Shorter periods increase sensitivity to smaller swings, while longer periods filter noise and emphasize higher-probability structural breaks. By integrating these features, the indicator offers a robust statistical framework for disciplined, data-driven trading decisions.
Inputs and Customization
Structure Detection Period : Defines the lookback window for pivot high and low calculation.
Break Confirmation : Choose whether to confirm breaks using candle body or wick.
Display CHoCH : Toggle visibility of change-of-character markers.
Color Trend Bars : Enable color-coding of candles based on market structure direction.
Show Info Table : Display trade dashboard showing entry, stop-loss, take-profits, risk/reward, and bias.
Table Position : Choose from top-left, top-right, bottom-left, or bottom-right placement.
Color Customization : Configure bullish, bearish, neutral, risk, reward, and text colors for enhanced visual clarity.
Why Use Smart Money Trades Pro
Smart Money Trades Pro transforms complex market behavior into an actionable visual framework. By combining market structure analysis, liquidity tracking, ATR-based risk/reward mapping, and a dynamic trade dashboard, it provides a multidimensional view of the market. Traders can focus on execution, interpret trends, and evaluate overextensions or reversals without relying on guesswork. The indicator is suitable for scalping, intraday, and swing strategies, offering a comprehensive system for understanding and trading alongside institutional participants.

Polynomial Regression HeatmapPolynomial Regression Heatmap – Advanced Trend & Volatility Visualizer
Overview
The Polynomial Regression Heatmap is a sophisticated trading tool designed for traders who require a clear and precise understanding of market trends and volatility. By applying a second-degree polynomial regression to price data, the indicator generates a smooth trend curve, augmented with adaptive volatility bands and a dynamic heatmap. This framework allows users to instantly recognize trend direction, potential reversals, and areas of market strength or weakness, translating complex price action into a visually intuitive map.
Unlike static trend indicators, the Polynomial Regression Heatmap adapts to changing market conditions. Its visual design—including color-coded candles, regression bands, optional polynomial channels, and breakout markers—ensures that price behavior is easy to interpret. This makes it suitable for scalping, swing trading, and longer-term strategies across multiple asset classes.
How It Works
The core of the indicator relies on fitting a second-degree polynomial to a defined lookback period of price data. This regression curve captures the non-linear nature of market movements, revealing the true trajectory of price beyond the distortions of noise or short-term volatility.
Adaptive upper and lower bands are constructed using ATR-based scaling, surrounding the regression line to reflect periods of high and low volatility. When price moves toward or beyond these bands, it signals areas of potential overextension or support/resistance.
The heatmap colors each candle based on its relative position within the bands. Green shades indicate proximity to the upper band, red shades indicate proximity to the lower band, and neutral tones represent mid-range positioning. This continuous gradient visualization provides immediate feedback on trend strength, market balance, and potential turning points.
Optional polynomial channels can be overlaid around the regression curve. These three-line channels are based on regression residuals and a fixed width multiplier, offering additional reference points for analyzing price deviations, trend continuation, and reversion zones.
Signals and Breakouts
The Polynomial Regression Heatmap includes statistical pivot-based signals to highlight actionable price movements:
Buy Signals – A triangular marker appears below the candle when a pivot low occurs below the lower regression band.
Sell Signals – A triangular marker appears above the candle when a pivot high occurs above the upper regression band.
These markers identify significant deviations from the regression curve while accounting for volatility, providing high-quality visual cues for potential entry points.
The indicator ensures clarity by spacing markers vertically using ATR-based calculations, preventing overlap during periods of high volatility. Users can rely on these signals in combination with heatmap intensity and regression slope for contextual confirmation.
Interpretation
Trend Analysis :
The slope of the polynomial regression line represents trend direction. A rising curve indicates bullish bias, a falling curve indicates bearish bias, and a flat curve indicates consolidation.
Steeper slopes suggest stronger momentum, while gradual slopes indicate more moderate trend conditions.
Volatility Assessment :
Band width provides an instant visual measure of market volatility. Narrow bands correspond to low volatility and potential consolidation, whereas wide bands indicate higher volatility and significant price swings.
Heatmap Coloring :
Candle colors visually represent price position within the bands. This allows traders to quickly identify zones of bullish or bearish pressure without performing complex calculations.
Channel Analysis (Optional) :
The polynomial channel defines zones for evaluating potential overextensions or retracements. Price interacting with these lines may suggest areas where mean-reversion or trend continuation is likely.
Breakout Signals :
Buy and Sell markers highlight pivot points relative to the regression and volatility bands. These are statistical signals, not arbitrary triggers, and should be interpreted in context with trend slope, band width, and heatmap intensity.
Strategy Integration
The Polynomial Regression Heatmap supports multiple trading approaches:
Trend Following – Enter trades in the direction of the regression slope while using the heatmap for momentum confirmation.
Pullback Entries – Use breakouts or deviations from the regression bands as low-risk entry points during trend continuation.
Mean Reversion – Price reaching outer channel boundaries can indicate potential reversal or retracement opportunities.
Multi-Timeframe Alignment – Overlay on higher and lower timeframes to filter noise and improve entry timing.
Stop-loss levels can be set just beyond the opposing regression band, while take-profit targets can be informed by the distance between the bands or the curvature of the polynomial line.
Advanced Techniques
For traders seeking greater precision:
Combine the Polynomial Regression Heatmap with volume, momentum, or volatility indicators to validate signals.
Observe the width and slope of the regression bands over time to anticipate expanding or contracting volatility.
Track sequences of breakout signals in conjunction with heatmap intensity for systematic trade management.
Adjusting regression length allows customization for different assets or timeframes, balancing responsiveness and smoothing. The combination of polynomial curve, adaptive bands, heatmap, and optional channels provides a comprehensive statistical framework for informed decision-making.
Inputs and Customization
Regression Length – Determines the number of bars used for polynomial fitting. Shorter lengths increase responsiveness; longer lengths improve smoothing.
Show Bands – Toggle visibility of the ATR-based regression bands.
Show Channel – Enable or disable the polynomial channel overlay.
Color Settings – Customize bullish, bearish, neutral, and accent colors for clarity and visual preference.
All other internal parameters are fixed to ensure consistent statistical behavior and minimize potential misconfiguration.
Why Use Polynomial Regression Heatmap
The Polynomial Regression Heatmap transforms complex price action into a clear, actionable visual framework. By combining non-linear trend mapping, adaptive volatility bands, heatmap visualization, and breakout signals, it provides a multi-dimensional perspective that is both quantitative and intuitive.
This indicator allows traders to focus on execution, interpret market structure at a glance, and evaluate trend strength, overextensions, and potential reversals in real time. Its design is compatible with scalping, swing trading, and long-term strategies, providing a robust tool for disciplined, data-driven trading.

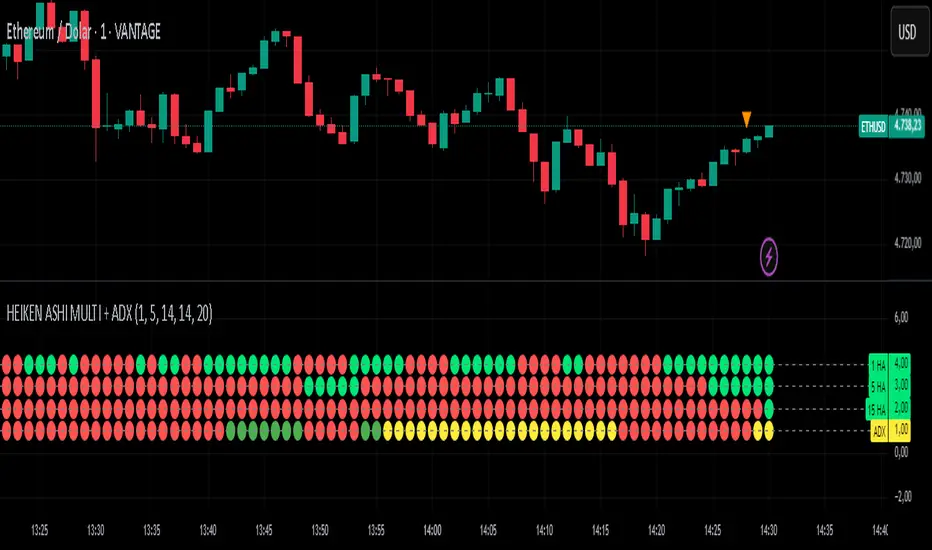
HEIKEN ASHI MULTI + ADXDescription:
This custom indicator combines multiple Heiken Ashi blocks and ADX (Average Directional Index) to provide a comprehensive market analysis tool within a single time frame. It is designed to assist traders in identifying potential buy and sell signals based on Heiken Ashi trends and trend strength.
Key Features:
Multiple Heiken Ashi Blocks:
1-Minute Heiken Ashi: Displays trends in a very short time frame, ideal for scalping strategies.
5-Minute Heiken Ashi: Offers a balanced view for day traders looking for medium-term trends.
15-Minute Heiken Ashi: Provides insights into slightly longer-term trends, helping to confirm signals from shorter time frames.
ADX Functionality:
The ADX line measures the strength of the trend. It helps traders identify whether the market is trending or ranging.
Configurable settings for the ADX period and threshold allow users to tailor this tool to their specific trading style.
Customizable Appearance:
Users can customize the visibility of the Heiken Ashi blocks and ADX plot.
Dot thickness and colors can be adjusted to fit user preferences visually.
Signal Alerts:
Provides alerts when all indicators align (green for buy, red for sell), ensuring traders don't miss significant market opportunities.
Alerts are triggered only on changes to prevent repetitive notifications.
Usage:
Use this indicator for day trading, scalping, or even swing trading strategies by analyzing multiple time frames concurrently.
Customize the settings to suit your trading style for the best results.
How to Use:
Add the indicator to your chart on TradingView.
Configure the settings according to your trading preferences.
Monitor the signals generated by the alignment of the Heiken Ashi blocks and ADX.
Set alerts to be notified of potential trading opportunities based on the indicator's signals.
This indicator is perfect for traders looking for a consolidated view of market trends with a focus on Heiken Ashi candlesticks and trend strength.
Disclaimer:
This indicator is for educational purposes only and should not be construed as financial advice. Always conduct your own research before making trading decisions.
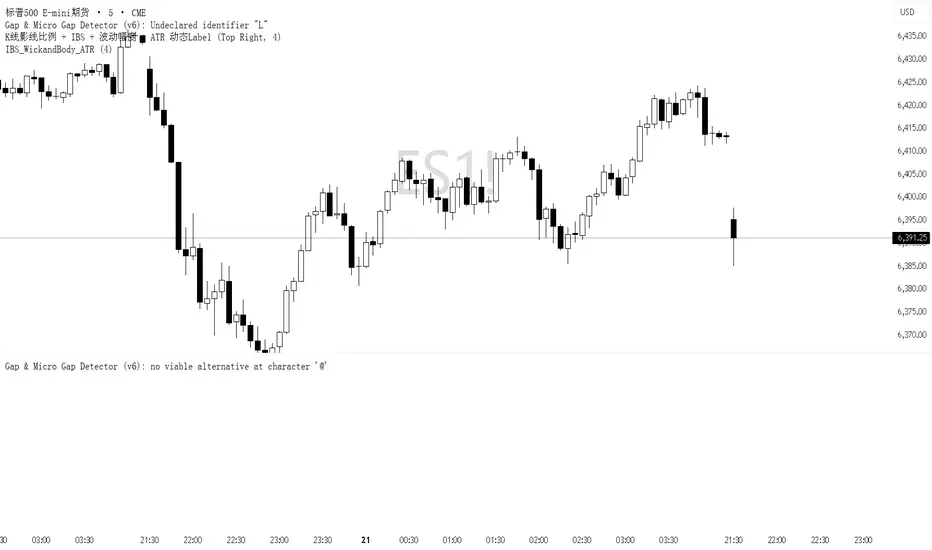
IBS markerIndicator Description
This indicator provides a detailed analysis of the structure and volatility of each candlestick. It is designed to help traders better understand the balance between buying and selling pressure within individual bars, as well as the short-term volatility environment.
📌 Features
Candlestick Structure Analysis
Calculates the relative percentage of the upper wick, lower wick, and real body of each candle.
Helps traders visually and numerically evaluate whether a candle is dominated by bullish, bearish, or indecisive pressure.
IBS (Intraday Bar Strength)
Computes the Intraday Bar Strength value, showing where the close is located relative to the high-low range.
A high IBS indicates strong closing near the high, while a low IBS indicates weakness near the low.
Range Measurements
Displays the candlestick range in both price units and ticks.
Useful for traders who need precise range data for scalping or range-based strategies.
ATR (Average True Range) Volatility Filter
ATR is included with a configurable period setting.
Provides a contextual measure of volatility, helping traders compare current bar size against recent market behavior.
Dynamic Chart Labels
Key values (such as wick percentages, IBS, and range) are displayed directly on the chart through dynamic labels.
This allows for quick interpretation without opening extra panels or indicators.
📈 How to Use
Add the indicator to any chart and configure the settings (ATR period, label visibility, etc.) according to your trading style.
Use wick/body ratios to spot candles with unusual buying/selling pressure.
Combine IBS with ATR to identify potential exhaustion or continuation setups.
The dynamic labels are best used on lower timeframes for scalpers, but they can also provide insights on higher timeframes for swing traders.
🔍 Practical Applications
Identify reversal candles where one wick dominates.
Measure strength of breakouts by comparing candle body % and IBS values.
Detect volatility shifts by monitoring when bar ranges deviate from the ATR baseline.
Support scalping strategies that rely on tick-based range detection.
✅ Notes
This is a standalone indicator and does not require any other script to function.
Works on all markets (stocks, futures, forex, crypto).
For best results, use in conjunction with price action analysis or your preferred trading strategy.

IBS_WickandBody_ATRIndicator Description
This indicator provides a detailed analysis of the structure and volatility of each candlestick. It is designed to help traders better understand the balance between buying and selling pressure within individual bars, as well as the short-term volatility environment.
📌 Features
Candlestick Structure Analysis
Calculates the relative percentage of the upper wick, lower wick, and real body of each candle.
Helps traders visually and numerically evaluate whether a candle is dominated by bullish, bearish, or indecisive pressure.
IBS (Intraday Bar Strength)
Computes the Intraday Bar Strength value, showing where the close is located relative to the high-low range.
A high IBS indicates strong closing near the high, while a low IBS indicates weakness near the low.
Range Measurements
Displays the candlestick range in both price units and ticks.
Useful for traders who need precise range data for scalping or range-based strategies.
ATR (Average True Range) Volatility Filter
ATR is included with a configurable period setting.
Provides a contextual measure of volatility, helping traders compare current bar size against recent market behavior.
Dynamic Chart Labels
Key values (such as wick percentages, IBS, and range) are displayed directly on the chart through dynamic labels.
This allows for quick interpretation without opening extra panels or indicators.
📈 How to Use
Add the indicator to any chart and configure the settings (ATR period, label visibility, etc.) according to your trading style.
Use wick/body ratios to spot candles with unusual buying/selling pressure.
Combine IBS with ATR to identify potential exhaustion or continuation setups.
The dynamic labels are best used on lower timeframes for scalpers, but they can also provide insights on higher timeframes for swing traders.
🔍 Practical Applications
Identify reversal candles where one wick dominates.
Measure strength of breakouts by comparing candle body % and IBS values.
Detect volatility shifts by monitoring when bar ranges deviate from the ATR baseline.
Support scalping strategies that rely on tick-based range detection.
✅ Notes
This is a standalone indicator and does not require any other script to function.
Works on all markets (stocks, futures, forex, crypto).
For best results, use in conjunction with price action analysis or your preferred trading strategy.
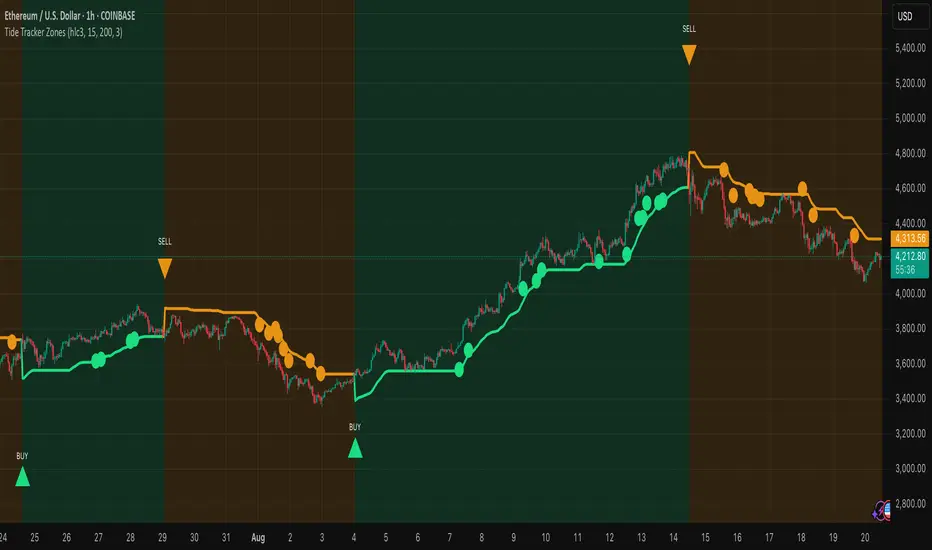
Tide Tracker ZonesTide Tracker Zones – Advanced Trend & Pullback Visualizer
Overview
Tide Tracker Zones is a sophisticated trading tool designed for traders who require clarity, precision, and actionable insights in real time. The indicator converts price action into dynamic trend zones, allowing users to instantly recognize market direction, potential reversals, and low-risk entry opportunities. By visualizing the market in this way, traders can focus on execution rather than deciphering complex charts.
Unlike static indicators, Tide Tracker Zones adapts to market volatility, providing a clear picture of bullish and bearish pressure across multiple timeframes. Its visual design, including color-coded trend zones, a prominent guide line, and carefully placed signals, ensures that market behavior is easy to interpret, making it suitable for scalping, swing trading, and longer-term strategies alike.
How It Works
The indicator relies on dynamic upper and lower bands derived from recent price ranges and a configurable multiplier. These bands expand during volatile periods and contract when price action stabilizes, creating flexible zones that reflect the dominant market tide.
A guide line tracks the active band, serving as a continuous reference for trend direction. Unlike traditional moving averages, the guide line does not clutter the chart but instead provides a subtle, intuitive indication of whether the market is in a bullish or bearish phase. Background shading reinforces this trend visually, highlighting bullish zones in one color and bearish zones in another, so the prevailing market flow is immediately clear.
The system continuously evaluates price relative to the bands to determine trend direction and detect potential reversals. When price crosses a band and flips the trend, the guide line updates, and signals are generated, providing traders with actionable information without overwhelming the chart.
Signals and Pullbacks
Tide Tracker Zones offers visual cues that make entry points more obvious and less speculative. Trend reversal arrows are plotted when the market changes direction: BUY arrows indicate a shift from bearish to bullish, and SELL arrows indicate a shift from bullish to bearish.
The indicator also highlights first pullbacks within an active trend. These pullback dots mark low-risk opportunities to enter a trend in progress, filtered to ensure that only the most relevant signals are displayed. The system uses ATR-based spacing to place arrows and dots vertically on the chart, preventing visual clutter and ensuring readability even during periods of high volatility.
Color-coded zones enhance situational awareness. Bullish zones are displayed in a customizable orange, while bearish zones are shown in green. Transparency is dynamically adjusted to maintain chart clarity while still providing a clear indication of trend strength.
Strategy Integration
Tide Tracker Zones can be used effectively for both trend-following and pullback strategies. Traders may enter positions in the direction of the guide line and colored zone, using trend reversal arrows for confirmation. First pullback dots offer tactical entries with reduced risk, allowing traders to enter a trend after a brief retracement.
Stop-loss levels can be placed just beyond the opposing trend zone, while take-profit targets may be determined using the width of the bands to account for market volatility. The indicator adapts seamlessly across multiple timeframes. Higher timeframes provide context and filter noise, while lower timeframes allow traders to refine entry timing. This makes it a versatile tool for scalping, swing trading, or longer-term positions.
Advanced Techniques
For traders seeking greater precision, Tide Tracker Zones can be combined with volume or momentum indicators to validate signals. Observing the sequence of trend arrows and pullback dots allows users to develop a systematic approach to entries and exits. Monitoring the width and behavior of the bands over time can also provide insights into periods of expanding or contracting volatility, helping traders anticipate market shifts.
Adjustments to the spread length and multiplier allow the indicator to be tuned for different assets and market conditions. By understanding the interaction between the guide line, trend zones, and pullback signals, traders can create a robust framework for decision-making, reducing guesswork and improving consistency.
Why Use Tide Tracker Zones
Tide Tracker Zones provides instant clarity and actionable insight in any market. Its dynamic zones and guide line give a clear visual understanding of trend direction, while trend reversal arrows and pullback dots highlight potential entry points. Unlike traditional indicators, it adapts to volatility and changing conditions, making it reliable across multiple asset classes and timeframes.
By combining trend detection, pullback analysis, and intuitive visual guidance, Tide Tracker Zones equips traders with a complete framework for disciplined, confident trading, transforming complex price action into a visual map of opportunity.
Gestor DeFi Pools con CFBManual DeFi Strategy Manager
What does this indicator do?
It combines cryptocurrency trading with DeFi strategies:
Trading signals: When to buy/sell based on EMAs and momentum
AAVE management: When to switch collateral between ETH and USDC
Uniswap V3: Optimal ranges for liquidity pools
🚨 Indicator Signals (Quick Reference)
Symbol Meaning Action
▲E Lime Early ETH Start switching to ETH (aggressive)
▲C Green Confirm ETH Confirm switch to ETH (safe)
▲D Teal DCA ETH Scale ETH position (+10%)
▼E Orange Early USDC Start switching to USDC (aggressive)
▼C Red Confirm USDC Confirm switch to USDC (safe)
▼D Dark Red DCA USDC Scale USDC position (-10%)
❌ Dark Red EMERGENCY Repay loan NOW
LP+ Lime Create NEW LP Open liquidity pool
LP? Green LP Opportunity Similar pool available
LP- Orange Close LP Close liquidity pool
REB Yellow Rebalance Adjust pool ranges
WAIT Gray Pause Wait before acting
Graphic Elements
Element Color Description
Blue Line Blue Fast EMA (10)
Red Line Red Slow EMA (55)
Purple Lines Purple CFB Adaptive Bands
Colored Band Green/Yellow/Red LP range (color = risk)
Orange Background Orange Active squeeze
Blue Background Blue Trending market
Red Background Red Strong breakout
🚀 Installation and Basic Setup
Step 1: Installation (MANDATORY)
Open TradingView → Pine Editor
Create new indicator
Copy and paste the full code
Save as "DeFi Strategy Manager"
Add to ETHUSDC 1H chart
Step 2: Basic Configuration (MANDATORY)
Only two parameters need to be configured:
🎯 Strategy Mode:
🟢 Conservative (±20%): 0.05% daily, very low risk
🟡 Balanced (±10%): 0.2% daily, medium risk
🔴 Aggressive Day Trading (±5%): 0.5% daily, high risk
⚡ Ultra Scalper (±2%): 0.8% daily, extreme risk
⏰ Timeframe:
Scalping (minutes): 0.5x narrower ranges
Day Trading (hours): 0.8x narrower ranges
Swing (days): 1.2x wider ranges
Position (weeks): 1.8x wider ranges
✅ Ready to Use!
Once configured:
✅ Indicator calculates everything automatically
✅ CFB Adaptive is enabled by default (recommended)
✅ Machine Learning learns from your signals automatically
✅ Dashboard shows expected profits in real time
## 📊 Dashboard Explicado (TV makes me write this in English, but the dashboard is in Spanish, so...)
El tablero superior derecha muestra información esencial en tiempo real con 15 indicadores clave:
### Configuración y Setup:
- **Estrategia**: Tu modo seleccionado (Conservador/Balanceado/Agresivo/Scalper) + temporalidad
- **Rango Final**: El rango actual de Uniswap V3 después de todos los ajustes automáticos
- **ML Confidence**: Porcentaje de éxito de señales pasadas (70%+ = alta confianza)
- **Config Status**: Comparación con tu perfil base + recomendaciones de ajuste
### Estado del Mercado:
- **Market State**: Tipo de mercado (Tendencial/Lateral) + condiciones de squeeze + dirección
- **CFB Status**: Estado del sistema adaptativo CFB + posición del precio + rango dinámico
### Performance y Retornos:
- **Performance**: Tu retorno actual + ganancias proyectadas diarias/mensuales
- **Expected APY**: Retorno anual esperado con clasificación de riesgo
### Gestión de Pools:
- **Pool Status**: Estado actual de tu pool de liquidez + drift de precio + tiempo activo
- **Pool Ranges**: Rangos de precio específicos superior e inferior + distancias actuales
### Señales y Acciones:
- **Trend Progress**: En qué dirección optimiza la estrategia (ETH/USDC/ninguna)
- **Señal Activa**: Qué señal está ejecutándose ahora (Early/Confirm/DCA)
- **Acción Prioritaria**: Próxima acción recomendada con emoji de estado
### Monitoreo de Riesgo:
- **Risk Level**: Nivel de riesgo de Impermanent Loss + rango de volatilidad del mercado
- **Overall Status**: Estado general del sistema + puntuación para day trading
#### **🔧 Ejemplo de Dashboard Simplificado:**
```
📊 DEFI CFB SMART │ VALOR │ STATUS
─────────────────────┼───────────────────┼──────────────────
Estrategia │ Agresivo DT │ Day Trading
Rango Final │ ±5.8% │ 🟡 MEDIO
Confianza ML │ 67% │ MEDIA (12)
Estado Config │ +15% │ CONFIGURACIÓN OK
Estado Mercado │ Lateral-Release │ ↑BULL DÉBIL
Rendimiento │ 5.2% │ $50/día $1.5K/mes
APY Esperado │ 182% │ 🟡 ALTO
Estado CFB │ ACTIVO ↑$2,247 │ ±6.2%
Estado Pool │ ACTIVO │ 2.3% drift 4h
Rangos Pool │ $2,180-2,314 │ +3.1% / -4.2%
Progreso Trend │ ETH Trend │ DCA Ready
Señal Activa │ ETH DCA │ Scale Up
Acción Prioritaria │ Swap → ETH │ 🔄
Nivel Riesgo │ IL: 🟡 MEDIO │ Vol: 45%ile NORMAL
Estado General │ ✅ NORMAL │ ÓPTIMO DT (1.2x)
🎯 DeFi Context: AAVE Collateral Management
Triangle signals can be used for both traditional trading and AAVE collateral management:
🏦 What is AAVE?
AAVE is a lending protocol where you can:
Deposit collateral (ETH or USDC)
Borrow against that collateral
Switch collateral type to optimize your position
🔄 Two ways to use the signals:
💹 Traditional Trading:
▲ ETH Signal: Buy ETH with fiat
▼ USDC Signal: Sell ETH for fiat
Goal: Profit by buying low and selling high
🏦 AAVE Management (Recommended for DeFi):
▲ Swap → ETH: Switch your collateral from USDC to ETH (expecting ETH to rise)
▼ Swap → USDC: Switch your collateral from ETH to USDC (expecting ETH to fall)
Goal: Optimize collateral value without changing total amount
💡 Practical AAVE Example:
You have $10,000 in USDC as collateral in AAVE
↓
▲E Early ETH appears
↓
You switch your collateral: $10,000 USDC → $10,000 ETH
↓
If ETH rises 20%, your collateral is worth $12,000
↓
▼E Early USDC appears
↓
You switch back: $12,000 ETH → $12,000 USDC
↓
You gained $2,000 by optimizing your collateral
⚠️ Advantages of the AAVE approach:
No extra money needed – use existing collateral
Loan remains active – continue using borrowed USDC for LP
Lower taxes – collateral swaps vs buy/sell
Higher efficiency – optimize without changing main strategy
🎯 Strategies by Profile
🟢 Conservative – "Confirmations Only":
Follow only: ▲C/▼C (Confirmation signals)
Ignore: Early signals (too risky)
Strategy: Switch only when trend is confirmed
Result: Fewer changes, more safety
🟡 Balanced – "Gradual":
Early: ▲E/▼E (25% of position)
Confirm: ▲C/▼C (50% additional)
DCA: ▲D/▼D (remaining 25%)
Result: Balanced risk/optimization
🔴 Aggressive – "Full Cycle":
Early: ▲E/▼E (50% immediately)
Confirm: ▲C/▼C (30% additional)
Each DCA: ▲D/▼D (maintain full optimization)
Result: Maximum optimization, maximum risk
📈 Advanced Configuration (Optional)
🔬 CFB Adaptive MOGALEF (Enabled by Default)
CFB Adaptive Ranges: Smart system that adjusts ranges based on market volatility and momentum.
Enabled (default): Ranges adapt automatically
Disabled: Uses fixed ranges based on your setup
Manual Override: Full manual control if desired
🤖 Machine Learning: Learns from past signals (last 20) and improves accuracy automatically. If ML Signal Quality > 70%, signals are highly reliable.
💰 Yield Optimization: Suggests when to switch between conservative and aggressive for better returns:
"OPTIMAL": Your current setup is fine
"GO CONSERVATIVE": You could earn more with wider, safer ranges
"GO AGGRESSIVE": You could earn more with tighter ranges (more risk!)
📊 Portfolio Tracker: Tracks estimated P&L starting from $10,000. Includes LP and IL fees, excludes gas fees. Use as a trend indicator.
Manual Override (Experts Only)
To customize:
Enable "Override Manual" in Advanced Settings
Manually adjust your preferred range
To return to automatic: disable override
📝 Detailed Input Configuration (Advanced)
👤 Basic User Configuration
Strategy Mode: Select your base risk profile
Conservative (±20%): Prioritize safety over returns. Ideal for beginners or large capital (> $50K)
Balanced (±10%): Balance between safety and returns. Recommended for most users
Aggressive Day Trading (±5%): For active users who monitor frequently. Higher returns, more risk
Scalper Ultra (±2%): For professionals only. Requires constant monitoring
Timeframe: Adjust strategy frequency
Scalping (minutes): 50% narrower ranges. For very active trading
Day Trading (hours): 20% narrower ranges. For review every few hours
Swing (days): 20% wider ranges. For daily review
Position (weeks): 80% wider ranges. For weekly review
🔬 CFB Adaptive MOGALEF
CFB Length (8): Period for CFB filter. Lower = more sensitive
CFB Adaptive Length (20): Period for adaptive volatility. Affects band adjustment speed
CFB Band Multiplier (2.0): Band width. Higher = wider bands
CFB Smoothing (3): Volatility smoothing. Reduces noise
CFB Adaptive Ranges (true): Enable/disable adaptive system
CFB Sensitivity (1.0): Filter sensitivity. 0.3 = conservative, 3.0 = very aggressive
🎛️ Advanced Settings
Dynamic Ranges (true): Adjust ranges based on market conditions
Breakout Protection (true): Automatically widens ranges during breakouts
IL Alerts (true): Shows Impermanent Loss warnings
Manual Override (false): Disables automation, uses manual range
Manual Range % (5.0): Fixed range if override is enabled
📈 TradingLatino Core
Fast EMA (10): Fast moving average period. Lower = more sensitive
Slow EMA (55): Slow moving average period. Determines main trend
ADX Length (14): ADX calculation period. Industry standard
ADX Threshold (23): Minimum ADX to consider strong trend
🏊♂️ Pool Management
Pool Range Tolerance % (20.0): % of price movement considered valid for pool
Missed Opportunity Window (24): Bars to keep missed opportunity visible
Recommendation: Use default settings until familiar with the system. Values are optimized for balance between precision and usability.

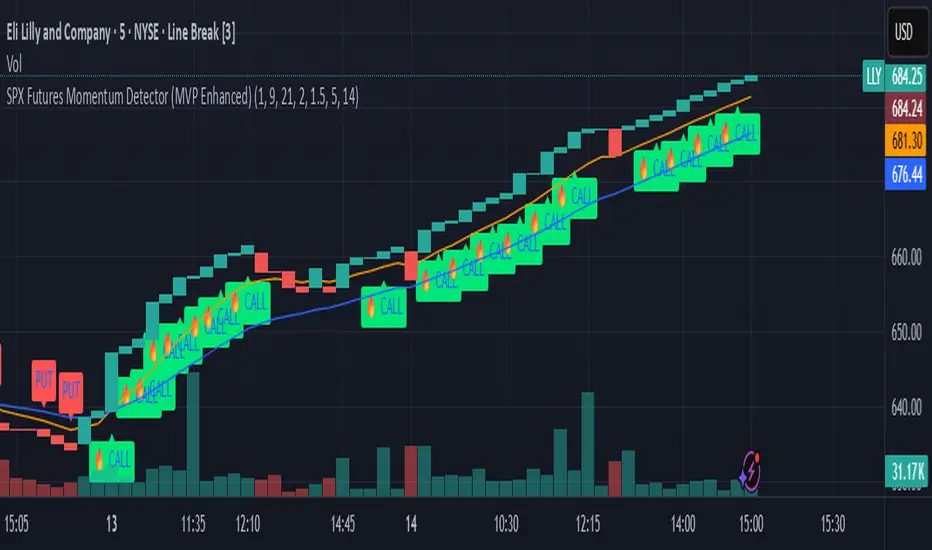
SPX Futures Momentum Detector (MVP Enhanced)Our SPX Futures Momentum Detector is a precision trading tool built for professional futures and options traders.
Optimized for SPX and ES/MES futures, this indicator identifies high probability momentum entries, filters noise, and provides clear CALL/PUT signals for rapid decision-making.
It layers proprietary filters to reduce false positives in volatile or choppy conditions.
This enhanced version leverages our proprietary MVP Momentum framework, incorporating Renko-style brick simulation and momentum confirmation layers.
It is designed for scalping and short-term swing strategies in highly liquid markets.
**Key Features**
• Proprietary momentum detection logic
• Optimized for 5m, 15m, and Renko charts
• Works with SPX, ES, and MES futures contracts and any highly liquid option contracts
• CALL/PUT labeling with A+ setup classification (Hot CALL Signal)
• Zero repaint logic for reliable backtesting
**What it does**
• Detects momentum inflections on SPX/ES/MES using a Renko-style brick simulation + dual EMA context.
• Designed for 1m–5m timeframes; exceptional clarity on Line Break charts.
• Signals: CALL (momentum up), PUT (momentum down). No lookahead; signals print on confirmed bar close.
**How to use**
• Recommended charts: SPX, ES, MES (futures) or any highly liquid options charts.
• Recommended chart types: Line Break for clarity; standard candles for entry points.
• Timeframes: 1m or 5m (scalping to intraday).
• Add alerts: “CALL Signal” and “PUT Signal”, set to “Once per bar close.”
**Inputs explained**
• Fast EMA / Slow EMA – Short/medium trend filters for momentum context.
• Renko Box Size ($) – Sensitivity of the brick simulation (larger = fewer but higher-quality signals).
• Confirmation Bars – Ensures price follow-through (filters weak trends).
• Volume Breakout Multiplier – Confirms breakouts with significant volume increase.
• Consolidation Bars – Filters out sideways action before a momentum shift.
**Risk & limitations**
• Momentum tools perform best in trending sessions. Expect fewer clean signals in chop.
• No guarantees of profit. Use with your own risk management and exit plan.
• Backtest across multiple regimes (trend, post-FOMC, month-end) before live use.
**Best practices**
• Pair with optional companion exit logic for trade management.
• Use alerts at bar close to avoid noise.
• Not recommended for full automation yet: validate broker fills, slippage, and latency.
**Disclaimers**
• Educational tool. Not financial advice. Past performance ≠ future results.
• We do not guarantee outcomes, you are responsible for your trades.
**Changelog**
v1.0 – Initial invite-only release (MVP Enhanced): Renko-style momentum + EMA filters, bar-close alerts, repaint safe security calls.
Scalper SMA-RSI-MACD – Entry/Exit Signals v2Scalper SMA–RSI–MACD Strategy (Intraday) – Indicator Version
This is an intraday scalping and short-term trading tool designed for manual trading. It provides entry and exit signals based on a combination of trend, momentum, and volatility-based risk management.
Core Components
Trend Filter (Optional)
Uses an EMA (default 200) and an SMA ribbon (5/8/13) to identify the primary trend direction.
Only allows long trades in uptrend and short trades in downtrend (can be turned off for more signals).
Entry Conditions
RSI Pullback: Detects oversold (for long) or overbought (for short) conditions based on a short RSI (default length = 4).
MACD Momentum Turn: Detects bullish or bearish MACD crossovers or momentum shifts.
Both conditions must occur within a specified lookback period (default = last 3 bars).
Stop Loss (SL) Placement
SL is placed at a fixed multiple of the ATR (Average True Range) from the entry price (default = 1.5 × ATR).
Adjusting the multiplier changes how far the SL is placed.
Take Profit (TP) Levels
Two targets: TP1 and TP2, each based on R-multiples of the SL distance.
Default: TP1 = 1 × risk (1:1 R/R), TP2 = 2 × risk (1:2 R/R).
Exit Modes (Selectable)
TP1 or SL
TP2 or SL
Opposite signal (exit when the opposite entry condition appears)
Session Filter (Optional)
Can restrict trading signals to specific market hours (default off for more signals).
Signals and Alerts
Displays LONG and SHORT arrows for entries.
Plots SL and TP levels on the chart.
Marks exits as TP, SL, or opposite signal.
Built-in alertcondition() allows creating TradingView alerts for all entry and exit events.
Typical Usage
Works best on 1-minute to 5-minute charts for scalping; can be adapted to higher timeframes for swing trading.
Ideal for manual execution — the trader sees the signal, checks market conditions, and decides whether to enter.
Can be tuned for more or fewer signals by adjusting RSI thresholds, MACD lookback, and trend filter settings.

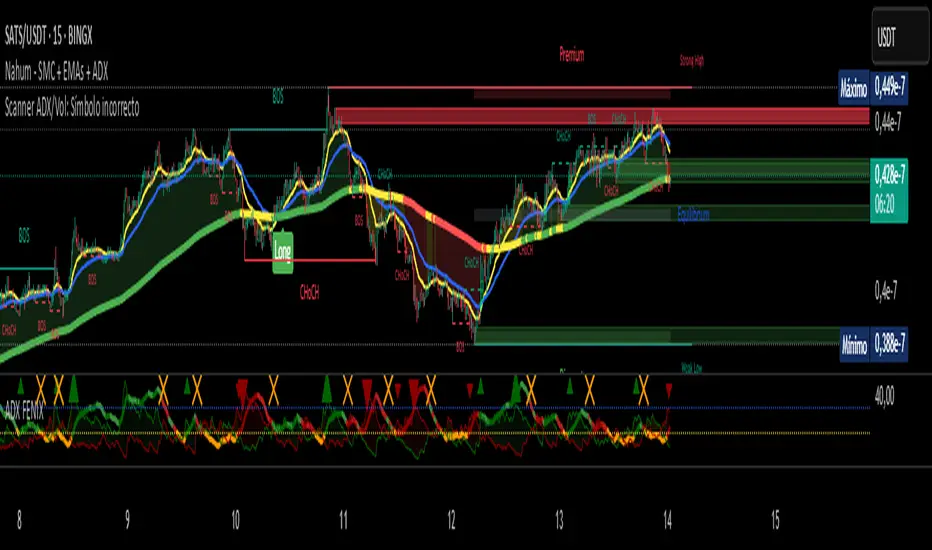
Scanner ADX & VolumenThis indicator is a market scanner specifically designed for scalping traders. Its function is to simultaneously monitor 30 cryptocurrency pairs from the BingX exchange to identify entry opportunities based on the start of a new, strengthening trend.
Strategy and Logic:
The scanner is based on the combination of two key conditions on a 15-minute timeframe:
Trend Strength (ADX): The primary signal is generated when the ADX (Average Directional Index) crosses above the 20 level. An ADX moving above this threshold suggests that the market is breaking out of a consolidation phase and that a new trend (either bullish or bearish) is beginning to gain strength.
Volume Confirmation: To validate the ADX signal, the indicator checks if the current candle's volume is higher than its simple moving average (defaulting to 20 periods). An increase in volume confirms market interest and participation, adding greater reliability to the emerging move.
How to Use It:
The indicator displays a table in the top-right corner of your chart with the following information:
Par: The name of the cryptocurrency pair.
ADX: The current ADX value. It turns green when it exceeds the 20 level.
Volume: Shows "OK" if the current volume is higher than its average.
Signal: This is the most important column. When both conditions (ADX crossover and high volume) are met, it will display the message "¡ENTRADA!" ("ENTRY!") with a highlighted background, alerting you to a potential trading opportunity.
In summary, this scanner saves you the effort of manually analyzing 30 charts, allowing you to focus solely on the assets that present the best conditions for a scalping trade.
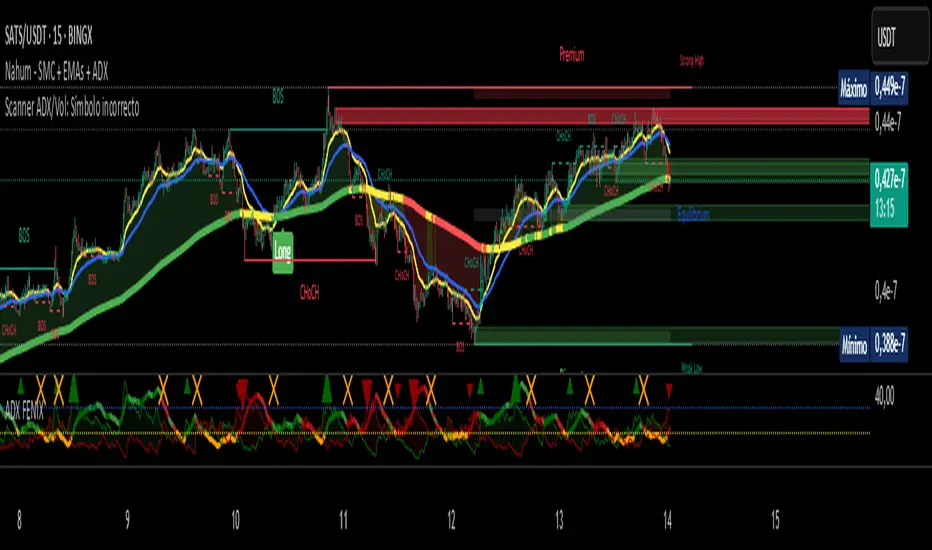
Scanner ADX & Volumen This indicator is a market scanner specifically designed for scalping traders. Its function is to simultaneously monitor 30 cryptocurrency pairs from the BingX exchange to identify entry opportunities based on the start of a new, strengthening trend.
Strategy and Logic:
The scanner is based on the combination of two key conditions on a 15-minute timeframe:
Trend Strength (ADX): The primary signal is generated when the ADX (Average Directional Index) crosses above the 20 level. An ADX moving above this threshold suggests that the market is breaking out of a consolidation phase and that a new trend (either bullish or bearish) is beginning to gain strength.
Volume Confirmation: To validate the ADX signal, the indicator checks if the current candle's volume is higher than its simple moving average (defaulting to 20 periods). An increase in volume confirms market interest and participation, adding greater reliability to the emerging move.
How to Use It:
The indicator displays a table in the top-right corner of your chart with the following information:
Par: The name of the cryptocurrency pair.
ADX: The current ADX value. It turns green when it exceeds the 20 level.
Volume: Shows "OK" if the current volume is higher than its average.
Signal: This is the most important column. When both conditions (ADX crossover and high volume) are met, it will display the message "¡ENTRADA!" ("ENTRY!") with a highlighted background, alerting you to a potential trading opportunity.
In summary, this scanner saves you the effort of manually analyzing 30 charts, allowing you to focus solely on the assets that present the best conditions for a scalping trade.
ABS Companion Oscillator — Trend / Exhaustion / New Trend (v1.1)
# ABS Companion Oscillator — Trend / Exhaustion / New Trend (v1.1)
## What it is (quick take)
**ABS CO** is a unified **–100…+100 trend oscillator** that fuses:
* **Regime**: EMA stack (fast/slow/long) + **HTF slope** (e.g., 60-minute)
* **Momentum**: **TSI** vs its signal
* **Stretch**: session-anchored **VWAP Z-score** for exhaustion and “fresh-trend” sanity checks
It paints the oscillator with **lime** in upstate, **red** in downstate, **gray** in neutral, and tags:
* **NEW↑ / NEW↓** when a **new trend** likely starts (zero-line cross with acceptable stretch)
* **EXH↑ / EXH↓** when an **existing trend looks exhausted** (large |Z| + momentum rollback)
> Use it as a **direction filter and context layer**. Works great in front of an entry engine and behind an exit tool.
---
## How to use it (operational workflow)
1. **Read the state**
* **Uptrend** when the oscillator is **≥ upThresh** (default +55) → prefer **long-side** plays.
* **Downtrend** when the oscillator is **≤ dnThresh** (default −55) → prefer **short-side** plays.
* **Neutral** between thresholds → be selective or flat; expect chop.
2. **Act on events**
* **NEW↑ / NEW↓**: zero-line cross with acceptable |Z| (not already overstretched). Treat as **trend start** cues.
* **EXH↑ / EXH↓**: trend state with **high |Z|** and TSI rollback versus its signal. Treat as **trend fatigue**; avoid fresh go-with entries and tighten risk.
3. **Practical pairing**
* Use **up/down state** (or above/below **neutralBand**) as your go/no-go filter for entries.
* Prioritize entries **with** NEW↑/NEW↓ and **without** nearby EXH tags.
* Keep holding while the oscillator stays in state and no EXH appears; consider scaling out on EXH or on your exit tool.
---
## Visual semantics & alerts
* **ABS CO line** (–100…+100): lime in upstate, red in downstate, gray in neutral.
* **Horizontal guides**: `Up` threshold, `Down` threshold, `Zero`, and optional **neutral band** lines.
* **Background heat** (optional): shaded when EXH conditions trigger (lime/red tint with intensity scaled by |Z|).
* **Tags**: `NEW↑`, `NEW↓`, `EXH↑`, `EXH↓`.
**Alerts (stable):**
* **ABS CO — New Uptrend** (NEW↑)
* **ABS CO — New Downtrend** (NEW↓)
* **ABS CO — Exhausted Up** (EXH↑)
* **ABS CO — Exhausted Down** (EXH↓)
Set alerts to **“Once per bar close”** for clean signals.
---
## Non-repainting behavior
* HTF queries use **lookahead\_off**.
* With **Strict NR = true**, the HTF slope is taken from the **prior completed** HTF bar; events evaluate on confirmed bars → **safer, fewer, cleaner**.
* NEW/EXH tags finalize at bar close. Disabling strictness yields earlier but noisier responses.
---
## Every input explained (and how it changes behavior)
### A) Trend & HTF structure
* **EMA Fast / Slow / Long (`emaFastLen`, `emaSlowLen`, `emaLongLen`)**
Control the baseline regime. Larger = smoother, fewer flips; smaller = snappier, more flips.
* **HTF EMA Len (`htfLen`)** & **HTF timeframe (`htfTF`)**
HTF slope filter. Longer len or higher TF = steadier bias (fewer state changes); shorter/ lower = more sensitive.
* **Strict NR (`strictNR`)**
`true` uses the **previous** HTF bar for slope and evaluates on confirmed bars → cleaner, slower.
### B) Momentum (TSI)
* **TSI Long / Short / Signal (`tsiLong`, `tsiShort`, `tsiSig`)**
Standard TSI. Larger values = smoother momentum, fewer EXH triggers; smaller = snappier, more EXH sensitivity.
### C) Stretch (VWAP Z-score)
* **VWAP Z-score length (`zLen`)**
Window for Z over session-anchored VWAP distance. Larger = smoother |Z|; smaller = more reactive stretch detection.
* **Exhaustion |Z| (`zHot`)**
Minimum |Z| to flag **EXH**. Raise to demand **bigger** stretch (fewer EXH); lower to catch milder excess.
* **Max |Z| for NEW (`zNewMax`)**
NEW requires |Z| **≤ zNewMax** (avoid “new trend” when already stretched). Lower = stricter; higher = more NEW tags.
### D) States & thresholds
* **Uptrend threshold (`upThresh`)** / **Downtrend threshold (`dnThresh`)**
Where the oscillator flips into trend states. Widen (e.g., +60/−60) to reduce false states; narrow to get earlier signals.
* **Neutral band (`neutralBand`)**
Visual buffer around zero for “meh” momentum. Larger band = fewer go/no-go flips near zero.
### E) Visuals & tags
* **Show New / Show Exhausted (`showNew`, `showExh`)**
Toggle the tag labels.
* **Shade exhaustion heat (`plotHeat`)**
On = color background when EXH fires. Helpful for scanning.
### F) Smoothing
* **Osc smoothing (`smoothLen`)**
EMA over the raw composite. Higher = steadier line (fewer whip flips); lower = faster turns.
---
## Tuning recipes
* **Trend-day bias (follow moves longer)**
* Raise **`upThresh`** to \~60 and **`dnThresh`** to \~−60
* Keep **`zNewMax`** low (1.0–1.2) to avoid “fresh trend” when stretched
* **`smoothLen`** 3–5 to reduce noise
* **Range-day bias (fade edges)**
* Keep thresholds closer (e.g., +50/−50) for quicker state changes
* Lower **`zHot`** slightly (1.6–1.7) to catch earlier exhaustion
* Consider slightly shorter TSI (e.g., 21/9/5) for faster EXH response
* **Scalping LTF (1–3m)**
* TSI 21/9/5, **`smoothLen`** 1–2
* Thresholds +/-50; **`zNewMax`** 1.0–1.2; **`zHot`** 1.6–1.8
* StrictNR **off** if you want earlier calls (accept more noise)
* **Swing / HTF (1h–D)**
* TSI 35/21/9, **`smoothLen`** 4–7
* Thresholds +/-60\~65; **`zNewMax`** 1.2; **`zHot`** 1.8–2.0
* StrictNR **on** for cleaner bias
---
## Playbooks (how to actually trade it)
* **Go/No-Go Filter**
* Only take **long entries** when the oscillator is **above the neutral band** (preferably ≥ `upThresh`).
* Only take **short entries** when **below** the neutral band (preferably ≤ `dnThresh`).
* Avoid fresh go-with entries if an **EXH** tag appears; let the next setup re-arm.
* **Trend Genesis**
* Treat **NEW↑ / NEW↓** as “green light” for **first pullback** entries in the new direction (ideally within acceptable |Z|).
* **Trend Maturity**
* When in a position and **EXH** prints **against** you, tighten stops, take partials, or lean on your exit tool to protect gains.
---
## Suggested starting points
* **Day trading (5–15m):**
* TSI 25/13/7, `smoothLen=3`, thresholds **+55 / −55**, `zNewMax = 1.2`, `zHot = 1.8`, **StrictNR = true**
* **Scalping (1–3m):**
* TSI 21/9/5, `smoothLen=1–2`, thresholds **+50 / −50**, `zNewMax = 1.1–1.2`, `zHot = 1.6–1.8`, **StrictNR = false** (optional)
* **Swing (1h–D):**
* TSI 35/21/9, `smoothLen=4–6`, thresholds **+60 / −60**, `zNewMax = 1.2`, `zHot = 1.9–2.0`, **StrictNR = true**
---
## Notes & best practices
* **Session anchoring**: Z-score is session-anchored (resets by trading date). If you trade outside standard sessions, verify your data session.
* **Instrument specificity**: Tune **`zHot`**, **`zNewMax`**, and thresholds per symbol and timeframe.
* **Bar-close discipline**: Evaluate tags at **bar close** to avoid intrabar flip-flop.
* This is a **context/confirmation tool**, not a broker or strategy. Combine with your entry/exit rules and position sizing.
---
**Tip:** Start with the suggested day-trading profile. Use this oscillator as your **gate** (only trade with it), let your entry engine time executions, and rely on your exit tool for standardized profit-taking.

Wolf Exit Oscillator Enhanced
# Wolf Exit Oscillator Enhanced
## What it is (quick take)
**Wolf Exit Oscillator Enhanced** is a clean, rules-first **exit timing tool** built on the **True Strength Index (TSI)** with two optional safeguards:
1. **Signal-line crossover** (to avoid bailing on shallow dips), and
2. **EMA confirmation** (price-based “is the trend actually weakening/strengthening?” check).
Use it to standardize when you **take profits, cut losers, or scale out**—especially after momentum runs hot or cold.
> Works best **paired** with:
>
> * **ABS NR — Fail-Safe Confirm (v4.2.2)** for entries
> * **ABS Companion Oscillator — Trend / Exhaustion / New Trend** for trend/exhaustion context
---
## How to use it (operational workflow)
1. **Set your bands**
* `exitHigh` and `exitLow` mark “overcooked” zones on the TSI scale (default: +60 / –60).
* Above `exitHigh` = momentum stretched **up** (good place to **exit shorts** or **take long profits**).
* Below `exitLow` = momentum stretched **down** (good place to **exit longs** or **take short profits**).
2. **Choose strictness**
* **Base mode**: the moment TSI crosses out of a band, you get an exit signal.
* **Add Signal-Line Cross** (`enableSignalX = true`): require TSI to cross its signal in the same direction → **fewer, cleaner exits**.
* **Add EMA Filter** (`enableEMAFilter = true`): also require **price** to confirm (e.g., long exit only if price < EMA). This avoids bailing during healthy trends.
3. **Execute with structure**
* **Full exit** when a signal fires, or
* **Scale out** (e.g., 50% on first signal, remainder on trail/secondary signal), or
* **Move stop** to lock gains once an exit signal prints.
4. **Alerts**
* Set to **“Once per bar close”** to avoid intrabar flip-flop.
* Use the two provided alert names for automation (see “Alerts” below).
---
## Signals & visuals
* **TSI line** (solid) and **Signal line** (dashed) with optional **histogram** (TSI − Signal).
* **Horizontal bands** at `exitHigh` and `exitLow`.
* **Labels**:
* **Exit Long** appears when long-side momentum breaks down (below `exitLow`, plus any enabled filters).
* **Exit Short** appears when short-side momentum breaks down (above `exitHigh`, plus any enabled filters).
**Alerts (stable names):**
* **WolfExit — Exit Long**
* **WolfExit — Exit Short**
---
## Non-repainting behavior (what to expect)
* The oscillator is computed with **EMAs on current timeframe**—no higher-timeframe lookahead, no repaint.
* **Intrabar**: TSI/Signal can fluctuate; use **bar-close evaluation** (and alert setting “Once per bar close”) to lock signals.
* If you enable the EMA filter, that check is also evaluated at bar close.
---
## Every input explained (and how changing it alters behavior)
### Momentum engine (TSI)
* **TSI Long EMA Length (`tsiLongLen`, default 25)**
Higher = smoother, slower momentum; fewer signals. Lower = twitchier, more signals.
* **TSI Short EMA Length (`tsiShortLen`, default 13)**
Fine-tunes responsiveness on top of the long length. Lower short → snappier TSI.
* **TSI Signal Line Length (`tsisigLen`, default 7)**
Higher = slower signal line (harder to cross) → fewer signals. Lower = easier crosses → more signals.
### Thresholds (the bands)
* **Exit Threshold High (`exitHigh`, default +60)**
Raise to demand **stronger** overbought before signaling short exits / long profit-takes. Lower to trigger sooner.
* **Exit Threshold Low (`exitLow`, default −60)**
Raise (toward 0) to trigger **earlier** on longs; lower (more negative) to wait for deeper downside stretch.
### Confirmation layers
* **Require Signal Line Crossover (`enableSignalX`, default true)**
On = TSI must cross its signal (same direction as exit) → **filters out shallow wiggles**. Off = faster, more frequent exits.
* **Enable EMA Confirmation Filter (`enableEMAFilter`, default true)**
On = require **price < EMA** for **Exit Long** and **price > EMA** for **Exit Short**.
* **EMA Exit Confirmation Length (`exitEMALen`, default 50)**
Higher = **trendier** filter (harder to flip) → fewer exits; Lower = more reactive → more exits.
### Visuals
* **Show Histogram (`showHist`)**
On = quick visual for TSI–Signal spread (helps spot weakening momentum before a cross).
* **Plot Exit Signals (`showSignals`)**
Toggle labels if you only want the lines/bands with alerts.
---
## Tuning recipes (quick, practical)
* **Strong trend days (avoid premature exits)**
* Keep **`enableSignalX = true`** and **`enableEMAFilter = true`**
* Increase **`exitEMALen`** (e.g., 80)
* Consider raising **`exitHigh`** to 65–70 (and lowering **`exitLow`** to −65/−70)
* **Choppy/range days (exit faster, take the cash)**
* **`enableEMAFilter = false`** (don’t wait for price filter)
* **`enableSignalX`** optional; try off for quicker responses
* Bring bands closer to **±50** to take profits earlier
* **Scalping / lower timeframes**
* Shorten **TSI lengths** a bit (e.g., 21/9/5)
* Consider **`exitHigh=55 / exitLow=-55`**
* Keep **histogram on** to visualize momentum flip risk
* **Swing trading / higher timeframes**
* Lengthen **TSI** (e.g., 35/21/9) and **`exitEMALen`** (e.g., 100)
* Wider bands (±65 to ±75) to catch bigger moves before exiting
---
## Playbooks (how to actually trade it)
* **Entry from ABS NR FS, exit with Wolf**
* Take entries from **ABS NR — Fail-Safe Confirm** (triangle).
* Use **Wolf Exit** to scale out: 50% on first exit label, trail remainder with price/EMA or your stop logic.
* **Pyramid & protect**
* Add on re-accelerations (TSI pulls back toward zero without breaching the opposite band).
* The first **Exit** signal → take partial, raise stop to last higher low / lower high.
* **Mean-reversion fade management**
* When fading with ABS NR (KC band pokes + stretched |Z|), target the first opposite **Exit** signal as your “don’t overstay” cue.
---
## Suggested starting points
* **Day trading (5–15m):**
* TSI: **25 / 13 / 7** (default)
* Bands: **+60 / −60**
* Confirmations: **SignalX = on**, **EMA Filter = on**, **EMA Len = 50**
* Alerts: **Once per bar close**
* **Scalping (1–3m):**
* TSI: **21 / 9 / 5**
* Bands: **±55**
* Confirmations: **SignalX = on**, **EMA Filter = off** (optional for speed)
* **Swing (1h–D):**
* TSI: **35 / 21 / 9**
* Bands: **+65 / −65** (or ±70)
* Confirmations: **SignalX = on**, **EMA Filter = on**, **EMA Len = 100**
---
## Best-practice pairings
* **Entries:** **ABS NR — Fail-Safe Confirm (v4.2.2)**
* Take ABS triangles; let Wolf standardize exits so you’re not guessing.
* **Context:** **ABS Companion Oscillator**
* Prefer holding longer when the companion stays above (for longs) or below (for shorts) its neutral band and **no EXH tag** prints.
* If companion flags **EXH** against your position, tighten stops; Wolf’s next exit signal becomes high priority.
---
## Notes & disclaimers
* This is an **exit signal tool**, not a strategy or broker.
* Signals are strongest when aligned with your **entry logic** and a **risk framework** (position sizing, stops, partials).
* All evaluations are **current timeframe**; no higher-timeframe lookahead is used.
* Markets change—tune the bands and confirmations per symbol/timeframe.
---
**Tip:** Keep your alerts simple—one for **Exit Long**, one for **Exit Short**, **Once per bar close**. Use partial exits on the first signal, and let your stop/trailing logic handle the rest.

📱 Mobile EMA + Trendline Bias (edegrano)📱 Mobile EMA + Trendline Bias (edegrano) — User Manual
Purpose
This indicator provides a simplified, mobile-friendly overview of trend bias using EMA and multi-timeframe regression trendline confluences, plus plots EMA lines and a small info table on the chart.
Inputs Explained
Input Name Description
Custom EMA Timeframe The timeframe on which the EMA 50 and EMA 200 calculations are based (e.g., 1, 3, 5 minutes). This lets you choose which timeframe to analyze EMA trend bias.
Show EMAs on Chart Toggle to show or hide EMA 50 (blue) and EMA 200 (red) lines on your chart.
Regression Length The length (number of bars) used for calculating the linear regression trendlines on fixed 1m, 3m, and 5m timeframes. Lower values make trendlines more reactive, higher values smooth out noise.
Show EMA 50 Bias Row Show or hide the EMA 50 vs EMA 200 bias row in the info table.
Show Trendline Slope Row Show or hide the multi-timeframe trendline slope bias row in the info table.
What It Shows
EMA Lines: EMA 50 (blue) and EMA 200 (red) based on your selected timeframe.
Trendline Slopes: Using linear regression on 1-minute, 3-minute, and 5-minute charts to gauge short-term trend direction.
Info Table (Bottom Left):
EMA 50 > EMA 200 status on your selected timeframe (Bullish/Bearish)
Trendline slope bias combining the 3 fixed timeframes (Bullish/Bearish/Neutral)
Final Suggestion showing overall bias:
Strong Buy 💎 if both EMA and trendline biases are bullish
Strong Sell 💎 if both are bearish
Mixed / Neutral otherwise
Tag on Chart Corner: Displays “📱 edegrano Mobile” label for quick identification.
How To Use
Set the Custom EMA Timeframe:
Choose a timeframe that fits your trading style (e.g., 1m for scalping, 5m for day trading).
Adjust Regression Length:
For faster signals, lower the regression length (e.g., 15).
For smoother, less noisy signals, increase it (e.g., 30 or higher).
Toggle EMA Lines Display:
Show or hide EMA lines based on your preference for chart clarity.
Use the Info Table:
Quickly glance at EMA and trendline bias across timeframes for confluence confirmation.
Interpret the Final Suggestion:
Follow “Strong Buy” or “Strong Sell” signals for potential entry points. If “Mixed / Neutral,” wait for stronger confirmation.
Suggested Parameters by Trading Style
Style EMA Timeframe Regression Length Notes
Scalping 1 min 15-20 Responsive, fast reaction to price
Day Trading 3-5 min 20-30 Balanced sensitivity
Swing Trading 15-30 min 30-50 Smoother trend detection
Position Trading 1 hr+ 50-100 Very smooth, low noise
Tips
Combine this indicator with volume or other indicators for stronger confirmation.
Use the EMA lines on chart visually to confirm trend direction.
The info table updates in real-time, making it easy for quick decisions on mobile.
Adjust inputs and observe how the final suggestion changes to tune for your asset and timeframe.

Mutanabby_AI | Fresh Algo V24Mutanabby_AI | Fresh Algo V24: Advanced Multi-Mode Trading System
Overview
The Mutanabby_AI Fresh Algo V24 represents a sophisticated evolution of multi-component trading systems that adapts to various market conditions through advanced operational configurations and enhanced analytical capabilities. This comprehensive indicator provides traders with multiple signal generation approaches, specialized assistant functions, and dynamic risk management tools designed for professional market analysis across diverse trading environments.
Primary Signal Generation Framework
The Fresh Algo V24 operates through two fundamental signal generation approaches that accommodate different market perspectives and trading philosophies. The Trending Signals Mode serves as the primary trend-following mechanism, combining Wave Trend Oscillator analysis with Supertrend directional signals and Squeeze Momentum breakout detection. This mode incorporates ADX filtering that requires values exceeding 20 to ensure sufficient trend strength exists before signal activation, making it particularly effective during sustained directional market movements where momentum persistence creates profitable trading opportunities.
The Contrarian Signals Mode provides an alternative approach targeting reversal opportunities through extreme market condition identification. This mode activates when the Wave Trend Oscillator reaches critical threshold levels, specifically when readings surpass 65 indicating potential bearish reversal conditions or drop below 35 suggesting bullish reversal opportunities. This methodology proves valuable during overextended market phases where mean reversion becomes statistically probable.
Advanced Filtering Mechanisms
The system incorporates multiple sophisticated filtering mechanisms designed to enhance signal quality and reduce false positive occurrences. The High Volume Filter requires volume expansion confirmation before signal activation, utilizing exponential moving average calculations to ensure institutional participation accompanies price movements. This filter substantially improves signal reliability by eliminating low-conviction breakouts that lack adequate volume support from professional market participants.
The Strong Filter provides additional trend confirmation through 200-period exponential moving average analysis. Long position signals require price action above this benchmark level, while short position signals necessitate price action below it. This ensures strategic alignment with longer-term trend direction and reduces the probability of trading against major market movements that could invalidate shorter-term signals.
Cloud Filter Configuration System
The Fresh Algo V24 offers four distinct cloud filter configurations, each optimized for specific trading timeframes and market approaches. The Smooth Cloud Filter utilizes the mathematical relationship between 150-period and 250-period exponential moving averages, providing stable trend identification suitable for position trading strategies. This configuration generates signals exclusively when price action aligns with cloud direction, creating a more deliberate but highly reliable signal generation process.
The Swing Cloud Filter employs modified Supertrend calculations with parameters specifically optimized for swing trading timeframes. This filter achieves optimal balance between responsiveness and stability, adapting effectively to medium-term price movements while filtering excessive market noise that typically affects shorter-term analytical systems.
For active intraday traders, the Scalping Cloud Filter utilizes accelerated Supertrend calculations designed to capture rapid trend changes effectively. This configuration provides enhanced signal generation frequency suitable for compressed timeframe strategies. The advanced Scalping+ Cloud Filter incorporates Hull Moving Average confirmation, delivering maximum responsiveness for ultra-short-term trading while maintaining signal quality through additional momentum validation processes.
Specialized Assistant Functionality
The system includes two distinct assistant modes that provide supplementary market analysis capabilities. The Trend Assistant Mode activates advanced cloud analysis overlays that display dynamic support and resistance zones calculated through adaptive volatility algorithms. These levels automatically adjust to current market conditions, providing visual guidance for identifying trend continuation patterns and potential reversal areas with mathematical precision.
The Trend Tracker Mode concentrates on long-term trend identification by displaying major exponential moving averages with color-coded fill areas that clarify directional bias. This mode maintains visual simplicity while providing comprehensive trend context evaluation, enabling traders to quickly assess broader market direction and align shorter-term strategies accordingly.
Dynamic Risk Management System
The integrated risk management system automatically adapts across all operational modes, calculating stop loss and take profit targets using Average True Range multiples that adjust to current market volatility. This approach ensures consistent risk parameters regardless of selected operational mode while maintaining relevance to prevailing market conditions.
Stop loss placement occurs at dynamically calculated distances from entry points, while three progressive take profit targets establish at customizable ATR multiples respectively. The system automatically updates these levels upon trend direction changes, ensuring current market volatility influences all risk calculations and maintains appropriate risk-reward ratios throughout trade management.
Comprehensive Market Analysis Dashboard
The sophisticated dashboard provides real-time market analysis including volatility measurements, institutional activity assessment, and multi-timeframe trend evaluation across five-minute through four-hour periods. This comprehensive market context assists traders in selecting appropriate operational modes based on current market characteristics rather than relying exclusively on historical performance data.
The multi-timeframe analysis ensures mode selection considers broader market context beyond the primary trading timeframe, improving overall strategic alignment and reducing conflicts between different temporal market perspectives. The dashboard displays market state classification, volatility percentages, institutional activity levels, current trading session information, and trend pressure indicators with professional formatting and clear visual hierarchy.
Enhanced Trading Assistants
The Fresh Algo V24 includes specialized trading assistant features that complement the primary signal generation system. The Reversal Dot functionality identifies potential reversal points through Wave Trend Oscillator analysis, displaying visual indicators when crossover conditions occur at extreme levels. These reversal indicators provide early warning signals for potential trend changes before they appear in the primary signal system.
The Dynamic Take Profit Labels feature automatically identifies optimal profit-taking opportunities through RSI threshold analysis, marking potential exit points at multiple levels for long positions and corresponding levels for short positions. This automated profit management system helps traders optimize exit timing without requiring constant manual monitoring of technical indicators.
Advanced Alert System
The comprehensive alert system accommodates all operational modes while providing granular notification control for various signal types and risk management events. Traders can configure separate alerts for normal buy signals, strong buy signals, normal sell signals, strong sell signals, stop loss triggers, and individual take profit target achievements.
Cloud crossover alerts notify traders when trend direction changes occur, providing early indication of potential strategy adjustments. The alert system includes detailed trade setup information, timeframe data, and relevant entry and exit levels, ensuring traders receive complete context for informed decision-making without requiring constant chart monitoring.
Technical Foundation Architecture
The Fresh Algo V24 combines multiple proven technical analysis components including Wave Trend Oscillator for momentum assessment, Supertrend for directional bias determination, Squeeze Momentum for volatility analysis, and various exponential moving averages for trend confirmation. Each component contributes specific market insights while the unified system provides comprehensive market evaluation through their mathematical integration.
The multi-component approach reduces dependency on individual indicator limitations while leveraging the analytical strengths of each technical tool. This creates a robust analytical framework capable of adapting to diverse market conditions through appropriate mode selection and parameter optimization, ensuring consistent performance across varying market environments.
Market State Classification
The indicator incorporates advanced market state classification through ADX analysis, distinguishing between trending, ranging, and transitional market conditions. This classification system automatically adjusts signal sensitivity and filtering parameters based on current market characteristics, optimizing performance for prevailing conditions rather than applying static analytical approaches.
The volatility measurement system calculates current market activity levels as percentages, providing quantitative assessment of market energy and helping traders select appropriate operational modes. Institutional activity detection through volume analysis ensures signal generation aligns with professional market participation patterns.
Implementation Strategy Considerations
Successful implementation requires careful matching of operational modes to prevailing market conditions and individual trading objectives. Trending modes demonstrate optimal performance during directional markets with sustained momentum characteristics, while contrarian modes excel during range-bound or overextended market conditions where reversal probability increases.
The cloud filter configurations provide varying degrees of confirmation strength, with smoother settings reducing false signal occurrence at the expense of some responsiveness to price changes. Traders must balance signal quality against signal frequency based on their risk tolerance and available trading time, utilizing the comprehensive customization options to optimize performance for their specific requirements.
Multi-Timeframe Integration
The system provides seamless multi-timeframe analysis through the integrated dashboard, displaying trend alignment across multiple time horizons from five-minute through four-hour periods. This analysis helps traders understand broader market context and avoid conflicts between different temporal perspectives that could compromise trade outcomes.
Session analysis identifies current trading session characteristics, providing context for expected market behavior patterns and helping traders adjust their approach based on typical session volatility and participation levels. This geographic market awareness enhances strategic decision-making and improves timing for trade execution.
Advanced Visualization Features
The indicator includes sophisticated visualization capabilities through gradient candle coloring based on MACD analysis, providing immediate visual feedback on momentum strength and direction. This enhancement allows rapid market assessment without requiring detailed indicator analysis, improving efficiency for traders managing multiple instruments simultaneously.
The cloud visualization system uses color-coded fill areas to clearly indicate trend direction and strength, with automatic adaptation to selected operational modes. This visual clarity reduces analytical complexity while maintaining comprehensive market information display through professional chart presentation.
Performance Optimization Framework
The Fresh Algo V24 incorporates performance optimization features including signal strength classification, automatic parameter adjustment based on market conditions, and dynamic filtering that adapts to current volatility levels. These optimizations ensure consistent performance across varying market environments while maintaining signal quality standards.
The system automatically adjusts sensitivity levels based on selected operational modes, ensuring appropriate responsiveness for different trading approaches. This adaptive framework reduces the need for manual parameter adjustments while maintaining optimal performance characteristics for each operational configuration.
Conclusion
The Mutanabby_AI Fresh Algo V24 represents a comprehensive solution for professional trading analysis, combining multiple analytical approaches with advanced visualization and risk management capabilities. The system's strength lies in its adaptive multi-mode design and sophisticated filtering mechanisms, providing traders with versatile tools for various market conditions and trading styles.
Success with this system requires understanding the relationship between different operational modes and their optimal application scenarios. The comprehensive dashboard and alert system provide essential market context and trade management support, enabling systematic approach to market analysis while maintaining flexibility for individual trading preferences.
The indicator's sophisticated architecture and extensive customization options make it suitable for traders at all experience levels, from those seeking systematic signal generation to advanced practitioners requiring comprehensive market analysis tools. The multi-timeframe integration and adaptive filtering ensure consistent performance across diverse market conditions while providing clear guidelines for strategic implementation.

Multi Timeframe Fair Value Gap Indicator ProMulti Timeframe Fair Value Gap Indicator Pro | MTF FVG Imbalance Zones | Institutional Supply Demand Levels
🎯 The Most Comprehensive Multi-Timeframe Fair Value Gap (FVG) Indicator on TradingView
Transform Your Trading with Institutional-Grade Multi-Timeframe FVG Analysis
Keywords: Multi Timeframe Indicator, MTF FVG, Fair Value Gap, Imbalance Zones, Supply and Demand, Institutional Trading, Order Flow Imbalance, Price Inefficiency, Smart Money Concepts, ICT Concepts, Volume Imbalance, Liquidity Voids, Multi Timeframe Analysis
📊 WHAT IS THIS INDICATOR?
The Multi Timeframe Fair Value Gap Indicator Pro is the most advanced FVG detection system on TradingView, designed to identify high-probability institutional supply and demand zones across multiple timeframes simultaneously. This professional-grade tool automatically detects Fair Value Gaps (FVGs), also known as imbalance zones, liquidity voids, or inefficiency gaps - the exact areas where institutional traders enter and exit positions.
🔍 What Are Fair Value Gaps (FVGs)?
Fair Value Gaps are three-candle price formations that create imbalances in the market structure. These gaps represent areas where buying or selling was so aggressive that price moved too quickly, leaving behind an inefficient zone that price often returns to "fill" or "mitigate." Professional traders use these zones as high-probability entry points.
Bullish FVG: When the low of candle 3 is higher than the high of candle 1
Bearish FVG: When the high of candle 3 is lower than the low of candle 1
⚡ KEY FEATURES
📈 Multi-Timeframe Analysis (MTF)
- 12 Timeframes Simultaneously: 1m, 3m, 5m, 15m, 30m, 45m, 1H, 2H, 3H, 4H, Daily, Weekly
- Real-Time Detection: Instantly identifies FVGs as they form across all selected timeframes
- Customizable Timeframe Selection: Choose which timeframes to display based on your trading style
- Higher Timeframe Confluence: See when multiple timeframes align for stronger signals
🎨 Three Professional Visual Themes
1. Dark Intergalactic: Futuristic neon colors with high contrast for dark mode traders
2. Light Minimal: Clean, professional appearance for traditional charting
3. Pro Modern: Low-saturation colors for extended screen time comfort
📊 Advanced FVG Dashboard
- Live FVG Counter: Real-time count of active bullish and bearish gaps
- Total Zone Tracking: Monitor all active imbalance zones at a glance
- Theme-Adaptive Display: Dashboard automatically adjusts to your selected visual theme
- Strategic Positioning: Optimally placed to not interfere with price action
🔧 Smart Zone Management
- Dynamic Zone Updates: FVG boxes automatically adjust when price touches them
- Mitigation Detection: Visual feedback when zones are tested or filled
- Color-Coded Status: Instantly see untested vs tested zones
- Extended Projection: Option to extend boxes to the right for future reference
- Timeframe Labels: Optional labels showing which timeframe each FVG originated from
💡 Intelligent Features
- Automatic Zone Cleanup: Removes fully mitigated FVGs to keep charts clean
- Touch-Based Level Adjustment: Zones adapt to partial fills
- Maximum Box Management: Optimized to handle 500 simultaneous FVG zones
- Performance Optimized: Efficient code ensures smooth operation even with multiple timeframes
🎯 TRADING APPLICATIONS
Day Trading & Scalping
- Use 1m, 3m, 5m FVGs for quick scalp entries
- Combine with higher timeframe FVGs for directional bias
- Perfect for futures (ES, NQ, MNQ), forex, and crypto scalping
Swing Trading
- Focus on 1H, 4H, and Daily FVGs for swing positions
- Identify major support/resistance zones
- Plan entries at untested higher timeframe gaps
Position Trading
- Utilize Daily and Weekly FVGs for long-term positions
- Identify institutional accumulation/distribution zones
- Major reversal points at significant imbalance areas
Multi-Timeframe Confluence Trading
- Stack multiple timeframe FVGs for high-probability zones
- Confirm entries when lower and higher timeframe FVGs align
- Professional edge through timeframe confluence
📚 HOW TO USE THIS INDICATOR
Step 1: Add to Your Chart
Click "Add to Favorites" and apply to any trading instrument - works on all markets including stocks, forex, crypto, futures, and indices.
Step 2: Configure Your Timeframes
In settings, select which timeframes you want to monitor. Day traders might focus on 1m-15m, while swing traders might use 1H-Weekly.
Step 3: Choose Your Visual Theme
Select from three professional themes based on your preference and trading environment.
Step 4: Identify Trading Opportunities
For Long Entries:
- Look for Bullish FVGs (green/cyan zones)
- Wait for price to return to untested zones
- Enter when price shows rejection from the FVG zone
- Higher timeframe FVGs provide stronger support
For Short Entries:
- Look for Bearish FVGs (red/pink zones)
- Wait for price to return to untested zones
- Enter when price shows rejection from the FVG zone
- Higher timeframe FVGs provide stronger resistance
Step 5: Manage Risk
- Place stops beyond the FVG zone
- Use partially filled FVGs as trailing stop levels
- Exit when opposite FVGs form (reversal signal)
🏆 WHY THIS IS THE BEST MTF FVG INDICATOR
✅ Most Comprehensive
- More timeframes than any other FVG indicator
- Advanced features not found elsewhere
- Professional-grade visual presentation
✅ Institutional-Grade
- Based on smart money concepts (SMC)
- ICT (Inner Circle Trader) methodology compatible
- Used by professional prop traders
✅ User-Friendly
- Clean, intuitive interface
- Detailed tooltips and descriptions
- Works out-of-the-box with optimal defaults
✅ Continuously Updated
- Regular improvements and optimizations
- Community feedback incorporated
- Professional development by PineProfits
🔥 PERFECT FOR
- Scalpers seeking quick FVG fills
- Day Traders using multi-timeframe analysis
- Swing Traders identifying major zones
- ICT/SMC Traders following smart money
- Prop Firm Traders needing reliable setups
- Algorithmic Traders building systematic strategies
- Technical Analysts studying market structure
- All Experience Levels from beginners to professionals
💎 ADVANCED TIPS
1. Confluence is Key: The strongest signals occur when multiple timeframe FVGs align at the same price level
2. Fresh vs Tested: Untested FVGs (original color) are stronger than tested ones (gray/muted color)
3. Time of Day: FVGs formed during high-volume sessions (London/NY) are more reliable
4. Trend Alignment: Trade FVGs in the direction of the higher timeframe trend for best results
5. Volume Confirmation: Combine with volume indicators for enhanced reliability
📈 INDICATOR SETTINGS
Visual Settings
- Visual Theme: Choose between Dark Intergalactic, Light Minimal, or Pro Modern
- Show Branding: Toggle PineProfits branding on/off
General Settings
- Move box levels with price touch: Dynamically adjust FVG zones
- Change box color with price touch: Visual feedback for tested zones
- Extend boxes to the right: Project zones into the future
- Plot Timeframe Label: Show origin timeframe on each FVG
- Show FVG Dashboard: Toggle the summary dashboard
Timeframe Selection
Select any combination of 12 available timeframes (1m to Weekly)
🚀 GET STARTED NOW
1. Click "Add to Favorites" to save this indicator
2. Apply to your chart - works on any instrument
3. Join thousands of traders already using this professional tool
4. Follow PineProfits for more institutional-grade indicators
⚖️ DISCLAIMER
This indicator is for educational and informational purposes only. It should not be considered financial advice. Always do your own research and practice proper risk management. Past performance does not guarantee future results. Trade responsibly.
© PineProfits - Professional Trading Tools for Modern Markets
If you find this indicator valuable, please leave a like and comment. Your support helps me create more professional-grade tools for the TradingView community!

KSL-Fullsystem📊 KSL-Fullsystem
ระบบช่วยวิเคราะห์การเทรดอัจฉริยะ ที่ออกแบบมาสำหรับเทรดเดอร์จริงจังที่ต้องการ "ความแม่นยำ + ความมั่นใจ" ในทุกการเข้าออเดอร์
🎯 จุดเด่นของระบบนี้:
✅ ตรวจจับสัญญาณกลับตัว (Shift) จากพฤติกรรมแท่งเทียน
✅ ยืนยันสัญญาณด้วยอินดิเคเตอร์หลากหลาย เช่น EMA, SMA, LWMA, MACD, AO, AC
✅ รองรับทุกสไตล์การเทรด: Scalping, Day Trade, Swing Trade, Trend Following
✅ คำนวณจุดเข้า (Entry), TP1-TP3 และ SL ให้อัตโนมัติ
✅ แสดงโซนแนวรับ/แนวต้านด้วยกล่องสีสบายตา
✅ ปรับเปิด-ปิดฟิลเตอร์แต่ละตัวได้ตามกลยุทธ์ส่วนตัว
🧠 ระบบจะช่วยให้คุณ:
มองเห็น “จังหวะที่ตลาดเปลี่ยนทิศ” อย่างแม่นยำ
วางแผนความเสี่ยงอย่างเป็นระบบ ด้วย Risk:Reward ชัดเจน
ลดความลังเล เพิ่มความมั่นใจในการเข้าออเดอร์
💬 หากคุณอยากใช้งานระบบนี้
หรืออยากให้ทีมเราช่วยแนะนำการตั้งค่าที่เหมาะกับสไตล์ของคุณ
📩 ทักไลน์มาได้เลยที่ 👉 @kasalong
ทดลองแล้วคุณจะรู้ว่า “เทรดอย่างมีระบบ” ดีกว่าการเทรดแบบเดาสุ่มแค่ไหน! 🚀📈
หากต้องการเวอร์ชันแบบโพสต์ Facebook / LINE OA หรือแบบ Banner ก็แจ้งได้นะครับ ผมจัดให้ได้เลย 😎
📊 KSL-Fullsystem
A smart trading analysis system designed for serious traders who value precision and confidence in every entry.
🎯 Key Features:
✅ Detects reversal signals using advanced candlestick shift logic
✅ Confirms signals with a powerful set of indicators: EMA, SMA, LWMA, MACD, AO, and AC
✅ Supports all trading styles: Scalping, Day Trade, Swing, and Trend Following
✅ Automatically calculates Entry, TP1-TP3, and SL based on risk/reward logic
✅ Visualizes support/resistance zones with dynamic colored boxes
✅ Fully customizable filters to match your unique strategy
🧠 This system helps you:
Spot key turning points in the market
Plan risk/reward clearly with calculated levels
Trade with structure and confidence – not guesswork
💬 Interested in using this tool?
Need help setting it up to match your trading style?
📩 Contact us via LINE 👉 @kasalong
Once you try it, you'll never want to trade blindly again. 🚀📈

Fundur - Market Sentiment A Fundur - Market Sentiment A: Complete Trading Indicator Guide
Indicator Overview
The Fundur - Market Sentiment A is a revolutionary multi-timeframe sentiment analysis indicator that combines advanced ZigZag pivot detection, wave-based structure analysis, and comprehensive market sentiment evaluation into one powerful trading tool. This indicator is designed to identify high-probability reversal points and trend continuations by analyzing market sentiment across 11 different timeframes simultaneously.
What Makes Market Sentiment A Unique?
Market Sentiment A is a sophisticated ZigZag system that utilizes the Market Sentiment B oscillator to perform advanced on-chart analysis against price action. By introducing Histogram-Correlated ZigZag Analysis - a breakthrough methodology that correlates sentiment histogram waves with actual price pivots to identify validated market extremes. Unlike static pivot indicators, Market Sentiment A provides dynamic analysis that adapts to changing market conditions while maintaining precise accuracy in pivot identification.
Core Methodology
The indicator operates on the principle that market sentiment oscillates in measurable waves that precede price movements. By analyzing sentiment patterns across multiple timeframes and correlating them with histogram wave behavior, traders can identify precise entry and exit points with quantifiable strength ratings and comprehensive wave event analysis.
Key Features
🎯 Revolutionary ZigZag System
Histogram-Correlated Detection : Unique correlation between sentiment waves and price pivots
Dynamic Speed Control : High, Medium, Low sensitivity settings for different market conditions
Validated Extremes : Only confirmed pivots are marked with comprehensive validation system
Real-Time Correlation : Live correlation between histogram turns and price extremes
📊 Multi-Timeframe Sentiment Engine
11 Timeframe Analysis : Simultaneous analysis across periods from 8 to 987 bars
Advanced Sentiment Calculation : Proprietary algorithm combining multiple sentiment factors
Momentum Wave Integration : 34-period momentum waves for trend context
Dynamic Smoothing : Optional smoothing for cleaner signals
🧠 Intelligent Wave Event Tracking
Green Wave Events : Bullish histogram wave analysis with comprehensive event detection
Red Wave Events : Bearish histogram wave analysis with detailed event tracking
Event Deduplication : Advanced system prevents duplicate event detection
10+ Event Types : MPIV, HTURN, TRI, SW, VOL, MDIV, HDIV, PDIV and more
⚖️ Advanced Strength Rating System
0-100 Strength Score : Comprehensive strength calculation for every pivot
Multi-Factor Analysis : Based on wave events, trend context, structure, and sentiment
Real-Time Calculation : Dynamic strength scoring as conditions change
Strength Breakdown : Detailed tooltip showing strength components
🎨 Sophisticated Visual System
Validated Pivot Labels : Clear ✓ markers for confirmed extremes
Structure Analysis : HH/HL/LH/LL structure identification with trend context
Dynamic ZigZag Lines : Connecting validated extremes with trend-based coloring
Bar Coloring Options : Momentum swings and market sentiment bar coloring
Comprehensive Tooltips : Detailed information on hover for every pivot
Setup Guide
Step 1: Adding the Indicator
Open TradingView and navigate to your desired chart
Click the "Indicators" button or press "/" key
Search for "Fundur - Market Sentiment A"
Add the indicator to your chart
Step 2: Core System Configuration
ZigZag System Settings
✅ Enable ZigZag System: ON (Core functionality)
ZigZag Speed : Choose based on your trading style:
High Speed : Most sensitive, fastest detection (2-bar lookback) - Best for scalping
Medium Speed : Balanced approach (3-bar lookback) - Recommended for most traders
Low Speed : Most reliable, slower detection (4-bar lookback) - Best for swing trading
✅ Show ZigZag Lines: ON (Visual connection of validated pivots)
Bar Coloring Settings
⚠️ Momentum Swings: OFF (Avoid visual clutter initially)
✅ Market Sentiment: ON (Primary sentiment-based bar coloring)
Step 3: Label Display Configuration
Essential Labels (Recommended Settings)
✅ Show Validated Pivots (✓): ON (Core validated extremes)
⚠️ Show Potential Turns (●): OFF (Reduces noise - enable once familiar)
⚠️ Show Structure Labels: OFF (Start clean, enable for advanced analysis)
⚠️ Include Trend in Structure Labels: OFF (Advanced feature)
✅ Show Strength Rating (💪): ON (Critical for trade quality assessment)
⚠️ Show Market Sentiment Wave Events: OFF (Advanced feature for later)
Label Visual Customization
Label Coloring : Standard (Highs=Red, Lows=Green)
Label Size : Normal
Label Transparency : 0%
Text Transparency : 0%
Step 4: Alert System Setup
✅ Enable Alerts: ON
⚠️ Alert Potential Bullish Turns: OFF (Disabled by design to prevent noise)
⚠️ Alert Potential Bearish Turns: OFF (Disabled by design to prevent noise)
✅ Alert ONLY on Confirmed Extremes: ON (High-quality signals only)
✅ Include Wave Events in Confirmed Alerts: ON (Comprehensive context)
Basic Trading Guide
Understanding the Dynamic ZigZag System
Market Sentiment A is fundamentally a Dynamic ZigZag System that displays validated highs and lows on your price chart. The indicator uses Market Sentiment B wave calculations internally to determine when sentiment waves finish, but these histograms and oscillators are NOT displayed on your chart .
What You See on Your Chart:
✓ Validated Highs : Red checkmarks marking confirmed resistance levels
✓ Validated Lows : Green checkmarks marking confirmed support levels
ZigZag Lines : Connecting validated extremes to show market structure
💪 Strength Ratings : 0-100 scores indicating signal quality
Structure Labels : HH/HL/LH/LL showing trend context
How Validation Works (Behind the Scenes):
High Validation : Uses Market Sentiment B wave analysis to confirm when a price high represents a true resistance level
Low Validation : Uses Market Sentiment B wave analysis to confirm when a price low represents a true support level
Dynamic Detection : Continuously monitors sentiment waves to validate extremes in real-time
Quality Filtering : Only displays the most significant highs and lows based on wave completion
Key Trading Concept:
Focus entirely on the validated highs and lows displayed on your chart. These represent dynamic support and resistance levels that have been confirmed by underlying sentiment analysis. The histogram and oscillator calculations happen internally - your trading decisions should be based on price action around these validated levels.
Entry Strategies
Primary Strategy: Dynamic Support/Resistance Reversals
Setup : Wait for validated pivot with ✓ marker and strength rating displayed on chart
Entry Timing : Enter on the bar when validation occurs or on pullback to the validated level
Direction : Counter-trend to the validated extreme (buy at validated lows/support, sell at validated highs/resistance)
Confirmation : Look for strength rating above 60 for higher probability setups
Structure Context : Consider overall trend using HH/HL/LH/LL structure labels
Secondary Strategy: ZigZag Trend Continuation
Setup : Identify trend direction using consecutive validated highs and lows
Entry : Enter in trend direction when price pulls back to previous validated level
Confirmation : Look for structure labels confirming trend (HH/HL for uptrend, LH/LL for downtrend)
Strength Filter : Use strength ratings above 70 for trend continuation entries
Stop Loss Methodology
For Long Positions (Validated Lows) : Place stop below the validated low price level
For Short Positions (Validated Highs) : Place stop above the validated high price level
Alternative Method : Use previous validated extreme in opposite direction as stop level
Structure-Based Method : Use significant validated levels that would invalidate the trade setup
Buffer Consideration : Add small buffer beyond validated level to account for wicks and spread
Profit Taking Strategy
For Long Positions (Validated Low Entries):
Target 1 : Previous validated high shown on chart (75% of position)
Target 2 : Next significant validated high or key resistance level (50% of remaining 25% = 12.5% of original position)
Target 3 : Extended targets using ZigZag structure analysis and trend context (remaining 12.5% of original position)
Management : Move stop loss to breakeven once first target (TP1) is executed
For Short Positions (Validated High Entries):
Target 1 : Previous validated low shown on chart (75% of position)
Target 2 : Next significant validated low or key support level (50% of remaining 25% = 12.5% of original position)
Target 3 : Extended targets using ZigZag structure analysis and trend context (remaining 12.5% of original position)
Management : Move stop loss to breakeven once first target (TP1) is executed
ZigZag Structure Trading Approach
Sideways Markets : Trade between validated highs and lows - buy at support, sell at resistance
Trending Markets : Use validated levels as pullback entry points in trend direction
Structure Breaks : Watch for breaks of significant validated levels to signal trend changes
Range Identification : Use consecutive validated highs and lows to identify trading ranges
Breakout Trading : Enter when price breaks beyond validated levels with strong momentum
Strength Rating Interpretation
Understanding the 0-100 Strength Score
The strength rating combines multiple factors:
Base Strength (25 points) : Fundamental pivot validation
Wave Events (12 points each) : Number and quality of wave events detected
Trend Context (5-10 points) : Alignment with overall trend direction
Structure Quality (3-8 points) : HH/HL/LH/LL structure strength
Sentiment Position (5-10 points) : Extreme sentiment readings
Momentum Context (5 points) : Momentum divergence confirmation
Strength Categories
90-100 : Exceptional strength - Highest probability setups
75-89 : Strong signal - High confidence trades
60-74 : Good signal - Solid trading opportunities
45-59 : Moderate signal - Use additional confirmation
30-44 : Weak signal - Proceed with caution
Below 30 : Very weak - Generally avoid
Wave Event Reference (Calculation Background)
Understanding Wave Events in Strength Calculations
Wave events are used internally by Market Sentiment A to calculate strength ratings and validate pivots. While these events may appear in alert messages or tooltips, they are not meant for direct trading decisions - they are calculation components that contribute to the overall strength score.
Key Wave Events (For Reference Only)
MPIV↑/MPIV↓ : Momentum pivot detection used in validation process
HTURN : Histogram turn identification used for wave completion
TRI↑/TRI↓ : Triangle pattern detection contributing to strength calculation
SW : Small wave indication affecting pivot quality assessment
VOL : Volume spike detection adding to strength scoring
MDIV↑/MDIV↓ : Momentum divergence contributing to validation strength
HDIV↑/HDIV↓ : Histogram divergence used in pivot confirmation
PDIV↑/PDIV↓ : Price divergence analysis for strength enhancement
How Wave Events Affect Your Trading
Strength Score Impact : More events generally result in higher strength ratings for validated pivots
Alert Context : Events may be mentioned in alerts to provide background on signal quality
Focus on Results : Instead of analyzing individual events, focus on the final strength rating and validated pivot levels
Trust the System : The indicator processes these events automatically - your job is to trade the validated highs and lows
Analysis Setups
Setup 1: Scalping Configuration (1-5 minute charts)
Core Settings:
ZigZag Speed: High (fastest detection for quick scalps)
Show Validated Pivots: ON
Show Strength Rating: ON
Bar Coloring: Market Sentiment
Visual Settings:
Label Size: Small (reduce visual clutter)
ZigZag Lines: ON
Potential Turns: ON (for immediate signals)
Trading Approach:
Focus on strength ratings above 70 for scalp entries
Quick entries at validated highs/lows with immediate execution
Tight stops just beyond validated levels
Target previous validated pivots shown on chart for quick profits
Use ZigZag structure to identify rapid reversal opportunities
Setup 2: Day Trading Configuration (5-15 minute charts)
Core Settings:
ZigZag Speed: Medium (balanced approach)
Show Validated Pivots: ON
Show Strength Rating: ON
Include Wave Events: ON (for context)
Visual Settings:
Label Size: Normal
Show Structure Labels: ON (for trend context)
ZigZag Lines: ON with trend coloring
Trading Approach:
Wait for strength ratings above 60 for quality setups
Use HH/HL/LH/LL structure labels for trend bias
Combine reversal trades at extremes with trend continuation at pullbacks
Hold positions targeting next validated pivot levels
Use ZigZag structure analysis for entry timing and market context
Setup 3: Swing Trading Configuration (1-4 hour charts)
Core Settings:
ZigZag Speed: Low (most reliable signals)
Show Validated Pivots: ON
Show Structure Labels: ON
Include Trend Analysis: ON
Visual Settings:
Label Size: Normal
Show all wave events for comprehensive analysis
Enable all alert types
Trading Approach:
Focus on strength ratings above 75 for swing positions
Emphasize trend continuation using ZigZag structure
Use validated level breaks for major position adjustments
Hold positions across multiple sessions targeting distant validated levels
Use comprehensive structure analysis (HH/HL/LH/LL) for entries/exits
Setup 4: Position Trading Configuration (4H-Daily charts)
Core Settings:
ZigZag Speed: Low (maximum reliability)
Show Validated Pivots: ON
Show Structure Labels: ON
Show all analysis features
Visual Settings:
Clean, comprehensive labeling
Full wave event display
Trend-based coloring for major bias
Trading Approach:
Only trade strength ratings above 80 for position entries
Focus on major ZigZag structure changes and validated level breaks
Use long-term structure analysis (HH/HL/LH/LL) for bias
Hold positions for weeks to months targeting major validated levels
Align with fundamental analysis and major market structure
Setup 5: Multi-Asset Analysis Configuration
For Forex Pairs:
Use Medium to Low speed settings
Focus on major session changes
Pay attention to news event correlation
Use strength ratings above 70
For Crypto Assets:
Medium speed for 24/7 market adaptation
Higher volatility requires strength above 75
Monitor weekend behavior patterns
Consider market sentiment cycles
For Stock Markets:
Align with market hours
Consider earnings and economic events
Use sector-specific analysis
Respect market close/open dynamics
Visual Components
Core Visual Elements
✓ Validated Pivots : Green checkmarks for confirmed lows, red for confirmed highs
● Potential Turns : Small dots showing histogram turn correlations (optional)
ZigZag Lines : Connecting validated extremes with trend-based coloring
💪 Strength Ratings : Numerical strength scores from 0-100
Structure Labels : HH/HL/LH/LL with trend context (optional)
Bar Coloring System
Market Sentiment Coloring : Based on sentiment oscillator position and momentum
Extreme Conditions : Special coloring for extreme overbought/oversold conditions
Momentum Swing Coloring : Alternative coloring based on momentum analysis
Advanced Visual Features
Wave Event Labels : Comprehensive event display within pivot labels
Trend Context : Dynamic trend identification and display
Strength Breakdown : Detailed tooltips showing strength components
Custom Coloring Modes : Standard vs trend-based coloring options
Alert System
Core Alert Types
Validated High Confirmed : When red wave validates ultimate high with full context
Validated Low Confirmed : When green wave validates ultimate low with full context
Trend Change Detected : When structure analysis detects trend shifts
Alert Message Structure
Each alert includes:
Timeframe identification
Signal type (BULLISH/BEARISH)
Structure context (HH/HL/LH/LL)
Strength score with 💪 rating
Exact price level
Wave events context (if enabled)
Setting Up Alerts
Enable desired alert types in indicator settings
Focus on "Confirmed Extremes" alerts for quality
Enable wave events for comprehensive context
Test alerts on historical data first
Set up multiple notification methods
Risk Management Framework
Strength-Based Position Sizing
Strength 90-100 : Maximum position size (3-5% risk)
Strength 75-89 : Large position size (2-3% risk)
Strength 60-74 : Standard position size (1-2% risk)
Strength 45-59 : Small position size (0.5-1% risk)
Below 45 : Avoid or minimal size (0.25% risk maximum)
Stop Loss Guidelines
Primary Method : Always use validated pivot levels for stops
Buffer Method : Add small buffer beyond validation level
Multiple Timeframe : Consider higher timeframe validated levels
Wave Event Context : Adjust stops based on event confluence
Risk-Reward Optimization
Minimum R:R : 1.5:1 for all trades
Preferred R:R : 2:1 or better for strength above 70
Exceptional Setups : 3:1+ for strength above 85
Position Management : Take 75% at TP1, 50% of remaining at TP2, close remaining at TP3
Stop Management : Move stop to breakeven after TP1 execution
Best Practices
Signal Quality Assessment
Always wait for validated pivots with ✓ checkmarks displayed on chart
Prioritize strength ratings above 60 for trade quality
Focus on the validated high/low levels rather than underlying calculations
Consider HH/HL/LH/LL structure labels for directional bias
Use ZigZag line connections to understand market structure flow
Entry Timing Optimization
Enter on validation bar or immediate pullback to validated level
Use lower timeframes for precise entry refinement around validated levels
Wait for strength score calculation completion before entry
Monitor price action around validated highs and lows
Consider multiple timeframe validated level alignment
Exit Strategy Management
Use opposite validated pivots displayed on chart as primary targets
Execute Fundur 3-stage exit: 75% at TP1, 12.5% at TP2, 12.5% at TP3
Move stop loss to breakeven immediately after TP1 execution
Monitor strength ratings of new validated levels that could reverse remaining position
Watch for structure changes (trend breaks) via HH/HL/LH/LL labels for early exit consideration
Common Mistakes to Avoid
Signal Interpretation Errors
Don't trade potential turns without ✓ validation markers
Never ignore strength ratings below 45 - they indicate weak signals
Don't chase signals after significant movement away from validated levels
Avoid overriding clear ZigZag structure and trend context
Don't ignore the relationship between consecutive validated highs and lows
Risk Management Failures
Never risk more than the strength score suggests for position sizing
Don't move stops against validated levels - they represent key structure
Avoid oversizing on "sure thing" setups - even high-strength signals can fail
Don't ignore multiple timeframe validated level context
Never trade without clear invalidation levels (validated highs/lows for stops)
System Usage Mistakes
Don't enable all features immediately - start simple
Avoid changing speed settings mid-session
Don't ignore alert system capabilities
Never disable core validation features
Don't overlook customization for your chart setup
Advanced Techniques
Multi-Timeframe ZigZag Analysis
Use higher timeframe validated levels for major bias and targets
Align lower timeframe entries with higher timeframe validated structure
Look for validated level confluence across timeframes
Monitor strength rating consistency of validated levels across periods
Advanced Structure Pattern Recognition
Identify recurring validated level patterns and their outcomes
Recognize high-probability ZigZag structure sequences
Use historical validated level patterns for target projection
Combine ZigZag analysis with other Fundur technical analysis tools
Advanced Alert Utilization
Create custom alert combinations based on strength thresholds
Use validated level break alerts for position management
Combine strength rating filters with validated pivot alerts
Develop systematic responses to different validated level types
Conclusion
The Fundur - Market Sentiment A indicator represents a breakthrough in technical analysis, providing a dynamic ZigZag system that displays validated highs and lows with unprecedented accuracy. By following the methodologies outlined in this guide and adapting the settings to your trading style, you can harness the full power of this sophisticated system for more precise and profitable trading decisions.
The key to success with Market Sentiment A lies in understanding that it is fundamentally a dynamic support and resistance system. Focus on the validated highs and lows displayed on your chart, use the strength ratings to assess signal quality, and leverage the structure analysis for trend context. Start with conservative settings, focus on high-strength signals, and gradually incorporate advanced features as you become familiar with the system's behavior across different market conditions.
Remember that this indicator provides the tools for identification and analysis - successful trading still requires proper risk management, psychological discipline, and continuous learning. Use the strength rating system as your primary guide, respect the validated pivot methodology, and always prioritize capital preservation over profit maximization.

Fundur - Trend TraderFundur - Trend Trader: Complete Trading Indicator Guide
Indicator Overview
The Fundur - Trend Trader is a comprehensive dual-timeframe analysis indicator that combines fair value structure analysis, risk-reward calculations, and dynamic trend identification into one powerful trading tool. This indicator is designed to provide traders with precise entry and exit points while offering complete risk management insights.
What Makes Trend Trader Unique?
The Trend Trader goes beyond traditional pivot point indicators by introducing Fair Value Structure Analysis - a methodology that analyzes the relationship between two timeframes to determine market bias and optimal trading opportunities. Unlike static indicators, Trend Trader provides dynamic analysis that adapts to market conditions in real-time.
Core Methodology
The indicator operates on the principle that markets oscillate between Premium (overvalued) and Discount (undervalued) zones relative to fair value levels. By analyzing these zones across multiple timeframes, traders can identify high-probability trade setups with clearly defined risk-reward parameters.
Key Features
🎯 Dual-Timeframe Fair Value Analysis
Higher Timeframe Structure : Primary trend direction and major levels
Lower Timeframe Structure : Refined entry opportunities and micro-trend analysis
Dynamic Relationship : Real-time analysis of timeframe alignment
📊 Comprehensive Level System
Fair Value (FV) : Central equilibrium level for entries
Premium Levels (P1, P2, P3) : Sell zones with increasing distance from fair value
Discount Levels (D1, D2, D3) : Buy zones with increasing distance from fair value
🧠 Intelligent Trend Detection
Session-to-Session Analysis : Compares current vs previous session fair values
Trend Signals : Clear LONG/SHORT setup identification
Structure Bias : Bullish/Bearish fair value structure determination
⚖️ Advanced Risk-Reward System
Real-Time R:R Calculations : Dynamic risk-reward ratios for all levels
Leverage Recommendations : Optimal position sizing based on measured risk
Risk Percentage Display : Precise risk calculations for informed decisions
🎨 Smart Visual Features
Level Hit Tracking : Automatically darkens touched levels during session
Squeeze Detection : Identifies low-volatility periods with special bar coloring
Dynamic Highlighting : Price-responsive level emphasis
Zone Fills : Visual premium and discount area identification
Setup Guide
Step 1: Adding the Indicator
Open TradingView and navigate to your desired chart
Click the "Indicators" button or press "/" key
Search for "Fundur - Trend Trader"
Add the indicator to your chart
Step 2: Basic Configuration
Timeframe Settings
Higher Timeframe : Default is Weekly (W), adjust based on your trading style:
Scalping : Use 4H for higher timeframe
Day Trading : Use Daily (D) for higher timeframe
Short-Term Swing Trading : Use Weekly (W) for higher timeframe
Long-Term Swing Trading : Use Monthly (M) for higher timeframe
Position Trading : Use Quarterly (3M) or Yearly (12M) for higher timeframe
History Bars :
Higher Timeframe: 10 bars (recommended)
Lower Timeframe: 50 bars (recommended)
Visual Settings
Line Widths : Adjust for visibility preference
Zone Fills : Enable for better visual zone identification
Bar Coloring : Enable structure and squeeze coloring
Step 3: Label Configuration
Essential Labels (Recommended Settings)
✅ Show All Labels: ON
✅ Show Trend Direction: ON
✅ Show Higher Timeframe Labels: ON
⚠️ Show Lower Timeframe Labels: OFF (avoid clutter initially)
✅ Show Price Values: ON
Label Style Options
Use Short Names : ON (P1, D2, FV instead of full names)
Combine Timeframe & Description : ON (creates compact labels like "W-FV")
Label Style : Choose between Modern or Classic
Step 4: Risk-Reward Setup
✅ Show Risk-Reward Analysis: ON
✅ Show Measured Risk Values: ON
✅ Apply Leverage to Calculations: ON
Leverage Multiplier : Start with 1.0, adjust based on your risk tolerance
Basic Trading Guide
Understanding Fair Value Structure
The indicator's foundation is the Fair Value Structure - the relationship between higher and lower timeframe fair value levels:
Bullish Structure (🔵)
Condition : Lower timeframe FV above higher timeframe FV
Bias : Look for LONG opportunities
Focus : Fair Value Structure for entries (continuation strategy)
Strategy : Enter long positions at Fair Value, take profits at Premium levels (P1, P2, P3)
Bearish Structure (🟠)
Condition : Lower timeframe FV below higher timeframe FV
Bias : Look for SHORT opportunities
Focus : Fair Value Structure for entries (continuation strategy)
Strategy : Enter short positions at Fair Value, take profits at Discount levels (D1, D2, D3)
Entry Strategies
Primary Strategy: Fair Value Continuation Entries
Setup : Price approaches fair value level with established structure bias
Entry : In Fair Value Structure (in between the lower timeframe and higher timeframe fair value)
Direction : Follow the structure bias (long in bullish structure, short in bearish structure)
Stop Loss: Two approaches available:
Advanced Method : Place stop shy of liquidation point to avoid liquidation
Hassle-Free Method : Previous high/low OR just beyond higher timeframe Fair Value
For Long Positions : Stop below higher timeframe Fair Value
For Short Positions : Stop above higher timeframe Fair Value
Profit Taking Strategy:
For Long Positions (Bullish Structure):
75% profits at Premium 1 (P1) - highest probability target
50% of remaining position at Premium 2 (P2)
Close entire position at Premium 3 (P3)
Move stop loss to break even after first profits
For Short Positions (Bearish Structure):
75% profits at Discount 1 (D1) - highest probability target
50% of remaining position at Discount 2 (D2)
Close entire position at Discount 3 (D3)
Move stop loss to break even after first profits
Alternative Strategy: Structure Transition Entries
Setup : Structure changes from bearish to bullish (or vice versa)
Entry : At new fair value level after structure confirmation
Risk Management : Tight stops during structure transition periods
Targets : Follow primary profit-taking methodology above
Risk Management Framework
Position Sizing Using Leverage Recommendations
The indicator calculates optimal leverage based on measured risk:
Conservative : Use 50% of recommended leverage
Moderate : Use 75% of recommended leverage
Aggressive : Use 100% of recommended leverage
Never exceed : 150% of recommended leverage
Stop Loss Placement
Follow the methodology outlined in the Primary Strategy section:
Advanced Method : Place stop shy of liquidation point to avoid forced liquidation
Hassle-Free Method : Use structural levels for clear invalidation
Long Positions : Stop below higher timeframe Fair Value
Short Positions : Stop above higher timeframe Fair Value
Alternative : Previous significant high/low levels
Analysis Setups
Setup 1: Scalping Configuration (1-5 minute charts)
Timeframe Settings:
Higher Timeframe: 4H (240)
Lower Timeframe: 1H (auto-calculated)
History: 5 bars for higher, 20 bars for lower
Visual Settings:
Enable all visual features for quick decision making
Use Classic label style for cleaner appearance
Enable squeeze coloring for volatility awareness
Trading Approach:
Focus on fair value continuation entries
Quick entries in fair value structure
Tight risk management using R:R table
Target P1/D1 levels for primary profits (75% position)
Setup 2: Day Trading Configuration (5-15 minute charts)
Timeframe Settings:
Higher Timeframe: Daily (D)
Lower Timeframe: 4H (auto-calculated)
History: 10 bars for higher, 30 bars for lower
Visual Settings:
Enable zone fills for clear premium/discount identification
Show both timeframe labels
Enable level hit tracking
Trading Approach:
Use structure bias for directional bias
Enter in fair value structure for continuation trades
75% profits at P1/D1, scale out to P2/D2, close at P3/D3
Hold positions across multiple sessions following structure
Setup 3: Short-Term Swing Trading Configuration (1-4 hour charts)
Timeframe Settings:
Higher Timeframe: Weekly (W)
Lower Timeframe: Daily (auto-calculated)
History: 15 bars for higher, 50 bars for lower
Visual Settings:
Emphasize higher timeframe levels
Show trend direction signals
Enable complete risk-reward analysis
Trading Approach:
Primary focus on higher timeframe structure
Patient entries in fair value structure
Follow standard profit-taking: 75% at P1/D1, scale to P3/D3
Use lower timeframe for refined fair value entries
Setup 4: Long-Term Swing Trading Configuration (4H charts)
Timeframe Settings:
Higher Timeframe: Monthly (M)
Lower Timeframe: Weekly (auto-calculated)
History: 20 bars for higher, 75 bars for lower
Visual Settings:
Clean label setup focusing on major levels
Enable trend direction for bias confirmation
Simplified visual approach for clarity
Trading Approach:
Monthly structure provides major trend direction
Entries in fair value structure
Hold positions for several weeks
Apply standard profit-taking methodology at premium/discount zones
Setup 5: Position Trading Configuration (Daily/Weekly charts)
Timeframe Settings:
Higher Timeframe: Quarterly (3M) or Yearly (12M)
Lower Timeframe: Monthly or Quarterly (auto-calculated)
History: 25 bars for higher, 100 bars for lower
Visual Settings:
Clean label setup focusing on key levels
Enable all alert systems
Simplified color scheme
Trading Approach:
Structure changes signal major macro trend shifts
Very patient entries in fair value structure confirmation
Long-term continuation trades targeting extended premium/discount levels
Hold positions for months to years following structure bias
Focus on major market cycles and long-term trend continuations
Setup 6: Multi-Asset Analysis Configuration
For Forex Pairs:
Adjust decimal precision for pip accuracy
Focus on daily/weekly structure
Use tight risk management due to leverage
For Crypto Assets:
Higher volatility requires wider stops
24/7 markets need continuous monitoring
Structure breaks often lead to extended moves
For Stock Indices:
Respect market hours for structure analysis
Economic events can override technical levels
Seasonal patterns affect structure behavior
Visual Components
Level Indicators
Solid Lines : Active levels based on current price position
Highlighted Levels : Levels within current price range
Darkened Levels : Previously touched levels during current session
Zone Fills
Red Zones : Premium areas (selling opportunities)
Green Zones : Discount areas (buying opportunities)
Cloud Fill : Area between dual timeframe fair values
Bar Coloring
Purple Bars : Squeeze conditions (low volatility)
Structure Colors : Based on price position relative to fair value levels
Labels and Information
Level Labels : Price values and targets for each level
Trend Signals : Clear LONG/SHORT setup indications
Risk-Reward Table : Comprehensive analysis panel
Risk Management
Built-in Risk Controls
Measured Risk System
The indicator automatically calculates risk percentages based on:
Distance from fair value to premium/discount levels
Current price position
Leverage settings applied
Optimal Leverage Calculations
Long Positions : Based on discount risk measurement
Short Positions : Based on premium risk measurement
Dynamic Adjustment : Changes with market conditions
Risk-Reward Ratios
Each level displays its R:R ratio considering:
Entry point (fair value or current price)
Target level
Stop loss level
Applied leverage
Recommended Risk Parameters
Conservative Trading
Maximum 1-2% risk per trade
Use 50% of recommended leverage
Target R:R ratios above 2:1
Focus on high-probability setups only
Moderate Trading
Maximum 2-3% risk per trade
Use 75% of recommended leverage
Accept R:R ratios above 1.5:1
Trade multiple setups with correlation awareness
Aggressive Trading
Maximum 3-5% risk per trade
Use up to 100% of recommended leverage
Accept R:R ratios above 1:1
Active management required
Alert System
Structure Alerts
Fair Value Structure Bullish : When structure turns bullish
Fair Value Structure Bearish : When structure turns bearish
Level Interaction Alerts
For each premium and discount level:
Touch Alerts : When price reaches the level
Cross Above : When price breaks above the level
Cross Below : When price breaks below the level
Range Alerts
Rising into FV : Price enters fair value range from below
Falling into FV : Price enters fair value range from above
Rising Above FV : Price breaks above fair value range
Falling Below FV : Price breaks below fair value range
Setting Up Alerts
Enable desired alert types in indicator settings
Create TradingView alerts using the indicator
Configure notification methods (email, SMS, app)
Test alerts with historical data first
Customization Options
Color Schemes
Fair Value Colors : Customize based on structure bias
Premium/Discount Colors : Match your chart theme
Dynamic Coloring : Automatically adjusts based on price position
Label Customization
Text Transparency : Adjust readability
Background Transparency : Control label prominence
Size Options : From tiny to large based on chart size
Position Options : Multiple screen positions available
Table Settings
Position : 9 different screen positions
Size : 4 size options for different screen resolutions
Transparency : Adjust for chart readability
Best Practices
Chart Setup Recommendations
Screen Real Estate Management
Use larger timeframes for cleaner appearance
Minimize lower timeframe labels on smaller screens
Position risk-reward table to avoid price action interference
Multi-Timeframe Analysis
Keep one chart with higher timeframe focus
Use secondary chart for lower timeframe entries
Synchronize timeframe selection across charts
Trading Psychology Integration
Patience with Structure
Wait for clear structure bias before trading
Avoid trading during structure transition periods
Respect the higher timeframe bias
Risk Management Discipline
Never ignore the calculated risk percentages
Use leverage recommendations as guidelines, not rules
Adjust position sizes based on market conditions
Entry Timing
Use lower timeframes for precise entries
Wait for price to reach significant levels
Confirm entries with additional confluence factors
Common Mistakes to Avoid
Over-Analysis
Don't wait for perfect setups that may never come
Focus on high-probability scenarios
Accept that not every level will hold
Ignoring Structure Bias
Don't fight the overall structure direction
Adjust strategies when structure changes
Respect multi-timeframe alignment
Poor Risk Management
Never risk more than the indicator suggests
Don't ignore stop loss levels
Avoid emotional position sizing
Advanced Techniques
Structure Transition Trading
Identify when structure is changing
Position for new bias direction
Use tight risk management during transitions
Level Confluence
Look for multiple level alignments
Combine with support/resistance
Use volume analysis for confirmation
Seasonal and Market Hour Awareness
Adjust for different market sessions
Consider seasonal patterns in structure
Account for economic calendar events
Conclusion
The Fundur - Trend Trader indicator represents a comprehensive approach to modern technical analysis, combining traditional pivot point methodology with advanced fair value structure analysis. By following the guidelines in this manual and adapting the settings to your trading style, you can harness the full power of this indicator for more informed and profitable trading decisions.
Remember that no indicator is perfect, and the Trend Trader should be used as part of a complete trading strategy that includes fundamental analysis, risk management, and proper psychology. Start with conservative settings and gradually increase sophistication as you become more familiar with the indicator's behavior in different market conditions.
For best results, practice with the indicator in demo accounts first, understand its behavior in various market conditions, and always prioritize risk management over profit potential.
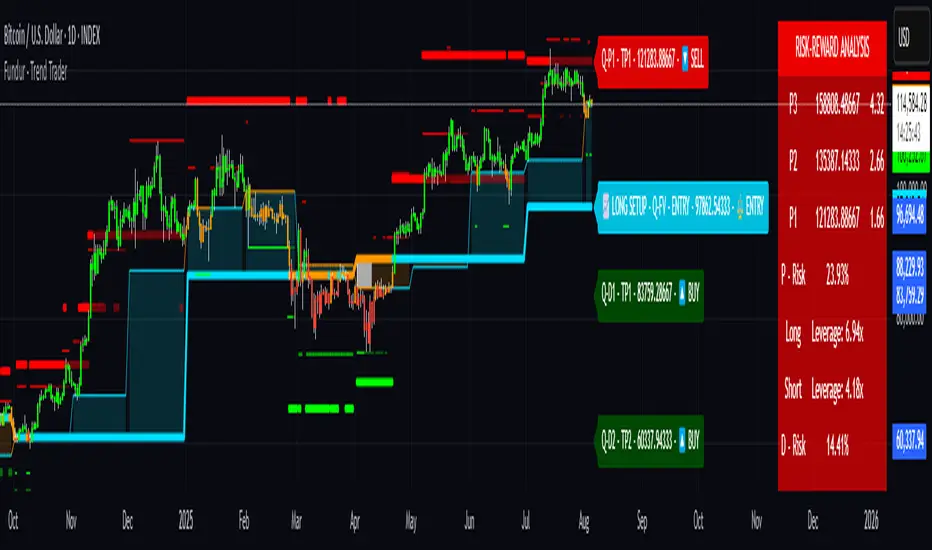
Candle Channel█ OVERVIEW
The "Candle Channel" indicator is a versatile technical analysis tool that plots a price channel based on the Simple Moving Average (SMA) of candlestick midpoints. The channel bands, calculated based on candlestick volatility, form dynamic support and resistance levels that adapt to price movements. The script generates signals for reversals from the bands and SMA breakouts, making it useful for both short-term and long-term traders. By adjusting the SMA length, the channel can vary in nature—from a wide channel encapsulating price movement to narrower support/resistance or trend-following bands. The channel width can be further customized using a scaling parameter, allowing adaptation to different trading styles and markets.
█ MECHANISM
Band Calculation
The indicator is based on the following calculations:
Candlestick Midpoint: Calculated as the arithmetic average of the candle’s high and low prices: (high + low) / 2.
Simple Moving Average (SMA): The average of candlestick midpoints over a specified length (default: 20 candles), forming the channel’s centerline.
Average Candle Height: Calculated as the average difference between the high and low prices (high - low) over the same SMA length, serving as a measure of market volatility.
Band Scaling: The user specifies a percentage of the average candle height (default: 200%), which is multiplied by the average height to create an offset. The upper band is SMA + offset, and the lower band is SMA - offset.Example: For an average candle height of 10 points and 200% scaling, the offset is 20 points, meaning the bands are ±20 points from the SMA.
Channel Characteristics: The SMA length determines the channel’s dynamics. Shorter SMA values (10–30) create a wide channel that contains price movement, ideal for scalping or short-term trading. Longer SMA values (above 30, e.g., 50–100) transform the channel into narrower support/resistance or trend-following bands, suitable for longer-term analysis. Band scaling further adjusts the channel width to match market volatility.
Signals
Reversal from Bands: Signals are generated when the price closes outside the band (above the upper or below the lower) and then returns to the channel, indicating a potential trend reversal.
SMA Breakout: Signals are generated when the price crosses the SMA upward (bullish signal) or downward (bearish signal), suggesting potential trend changes.
Visualization
Centerline: The SMA of candlestick midpoints, displayed as a thin line.
Channel Bands: Upper and lower channel boundaries, with customizable colors.
Fill: Options include a gradient (smooth color transition between bands) or solid color. The fill can also be disabled for greater clarity.
█ FEATURES AND SETTINGS
SMA Length: Determines the moving average period (default: 20). Values of 10–30 are suitable for a wide channel containing price movement, ideal for short-term timeframes. Longer values (e.g., 50–100) create narrower support/resistance or trend-following bands, better suited for higher timeframes.
Band Scaling: Percentage of the average candle height (default: 200%). Adjusts the channel width to match market volatility—smaller values (e.g., 50–100%) for narrower bands, larger values (e.g., 200–300%) for wider channels.
Fill Type: Gradient, solid, or no fill, allowing customization to user preferences.
Colors: Options to change the colors of bands, fill, and signals for better readability.
Signals: Options to enable/disable reversal signals from bands and SMA breakout signals.
█ HOW TO USE
Add the script to your chart in TradingView by clicking "Add to Chart" in the Pine Editor.
Adjust input parameters in the script settings:
SMA Length: Set to 10–30 for a wide channel containing price movement, suitable for scalping or short-term trading. Set above 30 (e.g., 50–100) for narrower support/resistance or trend-following bands.
Band Scaling: Adjust the channel width to market volatility. Smaller values (50–100%) for tighter support/resistance bands, larger values (200–300%) for wider channels containing price movement.
Fill Type and Colors: Choose a gradient for aesthetics or a solid fill for clarity.
Analyze signals:
Reversal Signals: Triangles above (bearish) or below (bullish) candles indicate potential reversal points.
SMA Breakout Signals: Circles above (bearish) or below (bullish) candles indicate trend changes.
Test the indicator on different instruments and timeframes to find optimal settings for your trading style.
█ LIMITATIONS
The indicator may generate false signals in highly volatile or consolidating markets.
On low-liquidity charts (e.g., exotic currency pairs), the bands may be less reliable.
Effectiveness depends on properly matching parameters to the market and timeframe.
Advanced Forex Currency Strength Meter
# Advanced Forex Currency Strength Meter
🚀 The Ultimate Currency Strength Analysis Tool for Forex Traders
This sophisticated indicator measures and compares the relative strength of major currencies (EUR, GBP, USD, JPY, CHF, CAD, AUD, NZD) to help you identify the strongest and weakest currencies in real-time, providing clear trading signals based on currency strength differentials.
## 📊 What This Indicator Does
The Advanced Forex Currency Strength Meter analyzes currency relationships across 28+ major forex pairs and 8 currency indices to determine which currencies are gaining or losing strength. Instead of relying on individual pair analysis, this tool gives you a bird's-eye view of the entire forex market, helping you:
Identify the strongest and weakest currencies at any given time
Find high-probability trading opportunities by pairing strong vs weak currencies
Avoid ranging markets by detecting when currencies have similar strength
Get clear LONG/SHORT/NEUTRAL signals for your current trading pair
Optimize your trading strategy based on your preferred timeframe and holding period
## ⚙️ How The Indicator Works
### Dual Calculation Method
The indicator uses a sophisticated dual approach for maximum accuracy:
Pairs-Based Analysis: Calculates currency strength from 28+ major forex pairs (EURUSD, GBPUSD, USDJPY, etc.)
Index-Based Analysis: Incorporates official currency indices (DXY, EXY, BXY, JXY, CXY, AXY, SXY, ZXY)
Weighted Combination: Blends both methods using smart weighting for enhanced accuracy
### Smart Auto-Optimization System
The indicator automatically adjusts its parameters based on your chart timeframe and intended holding period:
The system recognizes that scalping requires different sensitivity than swing trading, automatically optimizing lookback periods, analysis timeframes, signal thresholds, and index weights.
### Strength Calculation Process
Fetches price data from multiple timeframes using optimized tuple requests
Calculates percentage change over the specified lookback period
Optionally normalizes by ATR (Average True Range) to account for volatility differences
Combines pair-based and index-based calculations using dynamic weighting
Generates relative strength by comparing base currency vs quote currency
Produces clear trading signals when strength differential exceeds threshold
## 🎯 How To Use The Indicator
### Quick Start
Add the indicator to any forex pair chart
Enable 🧠 Smart Auto-Optimization (recommended for beginners)
Watch for LONG 🚀 signals when the relative strength line is green and above threshold
Watch for SHORT 🐻 signals when the relative strength line is red and below threshold
Avoid trading during NEUTRAL ⚪ periods when currencies have similar strength
Note: This is highly recommended to couple this indicator with fundamental analysis and use it as an extra signal.
### 📋 Parameters Reference
#### 🤖 Smart Settings
🧠 Smart Auto-Optimization: (Default: Enabled) Automatically optimizes all parameters based on chart timeframe and trading style
#### ⚙️ Manual Override
These settings are only active when Smart Auto-Optimization is disabled:
Manual Lookback Period: (Default: 14) Number of periods to analyze for strength calculation
Manual ATR Period: (Default: 14) Period for ATR normalization calculation
Manual Analysis Timeframe: (Default: 240) Higher timeframe for strength analysis
Manual Index Weight: (Default: 0.5) Weight given to currency indices vs pairs (0.0 = pairs only, 1.0 = indices only)
Manual Signal Threshold: (Default: 0.5) Minimum strength differential required for trading signals
#### 📊 Display
Show Signal Markers: (Default: Enabled) Display triangle markers when signals change
Show Info Label: (Default: Enabled) Show comprehensive information label with current analysis
#### 🔍 Analysis
Use ATR Normalization: (Default: Enabled) Normalize strength calculations by volatility for fairer comparison
#### 💰 Currency Indices
💰 Use Currency Indices: (Default: Enabled) Include all 8 currency indices in strength calculation for enhanced accuracy
#### 🎨 Colors
Strong Currency Color: (Default: Green) Color for positive/strong signals
Weak Currency Color: (Default: Red) Color for negative/weak signals
Neutral Color: (Default: Gray) Color for neutral conditions
Strong/Weak Backgrounds: Background colors for clear signal visualization
### 🧠 Smart Optimization Profiles
The indicator automatically selects optimal parameters based on your chart timeframe:
#### ⚡ Scalping Profile (1M-5M Charts)
For positions held for a few minutes:
Lookback: 5 periods (fast/sensitive)
Analysis Timeframe: 15 minutes
Index Weight: 20% (favor pairs for speed)
Signal Threshold: 0.3% (sensitive triggers)
#### 📈 Intraday Profile (10M-1H Charts)
For positions held for a few hours:
Lookback: 12 periods (balanced sensitivity)
Analysis Timeframe: 4 hours
Index Weight: 40% (balanced approach)
Signal Threshold: 0.4% (moderate sensitivity)
#### 📊 Swing Profile (4H-Daily Charts)
For positions held for a few days:
Lookback: 21 periods (stable analysis)
Analysis Timeframe: Daily
Index Weight: 60% (favor indices for stability)
Signal Threshold: 0.5% (conservative triggers)
#### 📆 Position Profile (Weekly+ Charts)
For positions held for a few weeks:
Lookback: 30 periods (long-term view)
Analysis Timeframe: Weekly
Index Weight: 70% (heavily favor indices)
Signal Threshold: 0.6% (very conservative)
### Entry Timing
Wait for clear LONG 🚀 or SHORT 🐻 signals
Avoid trading during NEUTRAL ⚪ periods
Look for signal confirmations on multiple timeframes
### Risk Management
Stronger signals (higher relative strength values) suggest higher probability trades
Use appropriate position sizing based on signal strength
Consider the trading style profile when setting stop losses and take profits
💡 Pro Tip: The indicator works best when combined with your existing technical analysis. Use currency strength to identify which pairs to trade, then use your favorite technical indicators to determine when to enter and exit.
## 🔧 Key Features
28+ Forex Pairs Analysis: Comprehensive coverage of major currency relationships
8 Currency Indices Integration: DXY, EXY, BXY, JXY, CXY, AXY, SXY, ZXY for enhanced accuracy
Smart Auto-Optimization: Automatically adapts to your trading style and timeframe
ATR Normalization: Fair comparison across different currency pairs and volatility levels
Real-Time Signals: Clear LONG/SHORT/NEUTRAL signals with visual markers
Performance Optimized: Efficient tuple-based data requests minimize external calls
User-Friendly Interface: Simplified settings with comprehensive tooltips
Multi-Timeframe Support: Works on any timeframe from 1-minute to monthly charts
Transform your forex trading with the power of currency strength analysis! 🚀
