Stochastic + Keltner Channels for ScalpingSimple arrow indicator, indicating the direction go the next slight movement. This indicator will work on any time frame or market.
How does this indicator work?
It will use Stochastic and Keltner Channels to detect potential reversals depending on the frequency you choose in the indicator's settings. The higher the frequency, the fewer candles will be used in the calculation.
When to use this indicator?
It will work better in higher time frames for low volatility indicators. You can mix with other indicators like RSI or ADX. This way, you will be able to check if the time selected frame has enough volatility to move the price enough to cover the spreads and fees of your broker.
When to exit the trade after the signal from this indicator?
A good target would be for 1x ATR value and stop-loss 2x the ATR value. Doing trailing stop will reduce your risk and secure some profits, but make sure to use values for possible fakeouts
Can this indicator be used alone as the main source of entry signal for the trades?
You can use it alone, but I recommend mixing with other trend-based indicators, like Moving Averages, so you get the best results. Since it's for scalping purposes, small moments, and reversals, it doesn't have the trend filter, but it can work trading in favor of a significant trend as well
this is a better version of my other script Scalping Arrows
Pesquisar nos scripts por "scalping"

Price Change Scalping Indicator v1.0 - 3Commas EditionIntroduction
This indicator implements the Price Change Scalping (PCS) strategy specifically for the 3Commas platform. The Input settings have been redesigned to match the same inputs as the 3Commas My Bot Settings page. Only the "Deal Start Condition" section will echo the required PCS-related settings found in the original Price Change Scalping Indicator v1.0 to successfully implement the strategy.
The indicator uses a price rate of change (ROC) momentum calculation to determine the percent change in price between a defined range of bars. The calculated ROC value is then compared to the Upper Threshold and Lower Threshold values to determine if a trade setup is to be activated. If the threshold is crossed, a trade setup will occur based on the indicator settings. Entry, Take Profit, and Stop Loss prices are calculated and displayed on the chart. Once the Entry Price is crossed, a long or short position is created (depending on the direction) and once the Take Profit price is crossed, the position is closed. If the Entry Price is not crossed within a specific number of bars, the trade setup is canceled, and it will proceed to monitor price changes for the next set up.
How is it original and useful?
This indicator is unique in that the strategy version fully supports the TradingView backtester, which will enable you to perform experiments with various settings to evaluate performance using the historical chart data. The study version implements the "Start Deal" and "Close Deal" alerts for you to integrate with 3Comma's "Trading View Custom Signal" start condition. Both script versions will provide the same configuration abilities. The following list is a brief description of its usefulness:
Full support for all possible 3Commas bot settings.
Define a short or long trading strategy.
Price change data source and offset settings.
Your layering placement relative to the entry price.
Your trading parameters like take profit and stop loss offsets, trailing take profit support, exchange commission rates, trading start time, and order size multiplication for each layer.
Flexible trade eligibility rules that can use other chart indicators, like RSI or EMA, to exclude the selection of entry prices for trading.
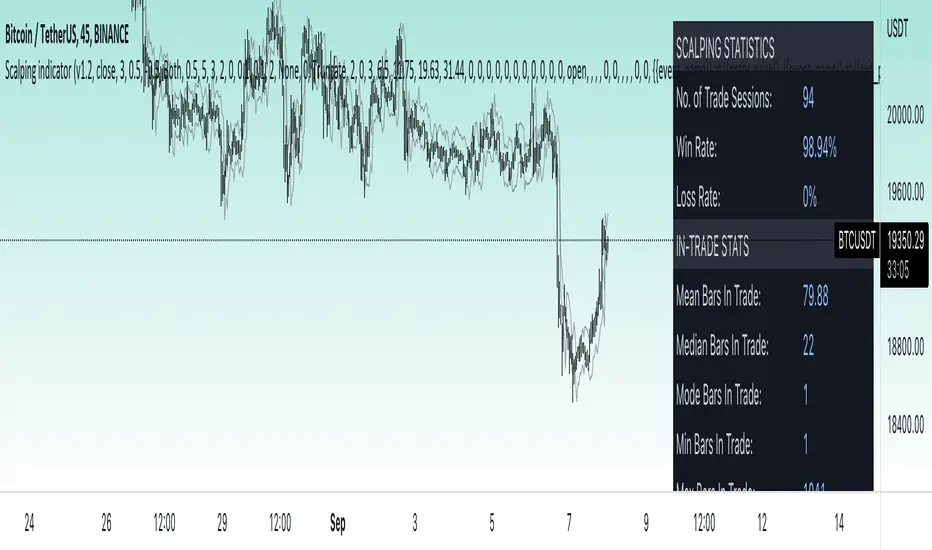
The visibility of detailed statistics from the chart history pertaining to trading sessions started and closed, session durations, win rate, price action drops and bounces, as well as layer utilization.
The visibility of detailed Used Amount for Each Step table that details how each layer will be allocated for trading.
How does it compare to other scripts in the Public Library?
The indicator offers a very detailed, comprehensive settings to address all types of markets found on TradingView where you can implement the price change scalping strategy. The strategy version can be considered the first of its kind on TradingView to leverage the backtester to provide informative, detailed performance measurements surrounding this unique trading strategy. The study version will implement the latest alert framework called "Any Alert() Function" where you can create a single alert to handle multiple events, which include:
Deal Start
Deal Close
Strategy Results
The default settings are designed to define a "loose" price change settings to ensure that the indicator will render chart elements when first loaded as well as to allow the backtester to gather order executions and display performance summary. The strategy version is using $10,000 initial capital, a commission rate of 0.1% for both entries and exits, and a 1 tick slippage setting. It is also using 3.4881% of the equity for the Base Order Size, 4.7097% of equity for the first Safety Order Size. The Maximum Safety Trade Count is 7 with a Safety Order Volume Scale of 1.33, and a take profit of 2% with no stop loss. All other settings are defaults.
It is recommended that the indicator be "tuned" for your specific market to best implement the price change strategy and obtain better desirable results. You do so by scrolling through the chart's history and observing moments when prices tend to move rapidly. Measure the number or bars it typically takes for the price to change at a specific rate. Using this information, you can adjust the Price Change Settings accordingly to configure the indicator for the chart.
Always keep in mind that past performance may not be indicative of future results. Settings that seem favorable for one market may be found to be disastrous in another. Therefore, do take the time needed to understand how the settings will behave with the given chart symbol.
Enjoy! 😊👍
How to obtain access to the script?
You have two choices:
Use the "Website" link below to obtain access to this indicator, or
Send us a private message (PM) in TradingView itself.

BE - Volume Scalping ProDear Traders,
Here with presenting the new Indicator (Strategy) for scalping which is primarily built based on the the Volume Analysis.
Idea behind this Indicator: I am sure every trader would agree that Volume is one of the Leading indicator along with Price, and hence thought to use the same for scalping the trades. There is a direct co-relation between the price and volume and thereby used this as a base for arriving at strength of the volume pumped in. Indicator is working on the Logic of "What is the ROC in price for the volume dumped in and does ROC quantify the same which is happened in the recent past of x candles." In order to be successful in scalping trade, Accuracy, Risk to reward and Money Management is very much crucial and hence thought so much on this to make it happen.
Note: Accuracy here being profitable in the trade and not hitting the bulls eye all the time.
What this indicator is providing:
Based on the volume, ROC & Candle Thresholds and using the inputs provided for RISK and Money Management options, Indicator continuously scans for trading opportunities and provides alerts for possible trades.
Alerts & Notifications:
There are basically 3 types of Alerts provided one with General Notification and Other with Dhan HQ notifications to support Algo Trades and AlgoJi for supporting Algo trades too.
Self Declaration:
I have been testing the performance in 30 seconds and 1 min chart and I haven't faced any issues yet. I strongly recommend users to use the same in timeframe less than 10 Min only.
Enjoy!
DISCLAIMER: No sharing, copying, reselling, modifying, or any other forms of use are authorized for our documents, script / strategy, and the information published with them. This informational planning script / strategy is strictly for individual use and educational purposes only. This is not financial or investment advice. Investments are always made at your own risk and are based on your personal judgement. I am not responsible for any losses you may incur. Please invest wisely.
Happy to receive suggestions and feedback in order to improve the performance of the indicator better.

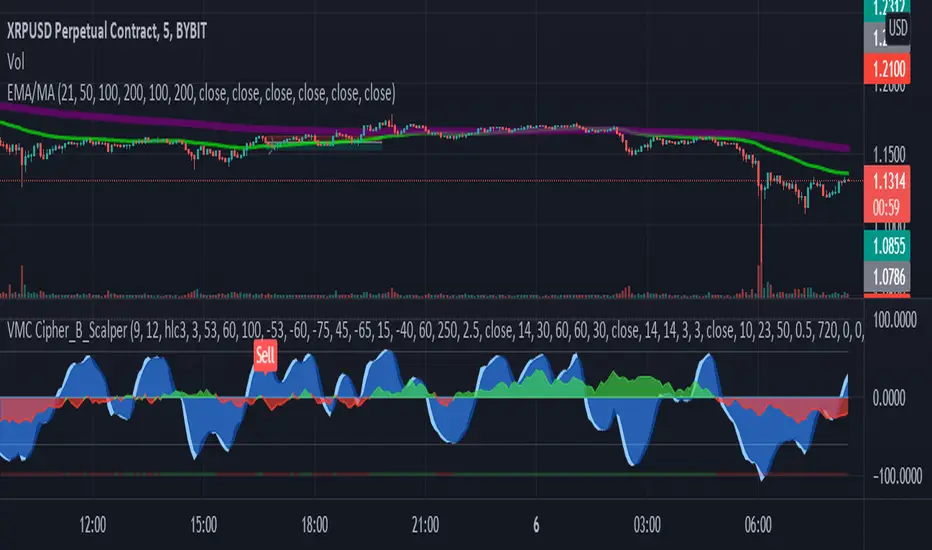
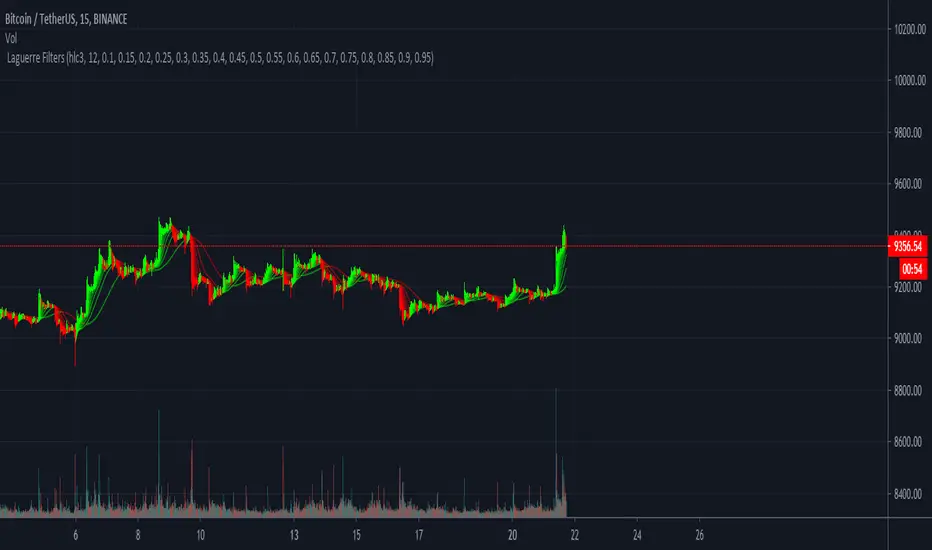
Laguerre Filters Crypto Scalping Tool This is an indicator designed to follow trends on the 15m/30m/1h Timeframe. It works best if you can recognise a larger trend into a direction and combining it then with for example longing the dip. Escpecially for crypto assets this can be used for scalping and if paired with S&R can be an especially powerful tool if paired correctly. Like it is shown here.
As soon as there is a flip to green for example with upwards momentum over the last period of time and no higher Timeframe Resistance ahead. On lower timeframes like the 15m and 30m this can be used for scalping and works especially well in Ranges, say for example a 100 Tick range. At the time of writing we heavily used this Indicator for scalping up and down the current bitcoin range and it worked suprisingly well.
One user was able to trade the EOSUSDT pump, chart shown here.
The cool thing is that the single filters can also be used as a Trailing Stop.
If interested please direct message us. Thank you !
Very easy scalping indicator for non skilled traderThunderScalp is bundled indicator for scalping trader with simple usage and high winning rate. It works for any time frame.
The indicators are:
Humidity Pole Signal is Buy or Sell signal based on Humidity indicator or volume consolidation mapping
Interactive Signal is Buy or Sell signal based on Chart Pattern analyzer
Pivot Support and Resistance is candle support and resistance up to 3 layer for each
Fractal Support and resistance is support and resistance based on fractal candles
Scalping MA is moving average lines which best suite for scalping

Ultimate Scalping IndicatorOverview
The Confluence Signal Indicator is a precision-built scalping tool designed to identify high-probability reversal points in the market.
It combines three core technical elements:
Trend
Mean reversion
Momentum
into a single, efficient system.
By filtering out weak RSI signals and focusing only on setups that align with trend direction and recent momentum shifts, this indicator delivers cleaner and more accurate short-term trade signals.
Core Components
200-Period Moving Average (MA200, 5-Minute Timeframe)
The MA200 is always calculated from the 5-minute chart, regardless of your current timeframe. It defines the macro trend direction and ensures that all trades align with the prevailing momentum.
Session VWAP (Volume-Weighted Average Price)
The VWAP tracks the real-time average price weighted by volume for the current trading session. It acts as a dynamic mean-reversion level and helps identify key areas of institutional activity and short-term balance.
RSI (Relative Strength Index)
The indicator uses a standard 14-period RSI to detect overbought and oversold market conditions.
A “recency filter” is added to ensure signals only appear when RSI has recently transitioned from strength to weakness or vice versa, reducing false signals in trending markets.
Signal Logic
Bullish Signal (Green Arrow)
A bullish reversal signal is plotted below a candle when:
Price is above both the 5-minute MA200 and the Session VWAP.
RSI is oversold (below 30).
The last time RSI was above 50 occurred within the last 10 candles before going oversold.
This ensures that the dip is a fresh pullback within an uptrend, not a prolonged oversold condition.
Bearish Signal (Red Arrow)
A bearish reversal signal is plotted above a candle when:
Price is below both the 5-minute MA200 and the Session VWAP.
RSI is overbought (above 70).
The last time RSI was below 50 occurred within the last 10 candles before going overbought.
This ensures that the overbought reading follows a recent move from weakness, identifying potential short entries in a downtrend.
Recommended Usage
This is a scalping-focused indicator, intended for use on timeframes of 5 minutes or lower. Therefore I would highly recommend to use it on Equity futures trading, such as NQ!, ES!, GC! and so on.
It performs best when combined with additional tools such as support and resistance zones, order blocks, or liquidity levels for context.
Avoid counter-trend signals unless confirmed by price structure or volume behavior.

Automated Scalping Signals with TP/SL Indicator [QuantAlgo]🟢 Overview
The Automated Scalping Signals with Take Profit & Stop Loss Indicator is a multi-timeframe trading system that combines market structure analysis with directional bias filtering to identify potential scalping opportunities. It detects Points of Interest (POI) including Fair Value Gaps (FVG) and Order Blocks (OB) while cross-referencing entries with higher timeframe exponential moving average positioning to create systematic entry conditions.
The indicator features adaptive timeframe calculations that automatically scale analysis periods based on your chart timeframe, maintaining consistent analytical relationships across different trading sessions. It provides integrated trade management with stop loss calculation methods, configurable risk-reward ratios, and real-time performance tracking through dashboard displays showing trade statistics, bias direction, and active position status.
This advanced system is designed for low timeframe trading, typically performing optimally on 1 to 15-minute charts across popular instruments such as OANDA:XAUUSD , CME_MINI:MES1! , CME_MINI:ES1! , CME_MINI:MNQ1! , CBOT_MINI:YM1! , CBOT_MINI:MYM1! , BYBIT:BTCUSDT.P , BYBIT:ETHUSDT.P , or any asset and timeframe of your preference.
🟢 How It Works
The indicator operates using a dual-timeframe mathematical framework where higher timeframe exponential moving averages establish directional bias through cross-over analysis, while simultaneously scanning for specific market structure patterns on the POI timeframe. The timeframe calculation engine uses multiplication factors to determine analysis periods, ensuring the bias timeframe provides trend context while the POI timeframe captures structural formations.
The structural analysis begins with FVG detection, which systematically scans price action to identify imbalances where gaps exist between consecutive candle ranges with no overlapping wicks. When such gaps are detected, the algorithm measures their size against minimum thresholds to filter out insignificant formations. Concurrently, OB recognition analyzes three-candle sequences, examining specific open/close relationships that indicate potential institutional accumulation zones. Once these structural patterns are identified, the algorithm cross-references them against the higher timeframe bias direction, creating a validation filter that only permits entries aligned with the prevailing EMA cross-over state. When price subsequently intersects these validated POI zones, entry signals generate with the system calculating entry levels at zone midpoints, then applying the selected stop loss methodology combined with the configured risk-reward ratio to determine take profit placement.
To mirror realistic trading conditions, the indicator incorporates configurable slippage calculations that account for execution differences between intended and actual fill prices. When trades reach their take profit or stop loss levels, the algorithm applies slippage adjustments that worsen the exit prices in a conservative manner - reducing take profit fills and increasing stop loss impact. This approach ensures backtesting results reflect more realistic performance expectations by accounting for spread costs, market volatility during execution, and liquidity constraints that occur in live trading environments.
It also has a performance dashboard that continuously tracks and displays comprehensive trading metrics:
1/ Bias TF / POI TF: Displays the calculated timeframes used for bias analysis and POI detection, showing the actual periods (e.g., "15m / 5m") that result from the multiplier settings to confirm proper adaptive timeframe selection
2/ Bias Direction: Shows current market trend assessment (Bullish, Bearish, or Sideways) derived from EMA cross-over analysis to indicate which trade directions align with prevailing momentum
3/ Data Processing: Indicates how many price bars have been analyzed by the system, helping users verify if complete historical data has been processed for comprehensive strategy validation
4/ Total Trades: Displays the cumulative number of completed trades plus any active positions, providing volume assessment for statistical significance of other metrics
5/ Wins/Losses: Shows the raw count of profitable versus unprofitable trades, offering immediate insight into strategy effectiveness frequency
6/ Win Rate: Reveals the percentage of successful trades, where values above 50% generally indicate effective entry timing and values below suggest strategy refinement needs
7/ Total R-Multiple: Displays cumulative risk-reward performance across all trades, with positive values demonstrating profitable system operation and negative values indicating net losses requiring analysis
8/ Average R Win/Loss: Shows average risk-reward ratios for winning and losing trades separately, where winning averages approaching the configured take profit ratio indicate minimal slippage impact while losing averages near -1.0 suggest effective stop loss execution
9/ TP Ratio / Slippage: Displays the configured take profit ratio and slippage settings with calculated performance impact, showing how execution costs affect actual versus theoretical returns
10/ Profit Factor: Calculates the ratio of total winning amounts to total losing amounts, where values above 1.5 suggest robust profitability, values between 1.0-1.5 indicate modest success, and values below 1.0 show net losses
11/ Maximum Drawdown: Tracks the largest peak-to-trough decline in R-multiple terms, with smaller negative values indicating better capital preservation and risk control during losing streaks
🟢 How to Use
Start by applying the indicator to your chart and observe its performance across different market conditions to understand how it identifies bias direction and POI formations. Then navigate to the settings panel to configure the Bias Timeframe Multiplier for trend context sensitivity and POI Timeframe Multiplier for structural analysis frequency according to your trading preference and objectives.
Next, fine-tune the EMA periods in Bias Settings to control trend detection sensitivity and select your preferred POI types based on your analytical preference. Proceed to configure your Risk Management approach by selecting from the available stop loss calculation methods and setting the Take Profit ratio that aligns with your risk tolerance and profit objectives. Complete the setup by customizing Display Settings to control table visibility and trade visualization elements, adjusting UI positioning and colors for optimal chart readability, then activate Alert Conditions for automated notifications on trade entries, exits, and bias direction changes to support systematic trade management.
🟢 Examples
OANDA:XAUUSD
CME_MINI:MES1!
CME_MINI:ES1!
CME_MINI:MNQ1!
CBOT_MINI:YM1!
BYBIT:BTCUSDT.P
BINANCE:SOLUSD
*Disclaimer: Past performance is not indicative of future results. None of our statements, claims, or signals from our indicators are intended to be financial advice. All trading involves substantial risk of loss, not just upside potential. Users are highly recommended to carefully consider their financial situation and risk tolerance before trading.

AI Volume Breakout for scalpingPurpose of the Indicator
This script is designed for trading, specifically for scalping, which involves making numerous trades within a very short time frame to take advantage of small price movements. The indicator looks for volume breakouts, which are moments when trading volume significantly increases, potentially signaling the start of a new price movement.
Key Components:
Parameters:
Volume Threshold (volumeThreshold): Determines how much volume must increase from one bar to the next for it to be considered significant. Set at 4.0, meaning volume must quadruplicate for a breakout signal.
Price Change Threshold (priceChangeThreshold): Defines the minimum price change required for a breakout signal. Here, it's 1.5% of the bar's opening price.
SMA Length (smaLength): The period for the Simple Moving Average, which helps confirm the trend direction. Here, it's set to 20.
Cooldown Period (cooldownPeriod): Prevents signals from being too close together, set to 10 bars.
ATR Period (atrPeriod): The period for calculating Average True Range (ATR), used to measure market volatility.
Volatility Threshold (volatilityThreshold): If ATR divided by the close price exceeds this, the market is considered too volatile for trading according to this strategy.
Calculations:
SMA (Simple Moving Average): Used for trend confirmation. A bullish signal is more likely if the price is above this average.
ATR (Average True Range): Measures market volatility. Lower volatility (below the threshold) is preferred for this strategy.
Signal Generation:
The indicator checks if:
Volume has increased significantly (volumeDelta > 0 and volume / volume >= volumeThreshold).
There's enough price change (math.abs(priceDelta / open) >= priceChangeThreshold).
The market isn't too volatile (lowVolatility).
The trend supports the direction of the price change (trendUp for bullish, trendDown for bearish).
If all these conditions are met, it predicts:
1 (Bullish) if conditions suggest buying.
0 (Bearish) if conditions suggest selling.
Cooldown Mechanism:
After a signal, the script waits for a number of bars (cooldownPeriod) before considering another signal to avoid over-trading.
Visual Feedback:
Labels are placed on the chart:
Green label for bullish breakouts below the low price.
Red label for bearish breakouts above the high price.
How to Use:
Entry Points: Look for the labels on your chart to decide when to enter trades.
Risk Management: Since this is for scalping, ensure each trade has tight stop-losses to manage risk due to the quick, small movements.
Market Conditions: This strategy might work best in markets with consistent volume and price changes but not extreme volatility.
Caveats:
This isn't real AI; it's a heuristic based on volume and price. Actual AI would involve machine learning algorithms trained on historical data.
Always backtest any strategy, and consider how it behaves in different market conditions, not just the ones it was designed for.

EMA SCALPING SUITE v1.0 [1M-5M]EMA SCALPING SUITE v1.0
A scalping indicator designed for quick entries on lower timeframes, combining EMA
stacks with volume confirmation and automatic risk management levels.
CORE FEATURES:
1. EMA Stack System:
- 50 EMA (Blue): Fastest trend
- 100 EMA (Yellow): Entry trigger line
- 150 EMA (Orange): Stop loss reference
- 200 EMA (Red): Base trend
2. Entry System:
- LONG: When price dips to 100 EMA during bullish fan
- SHORT: When price rises to 100 EMA during bearish fan
- Signals shown as triangles at entry points
3. Risk Management:
- Auto Stop Loss: 150 EMA (red line)
- Auto Take Profit: Based on RR ratio (green line)
- Entry Price Marker: Current close (blue line)
4. Volume Confirmation:
- High volume dots (>1.5x average)
- Filters out weak signals
- Adjustable sensitivity
HOW IT WORKS:
1. Wait for EMAs to fan out (trend alignment)
2. Look for price to touch 100 EMA
3. Check for volume confirmation
4. Enter when signal appears
5. Use auto-generated SL and TP levels
BEST TIMEFRAMES:
- Primary: 1 minute
- Secondary: 3-5 minutes
- Not recommended: >15 minutes
RECOMMENDED SETTINGS:
- Volume Filter: ON
- Volume Multiplier: 1.5
- Risk:Reward: 1.5

RF+ Divergence Scalping SystemRF+ Divergence Scalping System + Custom Signals + Alerts.
This chart overlay indicator has been developed for the low timeframe divergence scalper.
Built upon the realtime divergence drawing code from the Divergence for Many indicator originally authored by Lonsometheblue, this chart overlay indicator bundles several additional unique features and modifications to serve as an all-in-one divergence scalping system. The current key features at the time of publishing are listed below (features are optional and can be enabled or disabled):
- Fully configurable realtime divergence drawing and alerting feature that can draw divergences directly on the chart using data sourced from up to 11 oscillators selected by the user, which have been included specifically for their ability to detect divergences, including oscillators not presently included in the original Divergence for Many indicator, such as the Ultimate Oscillator and TSI.
- Optional on chart table showing a summary of key statuses of various indicators, and nearby divergences.
- 2 x Range Filters with custom settings used for low timeframe trend detection.
- 3 x configurable multi-timeframe Stochastic RSI overbought and oversold signals with presentation options.
- On-chart pivot points drawn automatically.
- Automatically adjusted pivot period for up to 4 configurable time frames to fine tune divergences drawn for optimal divergence detection.
- Real-price line for use with Heikin Ashi candles, with styling options.
- Real-price close dots for use with Heikin Ashi candles, with styling options.
- A selection of custom signals that can be printed on-chart and alerted.
- Sessions indicator for the London, New York, Tokyo and Sydney trading sessions, including daylight savings toggle, and unique ‘invert background color’ option, which colours the entire chart - except the trading session you have selected, leaving your chart clear of distracting background color.
- Up to 4 fully configurable moving averages.
- Additional configurable settings for numerous built in indicators, allowing you to alter the lengths and source types, including the UO, TSI, MFI, TSV, 2 x Range Filters.
- Configurable RSI Trend detection signal filter used in a number of the signals, which filters buy signals where the RSI is over the RSI moving average, and only prints sell signals where RSI is under the moving average.
- Customisable on-chart watermark, with inputs for a custom title, subtitle, and also an optional symbol | timeframe | date feature.
The Oscillators able to be selected for use in drawing divergences at the time of publishing are as follows:
- Ultimate Oscillator (UO)
- True Strength Indicator (TSI)
- Money Flow Index (MFI)
- Cumulative Delta Volume (CDV)
- Time Segmented Volume (TSV)
- Commodity Channel Index (CCI)
- Awesome Oscillator
- Relative Strength Index (RSI)
- Stochastic
- On Balance Volume (OBV)
- MACD Histogram
What are divergences?
Divergence is when the price of an asset is moving in the opposite direction of a technical indicator, such as an oscillator, or is moving contrary to other data. Divergence warns that the current price trend may be weakening, and in some cases may lead to the price changing direction.
There are 4 main types of divergence, which are split into 2 categories;
regular divergences and hidden divergences. Regular divergences indicate possible trend reversals, and hidden divergences indicate possible trend continuation.
Regular bullish divergence: An indication of a potential trend reversal, from the current downtrend, to an uptrend.
Regular bearish divergence: An indication of a potential trend reversal, from the current uptrend, to a downtrend.
Hidden bullish divergence: An indication of a potential uptrend continuation.
Hidden bearish divergence: An indication of a potential downtrend continuation.
Setting alerts.
With this indicator you can set alerts to notify you when any/all of the above types of divergences occur, on any chart timeframe you choose, also when the triple timeframe Stochastic RSI overbought and oversold confluences occur, as well as when custom signals are printed.
Configurable pivot period values.
You can adjust the default pivot period values to suit your prefered trading style and timeframe. If you like to trade a shorter time frame, lowering the default lookback values will make the divergences drawn more sensitive to short term price action. By default, this indicator has enabled the automatic adjustment of the pivot periods for 4 configurable time frames, in a bid to optimize the divergences drawn when the indicator is loaded onto any of the 4 time frames selected. These time frames and their associated pivot periods can be fully reconfigured within the settings menu. By default, these have been further optimized for the low timeframe scalper trading on the 1-15 minute time frames.
How do traders use divergences in their trading?
A divergence is considered a leading indicator in technical analysis , meaning it has the ability to indicate a potential price move in the short term future.
Hidden bullish and hidden bearish divergences, which indicate a potential continuation of the current trend are sometimes considered a good place for traders to begin, since trend continuation occurs more frequently than reversals, or trend changes.
When trading regular bullish divergences and regular bearish divergences, which are indications of a trend reversal, the probability of it doing so may increase when these occur at a strong support or resistance level . A common mistake new traders make is to get into a regular divergence trade too early, assuming it will immediately reverse, but these can continue to form for some time before the trend eventually changes, by using forms of support or resistance as an added confluence, such as when price reaches a moving average, the success rate when trading these patterns may increase.
Typically, traders will manually draw lines across the swing highs and swing lows of both the price chart and the oscillator to see whether they appear to present a divergence, this indicator will draw them for you, quickly and clearly, and can notify you when they occur.
How do traders use overbought and oversold levels in their trading?
The oversold level is when the Stochastic RSI is above the 80 level is typically interpreted as being 'overbought', and below the 20 level is typically considered 'oversold'. Traders will often use the Stochastic RSI at, or crossing down from an overbought level as a confluence for entry into a short position, and the Stochastic RSI at, or crossing up from an oversold level as a confluence for an entry into a long position. These levels do not mean that price will necessarily reverse at those levels in a reliable way, however. This is why this version of the Stoch RSI employs the triple timeframe overbought and oversold confluence, in an attempt to add a more confluence and reliability to this usage of the Stoch RSI.
This indicator is intended for use in conjunction with related panel indicators including the TSI+ (True Strength Indicator + Realtime Divergences), UO+ (Ultimate Oscillator + Realtime Divergences), and optionally the STRSI+ (MTF Stochastic RSI + Realtime Divergences) and MFI+ (Money Flow Index + Realtime Divergences) available via this authors’ Tradingview profile, under the scripts section. The realtime divergence drawing code will not identify all divergences, so it is suggested that you also have panel indicators to observe. Each panel indicator also offers additional means of entry confirmation into divergence trades, for example, the Stochastic can indicate when it is crossing down from overbought or up from oversold, the TSi can indicate when the 2 TSI bands cross over one another upward or downward, and the UO and MFI can indicate an entry confluence when they are nearing, or crossing their centerlines, for more confidence in your divergence trade entries.
Additional information on the settings for this indicator can be found via the tooltips within the settings menu itself. Further information on feature updates, and usage tips & tricks will be added to the comments section below in due course.
Disclaimer: This indicator uses code adapted from the Divergence for Many v4 indicator authored by Lonesometheblue, and several stock indicators authored by Tradingview. With many thanks.

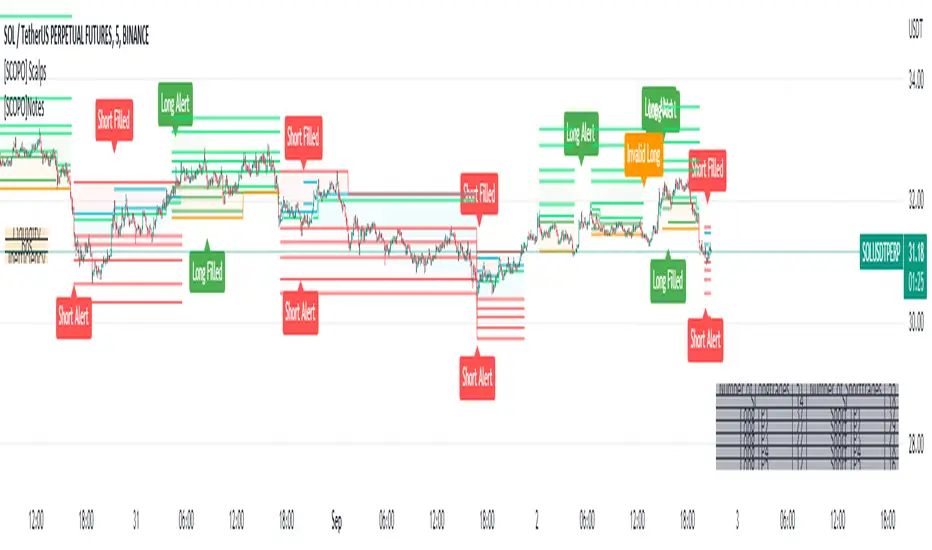
[SCOPO]Scalping BotEnglish, German is found Below
Scalping Indicator (5min Mostly)
- An Indicator that Creates Possible Trades, created on MA's, Volumebased Support and Ressistance and MACD, The Take Profits are created by a Simple Support and Ressitance Indicator (Built In)
- The Indicator sends with the Alert Function Buy and Sell Signals
- These Signals exists from 3 Entrys, 5 Take Profits and 1 Additional Take Profit who should be used after Entry 2/3 has been filled
- If a Signal gets Invalid or an Entry has been filled ,there comes a new Alert
- The Indicator Plots Lines on the Chart for TP/SL and has an Integrated Backtester table
If you got Questions pls Contact me via PM!
Update Rolled out Today (2.9.2022)
- Its now possible to set your own choosen minimal TP, before was 0.3 % and the next Ressistance above would have been taken for longs
- FilterMA can now be choosen from Different MA's via Dropdown menu
- Length of FilterMA can now be set by user
- Those Changes have been done to make it usefull for higher Timeframes too
German
Scalping Indikator
- Kurzbeschreibung: Ein Indikator der mit EMA & Macd und Volumenbasierten Supports/Ressistance Long - & Shorttrades vorschlägt
- Der Indikator sendet mit der Alarm Funktion Kauf und Verkaufsignale
Diese Signale bestehen aus 3 Entrys, 5 Take Profits sowie 1 Additional Take Profit der Aktiv wird nachdem der Entry 2 / 3 gefüllt wurde
Sollte ein Signal Invalidiert werden dann kommt ein erneuter Alarm
Sollte der 1.Entry gefüllt werden dann kommt auch ein Alarm
- Der Indikator gibt visuell auf dem Chart Linien für TP/SL wieder und besitzt auch ein Integriertes Info Fenster für ehemalige Trades.
- Die TP's werden durch eine eingebaute Support/Ressistance Funktion ausgewählt.
Alle verbesserungsvorschläge bitte per PN an @ridicolous
Update vom 2.9.2022
- Es wurde die möglichkeit mindest TP's zu setzen hinzugefügt
- Die FilterEMA kann nun aus einer Auswahl verschiedener MA's ausgewählt werden
- FilterMA längen können nun angepasstwerden
- Diese Aenderungen wurden hinzugefügt um das Skript auch auf höheren Timeframes laufen lassen zu können
Easy Scalping by JayKasunBINANCE:BTCUSDTPERP
This indicator can show stochastic RSI K and D line crosses and some candlestick patterns on chart.
You can use this indicator to scalping, check usage for more info. Always backtest before trading with your real money.
This indicator will also help mobile TradingView users to get an idea when getting stochastic RSI signals, they can use this indicator to check if stochastic RSI K and D crossed or not. ( Because they have limited area to view chart ) .
4 Exponential moving averages are there in the indicator with easy enable disable option. 9 , 21 , 55 , 100 is suggested as default values.
Meanings of signs in chart
Blue triangle bellow candle means it's a stochastic RSI K and D line cross in oversold level
Red triangle above candle means it's a stochastic RSI K and D line cross in overbought level
Green plus sign shows when EMA 50 crossover EMA 100
Red plus sign shows when EMA 50 cross bellow EMA 100
Features
You can enable candlestick pattern displaying when stochastic RSI K and D cross happen. Check indicator settings.
You can enable displaying ATR Trailing Stops in indicator settings.
Indicator will only show blue triangle after Green plus sign and Red triangles after Red plus sign
After you enable candlestick pattern option, stochastic RSI crosses with candlestick patterns will show in deferent colors. Blue triangle will turn into green and Red triangle into pink.
Usage
Use lower time frames like 5m or 15m
After green plus sign, if price retouched 21 EMA or 55 EMA and blue triangle appeared , you can enter a long position.
After red plus sign, if price retouched 21 EMA or 55 EMA and red triangle appeared , you can enter a short position.
Always wait for candle close . signs of chart can be changed when candle closing. ( Does repaint until candle close )
Use ATR trailing to get a stop loss price.
Use 1:1 or 1:0.5 Risk Reward ratio. Because it's scalping and lower time frame.
Use more indicators like RSI to get more confirmations ( like divergences ) before entering a trade. Its more reliable.
Candlestick Patterns Short names
H - Hammer
IH -Inverted Hammer
BE - Bullish Engulfing ( green triangle )
BE - Bearish Engulfing ( pink triangle )
BH - Bullish Harami ( green triangle )
BH - Bearish Harami ( pink triangle )
I have included ATR + Trailing Stops by SimpleCryptoLife and Candlestick Patterns Identified (updated 3/11/15) by repo32
this is a combination of multiple indicators
credit goes to original creators of above indicators

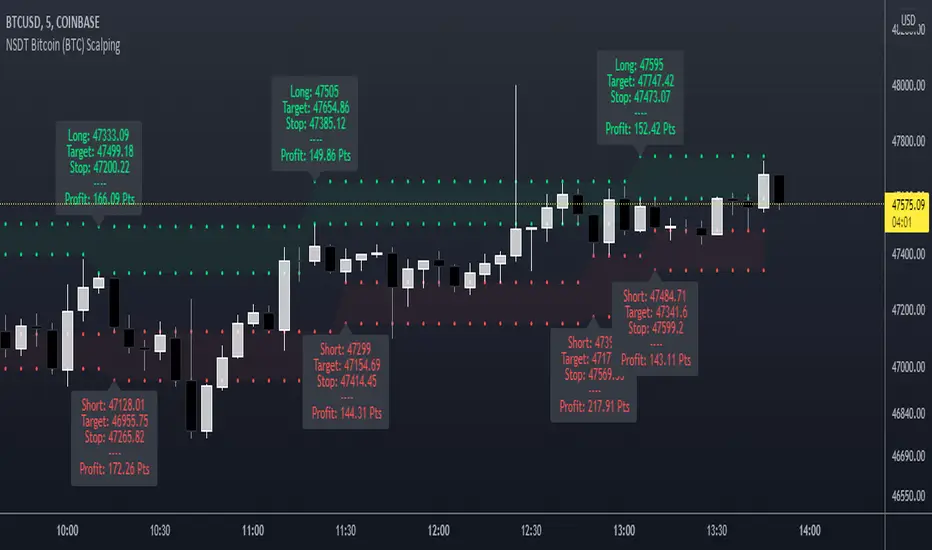
NSDT Bitcoin (BTC) ScalpingThis indicator is specifically designed for scalping Bitcoin (BTC). It looks for a particular price pattern/sequence and displays a label on the chart to show a potential entry, target, and stop based on that analysis. Basically enter long through the green zones and short through the red zones. These levels are not guaranteed to be hit. Trading is risking and you can lose money. Trade at your own discretion and risk. This indicator is only providing potential scalping zones based on recent price action.
Market Sniper - Trading/Scalping SuiteWelcome to Market Sniper.
Market sniper is meant to be a suite for trading/scalping alongside my indicators script, RSI, Stochastic and Horizontals.
It is based on over 15 Indicators/Oscillators so there is no need for convoluted charts and constantly changing charts/indicators for a better understanding of the market.
Warnings:
I can't stress this enough! This isn't a magic pill that will transform your illiterate grandmother into an expert trader! This is a very powerful tool whose function is to complement your trading/save time (and yes, with practice be your main trading tool).
This algorithm requires setting up and training to be used correctly, please do not expect to load it up and immediately be scalping the 1s charts.
This algorithm is heavy and might require constant refreshes of the browser on slower computers.
Labels overlap at the moment, working on this part at the moment. So, always zoom in before doing a trade / change the "+- signals in settings"
Candlestick patterns need tweaking, I personally have it off and use my own judgement atm.
What it includes:
Trend reversal / continuation (Macd, Stochastics, money flow , CCI , momentum, DIOSC (automatic trendlines ), SuperTrend, Moving averages, etc, etc.)
RSI divergence drive / drive counter (base code from Libertus, check his profile as he has very helpful scripts)
Bull Market expansions for longterm take profit and increasing position
Candlestick patterns
Trend reversal / Continuation
Green = Bullish reversal
Red = Bearish trend reversal
Orange = Trend continuation / strengthening
Trend Continuation/Strengthening
A warning here, trend strengthening also means that many times the indicators are overextended or close to it
------
The numbers reflect the amount of indicators that are signaling a reversal over the specified period on the settings.
For higher timeframes this setting should be on a lower value and the opposite for lower timeframes.
This works on every market and every timeframe(according to months of my own paper and real trading). Remember that each market/asset/commodity has different soft spots so tweaking, backtesting and present accuracy review should be of maximum priority.
Bull Market expansion phase
Warning:
The indicator purposely does not show any signals during bear markets. It is my opinion bear markets complexity render this tool close to useless.
It was designed to be used in higher timeframes, tough it SEEMS to have a good track record / be useful in lower timeframes.
it will ALWAYS give a fake signal at the end of a bull market because of the very nature of the code.
It is based of EMAs, RSI and Stochastic
Candlestick Patterns
Bullish candlestick patterns:
Hammer
Inverted Hammer
Dragonfly
Gravestone
Bearish candlestick pattern:
Shooting Star
Hanging Man
Gravestone
Dragonfly
RSI divergence drive
- Credit to Libertus for the base code of this section
The green triangle means there are at least 2 drives of valid divergence, yellow for 3 and red for 4+.
The script shows triangles when confirmation candle closes.
You need to know how divergence works to use this section. investopedia can easily get you there.
For cryptos I use 2-4h+ timeframes, for traditional markets I use 15min+ for forex I use it basically in every timeframe.
For questions/suggestions and access PM me in the platform itself and don't forget -> FEEDBACK IS IMPORTANT
Thank you all

Deviation Bollinger Band On-the-Fly Scalping System (3 Dev's)3 Deviation Bollinger Band On-the-Fly Scalping System
check meangreenmoneymachine.com
read "Scalping Forex with Bollinger Bands & Maximizing Profits by Joseph Wohlers
Scalping m15 indicator RovTradingScalping Indicator Combining UT Bot and Linear Regression Candles.
UT Bot uses ATR Trailing Stop to identify entry points.
Linear Regression Candles smooth price action and provide trend signals.
The indicator is suitable for scalping trading on the M15 timeframe.

Scalping Oversold/Overbought (RSI + Stochastic + VWAP + MA50)scalping di time frame 1 minute
simple baiii
the moment cross first candle kita buy saja at
second candle
the moment cross below vwap or MA50 kita sell
saja bai , apa problem.
tak payah nak pening kepala dengan macam
teknik turtle soup la , fvg la macam2
ko scalping jer kan
Reversal Scalping Ribbon - Adib NooraniThe Reversal Scalping Ribbon is a trend-following overlay tool designed to visually identify potential reversal zones based on price extremes and dynamic volatility bands. It calculates adaptive upper and lower bands using price action and custom ATR logic, helping traders quickly assess market direction and possible turning points
🔹 Volatility-adjusted bands based on price highs/lows
🔹 Color-coded ribbons to indicate trend bias and potential reversal shifts
🔹 No repainting, works on all timeframes and assets
🔹 Visual-only display, no trade signals — supports discretion-based entries
This ribbon is designed for scalpers and intraday traders to spot reversal setups with clarity. It enhances your trading by showing real-time market bias without unnecessary distractions. By focusing on probabilities, it helps to improve decision-making in fast-paced environments
How to use the indicator efficiently
For Reversal Trading:
Buy: When price closes below the green ribbon with a red candle, then re-enters with a green candle. Enter above the high of the green candle with a stop loss below the lowest low of the recent green/red candles
Sell: When price closes above the red ribbon with a green candle, then re-enters with a red candle. Enter below the low of the red candle with a stop loss above the highest high of the recent red/green candles
Risk Management:
Limit risk to 0.5% of your capital per trade
Take 50% profit at a 1:1 risk-reward ratio
For the remaining 50%, trail using the lower edge of the green band for buys and the upper edge of the red band for sells

HMA Breakout Buy/Sell indicator for Scalping & Intraday - ShyamHi All,
This is a very simple indicator which provides the buy signal, when the moving average lines turns Green and sell signal, when the moving average signal turns red. This can be used for both intraday and scalping method with different timeframes. But best time frame is 5 minutes.
Buy Signal >>> Line turns GREEN (Use trailing SL to cover maximum profit)
Sell Signal >>> Line turns RED (Use trailing SL to cover maximum profit)
No trade >>> Line turns GRAY
Best timeframe >>> 5 minutes
Thanks,
Shyam

Price change scalping short and long strategy indicatorPrice change scalping Short and Long indicator uses a rate of change momentum oscillator to calculate the percent change in price between a period of time. Rate of change calculation takes the current price and compares it to a price of "n" periods while the period of time can be defined by a user. The calculated rate of change value is then compared to the upper threshold and the lower threshold values to determine if a position should be opened. If the threshold is crossed and filtering conditions are met a strategy position will be triggered. Entry, take profit, and stop loss prices are calculated and displayed on the chart as well as positions directions. Once the entry price is crossed, a long or short position is created and once the take profit price is crossed, the stop loss price will begin to trail behind the price action using the close of the previous bar. Once the trailing stop price is crossed, the position is closed. If the entry price is not crossed and the price action crosses the stop level, the trade setup is cancelled. The indicator is enhanced by DCA algorithm which allows to average entry price with safety orders. The script also allows to use Martingale coefficient to increase averaging power
Advantages of this script:
The indicator has custom alert settings for each strategy action
The indicator can be used with 3Commas, Cryptohopper, Alertatron or Zignaly bots
High frequency and low duration of trades
Can be used with short-term timeframes ranging from 5 to 60 minutes
Indicator is sustainable to market slumps due to DCA implementation
Can be used for short and long positions (can be adjusted to long only, short only or both)
Can be applied to any market and quote currency
Easy to configure user interface settings
Built in detailed statistic menu
How to use?
1. Apply the indicator to a trading pair your are interested in using 5 to 60 minutes timeframe chart
2. Configure the indicator: change layer values, order size multiple and take profit/stop loss values according to current market cycle stage
3. Set up a TradingView custom alert using the indicator settings to trigger on a condition you are interested in
4. indicator will send alerts when to enter and when to exit positions which can be applied to your portfolio using external trading platforms
5. Update settings once market conditions are changed using backtests on a monthly period
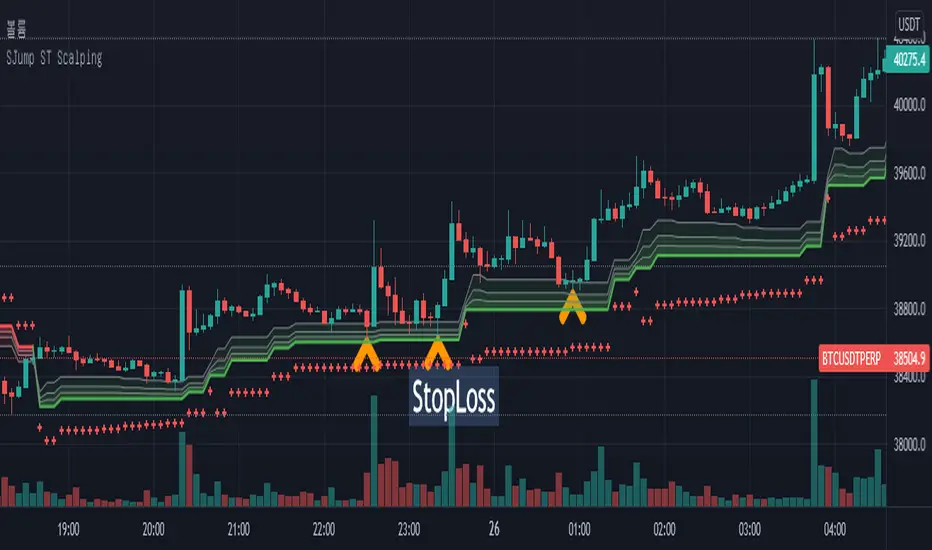
SuperJump HTF SuperTrend for ScalpingThis script can help you perform scalping using SuperTrend
First, set the HTF value higher than your current time frame.
As you know, the accuracy of the supertrend is very poor on the lower timeframe.
So I used higher timeframe(15 mins) supertrend more than current chart(5 mins)
crypto futures hourly scalping with ma & rsi - ogcheckershi to all lovable traders,
hereby i want to share a combination of trade ideas for scalping
i've chosen hourly timeframe
indicators used: moving averages and rsi
moving averages:
ema 3, ema 5, ema 7
sma 3, sma 5, sma 7
daily_ema_3, daily_ema_5
daily_ema_5, daily_sma_5
rsi:
rsi 7, rsi 14, rsi 26
daily_rsi_7, daily_rsi_14, daily_rsi_26
as per the analysis over moving average behavioral patterns & rsi movements, useful points are given below which will be helpful while choosing good entry points & exit points,
strategical points for LONG:
* when ema3 crosses above sma3 - green candles start to form
* it's followed by ema5 > sma5 and ema7 > sma7
* when ema3 crosses down sma3 - it's considered as an indication of exit
* if rsi supports then can wait for ema5 crossing down sma5
* as similar, when daily_ema_3 crosses above daily_sma_3, its an higher timeframe bullish indication, so the lower timeframe entries inside this higher timeframe is a sure shot confident entry
* for LONG always take entries when rsi_14 < 30 or 25 else check rsi_7 < 25 or below
* as along the above, bullish CANDLE patterns like bullish engulfing , morning star is been used for entry at lower levels
* so here i've used OPEN as rsi_source in majority
* exit points also indicated at high_rsi and moving average crossunders or reverse crossovers
* for SHORTING, the above said ideas can be used in viceversa
* inputs in the indicator were tailored for users needs so that you will enjoy the magics of customization
if i am wrong in anyways regarding the above indicator strategy, please forgive me and help me improve in this aspect by commenting.
after few more studies and analysis and mainly QUERIES & COMMENTS, i'm planning to backtest these strategies here in tradingview.
also if these strategies are coded in python, we can link it to Binance Futures Algo or Bot Trading.
thankyou for this opportunity,
thanks to tradingview and pinecoders
thanks to Pranab (for 365MA)
thanks to Gandalf (for inspiring)
Special Thanks & Love to Chartbank for Everything

LA_Crpyto_Pirate Modifie VuManChu B Script with Scalping FiltersI added the following filters for entry signals to the VuManChu B with divergences for use as a scalping indicator. You will need to load the 50 EMA and this indicator to trade this per the rules below
The rules for trading this are as follows; You can only take a long or short entry when all of these requirements match
The wave cross is under the zero line (long) or over the zero line (short)
The money flow indicator is green (long) or red (short)
The closing price is above the 200 EMA (long) or below the 200 EMA (short)
price has pulled back to the 50 EMA
Here are the filters I employed in the script to help you trade this
Zero Line Filter: Only signal longs under the zero line and shorts over the zero line will fire off a signal
Money Flow Indicator Filter: Only signal longs when money flow is green and only shorts when money flow is red
200 MA filter: Only longs when price is closing above the 200 EMA and only shorts when price is closing below the 200 EMA
When you get an alert, simply check to see that price has pulled back to the 50 EMA before entering. Place long and short orders when the indicator signals and you confirm price has pulled back to the 50 ema before entering the long or short. Set your Stop Loss above or below the pervious pullback and set a reward ratio of your choice. Good luck!