RSI Volatility Bands [QuantraSystems]RSI Volatility Bands
Introduction
The RSI Volatility Bands indicator introduces a unique approach to market analysis by combining the traditional Relative Strength Index (RSI) with dynamic, volatility adjusted deviation bands. It is designed to provide a highly customizable method of trend analysis, enabling investors to analyze potential entry and exit points in a new and profound way.
The deviation bands are calculated and drawn in a manner which allows investors to view them as areas of dynamic support and resistance.
Legend
Upper and Lower Bands - A dynamic plot of the volatility-adjusted range around the current price.
Signals - Generated when the RSI volatility bands indicate a trend shift.
Case Study
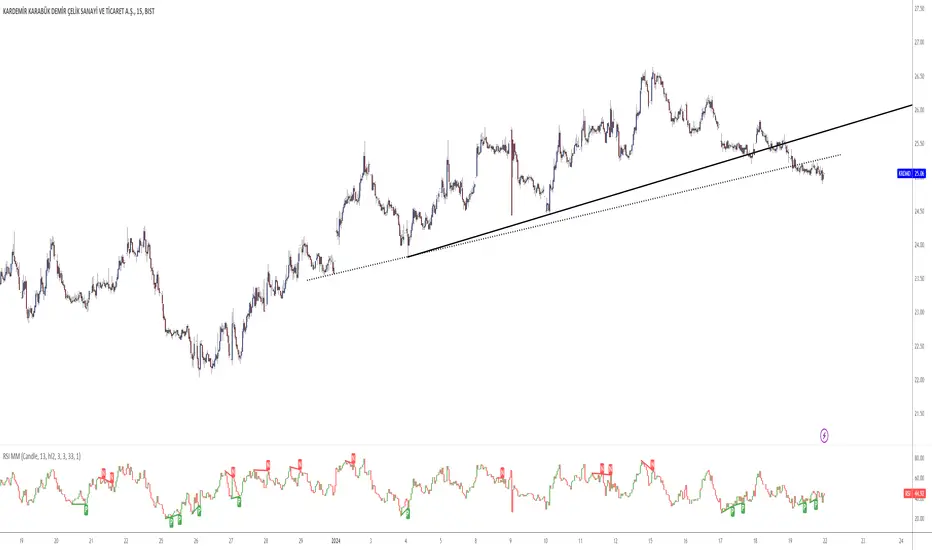
The chart highlights the occurrence of false signals, emphasizing the need for caution when the bands are contracted and market volatility is low.
Juxtaposing this, during volatile market phases as shown, the indicator can effectively adapt to strong trends. This keeps an investor in a position even through a minor drawdown in order to exploit the entire price movement.
Recommended Settings
The RSI Volatility Bands are highly customisable and can be adapted to many assets with diverse behaviors.
The calibrations used in the above screenshots are as follows:
Source = close
RSI Length = 8
RSI Smoothing MA = DEMA
Bandwidth Type = DEMA
Bandwidth Length = 24
Bandwidth Smooth = 25
Methodology
The indicator first calculates the RSI of the price data, and applies a custom moving average.
The deviation bands are then calculated based upon the absolute difference between the RSI and its moving average - providing a unique volatility insight.
The deviation bands are then adjusted with another smoothing function, providing clear visuals of the RSI’s trend within a volatility-adjusted context.
rsiVal = ta.rsi(close, rsiLength)
rsiEma = ma(rsiMA, rsiVal, bandLength)
bandwidth = ma(bandMA, math.abs(rsiVal - rsiEma), bandLength)
upperBand = ma(bandMA, rsiEma + bandwidth, smooth)
lowerBand = ma(bandMA, rsiEma - bandwidth, smooth)
long = upperBand > 50 and not (lowerBand < lowerBand and lowerBand < 50)
short= not (upperBand > 50 and not (lowerBand < lowerBand and lowerBand < 50))
By dynamically adjusting to market conditions, the RSI trend bands offer a unique perspective on market trends, and reversal zones.
Pesquisar nos scripts por "rsi"

RSI Divergence AlertsIndicator Description: RSI Divergence Alerts
The RSI Divergence indicator is a technical analysis tool that identifies divergences between the Relative Strength Index (RSI) and the price of an asset. The RSI is a momentum indicator that measures the speed and magnitude of recent changes in an asset's price, while divergences occur when there is a disparity between price movements and the RSI.
Indicator Customization:
Overbought and Oversold: The indicator allows you to customize the overbought and oversold levels of the RSI. This allows traders to adjust parameters according to their preferences and the historical behavior of the asset in question.
Indicator Settings and Recommended Adjustments:
Max Bar Distance: This parameter determines the maximum distance allowed between two low or high points for a divergence to be recognized. A higher value may result in more signals, but may also increase the number of false signals. It is recommended to adjust this value based on the volatility of the asset and the time period in which it is being traded.
RSI Length: This is the time period used to calculate the RSI. A longer period smoothes the indicator, while a shorter period makes it more sensitive to price changes. The default value is 14, but traders can adjust it based on their trading strategy and the asset's volatility.
RSI Overbought and Oversold: These values determine the levels at which the RSI is considered overbought and oversold, respectively. The default value for overbought is 75 and for oversold is 35. Traders can adjust these values according to the asset's volatility and its historical analysis. For example, in more volatile assets, it may be useful to use more extreme levels, such as 80 for overbought and 20 for oversold.
When adjusting indicator settings, traders must consider the balance between sensitivity and accuracy. Careful tuning of these parameters can help filter out false signals and identify more reliable trading opportunities.
The alerts functionality in this RSI Divergence indicator is designed to notify traders when a bearish divergence or a bullish divergence is detected. Here's how it works:
Conditionally Triggered Alerts:
Alerts are triggered based on the boolean variables bearishDivergence and bullishDivergence.
If bearishDivergence is true, it indicates that a bearish divergence has been detected.
If bullishDivergence is true, it indicates that a bullish divergence has been detected.
Alert Message:
When a divergence is detected, an alert message is generated to inform the trader about the event.
The message includes details about the divergence, such as the difference in the RSI value between the two points forming the divergence.
For example, for a bearish divergence, the message will include the phrase "Bearish RSI Divergence Detected" and the RSI difference between the high and low points of the divergence.
Alert Frequency:
Alerts are configured to be triggered once per bar close (alert.freq_once_per_bar_close), which means the alert will only be sent once at the close of each bar.
This helps to avoid multiple alerts for the same divergence during the same time period.
Additional Alert Conditions:
In addition to conditionally triggered alert messages, alert conditions are defined for both bearish and bullish divergences.
These alert conditions are useful for configuring custom alerts on trading platforms that support running Pine Script code.
Overall, this alert functionality allows traders to stay informed about potential trading opportunities based on divergences detected by the indicator. This can help traders make faster and more informed decisions in their trading processes.

RSI MFI WPR Combo [The_lurker]The "RSI MFI WPR Combo" is a sophisticated trading indicator developed for the TradingView platform, which synergistically combines the insights of three renowned technical analysis tools: the Relative Strength Index (RSI), the Money Flow Index (MFI), and the Williams Percent Range (WPR). This indicator is meticulously designed to assist traders in identifying potential buying and selling opportunities through the nuanced interpretation of market momentum, volume, and price position relative to recent highs and lows.
Purpose
The primary objective of the "RSI MFI WPR Combo" indicator is to offer a comprehensive tool that leverages the combined power of RSI, MFI, and WPR to detect overbought and oversold conditions, signaling potential reversal points in the market. This multifaceted approach aims to provide traders with a more robust framework for making informed decisions, enhancing their trading strategy with a multi-indicator analysis.
Indicator Conditions Explained
The core of this indicator lies in its strategic conditions that signal potential entry and exit points:
Oversold Condition (condition): This is identified when the MFI and RSI are both below 30, and the WPR falls below -91, suggesting a strong oversold market state. Such a scenario typically indicates a buying opportunity, assuming the market might rebound from this excessively sold condition.
Divergence Condition (condition1): It checks if the MFI exceeds 1.93 times the RSI. This unique condition aims to spotlight instances where there's a significant influx of money into an asset, which is not proportionately reflected in its RSI, potentially signaling an upcoming price increase or highlighting an unusual market situation for further analysis.
Overbought Warning (conditionExit): The exit signal is triggered when both the MFI and RSI exceed 85, and the WPR is above -15. This combination is indicative of an overbought market condition, suggesting the asset might be overvalued and a price correction or reversal could be imminent, hence signaling a potential selling opportunity or a caution against initiating new positions.
Application and Visualization
The "RSI MFI WPR Combo" not only provides numerical insights but also visualizes these conditions on the TradingView chart. By employing color-coding and plotting shapes, it offers traders an intuitive way to discern market states, enabling quick and effective decision-making. The integration of alert conditions ensures that traders are promptly notified of significant market events, aligning with their strategic trading objectives.
Plotting and Alerts in "RSI MFI WPR Combo"
Combined Alert Condition
The combinedAlertCondition is a logical statement that consolidates all individual conditions (condition, condition1, conditionExit, and The_lurkerMFI_oversold) into a single alert trigger. This condition becomes true and triggers an alert if any of the specified conditions for potential trading opportunities or warnings are met. It's designed to provide a comprehensive alert system that notifies the trader of any significant signal identified by the indicator, encompassing both entry and exit signals as well as oversold conditions.
Visual Indicators
Background Color for Oversold Condition: The script sets the background color to a specific shade of blue (#13c2e9 with 90% transparency) when the custom MFI indicates an oversold condition (The_lurkerMFI_oversold). This visual cue helps traders quickly identify periods when the market might be undervalued and potentially poised for a rebound.
Plotting Warning and Exit Signals:
Entry Signals: For the condition and condition1, which identify potential entry points, the indicator plots upward-pointing triangles below the price bars. These triangles are colored in specific shades to differentiate between the signals from the basic oversold condition and the divergence condition, making it visually intuitive for traders to recognize the signal type.
Exit Signals: For the conditionExit, signaling overbought conditions that might suggest an imminent price correction, downward-pointing red triangles are plotted above the price bars. This acts as a clear visual warning to consider exiting positions or to proceed with caution.
Alert Configuration
The script utilizes the alertcondition function to create an alert based on the combinedAlertCondition. When this condition is met, indicating any of the predefined signa
Conclusion
In summary, the "RSI MFI WPR Combo" stands out as a versatile and dynamic indicator that enriches a trader's toolkit by combining the analytical strengths of RSI, MFI, and WPR. By delineating clear conditions for market entry and exit points, it facilitates a proactive approach to trading, grounded in a detailed examination of market dynamics. This indicator exemplifies how blending multiple technical tools can lead to a more informed and nuanced market analysis, aiming to elevate the trading experience on the TradingView platform

RSI Missmatch(Divergence) OSC. by Neo_ with Missmatch Alert█ Definition
A divergence or missmatch occurs when an asset’s price is moving opposite to a specific technical indicator or is moving in a different direction from other relevant data. The divergence indicator warns traders and technical analysts of changes in a price trend, oftentimes that it is weakening or changing direction.
Divergence or missmatch can be either positive, signifying the possibility of a move that is higher in the asset’s price, or it can be negative, signifying the possibility of a move that is lower in the asset’s price.
█ Takeaways
Divergence or missmatch often works with other indicators and data. It is usually used by technical analysts and traders when the asset’s price is moving counter to the direction of another indicator.
As mentioned above, positive divergence or missmatch indicates that the price could start rising and usually occurs when the price is moving lower, but while another indicator counters this direction by moving higher. In other words, showing bullish signals.
Negative divergence or missmatch indicates that the price could start declining and usually occurs when the price is moving higher, while another indicator moves lower as well. In other words, showing bearish signals.
█ What to look for
Divergence or missmatch is most often used to track and analyze the momentum in an asset’s price and the odds of a price reversal within the current trend. While using divergence, traders and analysts can decide on whether or not they would like to exit the position or set a stop loss in the case the divergence is negative and prices begin to fall.
█ Limitations
It is best to use divergence or missmatch with the aid of other indicators and analysis tools in order to help identify and confirm trend reversals and major market patterns. Divergence should not be relied on by itself to tell you the pertinent information you need to know as an investor. Risk control is key in your analysis and the fact that divergence is not always present in price reversals should definitely be what pushes you to combine it with other tools and indicators.
Additionally, divergence or missmatch can reflect long-term or short-term changes. When making snap decisions, acting on divergence alone could prove detrimental to your trading. Make sure you have other risk factors applied to your charting and general market analysis.
█ What exactly is RSI Missmatches discrepancies using a lookback period in trading?
In trading, lookback period is the number of periods of historical data used for observation and calculation. It is how far into the past the system looks when trying to calculate the variable under consideration. The concept was based on the fact that history can provide information about the future, and my aim was to predict the periods when trend changes would begin within these periods with the RSI oscillator. But this is only true if you're locked back far enough, not locked any further or less!
We already use the idea of looking back in different aspects of our lives, and even in the world of financial trading it can be used in various ways. Of course you will want to learn more about the concept, so in this article we will cover the following topics:
█ What kind of hindsight is this?
The aim here is to check whether trends will change in certain cycles, so we chose the High + Low / 2 formula as the source. Because no matter how much the prices swing up or down, sometimes the rebound can go further. The aim here is to notice the points where the price leaves a needle at the levels where it oscillates and the slowdown in momentum.
█ What does look-back period mean in trade?
To understand what a lookback period means in trading, you need to ask yourself: What is a lookback period in trading? In financial trading, period refers to the duration of a particular trading session. For example, a one-week period means one full week of trading sessions or five trading days. In 5 trading days, the average time is 120 hours in FX markets and 40 hours in stock markets. Regardless of what happens in these cycles, I prefer to choose a time period of 55 periods. Because I noticed that in all the charts I examined, the cycles generally changed during this time period.
█ Let's talk about the meaning of catching Missmatches
As you know, technical indicators are all a mathematical calculation using historical market data (price, volume, or a combination of both). It shows the behavior of the price better and helps in the analysis of price movement. But the indicator can only serve your intended purpose if you get the lookback time right. What we mean here is the setting parameter that determines how much historical data it will use in its calculation. In other words, it is the retrospective review period.
For example, on the RSI indicator you can set this period to 13 periods (default setting) or even 2 periods. The period you choose can determine what the indicator tells you, which in turn determines the strategy you can create with the indicator. The 13- period RSI gives you information about price momentum, so you can effectively use it to create a momentum strategy. On the other hand, the 2-periods RSI can be used to create a mean reversion strategy. To catch any incompatibilities, I set this period to 55 periods. Nothing more, nothing less!
█ Summary
The missmatch indicator helps traders assess changes in the price trend and indicates when price will move with or against the direction of another indicator. It can be either positive or negative, but it is important to note its limitations and that it should be used with other indicators that can also monitor price trends.
We wish you to identify these incompatibilities in the market in the best way possible... Good luck.
█ Tanım
Bir varlığın fiyatı belirli bir teknik göstergenin tersi yönünde hareket ettiğinde veya diğer ilgili verilerden farklı bir yönde hareket ettiğinde bir sapma veya uyumsuzluk meydana gelir. Farklılık göstergesi, tüccarları ve teknik analistleri fiyat eğilimindeki değişiklikler konusunda uyarır; çoğu zaman zayıflıyor veya yön değiştiriyor.
Farklılık veya uyumsuzluk, varlığın fiyatında daha yüksek bir hareket olasılığını işaret ederek pozitif olabilir veya varlığın fiyatında daha düşük bir hareket olasılığını işaret ederek negatif olabilir.
█ Çıkarımlar
Farklılık veya uyumsuzluk çoğu zaman diğer göstergeler ve verilerle de çalışır. Genellikle teknik analistler ve yatırımcılar tarafından varlığın fiyatı başka bir göstergenin yönünün tersine hareket ettiğinde kullanılır.
Yukarıda bahsedildiği gibi pozitif sapma veya uyumsuzluk, fiyatın yükselmeye başlayabileceğini gösterir ve genellikle fiyat düşerken meydana gelir, ancak başka bir gösterge bu yöne yükselerek karşı koyar. Başka bir deyişle yükseliş sinyalleri veriyor.
Negatif sapma veya uyumsuzluk, fiyatın düşmeye başlayabileceğini gösterir ve genellikle fiyat yükselirken başka bir gösterge de düşerken meydana gelir. Başka bir deyişle düşüş sinyalleri veriyor.
█ Nelere bakılmalı
Farklılık veya uyumsuzluk çoğunlukla bir varlığın fiyatındaki momentumu ve mevcut trend içinde fiyatın tersine dönme olasılığını izlemek ve analiz etmek için kullanılır. Farklılaşmayı kullanırken tüccarlar ve analistler, sapmanın negatif olması ve fiyatların düşmeye başlaması durumunda pozisyondan çıkmak isteyip istemeyeceklerine veya zararı durdurma kararı verip veremeyeceklerine karar verebilirler.
█ Sınırlamalar
Trend dönüşlerini ve ana piyasa modellerini tanımlamaya ve doğrulamaya yardımcı olmak için diğer göstergeler ve analiz araçlarının yardımıyla sapmayı veya uyumsuzluğu kullanmak en iyisidir. Bir yatırımcı olarak bilmeniz gereken ilgili bilgileri size söylemesi için farklılığa tek başına güvenilmemelidir. Risk kontrolü analizinizin anahtarıdır ve fiyat dönüşlerinde farklılığın her zaman mevcut olmaması gerçeği kesinlikle sizi onu diğer araç ve göstergelerle birleştirmeye iten şey olmalıdır.
Ek olarak, farklılık veya uyumsuzluk uzun vadeli veya kısa vadeli değişiklikleri yansıtabilir. Ani kararlar verirken yalnızca farklılıklara göre hareket etmek ticaretinize zarar verebilir. Grafiğinize ve genel piyasa analizinize başka risk faktörlerinin uygulandığından emin olun.
█ Ticarette yeniden inceleme dönemi kullanan RSI Missmatches tutarsızlıkları tam olarak nedir?
Ticarette yeniden inceleme süresi, gözlem ve hesaplama için kullanılan geçmiş verilerin dönemlerinin sayısıdır. Söz konusu değişkeni hesaplamaya çalışırken sistemin ne kadar geçmişe baktığıdır. Konsept tarihin geleceğe dair bilgi verebileceği gerçeği üzerine kuruluydu ve amacım RSI osilatörü ile bu dönemler içerisinde trend değişimlerinin başlayacağı dönemleri tahmin etmekti. Ancak bu yalnızca yeterince geriye kilitlenmişseniz geçerlidir, daha fazla veya daha az kilitlenmemişseniz!
Geriye bakma fikrini hayatımızın farklı yönlerinde zaten kullanıyoruz ve hatta finansal ticaret dünyasında bile bu fikir çeşitli şekillerde kullanılabilir. Elbette konsept hakkında daha fazla bilgi edinmek isteyeceksiniz, bu nedenle bu yazıda aşağıdaki konuları ele alacağız:
█ Bu nasıl bir sonradan görmedir?
Burada amaç belli döngülerde trendlerin değişip değişmeyeceğini kontrol etmek olduğundan kaynak olarak Yüksek + Düşük / 2 formülünü seçtik. Çünkü fiyatlar ne kadar yukarı veya aşağı hareket ederse etsin bazen toparlanma daha da ileri gidebiliyor. Burada amaç fiyatın salınım yaptığı seviyelerde iğne bıraktığı noktaları ve momentumdaki yavaşlamayı fark etmektir.
█ Ticarette geriye bakma süresi ne anlama geliyor?
Ticarette yeniden inceleme süresinin ne anlama geldiğini anlamak için kendinize şu soruyu sormanız gerekir: Ticarette yeniden inceleme süresi nedir? Finansal ticarette dönem, belirli bir ticaret seansının süresini ifade eder. Örneğin, bir haftalık dönem, bir tam haftalık işlem seansı veya beş işlem günü anlamına gelir. 5 işlem gününde ortalama süre döviz piyasalarında 120 saat, borsalarda ise 40 saattir. Bu döngülerde ne olursa olsun 55 periyotluk bir zaman dilimini seçmeyi tercih ediyorum. Çünkü incelediğim tüm grafiklerde bu zaman diliminde döngülerin genel olarak değiştiğini fark ettim.
█ Kaçak Eşleşmeleri yakalamanın anlamı hakkında konuşalım
Bildiğiniz gibi teknik göstergeler, geçmiş piyasa verileri (fiyat, hacim veya her ikisinin birleşimi) kullanılarak yapılan matematiksel hesaplamalardır. Fiyatın davranışını daha iyi gösterir ve fiyat hareketinin analizine yardımcı olur. Ancak gösterge yalnızca yeniden inceleme süresini doğru yaparsanız amacınıza hizmet edebilir. Burada kast ettiğimiz, hesaplamasında ne kadar geçmiş veri kullanacağını belirleyen ayar parametresidir. Bir başka deyişle geriye dönük inceleme dönemidir.
Örneğin RSI göstergesinde bu süreyi 13 döneme (varsayılan ayar) ve hatta 2 döneme ayarlayabilirsiniz. Seçeceğiniz dönem, göstergenin size ne söyleyeceğini belirleyebilir ve bu da gösterge ile oluşturabileceğiniz stratejiyi belirler. 13 dönemlik RSI size fiyat momentumu hakkında bilgi verir, böylece onu bir momentum stratejisi oluşturmak için etkili bir şekilde kullanabilirsiniz. Öte yandan, ortalamaya dönüş stratejisi oluşturmak için 2 dönemlik RSI kullanılabilir. Herhangi bir uyumsuzluğu yakalamak için bu periyodu 55 periyoda ayarladım. Ne fazla ne eksik!
█ Özet
Uyumsuzluk göstergesi, yatırımcıların fiyat eğilimindeki değişiklikleri değerlendirmesine yardımcı olur ve fiyatın ne zaman başka bir göstergenin yönüne göre veya ona karşı hareket edeceğini gösterir. Olumlu ya da olumsuz olabilir, ancak sınırlamalarına dikkat etmek ve fiyat eğilimlerini de izleyebilecek diğer göstergelerle birlikte kullanılması gerektiğini unutmamak önemlidir.
Piyasadaki bu uyumsuzlukları en iyi şekilde tespit etmenizi dileriz... Bol Kazançlar.
RSI Levels On Chart [MisterMoTA]The values of the RSI Levels On Chart are calculated using Reverse Engineering RSI calculations by Giorgos Siligardos, Ph.D.
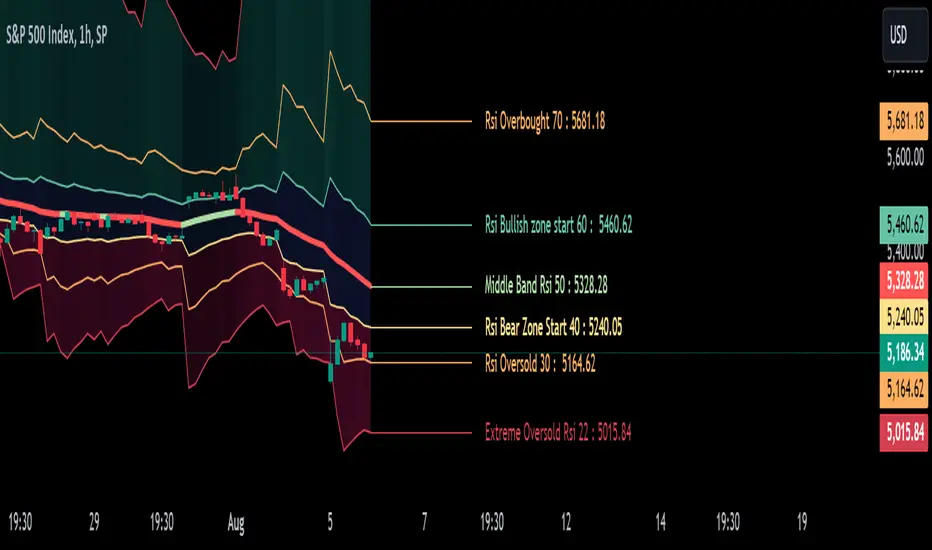
Instead of using only the 50 line of the RSI on chart I added options for users to define the Extreme Overbought and Oversold values, also simple Oversold and Overbought values, start of Bullish and Bearish zones and the 50 rsi value.
With the RSI Levels On Chart users are able to see on chart the price that a candles need to close for a certain value of the RSI. E.g. what price is needed for the RSI to be at oversold 30 or what would be the price when rsi will cross the 50 line.
The script has the 50 line color coded that will turn red when the line falling and will change to the user input color when it will be rising, helping users to see fast the clear trend of any asset on any timeframe from 1 second to 12 months.
I added few alerts for rsi overbought, oversold, extreme overbought and extreme oversold, crossing 50 level, crossing bullish or bearish zones values and also alerts for the 50 line falling or rising.
You can use RSI Levels On Chart as a simple indicator or you can add your favorite oscilator(s) to have a clear view of the trends of the markets, in this demo I added RSI + Divergences + Alerts with a moving average set to 50 RMA.
RSI and MACD Crossover SignalsBest for Short-Term/Intraday Trading on SPY, TSLA, NVDA
Strategy Concept:
This strategy is designed for short-term trading across various assets and timeframes (Recommend: 1min, 5min, 15min, 1hr, 4hr, 1day). It leverages the Relative Strength Index (RSI) and Moving Average Convergence Divergence (MACD) to identify potential buy and sell signals. The strategy aims to capture moments where the asset's price is likely to experience a reversal or a significant momentum shift.
By combining the RSI and MACD indicators, the strategy seeks to increase the accuracy of identifying potential trend reversals or continuations, taking into account both the momentum and the trend direction of the asset.
RSI (Relative Strength Index) Parameters:
The RSI period is set to 14
Overbought and oversold levels are set at 70 and 30, respectively
The RSI is used to identify potential reversal points when the asset is overbought or oversold
MACD (Moving Average Convergence Divergence) Parameters:
The MACD settings are configured with a fast length of 8, a slow length of 34, and a signal smoothing of 8
The MACD line crossing over or under the signal line is used to confirm the potential buy or sell signals indicated by the RSI
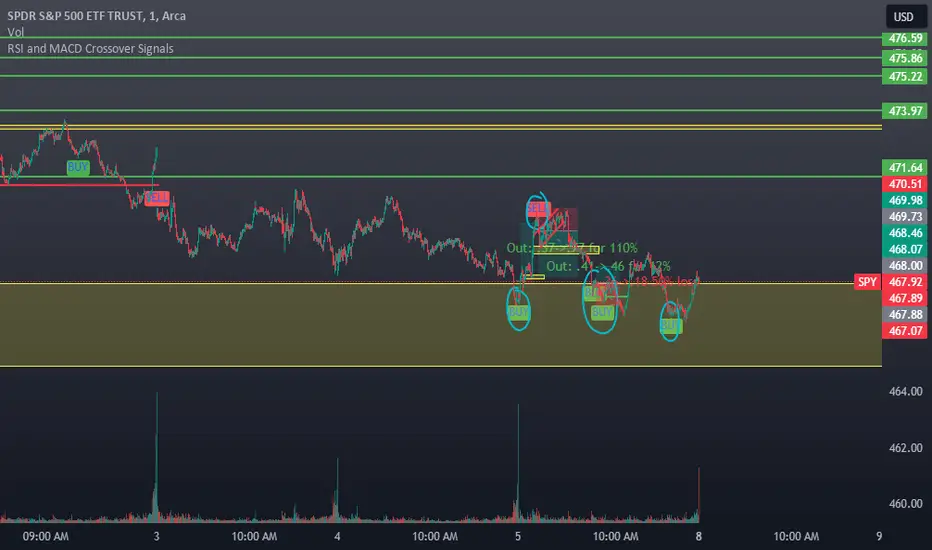
Signal Generation Logic:
Buy Signal:
Triggered when the RSI crosses above the oversold level (30).
Confirmed if the MACD line crosses above the signal line within a delay period of up to 4 candles after the RSI signal.
Sell Signal:
Triggered when the RSI crosses below the overbought level (70).
Confirmed if the MACD line crosses below the signal line within a delay period of up to 4 candles after the RSI signal.
Additional Features:
The script includes a notification system that alerts the trader when either a buy or sell signal is detected. The alert signal is combined with both the buy and sell signal in 1 so people without premium can be alerted when any signal appears.
Buy signals are visually represented on the chart below the price bars with a green "BUY" label.
Sell signals are indicated above the price bars with a red "SELL" label.
Usage and Application:
This strategy is versatile and recommended to be played with scalps and day trades. I prefer SPY 0DTE on the 1 and 5 minute timeframe and looking for bigger trend reversals on the 1hr, 4hr, and 1 day timeframe.
RSI Bands + Levels (Miu)This indicator was designed to plot lines from prices of overbought (OB) and oversold (OS) RSI levels in chart. It will also create a visible band between these levels.
It's main utility is to show in chart current and past prices for OB/OS RSI levels. Traditionally the RSI is considered overbought when above 70 and oversold when below 30 but you can customize these values in settings. The RSI oscillates between zero and 100.
Users can easily identify overbought and oversold prices using this indicator and then it is expected to help users to make better strategic decisions with their trades.
There are some extra options available in settings:
- Customizable RSI levels
- Customizable RSI length
- RSI Levels: if activated, it will draw lines above OB line and below OS line according to the multiplier, so it will plot sequential lines that goes in different RSI levels (e.g: RSI 72, 74, 76, 78 and 80).
- Backgroud only: it will remove these lines and keep only a backgroung color instead
- RSI 50: it will draw a line as RSI 50
- Customizable multiplier
Enjoy!

RSI and Stochastic Probability Based Price Target IndicatorHello,
Releasing this beta indicator. It is somewhat experimental but I have had some good success with it so I figured I would share it!
What is it?
This is an indicator that combines RSI and Stochastics with probability levels.
How it works?
This works by applying a regression based analysis on both Stochastics and RSI to attempt to predict a likely close price of the stock.
It also assess the normal distribution range the stock is trading in. With this information it does the following:
2 lines are plotted:
Yellow line: This is the stochastic line. This represents the smoothed version of the stochastic price prediction of the most likely close price.
White Line: This is the RSI line. It represents the smoothed version of the RSI price prediction of the most likely close price.
When the Yellow Line (Stochastic Line) crosses over the White Line (the RSI line), this is a bearish indication. It will signal a bearish cross (red arrow) to signal that some selling or pullback may follow.
IF this bearish cross happens while the stock is trading in a low probability upper zone (anything 13% or less), it will trigger a label to print with a pullback price. The pullback price is the "regression to the mean" assumption price. Its the current mean at the time of the bearish cross.
The inverse is true if it is a bullish cross. If the stock has a bullish cross and is trading in a low probability bearish range, it will print the price target for a regression back to the upward mean.
Additional information:
The indicator also provides a data table. This data table provides you with the current probability range (i.e. whether the stock is trading in the 68% probability zone or the outer 13, 2.1 or 0.1 probability zones), as well as the overall probability of a move up or down.
It also provides the next bull and bear targets. These are calculated based on the next probability zone located immediately above and below the current trading zone of the stock.
Smoothing vs Non-smoothed data:
For those who like to assess RSI and Stochastic for divergences, there is an option in the indicator to un-smooth the stochastic and RSI lines. Doing so looks like this:
Un-smoothing the RSI and stochastic will not affect the analysis or price targets. However it does add some noise to the chart and makes it slightly difficult to check for crosses. But whatever your preference is you can use.
Cross Indicators :
A bearish cross (stochastic crosses above RSI line) is signalled with a red arrow down shape.
A bullish cross (RSI crosses above stochastic line) is signalled with a green arrow up shape.
Labels vs Arrows:
The arrows are lax in their signalling. They will signal at any cross. Thus you are inclined to get false signals.
The labels are programmed to only trigger on high probability setups.
Please keep this in mind when using the indicator!
Warning and disclaimer:
As with all indicators, no indicator is 100% perfect.
This will not replace the need for solid analysis, risk management and planning.
This is also kind of beta in its approach. As such, there are no real rules on how it should be or can be applied rigorously. Thus, its important to exercise caution and not rely on this alone. Do your due diligence before using or applying this indicator to your trading regimen.
As it is kind of different, I am interested in hearing your feedback and experience using it. Let me know your feedback, experiences and suggestions below.
Also, because it does have a lot of moving parts, I have done a tutorial video on its use linked below:
Thanks for checking it out, safe trades everyone and take care!

RSI is in Normal Distribution?Does RSI Follow a Normal Distribution?
The value of RSI was converted to a value between 0~2, 2~4, ..., 98~100, and the number of samples was graphed.
The Z values are expressed so that the values corresponding to 30 and 70 of the RSI can be compared with the standard normal distribution.
Additionally, when using the RSI period correction function of the 'RSI Candle Advanced V2' indicator that I made before, it shows no change in standard deviation.
RSI는 정규분포를 따를까요
RSI의 값을 0~2, 2~4, ..., 98~100 사이 값으로 변환하고 그 표본 갯수를 그래프로 표현하였습니다.
Z 값은 RSI의 30, 70에 해당하는 값을 표준정규분포와 비교할 수 있도록 표현하였습니다.
추가적으로 제가 예전에 만들었던 'RSI Candle Advanced V2' 지표의 RSI 기간 보정 함수를 사용할 경우 표준편차의 변화가 없음을 보입니다.

RSI Multi Symbol/Time Frame DetectorThis code is an implementation of the Relative Strength Index (RSI) indicator, which is a popular momentum indicator used in technical analysis. The RSI measures the strength of an asset's price action and provides information on whether the asset is overbought or oversold. The code also calculates a moving average of the RSI and allows the user to choose the type of moving average to be calculated (SMA, EMA, SMMA, WMA, or VWMA).
The user can select from different time frames (5, 15, 60, or 240), symbols (SP:SPX, OANDA:EURUSD, or OANDA:NZDUSD), RSI lengths, and moving average types and lengths.
The code starts by defining a function called "ma" for calculating different types of moving averages. This function takes as input the source data for the moving average calculation (the RSI), the length of the moving average, and the type of moving average. The function uses a switch statement to return the appropriate calculation based on the inputted moving average type.
Next, the code calculates the RSI and its moving average. The RSI is calculated using the well-known formula for the RSI, which involves calculating the average gains and losses over a specified period of time and then dividing the average gains by the average losses. The moving average is calculated using the "ma" function defined earlier.
Finally, the code allows the user to choose the symbol and time frame to be used in the RSI calculation, as well as the length of the RSI and the moving average, and the type of moving average. The user can choose from three symbols (SP:SPX, OANDA:EURUSD, OANDA:NZDUSD) and four time frames (5, 15, 60, and 240 minutes). The code then uses the "request.security" function to retrieve the RSI calculation for the selected symbol and time frame.
Note: This code is example for you to use multi timeframe/symbol in your indicator or Strategy , also prevent Repainting Calculation

RSI TREND FILTERRSI TREND Filter on Chart
RSI scaled to fit on chart instead of oscillator, Trend Analysis is easy and Hidden Divergence is revealed using this indicator. This indicator is an aim to reduce confusing RSI Situations. The Oversold and Overbought lines help to determine the price conditions so its easy to avoid Traps.
Oversold and Overbought conditions are marked on Chart to make it useful to confirm a Buy or Sell Signals.
RSI 50 level is plotted with reference to EMA50 and Oversold and Overbought Conditions are calculated accordingly.
Uptrend: RSI Cloud / Candles above RSI 50 Level
Down Trend: RSI Cloud / Candles below RSI 50 Level
Sideways : Candles in the Gray Area above and below RSI 50 Level
Default RSI (14) : is the Candlestick pattern itself
Disclaimer: Use Solely at your own Risk.

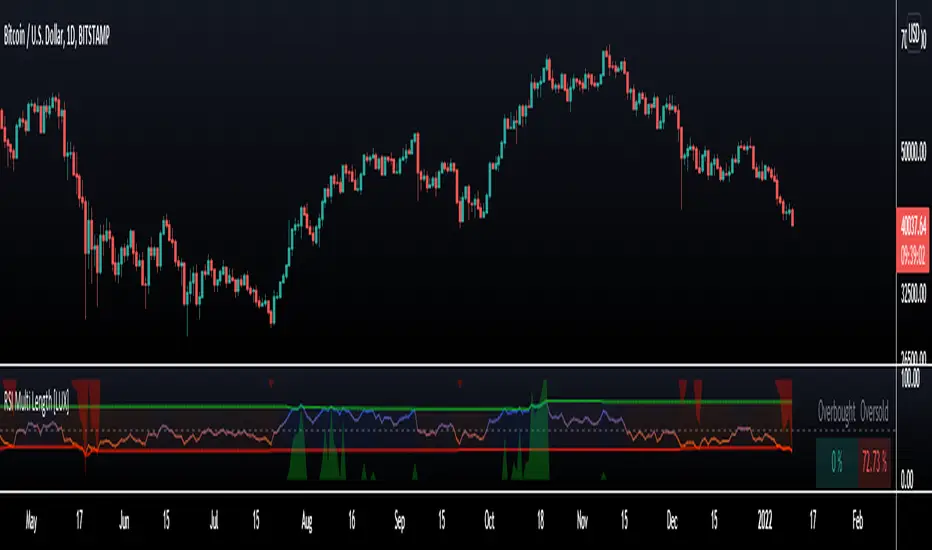
RSI Multi Length [LuxAlgo]The following indicator aims to return information over RSIs using multiple periods, including the percentage of RSIs of different periods being overbought/oversold, as well as the average between these multiple RSIs.
The percentage of RSIs of different periods being overbought/oversold is additionally used to return adaptive overbought/oversold levels.
Settings
Maximum Length: Maximum period of the RSI used for the indicator calculation
Minimum Length: Minimum period value of the RSI used for the indicator calculation
Overbought: Value of the overbought level
Oversold: Value of the oversold level
Src: Input source of the indicator
Usage
The main element of the indicator is given by the multi-length RSI average, returning an oscillator similar to a fixed-length RSI. Because of its multiple length nature, the indicator can reflect shorter to longer-term price variations depending on the Maximum/Minimum length range defined by the user.
The green area indicates the percentage of RSIs over the user-defined overbought level. The red area indicates the percentage of RSIs under the user-defined oversold level, this percentage is inverted for ease of visualization. Additionally, a dashboard at the top right of the indicator pane indicates these percentages for the most recent bar.
A lower percentage of overbought/oversold RSIs can indicate a potential shorter-term retracement.
These percentages are used to construct adaptive overbought/oversold levels for the average multi-length RSI. The overbought level will be easier to reach if the percentage of overbought RSI's is high, the same logic applies to the adaptive oversold level.
RSI Trend LineI took a concept similar to the "Adaptive RSI" to get the RSI overlaid on a price chart. The problem I have with the Adaptive RSI is to me it sticks too closely to price. I wanted something much more visually helpful that can provide actual tradable signals and strategies.
The orange line you are seeing is the "RSI Trend Line"
The further the RSI moves away from a value of 50 (the "zero line"), the more you see this orange line move away from price. This helps visualize the strength of price pushing away from a neutral value to a position of strength or weakness-- if orange is below price then relative strength is high; if orange is above price then relative strength is low. When price is equal to the orange RSI line, the RSI is at a value of 50.
In addition to the trend line, you can enable bands which reflect Overbought and Oversold levels . If you leave the responsiveness to a value of 1.0 and removed any smoothing, these should pretty accurately reflect an actual RSI chart topping the OB and OS lines (default 70 and 30, respectively). (They're still very close with different responsiveness and smoothing values)
The conversion or scaling of RSI value onto price comes with a bit of a quirk which I decided to leave to the user to determine how they want it applied. So the setting "Responsiveness" will impact the sort of aggressiveness of the RSI trend line as well as the the size of the bands. You could think of this in some ways as the OPPOSITE of the multiple setting on a Bollinger or Keltner band-- 1.0 will make for the widest band, 2.0 is the default and my preference, and you can move it up to a value of 5.0.
Here are some examples of how you could use the indicator for trade signals--
And here's my thought on the current state (as of 10/06) on indices with regards to this indicator-

RSI 6/14/24 by HC3 timeframes of RSIs: 6, 14 and 24 days. This is the extended version of the "standard" RSI script.
How to use it:
It has 3 upper bands and 3 lower bands. The 6-day RSI (orange line) corresponds to 80 and 20 bands, which means if 6-day RSI is over 80, it is an indicator of overbought for short term. Similarly, 14-day RSI use 70 and 30 bands and 24-day RSI use 60 and 40 bands. But these are not the "magic numbers". For different investments, they may have different thresholds. You can change it in the setting.
We all know when RSI is high, it may be an indicator to sell the investments we are holding. However, if 6-day RSI > 80, but 14-day RSI <70, it may not be the good time to sell it right now. We may watch it for a few days. But if all 3 RSIs are above the corresponding upper bands, it may be the time to sell it.
When the orange line down crosses the purple and blue lines, the price is dropping down. On the contrary, when the orange line up crosses the purple and blue lines, the price is probably up.
Let me know if you have any question.
Holly
2020.12.05

Bjorgum RSIRSI output signals are displayed with color change to reflect the plotted value. This makes evaluating RSI conditions require but a glance.
RSI momentum buy signals are given on the cross of the 50 level, whereas sell signals are given on a fall below.
Default values a 5 period RSI which gives more timely entrances and exits for swing traders. This can be adjusted to the typical 14 period if the viewer desires slower signals.
Bullish and bearish area is shaded to accentuate the signal to the eye.
Excellent results can be found when coupling BJ RSI, with BJ TSI, and the reversal system using all 3 as a complete together simultaneously
Default color changes are plotted as a recorded value falls within the following levels:
RSI < 30 = green
RSI 30-50 = red
RSI 50-70 = blue
RSI 70-80 = yellow
RSI 80-90 = orange
RSI 90-100 = white hot

Rsi, Stoch, DMI, Doble(Stoch RSi) // By MocheroWith this indicator we seek to find convergence of the
First Oscillator (RSI, Stoch and DMI) and the Second Oscillator (Stoch, Stoch RSI 1 and Stoch RSI 2) for purchases or sales.
Search Buy when,
First Oscillator
-Rsi oversold
-Stoch over sold
-DMI oversold
Second Oscillator
-Stoch over sold
-Stoch RSI 1 oversold
-Stoch RSI 2 oversold
Suggested values
First Oscillator
Rsi: 4
Stoch: 5.1.1
DMI: 10.3
Second Oscillator
Stoch: 14.3.3
Stoch RSI 1: 14 .14.3.3
Stoch RSI 2: 6. 6.3.3
Suggested time, 3M 5M 15M

RSI Season Tracker by KrisWatersSeason tracker identifies the momentum with tracking dominance and market capitalization data of Bitcoin , Altcoin and USDT .
With this indicator you can able to get know about Bitcoin, Altcoin and USDT dominance and market capitalization easily.
Backgrond Color Definations:
If the background color of indicator is ORANGE means that Bitcoin dominance is the most powerful. It is a good sign for Bitcoin.
If the background color of indicator is BLUE means that Altcoin dominance is the most powerful. It is a good sign for Altcoins.
If the background color of indicator is GREEN means that USDT dominance is the most powerful. It is a good sign for USDT.
Plus Sign (+) Meaning and Color Definations:
If ORANGE plus sign is visible on indicator means that market capitalization of Bitcoin is increasing. It is a good sign for Bitcoin.
If BLUE plus sign is visible on indicator means that market capitalization of Altcoin is increasing. It is a good sign for Altcoins.
If GREEN plus sign is visible on indicator means that market capitalization of Bitcoin and Altcoins are decreasing. It is not a good sign for both.
Light and Dark RSI Line Color Definations:
If the line of Bitcoin color is Orange means that, RSI value was increased compared with previous bar. It is one of the good sign of the momentum strength.
If the line of Bitcoin color is Yellow means that, RSI value was decreased compared with previous bar. It is not a good sign.
If the line of Altcoin color is Navy means that, RSI value was increased compared with previous bar. It is one of the good sign of the momentum strength.
If the line of Altcoin color is Blue means that, RSI value was decreased compared with previous bar. It is not a good sign.
If the line of USDT color is Green means that, RSI value was increased compared with previous bar. It is one of good the sign of the momentum strength.
If the line of USDT color is Lime means that, RSI value was decreased compared with previous bar. It is not a good sign.
Simple RSI rules are valid for this indicator.
RSI value is under 30 indicates that asset is OVERSOLD .
RSI value is upper 70 indicates that asset is OVERBOUGHT .
Important Notice: Dominance data is not correlated with price. For example; sometimes dominance is increasing but the price is not. And that's where the market capitalization comes in.
If the plus sign is not visible , you can get questioning for the movement. It is not a good sign at all.
If the plus sign is visible and RSI is increasing , It is a good sign for the strength of assets movement.
I recommended to use on DAILY timeframe . But you can use different timeframes as well.
Please leave comment below If you have any question or development idea.

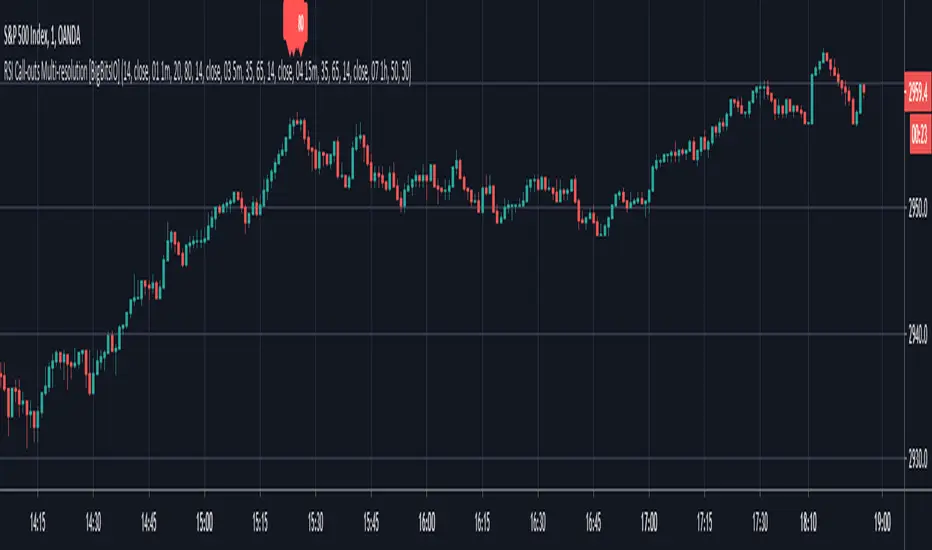
RSI Call-outs Multi-resolution [BigBitsIO]This is a simple multi-resolution (multi-timeframe) RSI indicator that overlays the current chart to show labels for specified oversold and overbought areas defined with inputs.
Up to 4 different resolutions/timeframes for their respective RSI (1,2,3, or 4). RSI1 is always enabled and can not be disabled.
Red labels with white text represent overbought RSI levels as defined by the user. All enabled RSI will have to qualify as overbought based on settings.
Green labels with black test represent oversold RSI levels as defined by the user. All enabled RSI will have to qualify as oversold based on settings.
This RSI overlay help easily call-out overbought and oversold candles on a chart where other RSI values on larger resolutions/timeframes are also oversold/overbought without sacrificing screen space for a traditional RSI indicator that is not overlayed on the chart.
This indicator has alert conditions that will trigger when all enabled RSI indicators are either oversold or overbought respective to your settings.
Note: The best results are to operate your chart as your smallest RSI resolution selected. Personally, I prefer to have my smallest (shortest timeframe) in RSI1, and go larger farther out to RSI4.
RSI + Composite Index [SHK]One of the most powerful indicator based and divergence strategies i have ever seen was made by Constance Brown.
The Composite Index:
The best way to think of the Composite Index as it applies to the RSI is to think of the RSI as Windows 3.0 and the Composite Index as Windows 10. Constance Brown discovered that the RSI, while it does create and detect divergences, does is not as accurate as it could be. It’s a bit of an oxymoron to say this but the RSI is a momentum indicator without any momentum calculation attached to it. The RSI actually misses a significant amount of important moves and even generates some bad moves. What Constance Brown did with the RSI is to input a momentum calculation within the RSI itself.
Usage:
1. Check hidden and regular divergences on RSI+COMPOSITE_INDEX and PRICE+COMPOSITE_INDEX.
2. After finding divergence wait for COMPOSITE_INDEX to cross under/over it's moving averages to trigger.
Useful Note:
"RSI overbought/oversold as filter", "RSI and COMPOSITE_INDEX trendline as trigger", "RSI 50 Over/Under as trend direction detection", ... can be add to this strategy.
Enjoy!

RSI EMA CrossOver RameshThe RSI is one of the most popular technical indicators. The RSI measures the internal strength of the security. The RSI indicator oscillates between oversold and over bought levels, where a trader is advised to look for buying opportunities when the stock is in over sold region and selling opportunities when the stock is in over bought region.
The RSI with EMA strategy signals a trade when EMA of 7 period RSI crosses over the EMA of a 14 period RSI.
Buy: when 10 EMA of 7 period RSI crossing up 10 EMA of a 14 period RSI
Sell: when 10 EMA of 7 period RSI crossing down 10 EMA of a 14 period RSI
EMA = Exponential Moving Average
Crossover = Simple crossover between current RSI values and its 10 day EMA

RSI / Stoch / SRSI / MFI / Aroon Overlay [SigmaDraconis]Combines 4 popular indicators (RSI, Stoch, SRSI, MFI) and 1 peculiar one (Aroon) in 1 for those who want to save indicators but not only.
This is an evolution of my (simpler) "RSI / Stoch / Stoch RSI (SRSI) Overlay " that you can find on my scripts.
Added bands for oversold/overbought areas (70/30 common for RSI and 80/20 for SRSI and MFI), as well as a middle 50 horizontal line.
Neutral bands around 55-45 added as well that can be hidden for less clutter. I also recommend a more transparent coloring for these since Pine script doesn't allow default transparency for horizontal lines.
By default only RSI and Stoch are activated, you can activate Aroon, MFI and SRSI on the inputs window.
Some extra notes:
* RSI, Stoch and MFI can help to strengthen one's decision as well as Aroon to predict a possible trend reversal, SRSI can show when RSI has high probability of being topped or bottomed when oversold/overbought but don't forget to look at volume and how the trend progresses that can keep SRSI above 80 or below 20 while RSI and price continues to trend, divergences are most helpful here to find possible reversal areas.
* This chart depicts some interesting divergences, as well as Stoch tops and bottoms and confluences between RSI/MFI and Stoch on some over-extended tops and bottoms that shown being good reversal zones.
RSI resistances are shown as well, failing to break above 60 or the neutral zone (this is a bearish BTC trend chart after all) or failing to gain support to break up certain levels (RSI notes a more bullish trend when consistently above 60 and more bearish below 40).
If you like it and use it to profit, please tip me below :)
Tip jars:
BTC: 15nMBiEGVrdGcu9C1h6QRcTNRvugHkqrMQ
ETH: 0xC33845946c48B61fBCbEA0367ec2238CaF2b73bc
BTS: sigma-draconis

RSI + Smoothed HA Strategy 🚀 RSI + SMOOTHED HEIKEN ASHI STRATEGY (TRAILING TP, 1% SL) 📊
🎯 STRATEGY OVERVIEW
This professional trading strategy combines MOMENTUM ANALYSIS with TREND CONFIRMATION using two powerful technical indicators. The system executes LONG-ONLY POSITIONS when bullish conditions align, featuring AUTOMATED RISK MANAGEMENT with a fixed stop loss and dynamic trailing exit.
⚙️ CORE COMPONENTS
📈 INDICATOR 1: RELATIVE STRENGTH INDEX (RSI)
CALCULATION: Standard 14-period RSI (configurable)
ENTRY THRESHOLD: 55 LEVEL (adjustable parameter)
PURPOSE: Identifies MOMENTUM STRENGTH and OVERBOUGHT CONDITIONS
VISUAL: Blue RSI line with gray threshold level plotted separately
🕯️ INDICATOR 2: DOUBLE-SMOOTHED HEIKEN ASHI
UNIQUE FEATURE: DOUBLE EMA SMOOTHING applied to Heiken Ashi candles
SMOOTHING LAYERS:
FIRST LAYER: EMA applied to raw OHLC data (default: 10 periods)
SECOND LAYER: EMA applied to Heiken Ashi values (default: 10 periods)
COLOR SCHEME:
🟢 LIME GREEN: Bullish candle (close > open)
🔴 RED: Bearish candle (close < open)
BENEFIT: REDUCES MARKET NOISE while maintaining trend clarity
🎮 ENTRY CONDITIONS
📈 LONG POSITIONS ACTIVATE WHEN ALL THREE CONDITIONS CONVERGE:
RSI MOMENTUM: RSI ≥ 55 (configurable level)
TREND CONFIRMATION: Current smoothed Heiken Ashi candle is GREEN
TREND REVERSAL SIGNAL: Previous smoothed Heiken Ashi candle was RED
✅ ENTRY LOGIC: This triple-filter approach ensures trades are taken only during CONFIRMED BULLISH SHIFTS with underlying momentum strength.
🛡️ RISK MANAGEMENT SYSTEM
⛔ STOP LOSS PROTECTION
FIXED 1% RISK PER TRADE
AUTOMATIC CALCULATION: Stop placed at 99% of entry price
IMMEDIATE ACTIVATION: Engages upon position entry
BENEFIT: CAPS MAXIMUM LOSS regardless of market volatility
💰 TRAILING TAKE-PROFIT MECHANISM
DYNAMIC EXIT STRATEGY: Tracks trend continuation
EXIT CONDITION: Closes position when smoothed Heiken Ashi turns RED
ADVANTAGE: LOCKS IN PROFITS during trend reversals
LOGIC: Allows winners to run while protecting gains
💼 POSITION SIZING
CAPITAL ALLOCATION: 10% of equity per trade (fully customizable)
INITIAL CAPITAL: $10,000 (user-adjustable)
FLEXIBILITY: Compatible with various account sizes
✨ KEY ADVANTAGES
🎯 PRECISE TIMING
Combines MOMENTUM FILTER (RSI) with TREND FILTER (Heiken Ashi)
Reduces false signals through CONFIRMATION SEQUENCE
🛡️ DISCIPLINED RISK CONTROL
PREDEFINED 1% STOP LOSS eliminates emotional decisions
SYSTEMATIC EXITS remove subjective profit-taking
👁️ VISUAL CLARITY
CLEAN CHART PLOTTING with color-coded candles
SEPARATE RSI DISPLAY for momentum monitoring
REAL-TIME SIGNALS directly on price chart
⚡ OPTIMIZATION TIPS
ADJUST RSI LEVEL based on asset volatility (55-70 range)
MODIFY SMOOTHING PERIODS for different timeframes
TEST POSITION SIZE according to risk tolerance
COMBINE WITH VOLUME CONFIRMATION for enhanced accuracy
📊 RECOMMENDED MARKETS
TRENDING FOREX PAIRS (EUR/USD, GBP/USD)
LIQUID INDICES (S&P 500, NASDAQ)
HIGH-CAP CRYPTO (BTC/USD, ETH/USD)
TIME FRAMES: 1-hour to daily charts
⚠️ RISK DISCLAIMER
This strategy is a TOOL FOR ANALYSIS, not financial advice. Always:
BACKTEST extensively before live trading
START WITH SMALL CAPITAL
USE PROPER RISK MANAGEMENT
CONSULT FINANCIAL PROFESSIONALS

RSI Driven ATR Trend [NeuraAlgo]
RSI Driven ATR Trend
Dynamic Trend Detection and Strength Analysis
Unlock the market’s hidden rhythm with the RSI Driven ATR Trend , a sophisticated tool designed to measure trend direction and strength using a combination of RSI momentum and ATR-based volatility . This indicator provides real-time insights into bullish and bearish phases, helping traders identify potential turning points and optimize entry and exit decisions.
1.Core In Logic:
Dynamically calculates trend levels based on RSI and ATR interactions.
Highlights trend direction with intuitive color coding: green for bullish, red for bearish.
Displays trend strength as a percentage to quantify momentum intensity.
Automatic visual cues for potential trend reversals with “Turn Up” and “Turn Down” labels.
Advanced smoothing and dynamic gating ensure responsive yet stable trend detection.
Compatible with all timeframes and instruments.
2.Inputs Explained:
Rsi Factor: Adjusts the sensitivity of the RSI in trend calculation. Higher values make the trend detection more responsive to momentum changes.
Multiplier: Multiplies the effect of Rsi Factor to fine-tune trend responsiveness.
Bar Back: Number of bars used for peak and dip calculations, determining how far back the indicator looks for trend changes.
Period: Lookback period used in trend gating and ATR calculations.
Source: Price source for calculations (default is close).
Main Colors: Customize bullish and bearish trend colors.
3.How it Works:
The indicator calculates RSI values and ATR-based dynamic ranges to determine upper and lower trend levels.
Trend direction is determined by price crossing above (bullish) or below (bearish) the dynamic trend line.
Trend strength is expressed as a percentage relative to the trend line, helping you assess momentum intensity.
Visual cues like "Turn Up" and "Turn Down" labels indicate potential trend reversals.
Bars are colored dynamically based on trend direction for quick interpretation.
Ideal for traders seeking a clear, actionable view of market trends without the clutter of multiple indicators. RSI Driven ATR Trend translates complex price behavior into an easy-to-read visual guide, helping you make smarter trading decisions.
Happy Trading!
