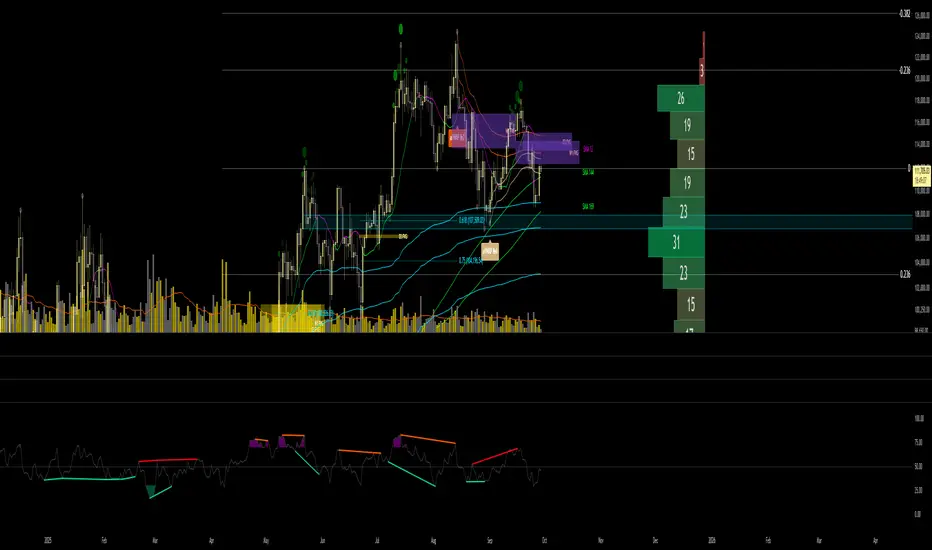
Weekly COTAdjusted COT Index
Improves upon: "COT Index Commercials vs large and small Speculators" by SystematicFutures
How: CoT Indexes are adjusted by Open Interest to normalise data over time, and threshold background colours are in-line with Larry Williams recommendations from his book.
Note: This indicator is **only** accurate on the Daily time-frame due to the mid-week release date for CoT data.
This script calculates and plots the Adjusted Commitment of Traders (COT) Index for Commercial, Large Speculator, and Retail (Small Speculator) categories.
The CoT Index is adjusted by Open Interest to normalise data through time, following the methodology of Larry Williams, providing insights into how these groups are positioned in the market with an arguably more historically accurate context.
COT Categories
-------------------
- Commercials (Producers/Hedgers): Large entities hedging against price changes in the underlying asset.
- Large Speculators (Non-commercials): Professional traders and funds speculating on price movements.
- Retail Traders (Nonreportable/Small Speculators): Small individual traders, typically less informed.
Features
----------
- Open Interest Adjustment
- The net positions for each category are normalized by Open Interest to account
for varying contract sizes.
- Customisable Look-back Period
- You can adjust the number of weeks for the index calculation to control the
historical range used for comparison.
- Thresholds for Extremes
- Upper and lower thresholds (configurable) are provided to mark overbought and
oversold conditions.
- Defaults
- Overbought: <=20
- Oversold: >= 80
- Hide Current Week Option
- Optionally hide the current week's data until market close for more accurate comparison.
- Visual Aids
- Plot the Commercials, Large Speculators, and Retail indexes, and optionally highlight extreme positioning.
Inputs
--------
- weeks
- Number of weeks for historical range comparison.
- upperExtreme and lowerExtreme
- Thresholds to identify overbought/oversold conditions (default 80/20).
- hideCurrentWeek
- Option to hide current week's data until market close.
- markExtremes
- Highlight extremes where any index crosses the upper or lower thresholds.
- Options to display or hide indexes for Commercials, Large Speculators, and Small Speculators.
Outputs
----------
- The script plots the COT Index for each of the three categories and highlights periods of extreme positioning with customisable thresholds.
Usage
-------
- This tool is useful for traders who want to track the positioning of different market participants over time.
- By identifying the extreme positions of Commercials, Large Speculators, and Retail traders, it can give insights into market sentiment and potential reversals.
- Reversals of trend can be confirmed with RSI Divergence (daily), for example
- Continuation can be confirmed with RSI overbought/oversold conditions (daily), and/or hidden RSI Hidden Divergence, for example
Pesquisar nos scripts por "rsi divergence"
Adjusted CoT IndexAdjusted COT Index
Improves upon: "COT Index Commercials vs large and small Speculators" by SystematicFutures
How: CoT Indexes are adjusted by Open Interest to normalise data over time, and threshold background colours are in-line with Larry Williams recommendations from his book.
Note: This indicator is **only** accurate on the Daily time-frame due to the mid-week release date for CoT data.
This script calculates and plots the Adjusted Commitment of Traders (COT) Index for Commercial, Large Speculator, and Retail (Small Speculator) categories.
The CoT Index is adjusted by Open Interest to normalise data through time, following the methodology of Larry Williams, providing insights into how these groups are positioned in the market with an arguably more historically accurate context.
COT Categories
-------------------
- Commercials (Producers/Hedgers): Large entities hedging against price changes in the underlying asset.
- Large Speculators (Non-commercials): Professional traders and funds speculating on price movements.
- Retail Traders (Nonreportable/Small Speculators): Small individual traders, typically less informed.
Features
----------
- Open Interest Adjustment
- The net positions for each category are normalized by Open Interest to account
for varying contract sizes.
- Customisable Look-back Period
- You can adjust the number of weeks for the index calculation to control the
historical range used for comparison.
- Thresholds for Extremes
- Upper and lower thresholds (configurable) are provided to mark overbought and
oversold conditions.
- Defaults
- Overbought: <=20
- Oversold: >= 80
- Hide Current Week Option
- Optionally hide the current week's data until market close for more accurate comparison.
- Visual Aids
- Plot the Commercials, Large Speculators, and Retail indexes, and optionally highlight extreme positioning.
Inputs
--------
- weeks
- Number of weeks for historical range comparison.
- upperExtreme and lowerExtreme
- Thresholds to identify overbought/oversold conditions (default 80/20).
- hideCurrentWeek
- Option to hide current week's data until market close.
- markExtremes
- Highlight extremes where any index crosses the upper or lower thresholds.
- Options to display or hide indexes for Commercials, Large Speculators, and Small Speculators.
Outputs
----------
- The script plots the COT Index for each of the three categories and highlights periods of extreme positioning with customisable thresholds.
Usage
-------
- This tool is useful for traders who want to track the positioning of different market participants over time.
- By identifying the extreme positions of Commercials, Large Speculators, and Retail traders, it can give insights into market sentiment and potential reversals.
- Reversals of trend can be confirmed with RSI Divergence (daily), for example
- Continuation can be confirmed with RSI overbought/oversold conditions (daily), and/or hidden RSI Hidden Divergence, for example
Ultimate RSI - Divergence + S/R + Reverse RSIThis is a modification of the TradingView RSI with some of my favourite RSI features added.
This includes Divergence indicators. EMA with colour change on cross, Support and resistance lines and reverse RSI.
A reverse calc has also been added. This will allow you to input 3 different RSI values for a price prediction. This is good to use with the support and resistance lines and can give you key areas on the chart where the price may bounce/reject.
All colours and modifications can be turned on/off.
Enjoy! :)
[JL] Stochastic Divergence AlertCompare two cross area:
k is increasing, low is lower and previous k is less than bottom level then it is bottom divergence
k is decrease, high is higher and previous k is more than top level then it is top divergence
With long term moving average(400), seems that Stochastic Divergence is more accurate than RSI Divergence on 1m chart.
Bat Action Magnet Move BAMM Theory Educational (Source Code)This indicator was intended as educational purpose only for BAMM, which also known as Bat Action Magnet Move.
Indikator ini bertujuan sebagai pendidikan sahaja untuk BAMM, juga dikenali sebagai Bat Action Magnet Move.
BAMM is usually used for Harmonic Patterns such as XAB=CD (Bat Pattern) and AB=CD (0.5 AB=CD Pattern) - Chapter 5.
BAMM also can be used for other Harmonic Pattern with the help of RSI Divergence, hence become RSI BAMM - Chapter 6.
BAMM kebiasaanya digunakan untuk Harmonic Pattern seperti XAB=CD (Bat Pattern) dan AB=CD (0.5 AB=CD Pattern) - Chapter 5.
BAMM juga boleh digunakan untuk Harmonic Pattern lain dengan bantuan RSI Divergence, menjadi RSI BAMM - Chapter 6.
FAQ
1. Credits / Kredit
Scott M Carney,
Scott M Carney, Harmonic Trading: Volume Two (Chapter 5 & Chapter 6)
Bullish XAB=CD BAMM Breakout - Page 144
Bearish XAB=CD BAMM Breakdown - Page 148
Bullish AB=CD BAMM Breakout - Page 153
Bearish AB=CD BAMM Breakdown - Page 156
2. Code Usage / Penggunaan Kod
Free to use for personal usage but credits are most welcomed especially for credits to Scott M Carney.
Bebas untuk kegunaan peribadi tetapi kredit adalah amat dialu-alukan terutamanya kredit kepada Scott M Carney.
2.0 AB=CD Pattern
XAB=CD Bat Pattern
Normalized Quantitative Qualitative Estimation nQQENormalized version of Quantitative Qualitative Estimation QQE:
Normalized QQE tries to overcome the problems of false signals due to RSI divergences on the original QQE indicator.
The main purpose is to determine and ride the trend as far as possible.
So users can identify:
UPTREND : when nQQE Histogram is GREEN (nQQE is above 10)
DOWNTREND : when nQQE Histogram is RED (nQQE is below -10)
SIDEWAYS: when nQQE Histogram is YELLOW (nQQE is between -10 and 10)
Calculation is very simple;
RSI based QQE oscillates between 0-100
nQQE is simply calculated as:
nQQE=QQE-50
to make the indicator fluctuate around 0 level to get more accurate signals.
Various alarms added.
Kıvanç Özbilgiç
RSI Exit + BB-RSI Combo📊 RSI Exit + BB-RSI Combo Indicator
This indicator combines RSI overbought/oversold exit signals with Bollinger Band re-entry conditions to highlight potential reversal or retracement zones.
1️⃣ RSI Exit Signal
- When RSI drops below 70 after being overbought → 🔴 "RSI" label
- When RSI rises above 30 after being oversold → 🟢 "RSI" label
- Works on 15m / 30m / 1h / 4h / 1D timeframes
2️⃣ BB-RSI Combo Signal
- When an RSI divergence forms and
- The candle body re-enters the Bollinger Band on 1H+ timeframe
→ Combo signal (💎 diamond) is shown
💡 How to Use
- Use RSI exit signals to spot overextension corrections
- Use combo signals to identify high-probability reversal or rebound setups
- Suitable for both swing and short-term trading
VWAP Predictive Breakout + RSI + OB + Trend/Chop📈 VWAP Predictive Breakout + RSI + Order Blocks + Trend/Chop Filter
This multi-layered day trading and scalping tool is designed to predict price direction after a VWAP breakout, rather than react to it. It combines volume, RSI, candlestick structure, order blocks, and trend/chop analysis to improve the accuracy of intraday signals.
🔍 Core Features
VWAP Predictive Breakout
Signals are generated when price breaks above/below VWAP with strength (volume spike + strong candle body), supported by trend confirmation.
RSI Momentum Filter
Uses RSI divergence behavior to validate breakouts, filtering out weak or exhausted moves.
Order Block Detection
Marks bullish and bearish engulfing patterns and checks for proximity to these zones as confirmation for breakouts.
Trend vs Chop Detection
Uses ADX, ATR, EMA distance, Bollinger Band width, and candlestick cleanliness to dynamically identify whether the market is trending or choppy.
Clean Candle Behavior
Filters out noisy or indecisive candles by analyzing wick-to-body ratio and ATR-based body size.
📌 Visual Markers
🟢 Buy Signal: Green triangle below bar
🔴 Sell Signal: Red triangle above bar
🟢⚪ Bullish Order Block: Green circle
🔴⚪ Bearish Order Block: Red circle
🟩 Trending Background: Light green
🟥 Choppy Background: Light red
🛎 Alerts Included
Long signal: VWAP breakout + RSI + Order Block + Clean Candle
Short signal: VWAP breakdown + RSI + Order Block + Clean Candle
🧠 Best Use Cases
Scalping high-probability VWAP reversals or continuations
Day trading in markets where trend clarity is critical
Filtering noise in sideways conditions using real-time chop detection
ScalpSwing Pro SetupScript Overview
This script is a multi-tool setup designed for both scalping (1m–5m) and swing trading (1H–4H–Daily). It combines the power of trend-following , momentum , and mean-reversion tools:
What’s Included in the Script
1. EMA Indicators (20, 50, 200)
- EMA 20 (blue) : Short-term trend
- EMA 50 (orange) : Medium-term trend
- EMA 200 (red) : Long-term trend
- Use:
- EMA 20 crossing above 50 → bullish trend
- EMA 20 crossing below 50 → bearish trend
- Price above 200 EMA = uptrend bias
2. VWAP (Volume Weighted Average Price)
- Shows the average price weighted by volume
- Best used in intraday (1m to 15m timeframes)
- Use:
- Price bouncing from VWAP = reversion trade
- Price far from VWAP = likely pullback incoming
3. RSI (14) + Key Levels
- Shows momentum and overbought/oversold zones
- Levels:
- 70 = Overbought (potential sell)
- 30 = Oversold (potential buy)
- 50 = Trend confirmation
- Use:
- RSI 30–50 in uptrend = dip buying zone
- RSI 70–50 in downtrend = pullback selling zone
4. MACD Crossovers
- Standard MACD with histogram & cross alerts
- Shows trend momentum shifts
- Green triangle = Bullish MACD crossover
- Red triangle = Bearish MACD crossover
- Use:
- Confirm swing trades with MACD crossover
- Combine with RSI divergence
5. Buy & Sell Signal Logic
BUY SIGNAL triggers when:
- EMA 20 crosses above EMA 50
- RSI is between 50 and 70 (momentum bullish, not overbought)
SELL SIGNAL triggers when:
- EMA 20 crosses below EMA 50
- RSI is between 30 and 50 (bearish momentum, not oversold)
These signals appear as:
- BUY : Green label below the candle
- SELL : Red label above the candle
How to Trade with It
For Scalping (1m–5m) :
- Focus on EMA crosses near VWAP
- Confirm with RSI between 50–70 (buy) or 50–30 (sell)
- Use MACD triangle as added confluence
For Swing (1H–4H–Daily) :
- Look for EMA 20–50 cross + price above EMA 200
- Confirm trend with MACD and RSI
- Trade breakout or pullback depending on structure
Stochastic RSI OHLC StrategyThe script titled "Stochastic RSI High Low Close Bars" is a versatile trading strategy implemented in Pine Script, designed for TradingView. Here's an overview of its features:
Description
This strategy leverages the Stochastic RSI to determine entry and exit signals in the market, focusing on high, low, and close values of the indicator. It incorporates various trading styles, stop-loss mechanisms, and multi-timeframe analysis to adapt to different market conditions.
Key Features
Stochastic RSI Analysis:
Uses the Stochastic RSI to identify potential entry points for long and short positions.
Tracks high, low, and close values for more granular analysis.
Multiple Trading Styles:
Supports diverse trading styles like Volume Color Swing, RSI Divergence, RSI Pullback, and more.
Allows switching between these styles to suit market dynamics.
Session-Based Trading:
Offers session control, limiting trades to specific hours (e.g., NY sessions).
Can close all positions at the end of the trading day.
Stop-Loss and Take-Profit Mechanisms:
Includes both static and dynamic stop-losses, with options for time-based stops, trailing stops, and momentum-based exits.
Customizable take-profit levels ensure efficient trade management.
Volume Analysis:
Integrates volume indicators to add a bias for trade entries and exits, enhancing signal reliability.
Multi-Timeframe Integration:
Employs multi-timeframe RSI analysis, allowing the strategy to capture broader trends and optimize entries.
This script is designed to provide flexibility and adaptability, making it useful for different trading strategies and market conditions. It is suitable for traders looking to refine their entries and exits with a focus on the Stochastic RSI.
RSI Multi Strategies With Overlay SignalsHello everyone,
In this indicator, you will find 6 different entry and exit signals based on the RSI :
Entry into overbought and oversold zones
Exit from overbought and oversold zones
Crossing the 50 level
RSI cross RSI MA below or above the 50 level
RSI cross RSI MA in the overbought or oversold zones
RSI Divergence
With the signals identified, you can create your own strategy . (If you have any suggestions, please mention them in the comments).
Beyond these signals, you can set SL (Stop Loss) and TP (Take Profit) levels to better manage your positions.
SL Methods:
Percentage: The stop loss is determined by the percentage you specify.
ATR : The stop level is determined based on the Average True Range (ATR).
TP Methods:
Percentage: The take profit is determined by the percentage you specify.
RR ( Risk Reward ): The take profit level is determined based on the distance from the stop level.
You can mix and match these options as you like.
What makes the indicator unique and effective is its ability to display the RSI in the bottom chart and the signals, SL (Stop Loss), and TP (Take Profit) levels in the overlay chart simultaneously. This feature allows you to manage your trading quickly and easily without the need for using two separate indicators.
Let's try out a few strategies together.
My entry signal: RSI Entered OS (Oversold) Zone
My exit signal: RSI Entered OB (Overbought) Zone
I'm not using a stoploss for this strategy ("Fortune favors the brave").
Let's keep ourselves safe by adding a stop loss.
I'm adding an ATR-based stop loss.
I think it's better now.
If you have any questions or suggestions about the indicator, you can contact me.
Cheers
BUY/SELL RSI FLIUX v1.0The "BUY/SELL RSI FLUX v1.0" indicator is designed to provide buy and sell signals based on the RSI (Relative Strength Index) and price action in relation to support and resistance levels. It overlays directly on the price chart and includes the following components:
- Support and Resistance Levels: Determined over a specified number of bars (lengthSR), these levels represent potential barriers where price action may stall or reverse.
- ATR (Average True Range): Used to measure market volatility. While it's calculated in the script, it's not visualized on the chart as per the latest modification.
- RSI: The RSI is calculated over a defined period (lengthRSI) and is used to identify overbought or oversold conditions. Buy signals are generated when the RSI is below the oversold threshold (rsiOversold) and the price is above the support level. Conversely, sell signals occur when the RSI is above the overbought threshold (rsiOverbought), the price is below the resistance level, and additionally, the price is below a long-term moving average, which acts as a trend filter.
- Long-Term Moving Average: This moving average is plotted to help identify the prevailing market trend. Sell signals are filtered based on the price's position in relation to this moving average.
- Buy/Sell Signals: Visual representations in the form of shapes are plotted below (for buy) or above (for sell) the price bars to indicate potential entry points.
By combining these elements, the indicator aims to provide high-probability trading signals that align with both the market's momentum and trend.
TDMACD Divergence Multi Timeframe and Alert [5ema]I reused some functions, made by (i believe that):
@paaax: The table position function.
@everget: The RSI divergence function.
@QuantNomad: The function calculated value and array to show on table for input symbols.
@ChaosTrader: The function calculated value TDMACD.
-----
What to do?
MACD divergence signal.
The crossing of MACD and Signal line.
The reversal of MACD.
The reversal of Signal line.
The screener follow 6 different timeframes.
Set notification alert when signal appears.
-----
How is it created?
MACD line = fastMA - slowMA.
Signal line = ta.ema(macd(), signalLength)
Make function for pivot low & high point of MACD and price.
Request.security that function for earch time frame.
-----
How to use?
Can be combined with many other indicators or candlestick patterns.
Customize the input indicators to suit your strategy
1. MACD reversed:
2. Signal line reversed:
3. MACD Divergence :
4. MACD crossing Signal line:
5. Signal on Screener for multi time frame:
Green ⦿: Buy.
Red ⦿: Sell.
Green 〇: Review Buy.
Red 〇: Review Sell.
-----
This indicator is for reference only, you need your own method and strategy.
If you have any questions, please let me know in the comments.
TIGER ALERT RSI DIVThats our first RSI DIV indicator for free use.
What is an RSI divergence?
What Is the Relative Strength Index (RSI)?
The relative strength index (RSI) is a momentum indicator used in technical analysis.
RSI measures the speed and magnitude of a security's recent price changes to evaluate overvalued or undervalued conditions in the price of that security.
The RSI can do more than point to overbought and oversold securities. It can also indicate securities that may be primed for a trend reversal or corrective pullback in price. It can signal when to buy and sell. T
raditionally, an RSI reading of 70 or above indicates an overbought situation. A reading of 30 or below indicates an oversold condition.
Open Interest Divergence (OI vs Price)This indicator show having increasing Open Interest but price still move in a range (Open Interest Divergence vs price).
It is same with Divergence of indicators as RSI Divergence, Macd Divergence, .... It is easy to understand.
Additional, with MA line OI, you can see the change of OI.
Favorite Signals w/EMA FilterThe script combines my favorite signals then filters them with three EMAs.
Via the Style tab, you can choose to either have the signals color the bar and/or plot a shape above/below.
All signals can be turned off via the Inputs tab, which will remove the bar color and/or shape (if not already off in the Style tab) as well as remove the pattern from the alerts function.
Remember when using TV alerts, if you change the script settngs, you must create a new alert if you wish to be alerted for the changes you've made.
LONG/SHORT SIGNALS INCLUDED FOR:
- TD8s
- TD9s
- Hammer
- Shooting Star
- Bullish Harami
- Bearish Harami
- RSI Divergences
EMA FILTER LOGIC LONGS:
- Price < Fast EMA & Med EMA > Slow EMA = Possible Long Entry
- Price > Fast EMA & Med EMA > Slow EMA = Possible Reversal, Tighten Stop or Reduce Position
EMA FILTER LOGIC SHORTS:
- Price > Fast EMA & Med EMA < Slow EMA = Possible Short Entry
- Price < Fast EMA & Med EMA < Slow EMA = Possible Reversal, Tighten Stop/Reduce Position
Big up to @spdoinkal, @HPotter, @LonesomeTheBlue, for writing the originals scripts for the signals above.
Enjoy!
Rain On Me IndicatorFinally, we made it :D
Rain On Me Indicator, As the name suggests this indicator will make money rain on you. More seriously, this indicator contains :
This indicator contains:
-Bullish and bearish RSI divergences showing on chart with alerts.
-Parabolic SAR with Labels on chart with buying or selling alerts.
-3 Moving Average (MA 1 : 7, MA 2 : 21 MA 3 HIDDEN : 50 (Cross alerts for Pullback)
-Customizable Bollinger band
-Fibonacci on 10 levels with the level 0 to the middle. This Fibonacci help a lot since it can let you find easily entry/exit point, trend and even where to place your Take Profit and Stop Loss. It have alerts for most important levels (0.382, 0.§, 0.618) for Crossunder and Crossover in Bullish or Bearish trend.
-Fully Customizable Ichimoku Cloud.
-Trend Buy/Sell Labels on chart with buying or selling signal alerts.
-Trend color visible on candles.
If an alert trigger of Buy/Sell Signal with the same alert based on PSAR, so you can be confident to enter in position. Alway checking fibs level that is the key thing with this indicator. the script has been set to have the best possible results on as many market as possible. But.best result for zfter backtesting is on
Forex : EUR/USD, USDJPY, USDCAD.
Indice : S&P500, NASDAQ, DOWJONES
Commodities : OIL, WTI
Everything work on following timeframe :
15MN, 1H, 4H, DAILY, WEEKLY.
So that you can avoid having to set it again, whether it be in minutes, hours, days, months.
So you can easily trade in the mode that suits you best. It works well on everything from indices to forex to commodities etc. I thank all those who allowed me to carry out this project. IF you feelt free to give your ideas, suggestions, for improve it by sending me messages.
This is really a first version sp it may contain bugs / errors that will be fixed over time.
A BIG THANK YOU TO QUANTNOMAD WHO GIVE ME HIS PERMISSION TO USE, MODIFY AND REPUBLISH HIS "Ultimate Pivot Points Alerts" Script Indicator :
Good trade to all !
RSI Swing SignalThis indicator is a tool designed to be used with Steven Hart's RSI Exhaustion strategy. For more information google TheTradingChannel or look him up on YouTube :)
The default RSI settings for this strategy are:
RSI Overbought: 80
RSI Oversold: 20
Length: 7
When the RSI gets above 80, the line will turn red and the script will begin looking for a specific type of engulfing candle to go short. The same is true when the RSI gets below 20, but the line will turn green and look for longs. It is best used as a back-testing aid, but it can also be used to send emails or SMS alerts whenever the conditions are met. It can also be used as an alternative colored RSI indicator by removing the signals in the settings menu and changing the RSI parameters to whatever you normally use. This can aid in RSI divergence and overbought/sold strategies.
Entries:
The bright green and bright red lines represent the first type of engulfing candle.
The dark green and red lines represent the second type of engulfing candle.
Some pairs perform best with only one of these entries, while others work fine with both.
This is a counter-trend or consolidation strategy, and is best used in combination with trend-continuation or trend-following strategies. As always, make sure you back-test it before you use it to trade as it works better on some pairs than others.
CDC Action Zone V.2CDC Actionzone V2 is a simple 2MA system with small modification.
There are 4 Action Zones:
Green : Buy
Red : Sell
Blue : Prebuy - use with other indicators (eg. RSI Divergence) to comfirm.
Yellow : Presell - use with other indicators (eg. RSI Divergence) to comfirm.
Buy signalafter presell can be used for pyramiding in an vice-versa.
LX Rsi Divergence BarsThis script colours the bars when they are below or boyond a specified RSI threshold


