CVD Absorption + Confirmation [Orderflow & Volume]This indicator detects bullish and bearish absorption setups by combining Cumulative Volume Delta (CVD) with price action, candlestick, and volume confirmations.
🔹 What is Absorption?
Absorption happens when aggressive buyers/sellers push CVD to new highs or lows, but price fails to follow through.
Bearish absorption: CVD makes a higher high, but price does not.
Bullish absorption: CVD makes a lower low, but price does not.
This often signals that limit orders are absorbing aggressive market orders, creating potential reversal points.
🔹 Confirmation Patterns
Absorption signals are only shown if they are validated by one of the following patterns:
Engulfing candle with low volume → reversal faces little resistance.
Engulfing candle with high volume → strong aggressive participation.
Pin bar with high volume → absorption visible in the wick.
CVD flattening / slope reversal → shift in aggressive order flow.
🔹 Signals
✅ Bullish absorption confirmed → Green label below the bar.
❌ Bearish absorption confirmed → Red label above the bar.
Each label represents a potential reversal setup after orderflow absorption is validated.
🔹 Alerts
Built-in alerts are included for both bullish and bearish confirmations, so you can track setups in real-time without watching the chart 24/7.
📌 How to Use:
Best applied at key levels (supply/demand, VWAP, OR, liquidity zones).
Look for confluence with your trading strategy before taking entries.
Works on all markets and timeframes where volume is reliable.
Pesquisar nos scripts por "reversal"

CHoCH Reversal Hunter🔥 CHoCH Reversal Hunter — Detect Bearish CHoCH Patterns & Fibonacci Golden Zone For Precision Reversal Setups
📈 Overview
CHoCH Reversal Hunter is a Pine Script™ indicator for structured bearish market analysis.
It combines major/minor pivot detection, Change of Character (CHoCH) filtering, and logarithmic Fibonacci retracements into one framework.
The goal: identify Small LL → CHoCH → Golden Zone setups with higher precision.
🧠 Core Logic
1. 📊 Market Structure Backbone
Tracks the 4 most recent major highs (H0–H3) and 3 major lows.
These pivots form the basis for trend evaluation.
2. 🔻 Bearish Background Conditions
A bearish market context is confirmed when:
// Bearish Background Condition
isBearish = (High 3 < High 2) and (
(High 2 > High 1 and High 2 < High 0) or
(High 2 <= High 1)
)
// Reset to neutral if High 2 < High 3
This ensures that only a true lower-high structure activates the bearish framework.
3. 🎯 Hunt for Small Lower Low (LL)
Monitors minor pivot lows with a smaller lookback period.
A valid Small LL must break below the third major low (Low 2).
This Small LL becomes the 0% Fibonacci anchor.
4. 🔄 Change of Character (CHoCH) Selection
The indicator scans recent bars for three possible CHoCH patterns:
// CHoCH Type Definitions in CHoCH Hunter
// Inside → current bar inside previous bar
isInsideBar = high < high and low > low
// Smarty → short-term reversal clue
isSmartyBar = low > low and low < low
// Pivot → minor swing high (small swing detection)
isSmallPivotHigh = ta.pivothigh(high, small_swing_period, small_swing_period)
Filter rules for validity:
CHoCH must occur before the Small LL bar.
Its high must be greater than the Small LL bar’s high (dominance criterion).
5. ⚡ Confirmation & Fibonacci Activation
Once price crosses above the selected CHoCH → setup confirmed.
Fibonacci retracements (logarithmic scale) are calculated:
100% → current high (dynamic, updates before breach).
65% → Golden Zone upper boundary.
50% → Golden Zone lower boundary.
0% → Small LL anchor.
6. 📈 Dynamic Management & Reset Rules
Before 50% breach → Fibo High auto-updates with new highs.
After breach → Levels freeze.
Setup resets if:
Price drops below Small LL.
Price breaks beyond frozen levels.
New Small LL formation detected.
✨ Key Features
📍 Automatic detection of major & minor pivots.
🔍 Clear definitions for Inside, Smarty, Pivot CHoCHs.
📐 Logarithmic Fibonacci retracements for exponential markets.
🎯 Golden Zone highlighting (50%–65%).
🔄 Built-in reset logic to invalidate weak setups.
🎨 Visualization
Pivot markers for Major (📕) & Minor (📘) swings.
Labels for CHoCH points with type (“Inside”, “Smarty”, “Pivot”).
Golden Zone highlighted between 50%–65%.
Optional structure labels for clarity.
⚙️ Inputs & Customization
Major Structure Period (default: 4) — sensitivity for big swings.
Minor Structure Period (default: 2) — sensitivity for small swings.
Toggle display of pivots, structure labels, and Golden Zone.
📚 Educational Value
CHoCH Reversal Hunter is designed to help traders learn:
How bearish structures are objectively defined.
Different CHoCH types and how to filter them.
Applying Fibonacci retracements in structured setups.
⚠️ Risk Disclaimer
🚨 This indicator is for educational purposes only and does not constitute financial advice.
Trading involves significant risk — always backtest and apply sound risk management.
🆕 Release Notes v1.0
Bearish structure detection logic added.
CHoCH type classification (Inside, Smarty, Pivot).
Logarithmic Fibonacci retracement with Golden Zone.
Automatic reset & invalidation rules.
💡 Pro Tip: Watch for the sequence Bearish Background → Small LL → CHoCH → Golden Zone — this is the core hunting pattern of CHoCH Reversal Hunter.

Volatility Wick Trap — Smart Reversal EngineThe Volatility Wick Trap — Smart Reversal Engine is a precision reversal detection tool designed for traders who rely on smart money footprints, volatility compression, and liquidity wick exhaustion to time entries near market turns.
💡 Core Components:
Volatility Squeeze Detection: Identifies candles where range compresses significantly compared to the 14-period average true range, highlighting potential breakout zones.
Liquidity Wick Exhaustion: Detects candles with dominant upper or lower wicks, signaling failed liquidity grabs or stop hunts.
Contextual EMA Filter: Uses a 21-period EMA to filter signals, improving accuracy by aligning with market structure bias.
🔍 How It Works:
Green diamond lines mark bullish hidden reversal zones.
Red diamond lines mark bearish hidden reversal traps.
These lines only appear when volatility compresses and wick traps are confirmed within the trend context.
✅ Clean. Minimal. Tactical.
Ideal for scalpers, swing traders, and smart money enthusiasts looking to fade emotional price spikes.

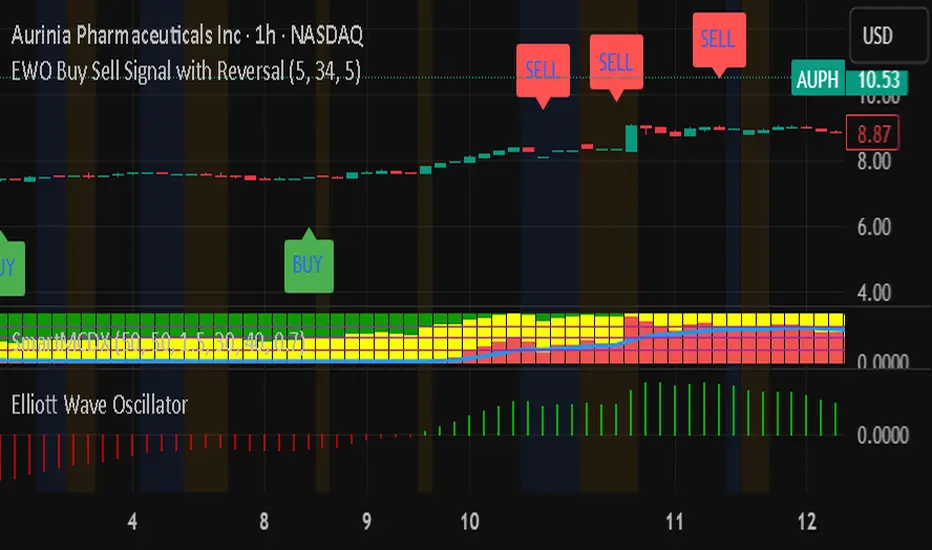
EWO Buy Sell Signal with ReversalEWO Buy Sell Signal with Reversal EWO Buy Sell Signal with Reversal EWO Buy Sell Signal with Reversal EWO Buy Sell Signal with Reversal
WT + Stoch RSI Reversal Combo📊MR.Z RSI : WT + Stochastic RSI Reversal Combo
This custom indicator combines WaveTrend oscillator and Stochastic RSI to detect high-confidence market reversal points, filtering signals so they only appear when both indicators align.
🔍 Core Components:
✅ WaveTrend Oscillator
Based on smoothed deviation from EMA (similar to TCI logic)
Plots:
WT1 (main line)
WT2 (signal line = SMA of WT1)
Uses overbought/oversold thresholds (default: ±53) to filter signals
✅ Stochastic RSI
Momentum oscillator based on RSI's stochastic value
Plots:
%K: smoothed Stoch of RSI
%D: smoothed version of %K
Adjustable oversold/overbought thresholds (default: 20/80)
🔁 Combined Reversal Signal Logic:
🔼 Buy Signal
WT1 crosses above WT2 below WT oversold level (e.g., -53)
%K crosses above %D below Stoch RSI oversold level (e.g., 20)
🔽 Sell Signal
WT1 crosses below WT2 above WT overbought level (e.g., 53)
%K crosses below %D above Stoch RSI overbought level (e.g., 80)
🔔 Signals are only plotted and alerted if both conditions are true.
📌 Features:
Toggle on/off:
WaveTrend lines and histogram
Stochastic RSI
Combined Buy/Sell signals
Horizontal reference lines (±100, OB/OS)
Fully customizable smoothing lengths and thresholds
Signal plots:
✅ Green up-triangle = Combo Buy
✅ Red down-triangle = Combo Sell
Optional: Circle/cross markers for WT-only and Stoch-only signals
🔔 Built-in alerts for Buy/Sell signals
📈 Use Cases:
Reversal Trading: Wait for both indicators to confirm momentum shift
Entry Filter: Use in combination with trend indicators (like EMA)
Scalping or Swing: Works on intraday and higher timeframes

Stochastic Z-Score [AlgoAlpha]🟠 OVERVIEW
This indicator is a custom-built oscillator called the Stochastic Z-Score , which blends a volatility-normalized Z-Score with stochastic principles and smooths it using a Hull Moving Average (HMA). It transforms raw price deviations into a normalized momentum structure, then processes that through a stochastic function to better identify extreme moves. A secondary long-term momentum component is also included using an ALMA smoother. The result is a responsive oscillator that reacts to sharp imbalances while remaining stable in sideways conditions. Colored histograms, dynamic oscillator bands, and reversal labels help users visually assess shifts in momentum and identify potential turning points.
🟠 CONCEPTS
The Z-Score is calculated by comparing price to its mean and dividing by its standard deviation—this normalizes movement and highlights how far current price has stretched from typical values. This Z-Score is then passed through a stochastic function, which further refines the signal into a bounded range for easier interpretation. To reduce noise, a Hull Moving Average is applied. A separate long-term trend filter based on the ALMA of the Z-Score helps determine broader context, filtering out short-term traps. Zones are mapped with thresholds at ±2 and ±2.5 to distinguish regular momentum from extreme exhaustion. The tool is built to adapt across timeframes and assets.
🟠 FEATURES
Z-Score histogram with gradient color to visualize deviation intensity (optional toggle).
Primary oscillator line (smoothed stochastic Z-Score) with adaptive coloring based on momentum direction.
Dynamic bands at ±2 and ±2.5 to represent regular vs extreme momentum zones.
Long-term momentum line (ALMA) with contextual coloring to separate trend phases.
Automatic reversal markers when short-term crosses occur at extremes with supporting long-term momentum.
Built-in alerts for oscillator direction changes, zero-line crosses, overbought/oversold entries, and trend confirmation.
🟠 USAGE
Use this script to track momentum shifts and identify potential reversal areas. When the oscillator is rising and crosses above the previous value—especially from deeply negative zones (below -2)—and the ALMA is also above zero, this suggests bullish reversal conditions. The opposite holds for bearish setups. Reversal labels ("▲" and "▼") appear only when both short- and long-term conditions align. The ±2 and ±2.5 thresholds act as momentum warning zones; values inside are typical trends, while those beyond suggest exhaustion or extremes. Adjust the length input to match the asset’s volatility. Enable the histogram to explore underlying raw Z-Score movements. Alerts can be configured to notify key changes in momentum or zone entries.

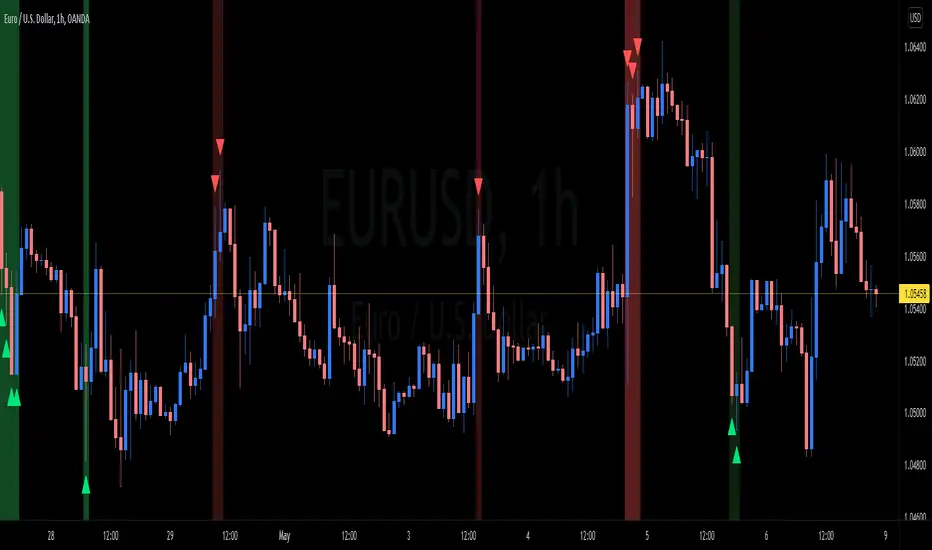
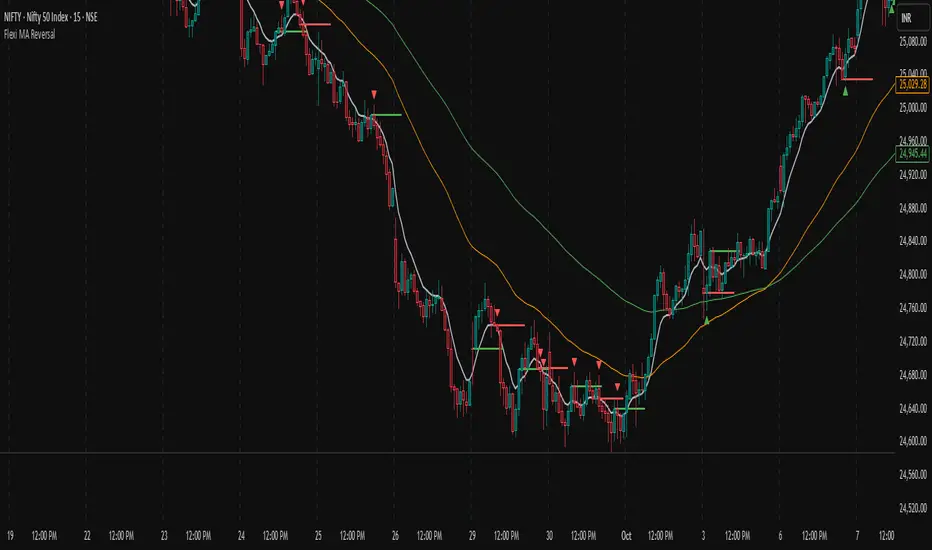
Flexi MA Reversal🔹 FlexiMA Reversal – Customizable MA-Based Reversal Indicator
FlexiMA Reversal is a real-time, moving average-based reversal indicator designed to highlight potential market turning points using signal and alert lines. It provides visual cues for both early alerts and confirmed entry signals on candle close.
🔧 Key Features:
Customizable Moving Average Type: Choose from EMA, SMA, WMA, or VWMA (default is EMA).
Flexible MA Inputs: Configure up to three MAs (commonly used 5, 50, and 200).
Toggle Visibility: Enable or disable each MA line as needed.
Real-Time Alert System:
Thin alert lines appear when a potential reversal is detected.
Thicker signal lines confirm the reversal when price closes beyond the alert level.
Optional Visual Styling:
Choose custom colors for each MA, signal, and alert line.
Alert candles are automatically colored to match the corresponding alert line.
Option to show only signal lines for cleaner charts.
Customizable projection length for both alert and signal lines.
📈 Strategy Logic:
This indicator is designed to detect reversal opportunities based on the relationship between price and a selected short-term moving average.
Bullish Setup:
Price closes below the selected MA (e.g., EMA 5).
A bullish alert line is drawn at the high.
If a subsequent candle closes above the alert line and the MA, a bullish signal line is plotted.
Bearish Setup:
Price closes above the selected MA.
A bearish alert line is drawn at the low.
If a subsequent candle closes below the alert line and the MA, a bearish signal line is plotted.
This approach attempts to capture quick market shifts where short-term momentum reverses direction near key MA levels.
🎯 How to Use:
Although originally developed using the 5 EMA strategy, through testing it was found that using 6, 7, or 8 EMA offers even better signal quality.
To add broader trend context, 50 MA and 200 MA lines are included and can be toggled on/off based on your strategy preference.
🔍 Trend Filtering & Re-Entry Tips:
Due to the nature of shorter moving averages, reversal signals may appear frequently. For better trend alignment:
Use the 50 MA as a trend filter:
❌ Ignore bearish signals when price is above 50 MA
❌ Ignore bullish signals when price is below 50 MA
Alternatively, filtered-out signals can be used for re-entry within the trend:
For example, if you receive a bearish alert and signal above the 50 MA, and the next candle closes back above the bearish alert line, this may be interpreted as a bullish re-entry opportunity into the prevailing uptrend.
🛠️ Styling Tips:
You can disable alert candle coloring in the Style tab of the indicator settings.
Use the "Show Only Signal Lines" checkbox to keep the chart minimalistic while still tracking confirmed entries.
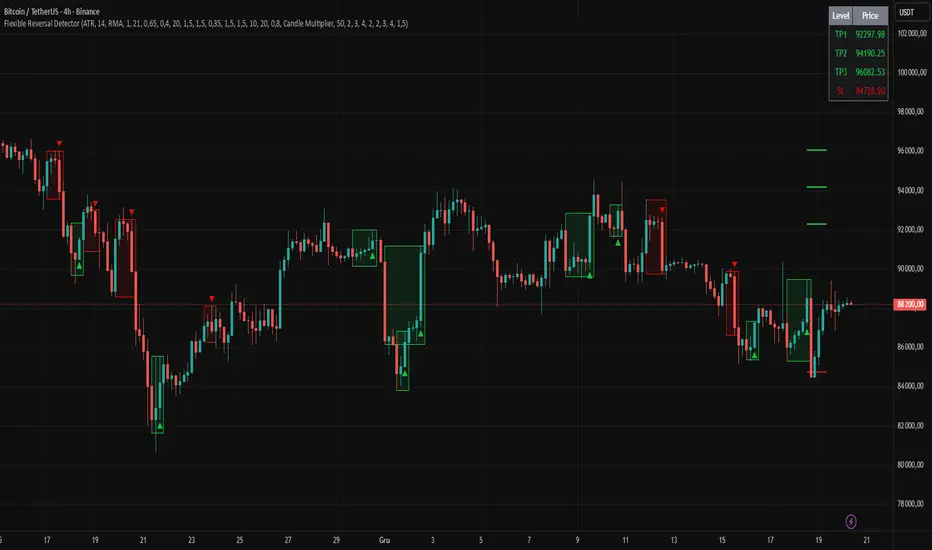
Flexible Reversal DetectorFlexible Reversal Detector
An advanced, fully customizable analytical tool designed to identify local trend reversal zones based on candlestick formations. Users have full control over all logic parameters, making it adaptable to different trading styles and preferences.
Key Features
Adjustable maximum pattern length (number of candles)
Customizable body size ratios for initial, middle, and final candles
Configurable minimum price movement (in %) required before a pattern is considered valid
Colored horizontal lines showing the full length of the pattern – helpful in identifying structure, potential support/resistance zones
Optional volume filter – the volume of the final candle is compared to a volume SMA; multiplier can be adjusted (e.g. 1 = equal to average, 0.8 = 80% of average)
Logic Overview
U Pattern
Each bearish candle is treated as a potential start of a reversal pattern.
Subsequent candles, if small enough and within defined thresholds, form the middle part of the structure.
When a bullish candle with a sufficiently large body appears, it is marked as the final candle of the pattern.
The pattern is considered valid if it was preceded by a defined percentage price drop and – optionally – if the volume condition was met.
∩ Pattern
Each bullish candle may act as the initial candle of a potential reversal pattern in the opposite direction.
Following smaller candles form the middle part, as long as they meet the defined criteria.
The appearance of a strong bearish candle marks the end of the formation.
If this pattern is preceded by a certain price increase (and optionally meets the volume filter), it is highlighted on the chart.
Note: On markets with low volatility or on lower timeframes, it is recommended to reduce the percentage thresholds for signal detection. For more dynamic price action or higher timeframes, consider increasing them accordingly.
Visualization
The final candle of the pattern is marked visually on the chart (depending on direction)
Colored horizontal lines indicate the full span of the pattern – from initial to final candle
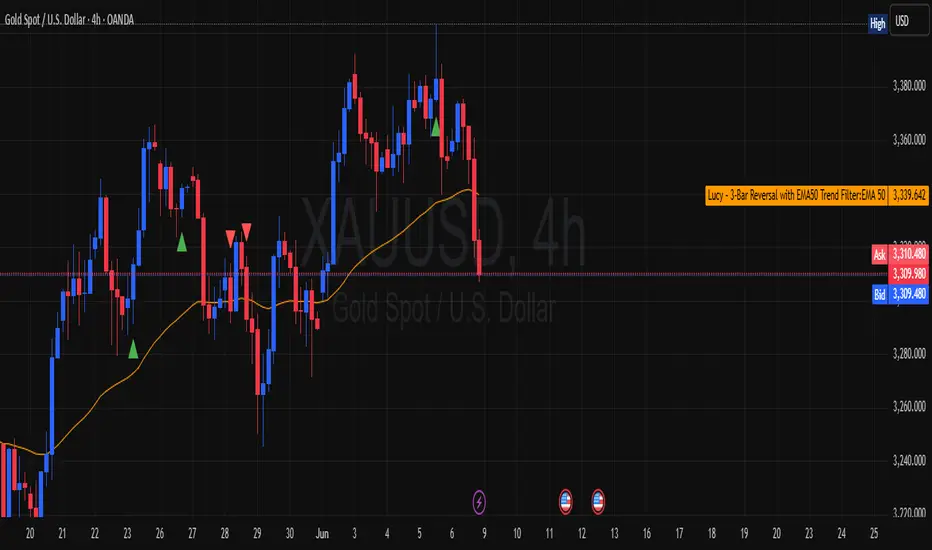
Lucy – 3-Bar Reversal with EMA50 Trend Filter📛 Lucy – 3-Bar Reversal with EMA50 Trend Filter
Purpose:
To detect and highlight bullish and bearish 3-bar reversal patterns on the chart, but only when they align with the dominant trend, defined by the EMA 50.
✅ How It Works
🟢 Bullish 3-Bar Reversal (Buy Setup):
Bar 1 is bearish (close < open)
Bar 2 makes a lower low than Bar 1
Bar 3 is bullish (close > open) and closes above Bar 2’s high
Price must be above EMA 50 (trend filter)
✅ Result: Shows a green triangle below the bar
🔴 Bearish 3-Bar Reversal (Sell Setup):
Bar 1 is bullish (close > open)
Bar 2 makes a higher high than Bar 1
Bar 3 is bearish (close < open) and closes below Bar 2’s low
Price must be below EMA 50
✅ Result: Shows a red triangle above the bar
📊 What It Plots:
🔼 Green triangle below bullish signal bar
🔽 Red triangle above bearish signal bar
🟠 Orange line = EMA50 (trend filter)
🔔 Built-in Alerts:
You’ll get an alert if:
A bullish reversal pattern forms above EMA50
A bearish reversal pattern forms below EMA50
🧠 Use Cases:
Great for trend-following traders who want clean, price-action entries
Works well on intraday (15m/1h) or swing (4h/daily) timeframes
Can be used for manual entries, or converted to strategy for automation
Future Candle Reversal Projection (Mastersinnifty)Overview
This tool identifies potential future market reversal zones by dynamically projecting pivot-based swing patterns forward in time. Unlike traditional ZigZag indicators that only reflect past movements, this indicator anticipates probable future turning points based on historical swing periodicity.
---
Key Features
- Forward Projections: Calculates and projects future swing zones based on detected pivot distances.
- Customizable Detection: Adjust the ZigZag depth for different trading styles (scalping, swing, position).
- Dynamic Updates: Real-time recalibration as new pivots form.
- Clean Visual Markers: Projects reversal estimates as intuitive labels and dotted lines.
---
How it Works
The indicator identifies significant swing highs and lows using a user-defined ZigZag depth setting. It measures the time (bars) and price characteristics of the latest swing movement. Using this pattern, it projects forward estimated reversal points at consistent intervals. Midpoint price levels between the last high and low are used for each future projection.
---
Who Can Benefit
- Intraday and swing traders seeking advanced planning zones.
- Technical analysts relying on pattern periodicity.
- Traders who wish to combine projected reversal markers with their own risk management strategies.
---
Disclaimer
This tool is an analytical and educational utility. It does not predict markets with certainty. Always combine it with your own analysis and risk management. Past behavior does not guarantee future results.

Red & Green Zone ReversalOverview
The “Red & Green Zone Reversal” indicator is designed to visually highlight potential reversal zones on your chart by using a combination of Bollinger Bands and the Relative Strength Index (RSI).
It overlays on the chart and provides background color cues—red for oversold conditions and green for overbought conditions—along with corresponding alert triggers.
Key Components
Overlay: The indicator is set to overlay the chart, meaning its visual cues (colored backgrounds) are drawn directly on the price chart.
Bollinger Bands Calculation
Period: A 20-period simple moving average (SMA) is calculated from the closing prices.
Standard Deviation Multiplier: A multiplier of 2.0 is applied.
Bands Defined:
Basis: The 20-period SMA.
Deviation: Calculated as 2 times the standard deviation over the same period.
Upper Band: Basis plus the deviation.
Lower Band: Basis minus the deviation.
RSI Calculation
Period: The RSI is computed over a 14-period span using the closing prices.
Thresholds:
Oversold Threshold: 30 (used for the red zone condition).
Overbought Threshold: 70 (used for the green zone condition).
Zone Conditions
Red Zone (Oversold):
Criteria: The price is below the lower Bollinger Band and the RSI is below 30.
Purpose: Highlights a situation where the asset may be deeply oversold, signaling a potential reversal to the upside.
Green Zone (Overbought):
Criteria: The price is above the upper Bollinger Band and the RSI is above 70.
Purpose: Indicates that the asset may be overbought, potentially signaling a reversal to the downside.
Visual and Alert Components
Background Coloring:
Red Background: Applied when the red zone condition is met (using a semi-transparent red).
Green Background: Applied when the green zone condition is met (using a semi-transparent green).
Alerts:
Red Alert: An alert condition titled “Deep Oversold Alert” is triggered with the message “Deep Oversold Signal triggered!” when the red zone criteria are satisfied.
Green Alert: Similarly, an alert condition titled “Deep Overbought Alert” is triggered with the message “Deep Overbought Signal triggered!” when the green zone criteria are met.
Important Disclaimers
Not Financial Advice:
This indicator is provided for informational and analytical purposes only. It does not constitute trading advice or a recommendation to buy or sell any asset. Traders should use it as one of several tools in their analysis and should perform their own due diligence.
Risk Management:
Trading inherently involves risk. Past performance is not indicative of future results. Always implement appropriate risk management and use stop losses where necessary.
Summary
In summary, the “Red & Green Zone Reversal” indicator uses Bollinger Bands and RSI to detect extreme market conditions. It visually marks oversold (red) and overbought (green) conditions directly on the chart and offers alert conditions to help traders monitor these potential reversal points.
Enjoy!!

5-0 Harmonic Pattern [TradingFinder] 0XABCD 50 Harmonic Detector🔵 Introduction
Harmonic patterns are a powerful tool in technical analysis, widely used to detect reversal points and trend changes. Among these, the 5-0 Harmonic Pattern stands out due to its reliance on specific Fibonacci ratios—1.13, 1.618, 2.24, and 0.45 to 0.55—anchored at points 0, X, A, B, C, and D. This pattern provides a structured approach for identifying critical buy and sell points, helping traders achieve optimal entry and exit levels in volatile markets.
This 5-0 Harmonic Pattern indicator automatically detects and marks bullish and bearish formations on the chart, offering precise trading signals based on established harmonic ratios. With its dynamic signals, the 5-0 pattern enables traders to anticipate market movements and capitalize on favorable price trends.
Especially in fast-moving markets, harmonic patterns, particularly the 5-0 Harmonic Pattern, equip traders with an essential framework for identifying reversal opportunities and refining their trading strategies.
Bullish 5-0 Pattern :
Bearish 5-0 Pattern :
🔵 How to Use
The 5-0 Harmonic Pattern indicator is designed to automatically mark the key levels of the harmonic structure: 0, X, A, B, C, and D. By doing so, it detects both bullish and bearish patterns and helps traders recognize optimal entry and exit points.
Formed through specific Fibonacci levels, this pattern signals potential shifts in trend direction, giving traders critical insights for managing entries and exits effectively. The tool proves valuable in high-volatility settings, enabling traders to leverage these signals for refined decision-making.
🟣 Bullish 5-0 Pattern
A bullish 5-0 pattern materializes when Fibonacci levels indicate a potential price reversal to the upside. With points 0, X, A, B, C, and D in alignment, the indicator highlights this upward momentum by displaying a green arrow as a buy signal on the chart. This marking provides a clear entry point, indicating that prices are likely to rise, making it a prime moment for traders to enter long positions.
Additionally, the bullish 5-0 pattern is equipped with tools for traders to set stop-loss and take-profit points based on harmonic lines within the pattern, which represent support and resistance levels. Using these dynamic points, traders can create a more effective risk-reward setup while following the bullish signals in a standalone harmonic strategy.
🟣 Bearish 5-0 Pattern
The bearish 5-0 pattern functions similarly but signals a likely downturn. This pattern emerges when Fibonacci ratios align at points 0, X, A, B, C, and D, predicting a reversal downward. The indicator generates a sell signal, marked by a red arrow, prompting traders to exit long positions or initiate short trades to capitalize on falling prices.
Traders can utilize this bearish pattern for defining exit strategies and setting key levels for stop-loss and take-profit orders. The bearish 5-0 pattern enhances traders’ abilities to gauge critical price levels and manage trade risk effectively, especially in volatile markets. For traders focused on profiting from downward trends, this indicator serves as a powerful tool for timely entries and exits.
🔵 Setting
🟣 Logical Setting
ZigZag Pivot Period : You can adjust the period so that the harmonic patterns are adjusted according to the pivot period you want. This factor is the most important parameter in pattern recognition.
Show Valid Forma t: If this parameter is on "On" mode, only patterns will be displayed that they have exact format and no noise can be seen in them. If "Off" is, the patterns displayed that maybe are noisy and do not exactly correspond to the original pattern.
Show Formation Last Pivot Confirm : if Turned on, you can see this ability of patterns when their last pivot is formed. If this feature is off, it will see the patterns as soon as they are formed. The advantage of this option being clear is less formation of fielded patterns, and it is accompanied by the latest pattern seeing and a sharp reduction in reward to risk.
Period of Formation Last Pivot : Using this parameter you can determine that the last pivot is based on Pivot period.
🟣 Genaral Setting
Show : Enter "On" to display the template and "Off" to not display the template.
Color : Enter the desired color to draw the pattern in this parameter.
LineWidth : You can enter the number 1 or numbers higher than one to adjust the thickness of the drawing lines. This number must be an integer and increases with increasing thickness.
LabelSize : You can adjust the size of the labels by using the "size.auto", "size.tiny", "size.smal", "size.normal", "size.large" or "size.huge" entries.
🟣 Alert Setting
Alert : On / Off
Message Frequency : This string parameter defines the announcement frequency. Choices include: "All" (activates the alert every time the function is called), "Once Per Bar" (activates the alert only on the first call within the bar), and "Once Per Bar Close" (the alert is activated only by a call at the last script execution of the real-time bar upon closing). The default setting is "Once per Bar".
Show Alert Time by Time Zone : The date, hour, and minute you receive in alert messages can be based on any time zone you choose. For example, if you want New York time, you should enter "UTC-4". This input is set to the time zone "UTC" by default.
Conclusion
The 5-0 Harmonic Pattern indicator serves as a robust solution for technical analysts and traders looking to pinpoint market reversal points. By automatically recognizing 5-0 patterns and generating buy and sell signals based on Fibonacci ratios, this tool supports precise trend analysis and entry/exit timing. The indicator’s adjustable alerts, color themes, and pattern toggles allow for comprehensive customization, ensuring alignment with individual trading strategies.
Harmonic patterns, especially the 5-0 Harmonic Pattern, guide traders in identifying high-accuracy entry and exit points, thus aiding in more informed trading decisions. By combining Fibonacci ratio analysis with real-time signal updates, this indicator provides a well-rounded approach for risk management and capitalizing on trading opportunities. Professional traders can harness this tool to enhance technical analysis precision and capitalize on price trends effectively, maximizing profitability in both bullish and bearish markets.

Smart Signals Assistant [AlgoAlpha]🟠 OVERVIEW
The Smart Signals Assistant is a comprehensive, all-in-one trading toolkit designed to provide a complete analytical framework on your chart. It is built around a primary signal engine that generates trend and reversal signals, enhanced by a suite of five optional "confluence" indicators that provide deeper market context.
This script is highly modular, allowing you to build a personalized dashboard. You can use the main signals for entries, add a machine-learning classifier to check if the market is trending, overlay dynamic support/resistance clouds, and manage your trades with on-chart take-profit and stop-loss levels. The system is tied together with a powerful, multi-step alert builder that lets you create custom alert conditions from any combination of the script's components.
🟠 CONCEPTS
This indicator is a collection of several distinct systems working together. The combination is designed to allow traders to build a complete strategy—from signal generation to confirmation and trade management—within a single tool. Here are the core concepts behind them:
Smart Signals Engine: This is the heart of the indicator and operates as a hybrid with two distinct modes. The "Swing" mode uses a proprietary model that analyzes price stability and volatility to identify stable, longer-term trends. The "Scalping" mode uses a more responsive machine-laerning trend system that dynamically adapts its parameters based on learned market 'states' to real-time changes in market conditions, making it better suited for faster, lower-timeframe movements.
Fair Value Trail (FVT): This is not a simple moving average. It's a volatility-based trail that helps identify dynamic zones of support and resistance. The concept is to track a "fair value" price, derived by analyzing price levels with significant volume activity, providing logical areas for entries or trailing stop-loss adjustments.
Trend Spine: This component calculates a core trend backbone. Its purpose is to cut through short-term noise and provide a clearer, more stable view of the underlying primary trend direction by filtering out price action during periods of low directional momentum.
Trend Bias: This is a band that measures the strength and weakness of the current price momentum. It visualizes whether bullish or bearish pressure is accelerating or decelerating by comparing recent momentum to its historical average, which is useful for confirming the conviction behind a move.
Firmament Clouds: These are dynamic zones plotted on the chart that act as potential areas of support and resistance. Unlike static lines, these clouds expand and contract based on market volatility, providing an adaptive view of key price zones where the market may be overextended.
Trend-Range Classifier (TRC): This is a machine learning model that analyzes multiple market characteristics (like volatility and momentum patterns) in real-time. It classifies the current market environment as either "trending" or "ranging," helping you decide which strategy to apply and filter signals that are inappropriate for the current conditions.
🟠 FEATURES
Trend & Reversal Signals: Configure the main engine to provide either trend-following signals or potential counter-trend reversal signals. Signals are categorized as "Normal" or "Strong" to indicate conviction.
Advanced Candle Coloring: Choose from multiple candle coloring modes, including static trend colors, a color gradient based on momentum, or a gradient based on volume. Also includes an option to highlight ranging markets with gray candles.
Automated Trade Management: Enable on-chart Take-Profit and Stop-Loss levels that are automatically calculated when a signal appears. These are visualized with colored risk/reward zones.
Component Status Table: A customizable on-chart dashboard that shows the live status, direction, and signal duration for every active component, giving you a complete overview at a glance.
Powerful Multi-Step Alert System: Build highly specific, custom alerts. You can combine dozens of built-in conditions from all components using AND/OR logic across a sequence of up to 7 steps.
External Alert Integration: The alert system can incorporate up to five external sources, allowing you to mix conditions from this script with your other favorite indicators.
🟠 USAGE
This script is designed to be adapted to your personal trading style by combining components to build a complete strategy. The synergy between the components is key to its usefulness. Here is a general workflow:
Initial Configuration: Start by enabling the core "Smart Signals" in the settings. Choose your preferred "Smart Signals Mode" (Swing or Scalping) and "Signal Mode" (Trend or Reversal) based on your strategy and timeframe.
Adding Confluence for Reliability: To increase the reliability of signals, enable one or more confluence tools. For example, a trend trader can enable the "Trend-Range Classifier" and decide to only consider signals that appear when the market is classified as "Trending." You could further enhance this by also enabling the "Fair Value Trail" and only taking buy signals that occur near or above the trail. This demonstrates how combining components filters for higher-quality setups.
Reading the Visuals: A standard "▲" or "▼" represents a normal signal, while a "+▲" or "+▼" indicates a strong signal with higher conviction. Use the candle colors to gauge the momentum within the trend.
Managing Trades: If you enable "Take-Profit Levels" and "Stop-Loss Level," the script will automatically plot these on your chart when a signal appears. This can help you pre-plan your risk and potential targets. The exit signals ("x") can be used as a suggestion for taking partial or full profits.
Setting Up Custom Alerts for High-Probability Setups: For a high-probability setup, navigate to the "Alerts" tab. You can create a sequence that combines multiple components to fire only on your ideal conditions. For instance:
Step 1: "Smart Signals Strong Bullish Signal "
Step 2: "Market Is Trending " AND "FVT In Bullish Trend "
This alert would only trigger when a strong buy signal occurs while the TRC confirms a trend and the price is in a favorable position relative to the Fair Value Trail, effectively filtering out lower-quality signals by demanding agreement between multiple, conceptually different components.
Script pago

Shark Harmonic Pattern [TradingFinder] Shark Detector Indicator🔵 Introduction
The Shark harmonic pattern, first introduced by Scott Carney in 2011, is a recognized tool in technical analysis. Since its inception, it has been widely adopted by traders as an essential market analysis tool.
Due to its complexity, the Shark pattern can be challenging for novice traders. Therefore, we have developed the Harmonic Pattern Indicator to help analysts and traders easily identify these patterns.
🟣 Understanding the Types of Shark Pattern
In technical analysis, the Shark harmonic pattern forms at the end of trends and is categorized into two types: Bullish and Bearish Shark Patterns.
Bullish Shark Pattern : This pattern appears at the end of a downtrend, indicating a potential reversal to an uptrend. Traders can use this pattern to identify buy entry points. The image below illustrates the core components of the Bullish Shark Pattern.
Bearish Shark Pattern : Conversely, the Bearish Shark Pattern forms at the end of an uptrend, signaling a possible reversal to a downtrend. This pattern prompts traders to shift their positions from buying to selling. The image below showcases the characteristics of the Bearish Shark Pattern.
🔵 How to Use
🟣 Trading with the Bullish Shark Pattern
The Bullish Shark Pattern acts as a reversal pattern, helping traders identify the end of a downtrend and the beginning of an uptrend. It consists of five key points that indicate alternating bullish and bearish movements.
Upon the complete formation of this pattern, traders can look for opportunities to enter buy trades. To manage risk effectively, it is advisable to set a stop-loss below the lowest price point within the pattern.
🟣 Trading with the Bearish Shark Pattern
Similarly, the Bearish Shark Pattern functions as a reversal pattern but in the opposite direction. It helps traders identify the end of an uptrend and the onset of a downtrend.
After the pattern fully forms, traders can seek sell entry opportunities. As with the bullish pattern, placing a stop-loss above the highest price point within the pattern is recommended for risk management.
🔵 Setting
🟣 Logical Setting
ZigZag Pivot Period : You can adjust the period so that the harmonic patterns are adjusted according to the pivot period you want. This factor is the most important parameter in pattern recognition.
Show Valid Format : If this parameter is on "On" mode, only patterns will be displayed that they have exact format and no noise can be seen in them. If "Off" is, the patterns displayed that maybe are noisy and do not exactly correspond to the original pattern.
Show Formation Last Pivot Confirm : if Turned on, you can see this ability of patterns when their last pivot is formed. If this feature is off, it will see the patterns as soon as they are formed. The advantage of this option being clear is less formation of fielded patterns, and it is accompanied by the latest pattern seeing and a sharp reduction in reward to risk.
Period of Formation Last Pivot : Using this parameter you can determine that the last pivot is based on Pivot period.
🟣 Genaral Setting
Show : Enter "On" to display the template and "Off" to not display the template.
Color : Enter the desired color to draw the pattern in this parameter.
LineWidth : You can enter the number 1 or numbers higher than one to adjust the thickness of the drawing lines. This number must be an integer and increases with increasing thickness.
LabelSize : You can adjust the size of the labels by using the "size.auto", "size.tiny", "size.smal", "size.normal", "size.large" or "size.huge" entries.
🟣 Alert Setting
Alert : On / Off
Message Frequency : This string parameter defines the announcement frequency. Choices include: "All" (activates the alert every time the function is called), "Once Per Bar" (activates the alert only on the first call within the bar), and "Once Per Bar Close" (the alert is activated only by a call at the last script execution of the real-time bar upon closing). The default setting is "Once per Bar".
Show Alert Time by Time Zone : The date, hour, and minute you receive in alert messages can be based on any time zone you choose. For example, if you want New York time, you should enter "UTC-4". This input is set to the time zone "UTC" by default.
🔵 Conclusion
The Shark harmonic pattern is a potent analytical tool in technical analysis that aids traders in identifying critical reversal points in financial markets. Whether in a bullish or bearish context, this pattern provides clear trend change signals, allowing traders to enter trades with greater precision and optimize their strategies.
However, as with all analytical methods, it is essential to supplement the Shark pattern with additional analyses and strict risk management to avoid potential losses. Incorporating this pattern into a comprehensive trading strategy can lead to better trade outcomes and more opportunities for success

Bearish 3 Bars Reversal PatternThis TradingView Pine Script indicator identifies and highlights a bearish 3-bar reversal pattern on your chart. The script also calculates the percentage difference between the current low and the previous high, displaying this value on the chart when the pattern is detected.
Features:
Pattern Detection:
The script detects a bearish 3-bar reversal pattern when the high of the previous bar is higher than the high of the bar before it, and the current high is lower than the previous high.
Percentage Difference Calculation:
When the pattern is detected, the script calculates the percentage difference between the current low and the previous high. This percentage is displayed on the chart.
Visual Indicators:
When a bearish 3-bar reversal pattern is detected, a label is created on the chart showing the calculated percentage difference. The label is styled with a downward arrow, red color, and white text for clear visibility.
Alerts:
An alert condition is set up to notify users when the bearish 3-bar reversal pattern is detected. This allows traders to take timely action based on the pattern.

Bullish 3 Bars Reversal PatternThis TradingView Pine Script indicator identifies and highlights a bullish 3-bar reversal pattern on your chart. The script also calculates the percentage difference between the current high and the previous low, displaying this value on the chart when the pattern is detected.
Features:
Pattern Detection:
The script detects a bullish 3-bar reversal pattern when the low of the previous bar is lower than the low of the bar before it, and the current low is higher than the previous low.
Percentage Difference Calculation:
When the pattern is detected, the script calculates the percentage difference between the current high and the previous low. This percentage is displayed on the chart.
Visual Indicators:
When a bullish 3-bar reversal pattern is detected, a label is created on the chart showing the calculated percentage difference. The label is styled with an upward arrow, green color, and white text for clear visibility.
Alerts:
An alert condition is set up to notify users when the bullish 3-bar reversal pattern is detected. This allows traders to take timely action based on the pattern.

Three Bar ReversalThis script was written to make it easier to discover three bar reversal patterns.
A three bar reversal occurs when these conditions are met:
Long Setup (Reversal Up)
1. Bar 1 closes down
2. Low of Bar 2 is below the low of Bar 1 and Bar 3
3. Bar 3 closes above the high of both Bar 1 and Bar 2
Short Setup (Reversal Down)
1. Bar 1 closes up
2. High of Bar 2 is above the high of Bar 1 and Bar 3
3. Bar 3 closes below the low of both Bar 1 and Bar 2
When this indicator is added to your chart, you will see "Reversal Up" or "Reversal Down" when one of the above conditions are met.
It is recommended to use the 1 minute time frame for short scalps and 5 minute time frame for longer held day trade positions.
This indicator also has an alert option.
To enable an alert:
1. Create a new alert
2. Set condition "Reversal" and "Any alert() function call"
3. Give the alert a unique name
It is good to have an alert for different tickers and different time frames!
When the alert is triggered, you will receive a message:
Reversal up on: ticker-ID-here
or
Reversal down on: ticker-ID-here
Never miss a trade setup again!

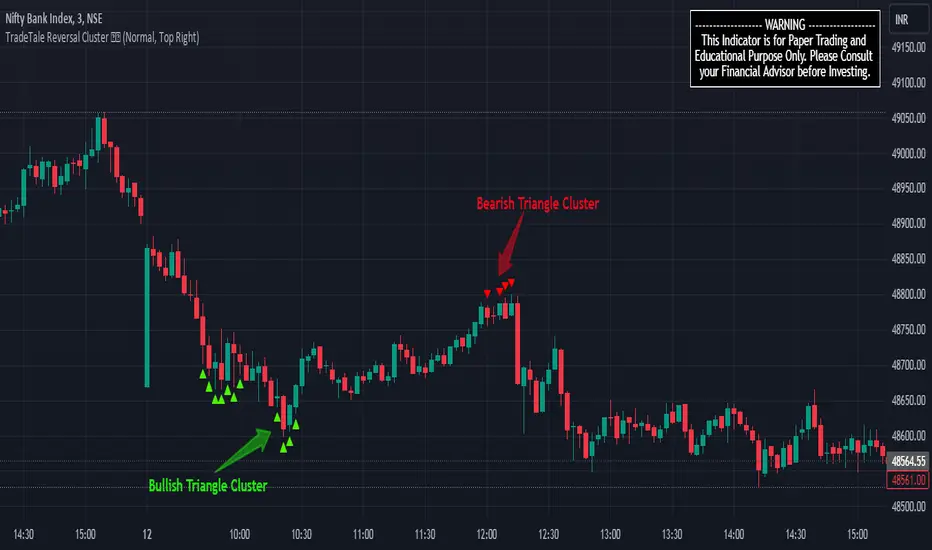
TradeTale Reversal Cluster ▲▼This script explains how an Oscillator along with Moving Average & Deviation can be used to catch "Reversal Points (Highest points above Overbought & Lowest points below Oversold)".
What is an Oscillator:-
An oscillator is a technical analysis tool that constructs high and low bands between two extreme values and then builds a trend indicator that fluctuates within these bounds. Traders use the trend indicator to discover short-term overbought or oversold conditions. An oscillator with MA & Deviation is used along with minor calculations (maths) in this Oscillator for generating Long (Green Triangles) and Short signals (Red Triangles).
Moving Average (MA):-
A moving average (MA) is used in technical analysis, used to help smooth out price data by creating a constantly updated average price. A rising moving average indicates that the security is in an uptrend, while a declining moving average indicates a downtrend.
Standard Deviation:-
It is a statistical measure of the amount of variation or dispersion in a set of values. It is used to measure the volatility of an asset's price. It is used to measure how much the price varies from its average price over a certain period of time. A higher standard deviation indicates that the prices are more spread out from the mean, suggesting higher volatility, while a lower standard deviation indicates more stable prices.
Calculation of Standard Deviation
- Find the average value of the data set.
- Find the difference between each data point and the mean.
- Square each of these differences.
- Find the average of the squared differences.
- Take the square root of the variance.
Logic of this indicator:-
This indicator calculates the average price using the formula (high + low + close * 2)/4.
Moving Average & its standard deviation is calculated over a period of 5.
It calculates an oscillator value using a special formula which includes MA & Deviation with Price Action over a period of 5. after that :-
- It determines the highest points for Bearish Red Triangles (Bearish Reversal) and
- It also determines the lowest points for Bullish Green Triangle (Bullish Reversal).
These Triangle signals are based on the calculations of the oscillator values and their MAs & Deviation, and they aim to identify potential reversal points in the price action, when goes above (Bearish Reversal) and when goes below (Bullish Reversal). An oscillator that fluctuates between zero and 100 makes it easy to use for many traders. Its easy to identify extremes because an Oscillator is range-bound.
"Green Triangles" signal in is Long Signal and also exit Short signal. (Bullish Entry/Bearish Exit)
"Red Triangles" signal is Short Signal and also exit Long signal. (Bearish Entry/Bullish Exit)
Caution:-
But remember that Oscillators works best in range bound market and is less trustworthy in trending markets. (caution)
A new trader need to be cautious because during strong trends in the market/security, An oscillator may remain in overbought or oversold condition for extended periods.
Chart Timeframe:-
This Indicator works on all timeframes.
Traders should set stop loss and take profit levels as per risk reward ratio.
Note:-
Like other technical indicators, This indicator also is not a holy grail. It can only assist you in building a good strategy. You can only succeed with proper position sizing, risk management and following correct trading Psychology (No overtrade, No greed, No revenge trade etc).
THIS INDICATOR IS FOR EDUCATIONAL PURPOSE AND PAPER TRADING ONLY. YOU MAY PAPER TRADE TO GAIN CONFIDENCE AND BUILD FURTHER ON THESE. PLEASE CONSULT YOUR FINANCIAL ADVISOR BEFORE INVESTING. WE ARE NOT SEBI REGISTERED.
Hope you all like it
happy learning.
Trend Change DetectorThe trend change detector oscillator is a tool designed to help traders identify the current trend direction paired with the potential reversal zones.
The oscillator is made of multiple parts:
- The colored histogram, that displays the current long-term trend direction (long if above 0, short if below)
- The trend line, which shows the price in relation to the fair value of the current trend
- The reversal zones, which are the area that alarms the traders that the price might reverse soon after having touched them
The indicator can work with three different inputs. In the Source panel, you can choose between "Price", "Price and Volume" and "Ponderated Volume". The price input uses only the price, the price and volume use the average between the price and the ponderated volume, and the ponderated volume shows the indicator working with volume data, with formulas such as the On Balance Volume and the Accumulation-Distribution line.
This indicator can be used both for trend following technique, using the cross of the trend line with the 0-line as signals in conjunction with the bias given by the histogram, and for mean reversal technique thanks to the reversal zones that allow traders to identify potential tops and bottoms.

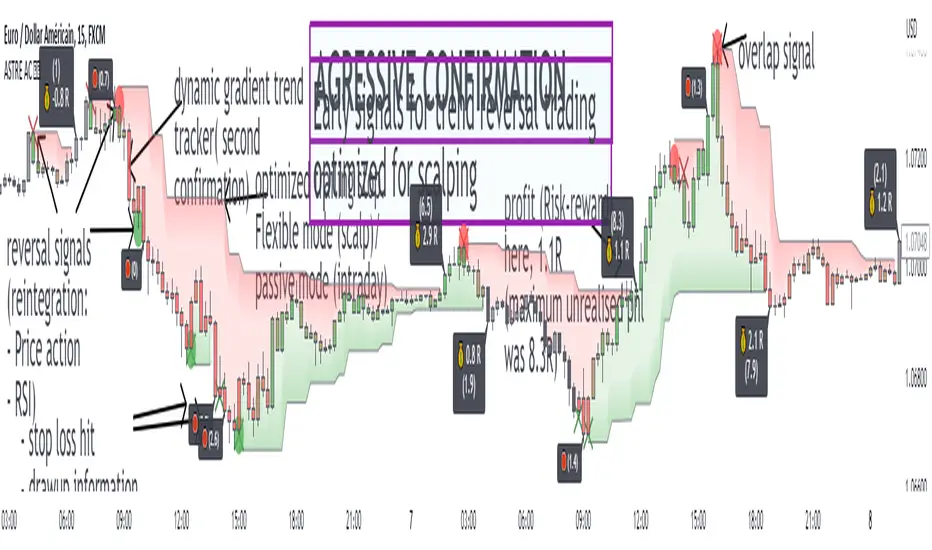
Agressive ConfirmationThis indicator serves as a guide for aggressive counter-trend trading, offering entries, a trailing stop for trade exits and a performance backtesting system (risk ratio).
AC proves to be an excellent ally in assisting counter-trend entry decisions. The signals come from two different sources, and are positioned almost identically in terms of the timing of entry into a trade on a trend change.
The first is RSI reintegration: simple, effective. The second is price action reintegration (identifies short-term support/resistance, a false break with counter-trend reinjection).
The duality of this entry system means you can be present on most local tops and bottoms without having an excessively high number of trade entries. The failure of the first entry can give a signal on the second (divergence, volatility...): use this complementarity to your advantage! If the first signal ends in a loss, wait for confirmation on the second signal.
The trailing stop system is activated as soon as an entry signal is detected, and if no entry signal is still active. The trade is closed when the candle closes above or below the trailing stop.
Two possible settings:
"passive": (multiply 5, period 8), least reactive trailing stop, willing to hold the trade
"balanced": (multiply 1, period 4): versatile trailing stop, ideal compromise.
These trailing stop parameters are optimized by the automated backtesting strategy of our IRL indicator, which indicates precise reversal levels. To use them in this specific context, you need to be in timeframe m1. For more information on these levels, please see my profile!
The stop loss for each reversal corresponds to the last high/low of the last 4 candles. It's possible to display this value above or below the trade entry signal, which makes it easier to understand the practical application of the signals presented.
An option for displaying more information on trades executed once closed. When an exit signal is detected (stop loss OR trailing stop), the candle leading to the trade's closure is marked with a label, providing information on the trade's profit (expressed in R, risk ratio). A second piece of information, in brackets, is the drawup: this corresponds to the maximum unrealized PNL of the closed trade.
The size of these labels can be modified according to the trade's PNL, all managed by profitability thresholds in R (default: 8R, 4R, 1R).
these latest entry signal performance functions optimize the backtesting process and the identification of relevant reversal strategies, by reversing the methodology: "where are the biggest profits made over such and such a period, what were the signals of my studied strategy, ...". The drawup, for its part, will enable you to appreciate an entry during a volatile period, which can sometimes lead to substantial short-term gains, but which the trailing stop exit failed to capitalize on!
A second signal corresponds to an additional confirmation, generally later in the timing, and informed by candle coloring. Based on RSI convergence/divergence, and to be used as a possible complementary filter to entry signals. Independent and without impact on the entry and exit signals studied.
This indicator has been developed in synergy with our other published technical indicators for identifying reversal zones / reversal timings, and offers a guideline for those less experienced in frontrunning/counter-trending. AC should be the sinequa none for a reversal entry, and will enable you to appreciate the reversal setups studied!
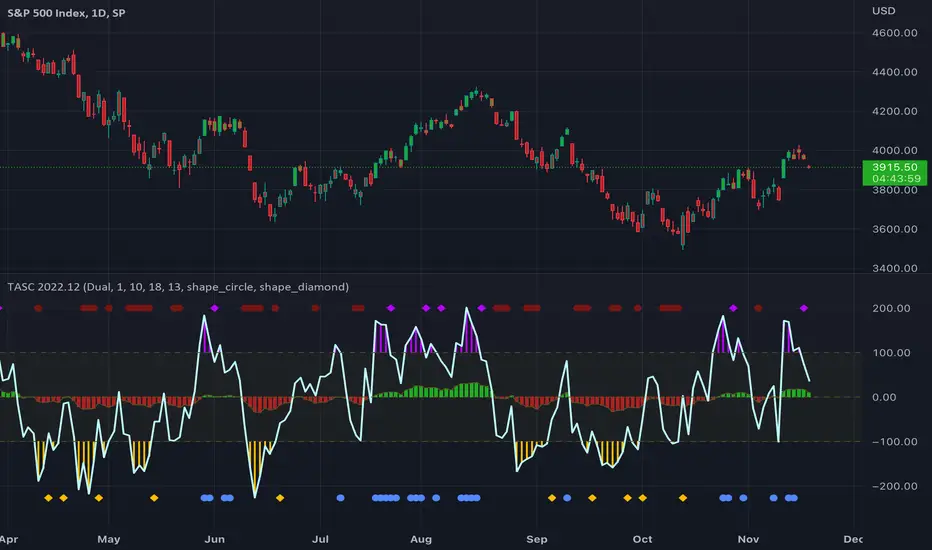
TASC 2022.12 Short-Term Continuation And Reversal Signals█ OVERVIEW
TASC's December 2022 edition Traders' Tips includes an article by Barbara Star titled "Short-Term Continuation And Reversal Signals". This is the code that implements the concepts presented in this publication.
█ CONCEPTS
The article takes two classic indicators, the Commodity Channel Index (CCI) and the Directional Movement Indicator (DMI), makes changes to the traditional ways of visualizing their readings, and uses them together to generate potential signals. The author first discusses the benefits of converting the DMI indicator to an oscillator format by subtracting the −DI from the +DI, which is then displayed as a histogram. Next, the author shows how the use of an on-chart visual framework (i.e., choosing the line style and color, coloring price bars, etc.) can help traders interpret the signals produced the considered pair of indicators.
█ CALCULATIONS
The article offers the following signals based on the readings of the DMI and CCI pair, suitable for several types of trades:
• Short-term trend change signals:
A DMI oscillator above zero indicates that prices are in an uptrend. A DMI oscillator below the zero line and falling means that selling pressure is dominating and price is trending down. The sign of the DMI oscillator is indicated by the color of the price bars (which correlates with the color of the DMI histogram). Namely, green, red and grey price bars correspond to the DMI oscillator above, below and equal to zero . Colored price bars and the DMI oscillator make it easy for trend traders to recognize changes in short-term trends.
• Trend continuation signals:
Blue circles appear near the bottom of the oscillator chart border when the DMI is above the zero line and the price is above its simple moving average in an uptrend . Dark red circles appear near the top of the chart in a downtrend when the DMI oscillator is below its zero line and below the 18-period moving average. Trend continuation signals are useful for those looking to add to existing positions, as well as for traders waiting for a pullback after a trend has started.
• Reversal signals:
The CCI signals a reversal to the downside when it breaks out of its +100 and then returns at some point, crossing below the +100 level. This is indicated by a magenta-colored diamond shape near the top the chart. The CCI signals a reversal to the upside when it moves below its −100 level and then at some point comes back to cross above the −100 level. This is indicated by a yellow diamond near the bottom of the chart. Reversal signals offer short-term rallies for countertrend traders as well as for swing traders looking for longer-term moves using the interplay between continuation and reversal signals.
Index Reversal Range with Volatility Index or VIXWhat is the Indicator?
• The indicator is a visualization of maximum price in which the respective index can go up to in comparison with it's Volatility Index or VIX.
Who to use?
• Intraday
• Swing
• Position
• Long term Investors
• Futures
• Options
• Portfolio Managers
• Mutual Fund Managers
• Index Traders
• Volatility based Traders
• Long term Investors and Options Traders gets the maximum benefit
What timeframe to use?
• 1 Year: Position & Investors
• 6 Months: Position & Investors
• 3 Months: Swing & Position
• 1 Month: Swing & Position
• 1 Week: Swing
• 1 Day: Swing
• 1 Hour: Intraday & Swing
What are Upper and Lower lines?
• Upper Line: If the index price reach closer to the Upper line there is a high chance of reversal to Bearish trend.
• Lower Line: If the index price reach closer to the Lower line there is a high chance of reversal to Bullish trend.
• This need to be confirmed with multiple levels like Daily, Weekly, Monthly etc.
How to use?
• If the price reach closer to that level there is a high chance of reversal from the current trend.
• To identify the reversal zone of the index.
• To identify the trend.
• Option Traders can Sell a Call or Put Option from that level.
• Long term Investors, Position or Swing traders can plan for a Long entry.
• Intraday traders can use lower timeframes to do the same.
Indicator Menu
• Input VIX: Identify the VIX Symbol of your Index and type it in the box.
• For example for NIFTY Index chart type INDIAVIX in the box.
• Choose multiple timeframes according to your convenience.
How to turn on indicator Name and Value labels?
• Right side of the screen >
• Right click on the Price scale >
• Labels > Indicators and financial name labels, Indicators and financial value labels
Further Reading:
• Various videos and reading materials are available about this method.

wnG - Spikes IdentifierThis indicator, based on the ATR, allows you to identify the potential reversal on price and helps you identify the Support and Resistance.
When the price moves far away from the multiple moving average, the background color changes :
- Red for Short potential entry
- Green for Long potential entry
There are 2 ways to use this script :
- Conservative : Use it in your trading system to Take Profit ==> when the background turns red, close LONG position (and green = close short).
- Aggressive : As soon as the background turns red, enter SHORT (and green = long).
For aggressive use, I recommand you to couple this script with an oscillator to confirm the signals (RSI stochastic for example).
You can customize the sensibility with 4 levels :
- low probability of reversal
- medium probability of reversal
- high probability of reversal
- very high probability of reversal
PS : the "High" and "Very High" probability setup are the only one I'm using in my trading systems.