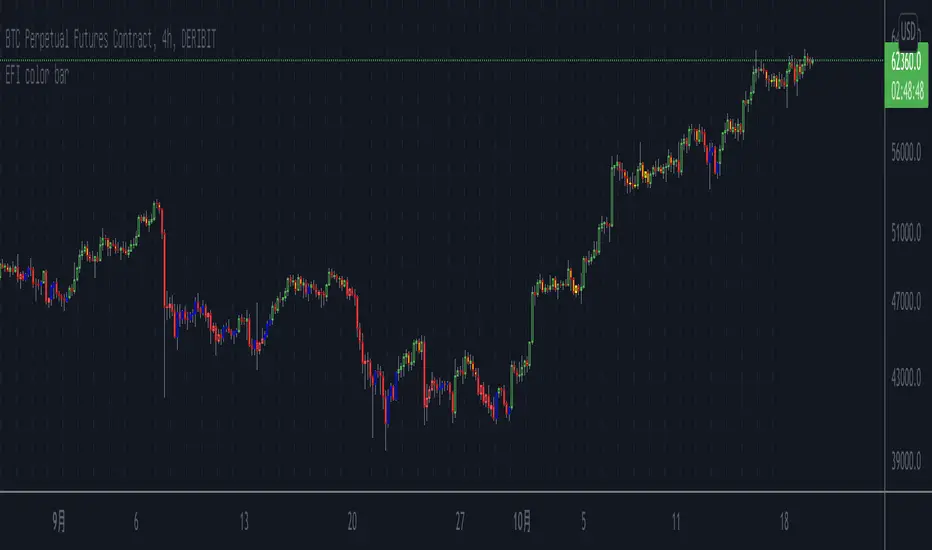
Elder's Force Index Color BarBased on the Elder's Force Index (EFI) , +/- of the EFI and its ema is used to describe the rise, fall or possible reversal of the market, and finally shown by bar color.
The green bar represents a strong bull and the red bar represents a strong bear;
The blue bar indicates that the downtrend is exhausted and may rise. Likewise the yellow bar.
Of course, it is difficult to buy the bottom and sell the top at any time. This indicator needs to be judged together with the pattern or other indicators that predict reversals in order to increase the win rate.
Happy Trading.
根据Elder's Force Index修改而成,取消了幅图指标,仅用bar color来表现上涨,下跌和转折。
绿色k线代表上涨动能充足,红色k线表示下跌动能充足;
蓝色k线表示下跌力竭,可能会上涨;
黄色k线表示上涨力竭,可能会下跌。
当然,任何时候抄底摸顶都是困难的,该指标需要和形态或者其他预测反转的指标一起判断才能增加成功率。
祝交易愉快。
緑は上昇トレンドで、赤は下落トレンドです;
青は下落が尽きて上昇する可能性があることを示すことで、黄色は上昇が終わり、下落の可能性があることを示しています。
成功率を高めるためには、パターンや反転を予測する他の指標と合わせて判断する必要があります。
Happy Trading。
Pesquisar nos scripts por "reversal"
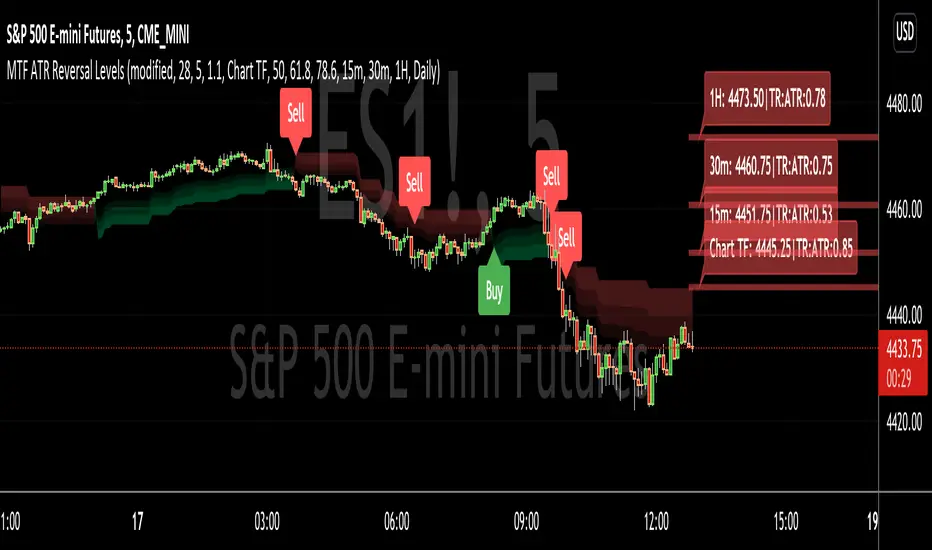
MTF ATR Reversal LevelsThis is a Multitple TimeFrame Swingarm system borrowing from the Blackflag FTS indicator.
This throws up 5 resolutions of ATR thresholds, only showing the current bar level using a horizontal line across the full chart. I don't like the historical information charted, just need to know the current level for my trading purposes.
It will also give Sell/Buy alerts when the closing price exceeds one of those thresholds... essentially confirmation of a trend reversal.
On the primary resolution (defaulted to the current timeframe of the chart) it can show the fibonacci reversal levels using the ATR levels for that time resolution. This is if for the current trend.
I find it useful, so I thought I would share. Like all indicators, it'll work as long as you stick with a system, and let it work. :)
Volume Pressure AnalysisVolume Pressure Analysis is a new concept I have been working on designed to show the effort required to move price. An ideal tool for confirming trends or locating reversals early. This indicator can highlight whale action and market manipulation. It calculates volume vs volatility and displays the results as a meter:
Above 0 shows how easy price action is traveling, the bigger these bars the less volume and effort is required to push price. These are indicated with a teal or red arrows and can confirm the beginning or continuation of a trend. This is the natural direction the chart wants to travel at that time.
Below 0 shows how hard price is to move. The bigger these bars the more volume and effort is required to push price. When whales and market makers push price against its will these bars will get bigger.
Yellow arrows signal pressure in that direction and excessive amounts of volume is required to move price. These signals can lead to reversal/ pivot points as price action struggles to continue its trend. These signals can be turned on in settings or use the overlay version of this script to display signals on chart. This is a very powerful tool when used with relative volume.

Center Of Gravity OscillatorThe COG Oscillator (center of gravity) is an indicator based on statistics and the Fibonacci golden ratio. It uses ALMA as a trigger and LSMA as "zero line". The trigger is set tight by default but can be tweaked by adjusting the window size and sigma in settings. This is a great indicator for setting up trades and spotting reversals. There are 2 main strategies that come with this indicator:
Strategy 1: Long positions are entered when current low point is higher than previous low. Short positions are entered as current high is lower than previous high. (Shown in image above)
Strategy 2 : If market is bullish long trades are entered as COG line crosses over red LSMA line. Traders have the option of scalping the first crossover or even scaling out of trade to close on second exit. This works the opposite for shorts when market is bearish.
Above shows different configurations of the indicator. Top shows length of 50, Middle has length of 21 and bottom is default 9.

Volatility OscillatorThis tool displays relative volatility and directional trend. Excellent way to pickup diversions and reversals. Length can be lowered to 11 or 13 in settings to show price range.
Can be used to identify patterns such as parallel channels and likely direction of price action as pictured below.

Peak Profit v2 (Reversal Points & High/Low Waveform)This script includes two different methods of indication.
It includes a High/Low Waveform . It is a technical indicator that is best performed when using a trailing stop, it also works well as a trend line.
Trade with caution however the general idea is to buy when line turns green, and sell when the line turns red.
This can be disabled by clicking the checkmark in the visual settings of the script.
Second Feature is an indicator for Reversal points . These show a price to "enter long" and "take profit"
This part of the script looks for a series of consecutive closes greater than or less four closing price bars to define an underlying uptrend or downtrend.
In general, minor price reversals are associated with the completion of the trend and major market turning points are identified by the completion of a trend of a specific series of bar openings/closes.
As always, this script should not be relied upon alone for your sole indication of buying and selling. Use your own intuition and other indicators along with this one for the best results.

Turbulence reversalGiven that the market turbulence tends to cluster, I developed a turbulence moving average system to reveal the unseen underlying structure of the least resistance path for trend following.
Here, I used an SMA subset from the turbulence moving average system to determine the trend direction. This estimation is achieved by calculating the dynamic changes of SMA slope angle and distance between SMA. The former represents a possible reversal signal, and the latter shows the resistance from the intermediate-term SMA.
When the short-term slope angle crossovers the intermediate-term slope angle, the indicator will give a star sign, indicating a possible trend reversal.
Use this indicator together with the turbulence moving average system (Turbulence with direction).
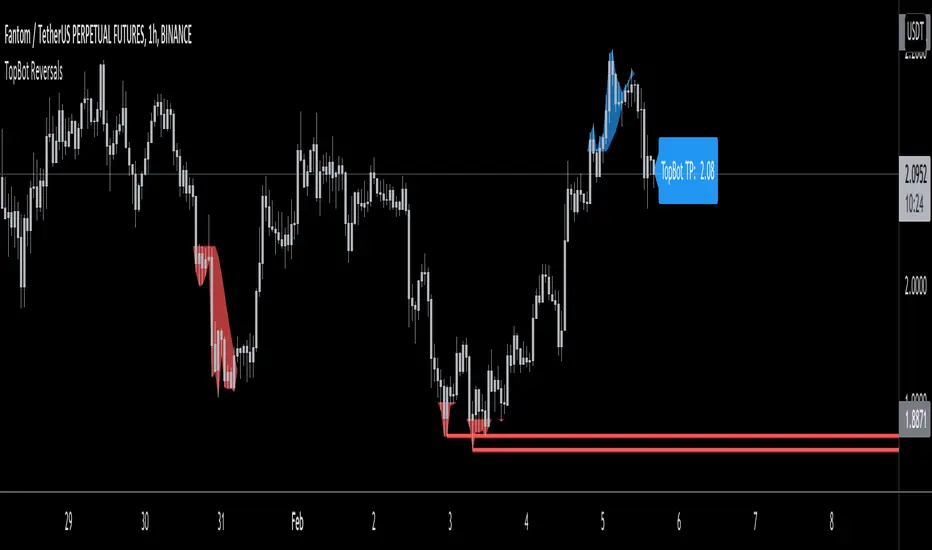
TopBot ReversalsThe TopBot Reversal indicator utilizes exhaustion and historical price levels to draw a possible recent top and bottom level. Using these lines together with other directional indicators such as Stochastic or RSI, we can draw a conclusion to a possible reversal at these levels.
Use the link below to obtain access to this indicator.
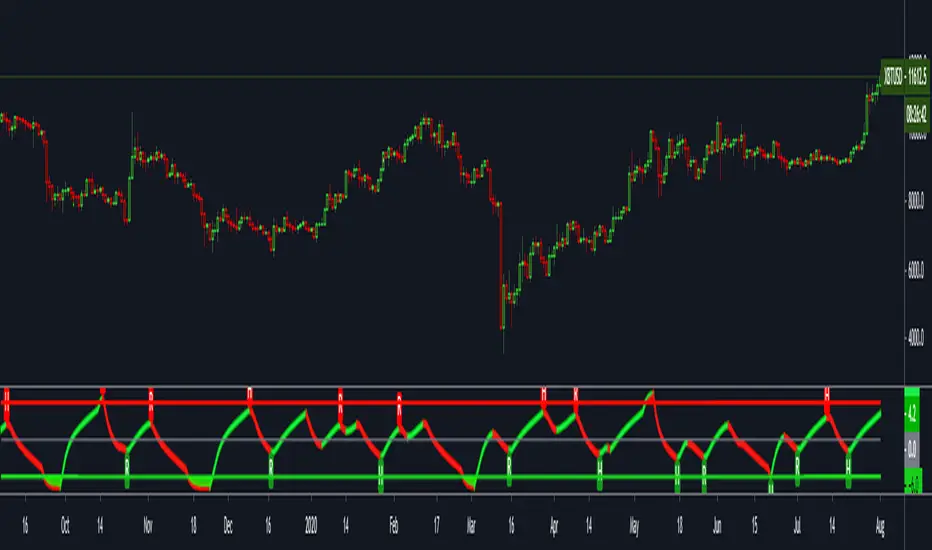
ATR Auto Oscillator [DepthHouse]The ATR Auto Oscillator uses advanced range calculations to determine a dynamic range that the applied market moves within. Like an RSI , the ATR Auto Oscillator measures the speed and change of price movements through a given range. Unlike an RSI , the ATR Auto Oscillator automatically re-configures range values dependent on the user set lookback.
The oscillator ranges between (0.1) and 1.1. Generally, the market is oversold while the bands are below 0.2 and is overbought while above 0.8.
The two bands displayed are used to determine short term trend directions and the oversold/undersold state of the applied market. Crossovers of these bands could give a hint to the direction the market is moving.
The fast band (green) is the direct value of where the market is within its calculated range; 1.1 representing the top of range, and -0.1 representing the bottom. Even when this value is near the bottom of the top of the range, the auto oscillator will readjust to create a new range that the market travels within.
The slow band (red) is a lagging version of the fast band which is used to determine the oversold/overbought signals. When this band travels within the oversold and overbought regions the background color will change to signal a warning. If the fast band crosses the slow band within these zones, an opaque signal will appear. These signals are used to catch possible trend reversals.
Breakout Signals ( BETA ):
Breakout signals are the up and down arrows displayed on the top and bottom of the oscillator. A refined range is generated by the user set 'High Low Length'; it is then displayed by the light gray horizontal lines. If the user set band (fast or slow) returns into the range within a given period (breakout offset) then a signal will generate.
Built in Alerts (must be set up by user):
Bullish & Bearish Crossovers within the oversold and overbought ranges.
Bullish & Bearish Breakout alerts (beta)
Users can also set custom alerts. Example: Fast Band crossing up Value: 0.7
To gain access to this indicator please follow the link below.
Feel free to message me with any questions directly here on TradingView.

FTSXFisher transform & RSX for reversal points in price.
Potential price reversals are regular divergences and potential trend continuations are hidden divergences, OB/OS levels are shown with red and green lines.
JD ProgressJD Progress Indicator is a two-part algorithm that is designed for both the 4hr and DAILY chart with unique alerts for each timeframe.
This can be applied to Forex, Stocks, Crypto and Metals
How to use;
4hr - When price crosses the channels and the confirmation indicators at the bottom all align, the trade alerts will be shown on screen.
D1 - When the price crosses the channels (no need to wait for confirmation indicators), the trade alerts will be shown on screen
There are a number of rules baked into the code to try and eliminate as many fake signals as possible.
ATR targets and stop losses are also shown on screen and can be hidden if desired. I'd suggest aiming for 1x ATR target and 1.5 ATR Stop Loss. Use two trades and let the second run with a trailing stop.
This algorithm is essentially a reversal system that uses a number of specifically tested and chosen indicators to identify reversals as early as possible.
When to trade.
4hr - I suggest trading Tues - Thurs when trading the 4hr. Background shading will assist with this.
D1 - Trade 5 days a week.
With both timeframes, wait for the bar to close and place a pending order with a 5 pip gap.
JD Core in action
How to Access
Gain access to JD Progress Confirmations for your TradingView account through our website, links below.
7 day paid trials, subscriptions and lifetime access are all available.
All tiers give you full instructions on how to trade this strategy.

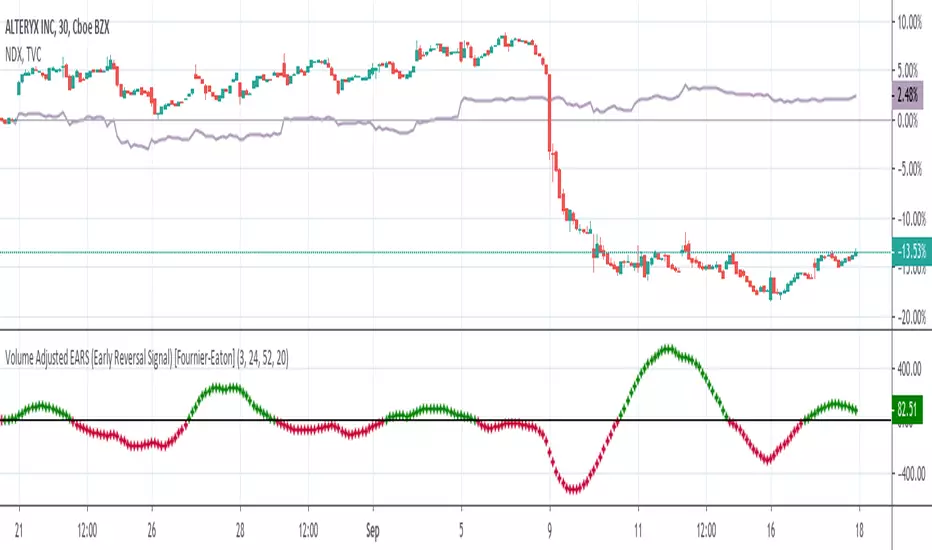
Volume Adjusted Early Reversal Signal (EARS) [Fournier-Eaton]Use WITH another indicator. (Works well with Trend Shift Indicator)
This is for early signaling of reversals. Use for early entry/exit.
Treat as macd with crossovers being key.
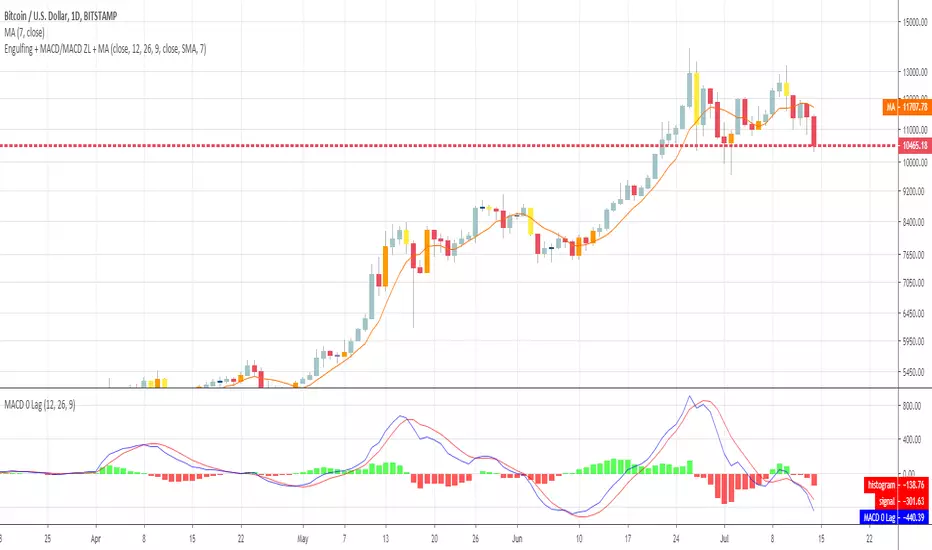
Engulfing + MACD/MACD ZL + MAHi everyone
This is a simple algorithm that I used on timeframe > m30 to detect strong reversal signals based on :
- Engulfing pattern
- MACD ZL 12, 26, 9
- Price vs SMA 7
Last two parameters are optional but gives more security. Otherwise, waiting for confirmation gives later entry.
Up to you to find the right balance between too much security (and taking the trade too late) and not enough confirmation (taking the trade too early and it will go the opposite way)
I recommend the novice traders (less than 2 years trading), to stick with the 3 parameters above .
It's to be used after a strong moment and as we're talking about reversals, I mean trade against the current trend.
Meaning they're more risky, so... you know the drill :) :
- Tight SL
- Protect the position quickly when going in the way you want
- Don't aim for very high TP. Have a few laddered obviously in any case
- Use a trailing stop to protect your gains
Hope you'll like it
Enjoy
Dave
Volume Spread IndicatorVolume Spread Indicator is based on my understanding of Volume Spread Analysis (VSA). VSA is the third approach for analyzing the price of a stock, forex or cryptocurrency. VSA looks for the difference between supply and demand that are created by a professional trader, institutional players which are called Smart Money.
This Indicator shows SV(Stopping Volume), NS (No Supply), ND (No Demand), -RC( Reverse Candle). Stopping volume and No supply appearing at key support level indicates Bullish Reversal. -RC and ND appearing at key resistance level indicate Bearish Reversal. This indicator can be used as Bottom and Top.
This Indicator can be used effectively with the combination of AutoFibe indicator, Scalping sell and buy Indicator.
Stopping Volume is shown as SV
No Demand is shown as a triangle down (Red)
No Supply is shown as a triangle up (Green)
Reverse Candle is shown as -RC

Market direction and pullback based on S&P 500.A simple indicator based on www.swing-trade-stocks.com The link is also the guide for how to use it.
0 - nothing. If the indicator is showing 0 for a prolonged amount of time, it is likely the market is in "momentum mode" (referred to in the link above).
1 - indicates an uptrend based on SMA and EMA and also a place where a reversal to the upside is likely to occur. You should look only for long trades in the stock market when you see a spike upwards and S&P 500 is showing an obvious uptrend.
-1 - indicates a downtrend based on SMA and EMA and also a place where a reversal to the downside is likely to occur. You should look only for short trades in the stock market when you see a spike upwards and S&P 500 is showing an obvious uptrend.

DBT MoMoThe DBT MoMo indicator was created to show how price reacts to volatility and recent price movements. It determines how strong or weak a trend is and can give very strong indications of when a trend or move is coming to an end. When the DBT is over 10 or below -10 and turns from red to green or vice versa look for reversal candlestick patterns to signify a reversal. It can also be used to find divergences. When the DBT is trending upward with price but begins to give multiple sell signals while price is still increasing this shows that momentum is weakening and a reversal is incoming, vice versa for a downtrend.
Use at your own risk. This is not financial advise and this indicator is not guaranteed to make you profits. Please message me if you have any questions or feedback. Enjoy.
DO NOT ASK FOR ACCESS. THIS INDICATOR WILL BE AVAILABLE ON MY WEBSITE ONCE IT RELEASES.

CMYK VRMI RAYS ◊ Introduction
Introducing VRMI in this script, an RMI based on price movement and volume, to indicate bullish and bearish trends.
This script marks the background depending on RMI <> VRMI , VRMI polarity and large buy/sell sprees.
◊ Origin
Based on 'The Relative Momentum Index' by Roger Altman : February, 1993 issue of Technical Analysis of Stocks & Commodities magazine.
While RSI counts up and down days from close to close, the Relative Momentum Index counts up and down days from the close relative to a close x number of days ago.
This results in an RSI that is smoother.
In addition VRMI reacts quick, it is used to cut off latency from RMI, and it's polarity indicates the beginning and end of a trend.
Large buy sell sprees and detected in their proportion with an sma on the volume
◊ Adjustments
CMYK color theme applied.
◊ Usage
This indicator can be used to detect trends and mark reversals.
◊ Prospects
◊ ◊ ◊ ◊ ◊ ◊ ◊ ◊ ◊ ◊ ◊ ◊ ◊ ◊ ◊ ◊ ◊ ◊ ◊ ◊ ◊ ◊ ◊ ◊ ◊ ◊ ◊ ◊ ◊ ◊ ◊ ◊ ◊ ◊ ◊ ◊ ◊ ◊ ◊ ◊ ◊ ◊ ◊ ◊ ◊ ◊ ◊ ◊ ◊ ◊ ◊ ◊ ◊ ◊ ◊ ◊ ◊ ◊ ◊ ◊ ◊ ◊ ◊ ◊ ◊ ◊ ◊ ◊ ◊ ◊ ◊ ◊ ◊ ◊ ◊ ◊ ◊ ◊ ◊ ◊ ◊ ◊ ◊ ◊ ◊ ◊ ◊ ◊ ◊ ◊ ◊ ◊ ◊ ◊ ◊ ◊ ◊ ◊ ◊ ◊ ◊ ◊ ◊ ◊ ◊ ◊

Hurst-Optimized Adaptive Channel [Kodexius]Hurst-Optimized Adaptive Channel (HOAC) is a regime-aware channel indicator that continuously adapts its centerline and volatility bands based on the market’s current behavior. Instead of using a single fixed channel model, HOAC evaluates whether price action is behaving more like a trend-following environment or a mean-reverting environment, then automatically selects the most suitable channel structure.
At the core of the engine is a robust Hurst Exponent estimation using R/S (Rescaled Range) analysis. The Hurst value is smoothed and compared against user-defined thresholds to classify the market regime. In trending regimes, the script emphasizes stability by favoring a slower, smoother channel when it proves more accurate over time. In mean-reversion regimes, it deliberately prioritizes a faster model to react sooner to reversion opportunities, similar in spirit to how traders use Bollinger-style behavior.
The result is a clean, professional adaptive channel with inner and outer bands, dynamic gradient fills, and an optional mean-reversion signal layer. A minimalist dashboard summarizes the detected regime, the current Hurst reading, and which internal model is currently preferred.
🔹 Features
🔸 Robust Regime Detection via Hurst Exponent (R/S Analysis)
HOAC uses a robust Hurst Exponent estimate derived from log returns and Rescaled Range analysis. The Hurst value acts as a behavioral filter:
- H > Trend Start threshold suggests trend persistence and directional continuation.
- H < Mean Reversion threshold suggests anti-persistence and a higher likelihood of reverting toward a central value.
Values between thresholds are treated as Neutral, allowing the channel to remain adaptive without forcing a hard bias.
This regime framework is designed to make the channel selection context-aware rather than purely reactive to recent volatility.
🔸 Dual Channel Engine (Fast vs Slow Models)
Instead of relying on one fixed channel, HOAC computes two independent channel candidates:
Fast model: shorter WMA basis and standard deviation window, intended to respond quickly and fit more reactive environments.
Slow model: longer WMA basis and standard deviation window, intended to reduce noise and better represent sustained directional flow.
Each model produces:
- A midline (basis)
- Outer bands (wider deviation)
- Inner bands (tighter deviation)
This structure gives you a clear core zone and an outer envelope that better represents volatility expansion.
🔸 Rolling Optimization Memory (Model Selection by Error)
HOAC includes an internal optimization layer that continuously measures how well each model fits current price action. On every bar, each model’s absolute deviation from the basis is recorded into a rolling memory window. The script then compares total accumulated error between fast and slow models and prefers the one with lower recent error.
This approach does not attempt curve fitting on multiple parameters. It focuses on a simple, interpretable metric: “Which model has tracked price more accurately over the last X bars?”
Additionally:
If the regime is Mean Reversion, the script explicitly prioritizes the fast model, ensuring responsiveness when reversals matter most.
🔸 Optional Output Smoothing (User-Selectable)
The final selected channel can be smoothed using your choice of:
- SMA
- EMA
- HMA
- RMA
This affects the plotted midline and all band outputs, allowing you to tune visual stability and responsiveness without changing the underlying decision engine.
🔸 Premium Visualization Layer (Inner Core + Outer Fade)
HOAC uses a layered band design:
- Inner bands define the core equilibrium zone around the midline.
- Outer bands define an extended volatility envelope for extremes.
Gradient fills and line styling help separate the core from the extremes while staying visually clean. The midline includes a subtle glow effect for clarity.
🔸 Adaptive Bar Tinting Strength (Regime Intensity)
Bar coloring dynamically adjusts transparency based on how far the Hurst value is from 0.5. When market behavior is more decisively trending or mean-reverting, the tint becomes more pronounced. When behavior is closer to random, the tint becomes more subtle.
🔸 Mean-Reversion Signal Layer
Mean-reversion signals are enabled when the environment is not classified as Trending:
- Buy when price crosses back above the lower outer band
- Sell when price crosses back below the upper outer band
This is intentionally a “return to channel” logic rather than a breakout logic, aligning signals with mean-reversion behavior and avoiding signals in strongly trending regimes by default.
🔸 Minimalist Dashboard (HUD)
A compact table displays:
- Current regime classification
- Smoothed Hurst value
- Which model is currently preferred (Fast or Slow)
- Trend flow direction (based on midline slope)
🔹 Calculations
1) Robust Hurst Exponent (R/S Analysis)
The script estimates Hurst using a Rescaled Range approach on log returns. It builds a returns array, computes mean, cumulative deviation range (R), standard deviation (S), then converts RS into a Hurst exponent.
calc_robust_hurst(int length) =>
float r = math.log(close / close )
float returns = array.new_float(length)
for i = 0 to length - 1
array.set(returns, i, r )
float mean = array.avg(returns)
float cumDev = 0.0
float maxCD = -1.0e10
float minCD = 1.0e10
float sumSqDiff = 0.0
for i = 0 to length - 1
float val = array.get(returns, i)
sumSqDiff += math.pow(val - mean, 2)
cumDev += (val - mean)
if cumDev > maxCD
maxCD := cumDev
if cumDev < minCD
minCD := cumDev
float R = maxCD - minCD
float S = math.sqrt(sumSqDiff / length)
float RS = (S == 0) ? 0.0 : (R / S)
float hurst = (RS > 0) ? (math.log10(RS) / math.log10(length)) : 0.5
hurst
This design avoids simplistic proxies and attempts to reflect persistence (trend tendency) vs anti-persistence (mean reversion tendency) from the underlying return structure.
2) Hurst Smoothing
Raw Hurst values can be noisy, so the script applies EMA smoothing before regime decisions.
float rawHurst = calc_robust_hurst(i_hurstLen)
float hVal = ta.ema(rawHurst, i_smoothHurst)
This stabilized hVal is the value used across regime classification, dynamic visuals, and the HUD display.
3) Regime Classification
The smoothed Hurst reading is compared to user thresholds to label the environment.
string regime = "NEUTRAL"
if hVal > i_trendZone
regime := "TRENDING"
else if hVal < i_chopZone
regime := "MEAN REV"
Higher Hurst implies more persistence, so the indicator treats it as a trend environment.
Lower Hurst implies more mean-reverting behavior, so the indicator enables MR logic and emphasizes faster adaptation.
4) Dual Channel Models (Fast and Slow)
HOAC computes two candidate channel structures in parallel. Each model is a WMA basis with volatility envelopes derived from standard deviation. Inner and outer bands are created using different multipliers.
Fast model (more reactive):
float fastBasis = ta.wma(close, 20)
float fastDev = ta.stdev(close, 20)
ChannelObj fastM = ChannelObj.new(fastBasis, fastBasis + fastDev * 2.0, fastBasis - fastDev * 2.0, fastBasis + fastDev * 1.0, fastBasis - fastDev * 1.0, math.abs(close - fastBasis))
Slow model (more stable):
float slowBasis = ta.wma(close, 50)
float slowDev = ta.stdev(close, 50)
ChannelObj slowM = ChannelObj.new(slowBasis, slowBasis + slowDev * 2.5, slowBasis - slowDev * 2.5, slowBasis + slowDev * 1.25, slowBasis - slowDev * 1.25, math.abs(close - slowBasis))
Both models store their structure in a ChannelObj type, including the instantaneous tracking error (abs(close - basis)).
5) Rolling Error Memory and Model Preference
To decide which model fits current conditions better, the script stores recent errors into rolling arrays and compares cumulative error totals.
var float errFast = array.new_float()
var float errSlow = array.new_float()
update_error(float errArr, float error, int maxLen) =>
errArr.unshift(error)
if errArr.size() > maxLen
errArr.pop()
Each bar updates both error histories and computes which model has lower recent accumulated error.
update_error(errFast, fastM.error, i_optLookback)
update_error(errSlow, slowM.error, i_optLookback)
bool preferFast = errFast.sum() < errSlow.sum()
This is an interpretable optimization approach: it does not attempt to brute-force parameters, it simply prefers the model that has tracked price more closely over the last i_optLookback bars.
6) Winner Selection Logic (Regime-Aware Hybrid)
The final model selection uses both regime and rolling error performance.
ChannelObj winner = regime == "MEAN REV" ? fastM : (preferFast ? fastM : slowM)
rawMid := winner.mid
rawUp := winner.upper
rawDn := winner.lower
rawUpInner := winner.upper_inner
rawDnInner := winner.lower_inner
In Mean Reversion, the script forces the fast model to ensure responsiveness.
Otherwise, it selects the lowest-error model between fast and slow.
7) Optional Output Smoothing
After the winner is selected, the script optionally smooths the final channel outputs using the chosen moving average type.
smooth(float src, string type, int len) =>
switch type
"SMA" => ta.sma(src, len)
"EMA" => ta.ema(src, len)
"HMA" => ta.hma(src, len)
"RMA" => ta.rma(src, len)
=> src
float finalMid = i_enableSmooth ? smooth(rawMid, i_smoothType, i_smoothLen) : rawMid
float finalUp = i_enableSmooth ? smooth(rawUp, i_smoothType, i_smoothLen) : rawUp
float finalDn = i_enableSmooth ? smooth(rawDn, i_smoothType, i_smoothLen) : rawDn
float finalUpInner = i_enableSmooth ? smooth(rawUpInner, i_smoothType, i_smoothLen) : rawUpInner
float finalDnInner = i_enableSmooth ? smooth(rawDnInner, i_smoothType, i_smoothLen) : rawDnInner
This preserves decision integrity since smoothing happens after model selection, not before.
8) Dynamic Visual Intensity From Hurst
Transparency is derived from the distance of hVal to 0.5, so stronger behavioral regimes appear with clearer tints.
int dynTrans = int(math.max(20, math.min(80, 100 - (math.abs(hVal - 0.5) * 200))))

TSS by AMAGADONTSS - THE SESSION SETUP
The Methodology
THE SESSION SETUP (TSS) is a price-action framework that utilizes session-specific volatility to define intraday expansion zones. By isolating the opening ranges of the Asia, London, and New York sessions on the 15-minute (M15) timeframe, TSS identifies clear institutional "interest zones."
The algorithm monitors these ranges for two specific price-action events:
Primary Breakouts: Decisive candle closes outside the session boundaries.
Liquidity Reversals (Counter-Signals): Identification of "fake-outs" where price traps initial breakout traders before reversing through the entire session range.
Features
Automated Session Boxes: Dynamic range calculation for all major global sessions.
Precision TP Levels: Systematic profit targets based on the measured session range (R).
Timeframe Integrity: Built-in guard to ensure the logic is only applied to the M15 timeframe, preserving the accuracy of the range calculations.
Visual Median: Dotted mid-lines to identify the "mean" price within a session.
CRITICAL DISCLOSURE - PLEASE READ CAREFULLY
HIGH RISK INVESTMENT WARNING: Trading Foreign Exchange (Forex) is highly speculative, carries a high level of risk, and may not be suitable for all investors. You may sustain a loss of some or all of your invested capital; therefore, you should not speculate with capital that you cannot afford to lose. NO FINANCIAL ADVICE: The TSS - THE SESSION SETUP indicator is a technical analysis tool provided for informational and educational purposes only. It does not constitute investment advice, financial advice, or a recommendation to buy or sell any currency pair or financial instrument.
LIMITATION OF LIABILITY:
Execution Risk: The author does not guarantee the accuracy of signals. Market conditions, including news-driven volatility, spreads, and slippage, can result in trades that differ significantly from the indicator's visual signals.
Backtesting Limitation: Past performance and historical signals are not indicative of future results.
User Responsibility: You are solely responsible for your trading decisions. The author of this script shall not be held liable for any loss or damage, including without limitation, any loss of profit, which may arise directly or indirectly from the use of or reliance on this tool.
BY USING THIS SCRIPT, YOU AGREE THAT YOU ARE TRADING AT YOUR OWN RISK.

Engulfing Overlap Zone Detector by RWBTradeLabEngulfing Overlap Zone Detector by RWBTradeLab
A focused, non-repainting tool that detects high-value “overlap zones” formed when one engulfing pattern fails and the opposite side immediately takes control.
What this indicator does
Instead of showing every engulfing pattern, this script filters out noise and highlights only Engulfing Overlap Zones:
1. It internally detects both:
* Regular Engulfing (R EG)
* E-Regular Engulfing (ER EG)
2. It then checks for engulfing failure:
* A Sell EG fails when a bullish candle closes above its base high.
* A Buy EG fails when a bearish candle closes below its base low.
3. After the failure, it looks for an opposite-side engulfing confirmation.
4. When the failed zone and the new opposite engulfing zone overlap, the script marks that region as a Buy EG Overlap or Sell EG Overlap zone.
Only these premium, overlap-based structures are shown on the chart.
Visuals on chart
1. Two stacked rectangles are drawn for each overlap setup:
* The failed engulfing zone
* The opposite confirming engulfing zone
2. Clean labels appear at the edge of the overlap:
* Buy EG Overlap (bullish zone)
* Sell EG Overlap (bearish zone)
3. Text distance from the zone is adjustable via Text Offset from Box (%).
4. Separate color controls for:
* Buy Engulfing Overlap Box
* Sell Engulfing Overlap Box
Alerts
Built-in alerts trigger only on confirmed bar close when a new overlap setup completes:
*Buy EG Overlap
*Sell EG Overlap
Each alert message includes price, time and ticker, prefixed with RWBTradeLab for easier filtering and automation.
Key settings
1. Candle Length (closed candles) – Defines how many recent confirmed candles are scanned (current bar is excluded).
2.Display toggles – Turn ON/OFF:
* Buy Engulfing Overlap
* Sell Engulfing Overlap
* Text labels
3. Text Offset from Box (%) – Controls how far the label is placed from the overlap zone, with a safe minimum to keep labels readable.
Non-repainting logic
* All calculations use closed candles only .
* No running-bar signals, no repaint tricks.
* The zones and alerts reflect stable, confirmed structures.
Best use
This indicator is designed to help you spot:
* Liquidity grabs and fake outs followed by real reversals
* Strong continuation zones after a failed attempt by the opposite side
* High-quality reaction areas for entries, pullbacks and retests
Works on any symbol or timeframe. For best results, combine with:
* Higher-timeframe market structure
* Key support/resistance or supply/demand zones
* Your own trade management and confirmation rules
Disclaimer
This script is a technical pattern-detection tool, not financial advice. Trading involves risk. Always use proper risk management and confirm signals with your own analysis.
Creator: RWBTradeLab
If this indicator helps your trading, please leave a ⭐ and share your feedback.

Box TheoryBox Theory – Description
This indicator is based on the popular “Box Theory” concept, where the previous session’s High–Low range acts as the most important structure for the next session.
Traders use this because the market often reacts to the same areas where liquidity, orders, and imbalances were created in the prior session.
At every new session open, the indicator automatically records:
Previous High
Previous Low
Middle (50% level)
These three levels form a box, which becomes your roadmap for the new session.
This method is widely used because it highlights where most reversals, sweeps, and reactions occur—without needing any extra indicators.
How the Zones Are Calculated
Previous High
The highest price of the last session.
This forms the top edge, which acts as resistance and the basis for the Sell Zone.
Previous Low
The lowest price of the last session.
This forms the bottom edge, acting as support and the basis for the Buy Zone.
Middle Line (50% Level)
The exact midpoint between High and Low.
This is the fair-value zone, where price often consolidates and becomes directionless.
No signals are triggered near the middle, because trades taken here historically have low accuracy.
Buy Zone (Green Area)
The lower part of the box.
Price often reacts here because this area held buyers in the previous session.
When price enters this green zone inside the box, the indicator can show a Buy Zone label.
Sell Zone (Red Area)
The upper part of the box.
Price commonly rejects here because this area acted as resistance previously.
When price enters this red zone inside the box, the indicator can show a Sell Zone label.
How Zone Size Is Set (Sensitivity %)
You can adjust how big the Buy/Sell zones are using the Sensitivity (%) input.
Lower % → Smaller zones → More precise signals
Higher % → Larger zones → Signals appear earlier and from farther away
Formula:
Zone Size = (Previous High − Previous Low) × (Sensitivity % ÷ 100)
This lets you customize how tight or how early your signals appear.
Inside-Box Only Logic
The indicator only works inside the previous session’s range.
If price breaks above the previous High → No sell signal
If price breaks below the previous Low → No buy signal
This avoids false signals during breakouts or trending markets.
Alerts
The indicator includes two alerts:
Buy Zone Alert → Triggers when price enters the Buy Zone
Sell Zone Alert → Triggers when price enters the Sell Zone
Just enable them in TradingView’s alert panel.

Continuation / Reversal Sweep (WMA trend)marks hh ll
reversals
continuiation
htf analyisis to enter in ltf

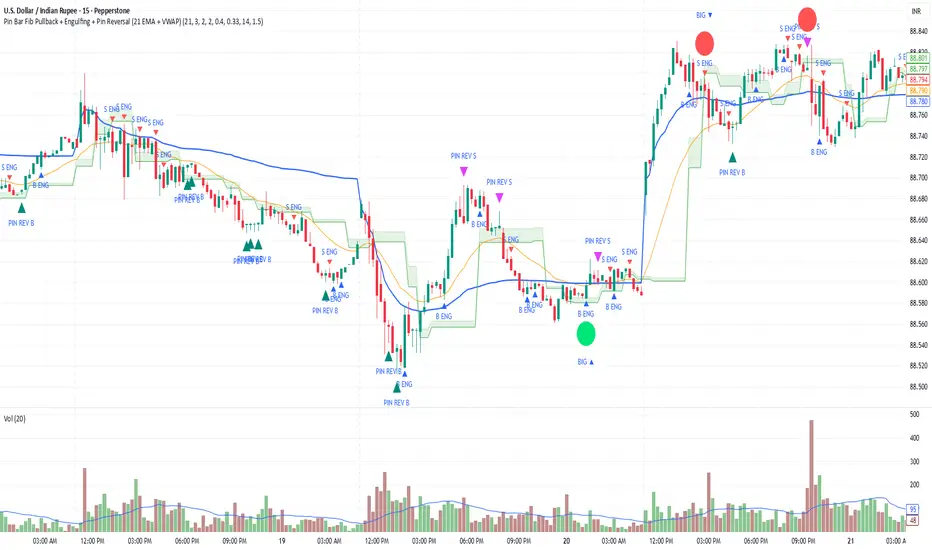
Pin Bar Fib Pullback + Engulfing + Pin Reversal (21 EMA + VWAP)Dear Traders
Pin bar fib pullback continuation (in 0.50–0.618 zone)
Bullish/Bearish engulfing
Pin bar reversals (bottom/top)
Then we ask: did the next candle move at least atrMult × ATR away from the signal close in the right direction?
For a long signal: next high ≥ signal close + ATR * atrMult
For a short signal: next low ≤ signal close − ATR * atrMult
If yes, that signal gets a big circle with text:
BIG ▲ for long
BIG ▼ for short
drawn on the original signal bar (using offset = -1 trick).
You can tune how “big” you want:
Increase ATR length for smoother ATR
Increase ATR * (e.g., from 1.5 → 2.0) to only mark really strong moves.