Upside ReversalsUpside reversal is noticed when a stock first dips below the prior week's low, then rallies in heavy trade to close either with a gain or with a much-reduced loss. Upside reversal can be identified with following condition:
A stock falls in heavy volume but bounces back, ending up for the day or week
OR
A stock falls in heavy volume but at least it finishes in the upper 60% of its trading range for the day or week
Upside reversal can be applied on day or week but if it is on weekly, it is a strong indication that institutions may be pumping money as they think stock is a bargain. This script is the approximate conversion of Richard Moglen's TC2000 scripts in TradingView. Search YouTube for his video on 'Upside Reversal'
This indicator, evaluates following conditions and print the arrow down label with percentage of reversal
Stoc(1,1) should be higher than 60%;
AND today's close is above 60% range;
AND today's low is lesser than yesterday;
AND Stoc(5,2,1) is lesser than 65
You can change inputs from Stoc(5,2,1) to Stoc(10,4,1) based on your need.
NOTE:
1) I still see some false positives so be aware of it.
2) It is absolutely possible to have an Upside reversal on down trend also. Please look for confirmation following day on the trend before act on it.
3) Volume level is not validated in the indicator, so you need to include it in the chart and check it.
4) This is still an experimental script & published for educational purpose only
Pesquisar nos scripts por "reversal"

Market Trading Tools - Trend ReversalsOur Trend Reversals indicator is there to notify you when a trend reversal (depending on your time frame) might occur.
Trend Reversals will signal a cross shape signal (X), that will be in red when a downfall might happen and will be in green when a movement up is about or might happen. The indicator algorithm is based on 3 indicators, when these three intersect, the signal will be fired once the condition is met.
** Our Indicator does not repaint.
** It can be used on any financial market; crypto, stocks or forex. We also encourage using time frames as the 15 minutes and above. The use of a higher than 4hr time frame requires special settings and once you have access to it, you can change the parameters as you want. We have enabled our users to freely use the settings as they wish and to their own discretion.
Once you are granted access to use it, add it from going into the scripts >> invite only scripts >> enable the indicator. Once the indicator is added to your chart you will see the indicator popping up on your chart.
We believe that we have not seen a similar indicator, and we are proud of our work and we will continue updating the indicator when we believe it is necessary according to market changes. We have also enabled a function for our users to get a better view of the trend when they add the indicator to their chart. You can now view the trend background color (red&green) depending on if the price is above the EMA of your choice. you can also check whichever time interval you want that does not limit you to the time interval chosen on your chart itself.
Hope you enjoy it, Good luck and stay safe!
** If you are interested in this indicator. please use the link below to obtain access to this indicator

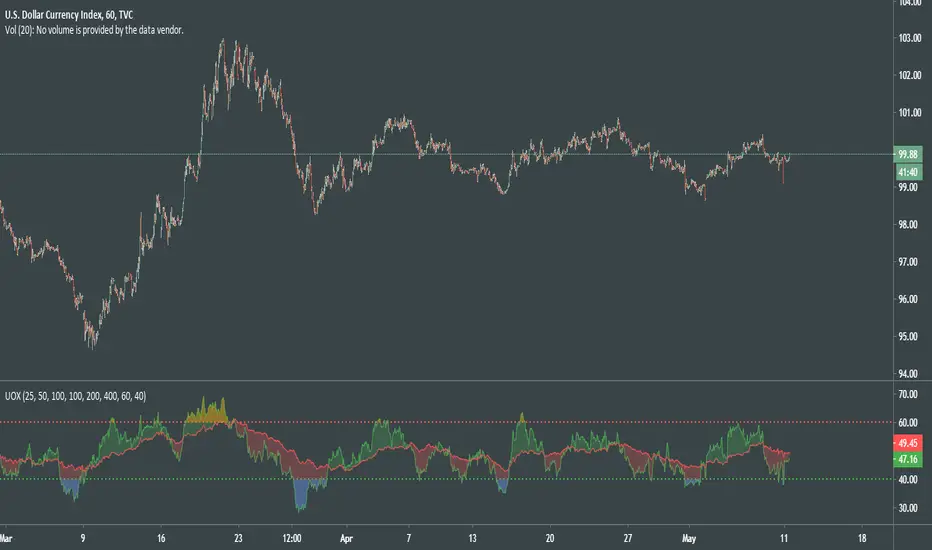
UO CrossThis particular UO Cross is evolved into far more flexible and visually intuitive oscillator than previous versions.
After thorough experiments with the code of indicator, I came to new deductions on how to use it properly for random TF and made it simpler.
How to read a chart using UOX:
Before uptrend takes place, we see the both indicator levels moving towards green dotted line (40).
When green UO index passes below 40, it's an alert that the market is about to interact to new demand levels, coloring it blue for a potential reversal.
Once green UO index is moving up and crossing above green dotted line - the second signal of uptrend established.
Another strong sign of uptrend is when green UO index passes above red UO index, coloring the space in between 2 indicators greenish.
At this point of time, we can be more confident that the general movement of the price is headed upwards, although we might see some small corrections there.
During uptrend Green UO index will fluctuate above red UO index.
Both indices will rise, getting closer and closer to red dotted line, which psychologically would be the first signs of the reversal of the uptrend.
When you see green UO index passing above red dotted line 60, coloring orangish, that's a serious alert for upcoming reversal.
I'll once more remind you that at this point of time both UO indices are at overbought levels, def above 50.
You know the situation is serious when you witness red UO index being very close to red dotted line!
To confirm the signals for downtrend, you must see green UO index go down and passing below red dotted line.
Second confirmation of downtrend is when green UO index crosses below red UO index, and colors the space in between indices red.
With this indicator we can understand:
Condition of the market
Early signs and alerts for reversal
Signals of entry
Confirmations of those signals
Visualized mass psychology behind domination of bulls / bears
It would be much better if you combine it with volume-based indicators.
Good luck!
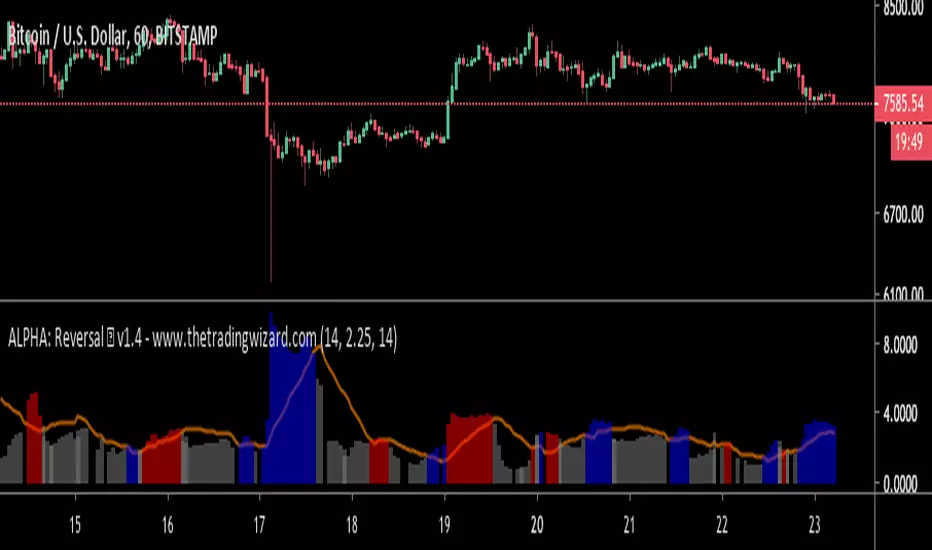
ALPHA: ReversalWhat is a divergence?
In the case of strength and momentum indicators, it is when the price deviates from the movement of the oscillator, it can have significant implications for trade management.
Divergences in an uptrend occurs when the price makes a higher high but the indicator does not. In a downtrend, divergence occurs when the price makes a lower low, but the indicator does not. When a divergence is spotted, there is a higher probability of a price reversal.
Divergences helps the trader recognize and react appropriately to a change in price action. It tells us something is changing and the trader must make a decision, such as tighten the stop-loss or take profit. Seeing divergences increases profitability by alerting the trader to protect profits or open a position.
Divergences indicate that something is changing, but it does not automatically mean the trend will reverse. It signals the trader must consider holding, tightening the stop loss, opening a position or take profit.
Introduction
The Alpha: Reversal is an indicator based off of the Stochastic, Relative Strength Index and Momentum indicator. Its sole purpose is to be able to identify divergences when they matter and identify high probability reversal areas. The formula used between the three indicators will be kept proprietary, in addition to the slight changes made on the Stochastic formula. The indicator plots the histogram with a divergence formula within a 14 period look-back on default. Additionally, there is a moving average of the histograms movement to identify the divergences when they matter.
Divergences exist on just about every candle, most of the time they are at a minuscule level. Rarely do the price and oscillator movement collude, the question becomes when do these divergences matter?
With that in mind I approached the task of finding a reliable reversal model. On default, the indicator has a moving average that measures the past histogram (the formula of the three indicators) movement to identify when a high potential trend shift may happen.
Keeping volatility in mind there is a feature called "Fixed Threshold" in settings. Various assets move at different speeds, so the indicator needs the ability to adjust to fit the assets speed. This "Threshold" option does not have a set of rules to use for each asset, the option is there though, so it may be adjusted by the analyst manually if the histogram moving average seems inaccurate due to volatility or lack thereof. In future publications (or possibly indicator updates) I plan on expanding on a fixed set of rules for various assets. This will take considerable time to research and backtest the various values needed for an asset's speed, so for now the default MA can be used until you are comfortable with adjusting the threshold level manually.
The look-back period on the histogram and threshold MA can be adjusted to whichever time period you would like. However, the default 14 is typically what is best considering the inputs of the three underlying indicators.
Analysis
The indicator is actually quite simple to read. When the price spikes blue, there is a high probability of reversal, same goes for red but in the opposite fashion. Now as always, you should use this indicator as an analysis tool and not rely on it by itself. Many times Cryptocurrencies couldn't care less about strength or oversold/overbought and volume explodes out of nowhere, I highly recommend you use price action in addition to Alpha: Exhaustion and Alpha: Volume with this tool. Oh wait, Alpha: Volume is not out yet.... SOON. :)
Point is, use proper analysis techniques with this indicator, nothing is perfect. NOTHING. But the Alpha: Reversal is a great tool to use for not only the beginner trader, but the advanced also. There is a ton of ways to use this indicator beyond the high probability reversal areas, I am discovering some really neat patterns within my new formula that I plan on expanding on in future publications, i.e. dead cat bounces and relief candles plus a few more.
Conclusion
The Alpha: Reversal is a great analysis tool that I now use on all my charts, as time goes on I plan on holding classes for its users on a regular basis to expand on the various techniques that can be implemented in addition to publishing research relevant to its purpose.
Access to the indicator can be purchased on my site www.thetradingwizard.com with either a monthly option for this & the Alpha: Exhaustion (), or a lifetime subscription independently. All updates and changes will be done automatically and included for every user. The Alpha series is designed to help you make your analysis easier to comprehend and more accurate, I really think this one will be enjoyed by many for years to come, I have enjoyed designing and using this immensely. As always, please make your own decisions when trading and use proper analysis techniques.
Note: The options within the Alpha: Reversal allow the indicator to be used on any timeframe & any asset. As with any indicator, the higher the timeframe, the higher the accuracy.
Disclaimer
Nothing in this post is to be used or construed as financial advice. This post is meant as an educational post to explain the functions of the indicator.
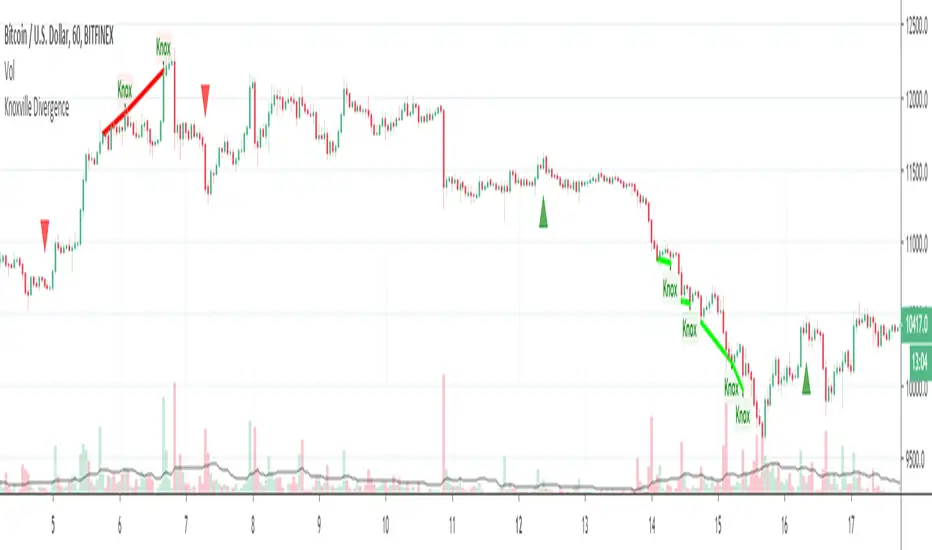
Knoxville DivergenceOverlays Knoxville Divergence on your Chart
These don't occur very often but when they do they are best used in conjunction with Rob Booker Reversal Tabs
PivotBoss Wick Reversal SetupPATTERN SUMMARY
1. The body is used to determine the size oftlle reversal wick. A wick tllat is between 2.5 to 3.5 times larger than
the size of the body is ideal.
2. For a bullish reversal wick to exist, tlle close ofthe bar should fall witllin tlle top 35 percent of the overall range
of the candle.
3. For a bearish reversal wick to exist, the close of the bar should fall within the bottom 35 percent of the overall
range of the candle.
PATTERN PSYCHOLOGY
Figure 2-4 shows several types of bullish and bearish reversal wick candlesticks that can all signal
profitable reversal opportunities in the market, especially if these patterns are paired with key pivot levels. In
traditional candlestick jargon, these particular candlesticks would have names ranging from hammer , hanging
man, inverted hammer , shooting star , gravestone doji , or dragonfly doji , depending on where the candle is
placed in a trend. Now you can see why I simply call these candlesticks wicks, or even tails. Instead of fumbling
over the proper naming of these candlesticks , I believe it is more important to know what these patterns
represent. What are they telling you?
Types of Candlestick Reversal Wicks
When the market has been trending lower then suddenly forms a reversal wick candlestick , the likelihood of
a reversal increases since buyers have finally begun to overwhelm the sellers. Selling pressure rules the decline,
but responsive buyers entered the market due to perceived undervaluation. For the reversal wick to open near the
high of the candle, sell off sharply intra-bar, and then rally back toward the open of the candle is bullish , as it
signifies that the bears no longer have control since they were not able to extend the decline of the candle, or the
trend. Instead, the bulls were able to rally price from the lows of the candle and close the bar near the top of its
range, which is bullish - at least for one bar, which hadn't been the case during the bearish trend (see Figure 2.5).
The Stages of a Reversal Wick
Stage 1 Stage 2 Stage 3
Essentially, when a reversal wick forms at the extreme of a trend, the market is telling you that the trend
either has stalled or is on the verge of a reversal. Remember, the market auctions higher in search of sellers, and
lower in search of buyers. When the market over-extends itself in search of market participants, it will find itself
out of value, which means responsive market participants will look to enter the market to push price back toward
an area of perceived value. This will help price find a value area for two-sided trade to take place. When the
market finds itself too far out of value, responsive market participants will sometimes enter the market with
force, which aggressively pushes price in the opposite direction, essentially forming reversal wick candlesticks .
This pattern is perhaps the most telling and common reversal setup, but requires steadfast confirmation in order
to capitalize on its power. Understanding the psychology behind these formations and learning to identify them
quickly will allow you to enter positions well ahead of the crowd, especially if you've spotted these patterns at
potentially overvalued or undervalued areas.

VDUB BB %B REVERSAL_v4.2 revised by JustUncleLThis is an revised Open Public version of Vdub Bollinger Band %B reversal indicator. This version includes optional Divergence Finder with selectable channel width, optional Market Session time highlighting and optional Binary Option expiry markers.

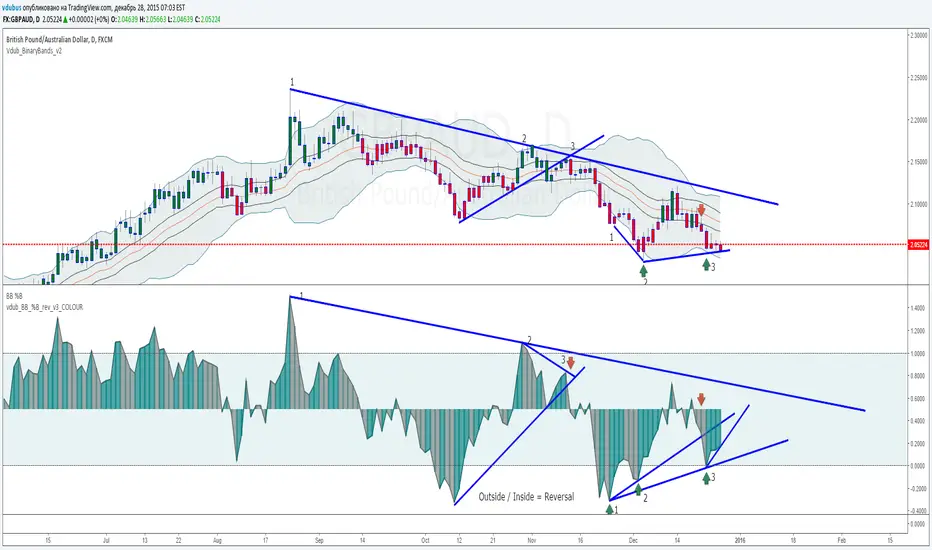
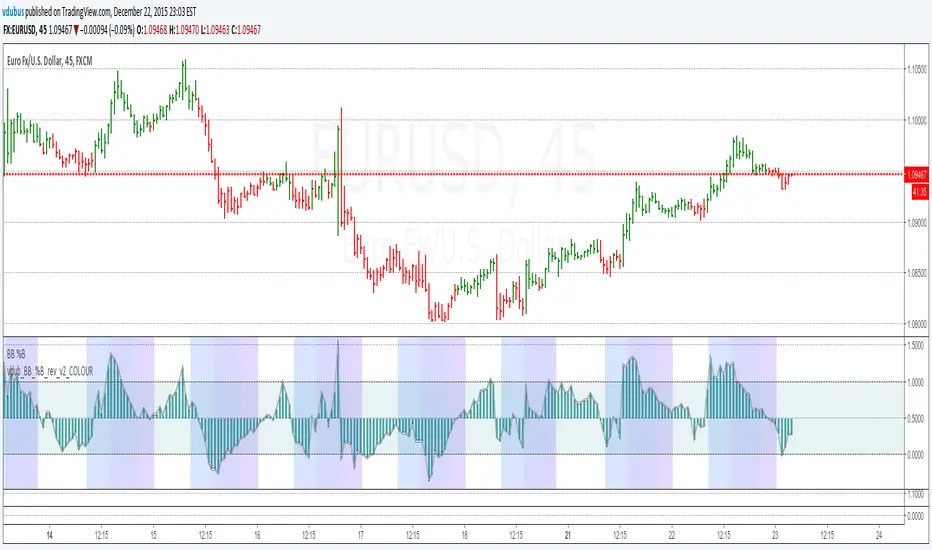
VDUB BB %B REVERSAL_v1VDUB BB %B REVERSAL_v1
* i am un able to highlight back ground, so I've merged std & custom together
std & on chart BB settings -
21 / 1.8

Supply & Demand - Trading Vidhyalaya (Free)A powerful script that automatically plots Supply and Demand zones on your chart. Designed to help traders identify potential reversal areas with precision.
Free Version Capabilities:
Works exclusively on the Daily (1D) Timeframe.
Includes Wick & Strong validation logic.
📍 Pinpoint accurate reversals.
🔔 Real-time alerts for Daily zones.
📉 "Touched" zone logic to keep your chart clean.
Want to use this on Intraday Charts? The Premium version supports ALL Timeframes (1m to Monthly) and includes Multi-Timeframe (MTF) overlay capabilities.

X-Trend Reversal (Lite version)🚀 X-TREND REVERSAL (LITE): Market Extremes Detector
X-Trend Reversal is a professional algorithm designed to identify high-probability trend inflection points. We have stripped away the "noise" to provide you with deterministic, clean execution signals.
Unlike standard lagging indicators, X-Trend analyzes market structure to find the exact moment a trend is exhausted, giving you the "Sniper Entry" advantage.
💎 KEY FEATURES:
🛡 Immutable Signals: Guaranteed Non-Repainting technology. What you see on historical data is exactly what happened in real-time. No disappearing signals.
🎯 High-Probability Setups: Advanced filtering logic eliminates false moves to pinpoint the most reliable counter-trend entry points.
🌍 Multi-Timeframe Scalability: Universal adaptation to the volatility of any asset class (Crypto, Forex, Indices) and any timeframe (from 15s scalping to 4H swing trading).
🏛 Institutional Confidence: Trade reversals with the clarity usually reserved for institutional desks.
📊 X-TREND ECOSYSTEM
This indicator is a powerful standalone tool, but it is designed to be part of a larger professional suite. For a comprehensive market view and deeper confluence analysis, we highly recommend pairing this tool with our X-Trend Dashboard and other advanced modules from the X-Trend series. Combining these tools provides a 360-degree view of market sentiment and liquidity.
🔒 HOW TO GET ACCESS (INVITE-ONLY)
This script is a closed-source proprietary tool. Access is granted exclusively through our official channels.
⛔ NOTE: Please do not ask for access in the comment section below. Use the links above for instant support and license activation.

SMC + OB + FVG + Reversal + UT Bot + Hull Suite – by Fatich.id🎯 7 INTEGRATED SYSTEMS:
✓ Mxwll Suite (SMC + Auto Fibs + CHoCH/BOS)
✓ UT Bot (Trend Signals + Label Management)
✓ Hull Suite (Momentum Analysis)
✓ LuxAlgo FVG (Fair Value Gaps)
✓ LuxAlgo Order Blocks (Volume Pivots) ⭐ NEW
✓ Three Bar Reversal (Pattern Recognition)
✓ Reversal Signals (Momentum Count Style)
⚡ KEY FEATURES:
• Smart Money Structure (CHoCH/BOS/I-CHoCH/I-BoS)
• Auto Fibonacci (10 customizable levels)
• Order Block Detection (Auto mitigation)
• Fair Value Gap Tracking
• Session Highlights (NY/London/Asia)
• Volume Activity Dashboard
• Multi-Timeframe Support
• Clean Label Management
🎨 PERFECT FOR:
• Smart Money Concept Traders
• Order Flow & Liquidity Analysis
• Support/Resistance Trading
• Trend Following & Reversals
• Multi-Timeframe Analysis
💡 RECOMMENDED SETTINGS:
Clean Charts: OB Count 3, UT Signals 3, FVG 5
Detailed Analysis: OB Count 5-10, All Signals
Scalping: Low sensitivity, Hull 20-30
Swing Trading: High sensitivity, Hull 55-100

st reversal detector" Highly accurate reversal-detection algorithm that identifies market reversals before they occur, focusing on early signals at swing highs and swing lows. The tool must work seamlessly with confluences such as RSI overbought/oversold levels, bullish or bearish divergence, and other reversal confirmations to filter only A+ setups. no lag, no repainting, and clear visual signals for intraday trading. The model should work exceptionally well on the 10-minute and 5-minute timeframes and be specifically optimized for XAUUSD m10 and ETH m5 timeframe ''

WSMR v3.9 — WhaleSplash → Mean Reversal
# WSMR v3.9 — WhaleSplash → Mean Reversal
*A Non-Repainting Impulse‑Reversal Engine for Systematic Futures Trading*
## Overview
WSMR v3.9 is a complete impulse → exhaustion → mean‑reversion framework designed for systematic intraday trading. It identifies high‑energy displacement events (“WhaleSplashes”), measures volatility structure, tracks VWAP deviation, and confirms reversals using RSI divergence, Z‑Score resets, SMA20 reclaim, and pivot-based structure.
All signals are non‑repainting and alerts fire on bar close.
---
## Core Components
### 1. WhaleSplash (Short Impulse Event)
Triggered when a candle meets displacement conditions:
- Large bar range vs ATR
- Minimum % move
- Volume expansion
- VWAP deviation (tick-based)
- Z‑Score oversold / RSI exhaustion
- Volatility-gated
### 2. Mean Reversal Long (MR)
Requires:
- RSI bullish divergence
- Z‑Score reset
- SMA20 reclaim
- Higher-low confirmation
### 3. First-Candle Confirmation (Optional)
- MR Confirm → first green after MR
- WS Confirm → first red after WS
- TTL window configurable
### 4. Asia Session Filter
Optional restriction to:
**23:00 → 09:00 UTC**
### 5. Volatility Monitor
Detects:
- Normal
- Wicky
- Spiky
- Extreme
### 6. WS Frequency Analytics
Rolling frequency calculation across:
- Bars / Days / Weeks / Months
---
## Status Panel (Top-Right)
Shows:
- Mode (Global / Asia-only)
- Timeframe + TTL
- WS frequency
- Volatility state
---
## Alerts
- WhaleSplash SHORT
- WhaleSplash LONG (MR)
- MR Confirm LONG
- WS Confirm SHORT
- Volatility Warning
---
## Notes
- Fully non‑repainting
- Stable bar-close logic
- Optimised for 1m–5m
- Works on futures, indices, metals, FX

Low-Volume Trend Reversal ProLow-Volume Trend Reversal Pro 的核心设计目标,是让交易者能更容易识别“低量变盘”与“高量趋势衰竭”这两类极其关键的市场信号。在趋势的发展过程中,最早发生变化的往往不是价格,而是成交量,也就是市场参与者的真实意愿。当量能突然变得极低时,通常意味着市场在当前价位已经不愿意继续推动趋势,无论是买方还是卖方都表现出明显的“无兴趣”,这种状态往往会发生在趋势进入末期、震荡前夕、反转开始之前。很多顶部和底部在价格上看起来依旧正常,但量能已经率先“退潮”,而这种低量行为正是行情准备改变方向的标志之一。通过对这些异常区域的高亮和标记,指标让交易者更早察觉趋势内部正在失去动力。
与低量信号相反,另一类值得高度关注的结构是“高量趋势结束”。极端高量看起来像是强势,但在趋势后半段,它往往代表的是趋势的耗尽、最后的冲刺或终结点。高量常出现在突破失败之前、反转前最后一跳、以及主力出货或吸引散户接盘的阶段。当市场在单一区域短时间内出现过高密度的成交,意味着大部分力量已经在此释放,后续难以再延续相同速度的趋势。这类高量行为往往不是趋势开始,而是趋势即将终结的信号。指标通过视觉化处理,将这些“过度活跃”的时刻从普通放量中区分出来,让交易者能更准确判断趋势是否仍然健康。
无论是极低量还是极高量,它们都揭示了“价格背后真实的交易意愿”。价格只是表面结果,而量能代表的是参与者是否愿意继续投入资金。当参与度下降时,趋势会在内部先断层;当参与度过度集中时,也往往意味着趋势已经走得太远。Low-Volume Trend Reversal Pro 的作用,就是把这种隐藏在价格背后的“真实态度变化”以最直观的方式呈现出来,而不是预测市场未来方向。对于使用趋势、结构、量价分析的交易者来说,它提供了一套稳定、客观的观察框架,让你在趋势即将结束时更及时警觉,也能在趋势健康时更有底气地持仓。
Low-Volume Trend Reversal Pro is designed with one goal in mind: to help traders identify two critical but often overlooked signals—low-volume reversal conditions and high-volume trend exhaustion. During the life cycle of a trend, volume often shifts earlier than price, revealing the true intentions of market participants before any visible price reaction. When volume collapses to unusually low levels, it often indicates that neither buyers nor sellers are willing to push the market further. This lack of commitment tends to appear near the end of a trend, ahead of consolidation phases, or before a reversal begins. Many tops and bottoms look completely normal on price, yet internally the market has already “gone quiet.” By highlighting these moments, the indicator helps traders detect fading momentum and weakening structure long before it becomes obvious to the crowd.
On the opposite end of the spectrum, extreme high-volume behavior can signal the exhaustion of a mature trend rather than strength. When participation becomes too concentrated within a short window, it often reflects the final push of buyers or sellers, peak activity, aggressive profit-taking, or even distribution to late participants. These high-volume spikes frequently appear right before failed breakouts, last-minute surges, or transition points into reversal. They do not represent healthy continuation but rather the final stage of an overextended move. The indicator visually distinguishes this type of abnormal activity from ordinary volume expansion, helping traders judge whether a trend is accelerating or burning out.
Both low-volume and high-volume signals offer insight into something price alone cannot reveal: the willingness of market participants to continue driving the trend. Price is only the final outcome; volume expresses actual intent. When participation fades, trends weaken internally before price reacts. When participation peaks excessively, the trend becomes unsustainable. Low-Volume Trend Reversal Pro does not predict future movements. Instead, it surfaces these underlying shifts in a clean and objective way, giving traders a clearer understanding of trend quality. For those who rely on structure, trend analysis, or volume-based decision-making, it adds a valuable layer of confirmation and helps improve timing around potential turning points.

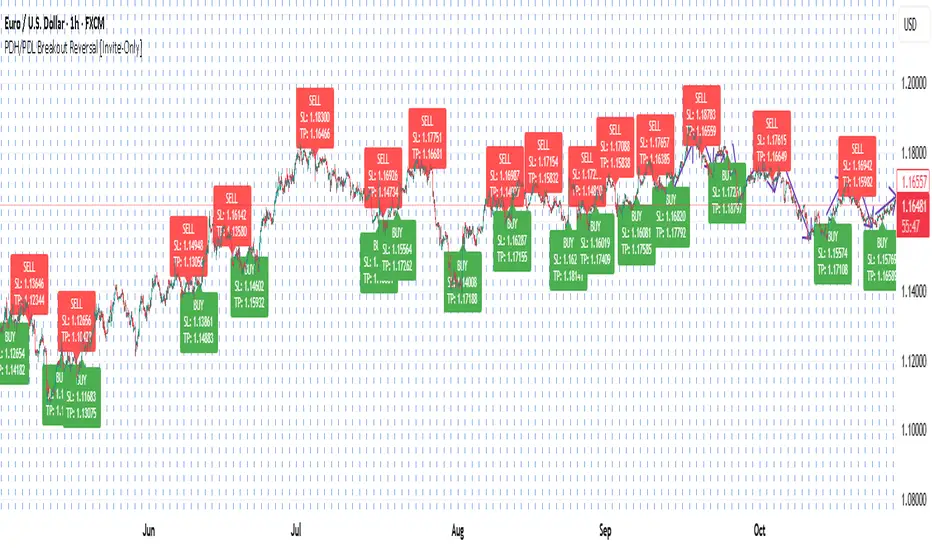
PDH/PDL Breakout Reversal [Invite-Only]Detects daily breakout reversals based on Previous Day High/Low structure.
Ideal for intraday reversals and continuation entries with built-in SL/TP visualization.
3SD BB Exhaustion + Bias Zone Reversal🚀 Exciting Update!
I’m thrilled to announce the release of the Premium Bollinger Band with Bias Zone Reversal Indicator!
The Bias Zone is a simple yet powerful concept that helps identify potential turning points in price with remarkable precision.
When combined with the 3 Standard Deviation Bollinger Band extremes, this upgraded tool delivers high-probability reversal signals—helping traders anticipate trend shifts before they happen.
📈 Whether you’re trading reversals or managing entries around exhaustion zones, this indicator gives you a clearer edge with structured, multi-timeframe insights.

BUY/SELL/R/BBuy/Sell/R/B by SeanKidd
Purpose: A clean, anchored signal system combining StochRSI crossovers, CVI top/bottom detection, and a MACD direction line that moves with price.
⚙️ How It Works
BUY / SELL – Generated from a higher-timeframe StochRSI crossover.
BUY (Green) → %K crosses above %D
SELL (Red) → %K crosses below %D
R (Reverse) – Yellow “R” appears above the candle when the CVI model detects a local top or exhaustion point.
B (Bottom) – Blue “B” appears below the candle when CVI detects a local bottom.
MACD Direction Line –
Green = MACD above Signal → bullish momentum
Red = MACD below Signal → bearish momentum
The line rides just above the candles, offset by ATR so it always tracks price.
🧭 How to Use It
Add the indicator:
Search for Buy/Sell/R/B by SeanKidd under Community Scripts.
Click ★ to favorite it.
Apply it to your chart.
Open ⚙️ Settings → Inputs
Calculation Timeframe (StochRSI) → pick how fast or slow you want signals (default Weekly).
MACD Line Offset (ATR ×) → raise or lower the MACD line if it overlaps candles.
Adjust Top/Bottom thresholds to control how often R/B appear.
Toggle Highlight bars or Color candles for visual clarity.
Go to Settings → Scales and ensure it’s set to
✅ “Scale with Price Chart” or
✅ same scale side as the candles.
This keeps everything perfectly attached to the chart.
Optional: Add alerts
Create → Alert → Condition → Buy/Sell/R/B by SeanKidd
Choose: SRSI BUY, SRSI SELL, Top (R), or Bottom (B).
📈 Reading the Chart
Marker Meaning Color Position
BUY StochRSI %K cross above %D Lime Below bar
SELL StochRSI %K cross below %D Red Above bar
R CVI-detected top / reversal Yellow Above bar
B CVI-detected bottom Blue Below bar
Line MACD momentum direction Green/Red Above highs
💡 Tips
Works on any symbol or timeframe.
Slower charts (Daily–Weekly) give cleaner swing signals.
Faster charts (15m–1h) show short-term reversals.
Combine the MACD line direction with BUY/SELL for stronger confirmation.

Statistical Price Deviation Index (MAD/VWMA)SPDI is a statistical oscillator designed to detect potential price reversal zones by measuring how far price deviates from its typical behavior within a defined rolling window.
Instead of using momentum or moving averages like traditional indicators, SPDI applies robust statistics - a rolling median and Mean Absolute Deviation (MAD) - to calculate a normalized measure of price displacement. This normalization keeps the output bounded (from −1 to +1 by default), producing a stable and consistent oscillator that adapts to changing volatility conditions.
The second line in SPDI uses a Volume-Weighted Moving Average (VWMA) instead of a simple price median. This creates a complementary oscillator showing statistically weighted deviations based on traded volume. When both oscillators align in their extremes, strong confluence reversal signals are generated.
How It Works
For each bar, SPDI calculates the median price of the last N bars (default 100).
It then measures how far the current bar’s midpoint deviates from that rolling median.
The Mean Absolute Deviation (MAD) of those distances defines a “normal” range of fluctuation.
The deviation is normalized and compressed via a tanh mapping, keeping the oscillator in fixed boundaries (−1 to +1).
The same logic is applied to the VWMA line to gauge volume-weighted deviations.
How to Use
The blue line (Price MAD) represents pure price deviation.
The green line (VWMA Disp) shows the volume-weighted deviation.
Overbought (red) zones indicate statistically extreme upward deviation -> potential short-term overextension.
Oversold (green) zones indicate statistically extreme downward deviation -> potential rebound area.
Confluence signals (both lines hitting the same extreme) often mark strong reversal points.
Settings Tips
Lookback length controls how much historical data defines “normal” behavior. Larger = smoother, smaller = more sensitive.
Smoothing (RMA length) can reduce noise without changing the overall statistical logic.
Output scale can be set to either −1..+1 or 0..100, depending on your visual preference.
Alerts and color fills are fully customizable in the Style tab.
Summary:
SPDI transforms raw price and volume data into a statistically bounded deviation index. When both Price MAD and VWMA Disp reach joint extremes, it highlights probable market turning points - offering traders a clean, data-driven way to spot potential reversals ahead of time.

AUTOMATIC ANALYSIS MODULE🧭 Overview
“Automatic Analysis Module” is a professional, multi-indicator system that interprets market conditions in real time using TSI, RSI, and ATR metrics.
It automatically detects trend reversals, volatility compressions, and momentum exhaustion, helping traders identify high-probability setups without manual analysis.
⚙️ Core Logic
The script continuously evaluates:
TSI (True Strength Index) → trend direction, strength, and early reversal zones.
RSI (Relative Strength Index) → momentum extremes and technical divergences.
ATR (Average True Range) → volatility expansion or compression phases.
Multi-timeframe ATR comparison → detects whether the weekly structure supports or contradicts the local move.
The system combines these signals to produce an automatic interpretation displayed directly on the chart.
📊 Interpretation Table
At every new bar close, the indicator updates a compact dashboard (bottom right corner) showing:
🔵 Main interpretation → trend, reversal, exhaustion, or trap scenario.
🟢 Micro ATR context → volatility check and flow analysis (stable / expanding / contracting).
Each condition is expressed in plain English for quick decision-making — ideal for professional traders who manage multiple charts.
📈 How to Use
1️⃣ Load the indicator on your preferred asset and timeframe (recommended: Daily or 4H).
2️⃣ Watch the blue line message for the main trend interpretation.
3️⃣ Use the green line message as a volatility gauge before entering.
4️⃣ Confirm entries with your own strategy or price structure.
Typical examples:
“Possible bullish reversal” → early accumulation signal.
“Compression phase → wait for breakout” → avoid premature trades.
“Confirmed uptrend” → trend continuation zone.
⚡ Key Features
Real-time auto-interpretation of TSI/RSI/ATR signals.
Detects both bull/bear traps and trend exhaustion zones.
Highlights volatility transitions before breakouts occur.
Works across all assets and timeframes.
No repainting — stable on historical data.
✅ Ideal For
Swing traders, position traders, and institutional analysts who want automated context recognition instead of manual indicator reading.

Outside the Bollinger Bands Alerting Indicator Overview
The Outside the Bollinger Bands Alerting Indicator is a comprehensive technical analysis tool that combines multiple proven
indicators into a single, powerful system designed to identify high-probability reversal patterns at Bollinger Band extremes. This
indicator goes beyond simple band touches to detect sophisticated pattern formations that often signal strong directional moves.
Key Features & Capabilities
🎯 Advanced Pattern Recognition
Bollinger Band Breakout Patterns
- Detects "pierce-and-reject" formations where price breaks through a Bollinger Band but immediately reverses back inside
- Identifies failed breakouts that often lead to strong moves in the opposite direction
- Combines multiple confirmation signals: engulfing candle patterns, MACD momentum, and ATR volatility filters
- Visual alerts with symbols positioned below (bullish) or above (bearish) candles
Tweezer Top & Bottom Patterns
- Identifies consecutive candles with nearly identical highs (tweezer tops) or lows (tweezer bottoms)
- Requires at least one candle to breach the respective Bollinger Band
- Confirms reversal with directional close requirements
- Customizable tolerance settings for pattern sensitivity
- Visual alerts with ❙❙ symbols for easy identification
📊 Multi-Indicator Integration
Bollinger Bands Indicator
- Dual-band configuration with outer (2.0 std dev) and inner (1.5 std dev) bands that can be adjusted to suit your own parameters
- Configurable MA types: SMA, EMA, SMMA (RMA), WMA, VWMA
- Customizable length, source, and offset parameters
- Color-coded band fills for visual clarity
Moving Average Suite
- EMA 9, 21, 50, and 200 (individually toggleable)
- Special "SMA 3 High" for help visualizing and detecting Bollinger Band break-outs
- Dynamic color coding based on price relationship
Optional Ichimoku Cloud overlay
- Complete Ichimoku implementation with customizable periods
- Dynamic cloud coloring based on trend direction
- Toggleable overlay that doesn't interfere with other indicators
🚨 Comprehensive Alert System
Real-Time JSON Alerts
- Sends structured data on every confirmed bar close
- Includes all indicator values: BB levels, EMAs, MACD, RSI
- Contains signal states and crossover conditions
- Perfect for automated trading systems and webhooks
{"timestamp":1753118700000,"symbol":"ETHUSD","timeframe":"5","price":3773.3,"bollinger_bands":{"upper":3826.95,"basis":3788.32,"lower":3749.68},"emas":{"ema_9":3780.45,"ema_21":3788.92,"ema_50":3800.79,"ema_200":3787.74,"sma_3_high":3789.45},"macd":{"macd":-10.1932,"signal":-11.3266,"histogram":1.1334},"rsi":{"rsi":40.5,"rsi_ma":39.32,"level":"neutral"}}
Specific Alert Conditions
- MACD histogram state changes (rising to falling, falling to rising)
- RSI overbought/oversold crossovers
- All pattern detections (BB Bounce, Tweezer patterns)
- Bollinger Band breakout alerts
🎨 Visual Elements
Pattern Identification
- ♻ symbols for Bollinger Band breakout patterns (green for bullish, red for bearish)
- ❙❙ symbols for tweezer patterns (green below for bottoms, red above for tops)
- Color-coded band fills for trend visualization
Chart Overlay Options
- All moving averages with distinct colors
- Bollinger Bands with inner and outer boundaries
- Optional Ichimoku cloud with trend-based coloring
Trading Applications
Reversal Trading
- Identify high-probability reversal points at extreme price levels
- Use failed breakout patterns for entry signals
- Combine multiple timeframes for enhanced accuracy
Trend Analysis
- Monitor moving average relationships for trend direction
- Use Ichimoku cloud for trend strength assessment
- Track momentum with MACD and RSI integration
Risk Management
- ATR-based volatility filtering reduces false signals
- Multiple confirmation requirements improve signal quality
- Real-time alerts enable prompt decision making
Suggested Use
- Use on multiple timeframes for confluence
- Combine with support/resistance levels for enhanced accuracy
- Set up alerts for hands-free monitoring
- Customize settings based on market volatility and trading style
- Consider volume confirmation for stronger signals

Reverse RSI Signals [AlgoAlpha]🟠 OVERVIEW
This script introduces the Reverse RSI Signals system, an original approach that inverts traditional RSI values back into price levels and then overlays them directly on the chart as dynamic bands. Instead of showing RSI in a subwindow, the script calculates the exact price thresholds that correspond to common RSI levels (30/70/50) and displays them as upper, lower, and midline bands. These are further enhanced with an adaptive Supertrend filter and divergence detection, allowing traders to see overbought/oversold zones translated into actionable price ranges and trend signals. The script combines concepts of RSI inversion, volatility envelopes, and divergence tracking to provide a context-driven tool for spotting reversals and regime shifts.
🟠 CONCEPTS
The script relies on inverting RSI math: by solving for the price that would yield a given RSI level, it generates real chart levels tied to oscillator conditions. These RSI-derived price bands act like support/resistance, adapting each bar as RSI changes. On top of this, a Supertrend built around the RSI midline introduces directional bias, switching regimes when the midline is breached. Regular bullish and bearish divergences are detected by comparing RSI pivots against price pivots, highlighting early reversal conditions. This layered approach means the indicator is not just RSI on price but a hybrid of oscillator translation, volatility-tracking midline envelopes, and divergence analysis.
🟠 FEATURES
Inverted RSI bands: upper (70), lower (30), and midline (50), smoothed with EMA for noise reduction.
Supertrend overlay on the RSI midline to confirm regime direction (bullish or bearish).
Gradient-filled zones between outer and inner RSI bands to visualize proximity and exhaustion.
Non-repainting bullish and bearish divergence markers plotted directly on chart highs/lows.
🟠 USAGE
Apply the indicator to any chart and use the plotted RSI price bands as adaptive support/resistance. The midline defines equilibrium, while upper and lower bands represent classic RSI thresholds translated into real price action. In bullish regimes (green candles), long trades are stronger when price approaches or bounces from the lower band; in bearish regimes (red candles), shorts are favored near the upper band. Divergence markers (▲ for bullish, ▼ for bearish) flag potential reversal points early. Traders can combine the band proximity, divergence alerts, and Supertrend context to time entries, exits, or to refine ongoing trend trades. Adjust smoothing and Supertrend ATR settings to match the volatility of the instrument being analyzed.
