[SHORT ONLY] Internal Bar Strength (IBS) Mean Reversion Strategy█ STRATEGY DESCRIPTION
The "Internal Bar Strength (IBS) Strategy" is a mean-reversion strategy designed to identify trading opportunities based on the closing price's position within the daily price range. It enters a short position when the IBS indicates overbought conditions and exits when the IBS reaches oversold levels. This strategy is Short-Only and was designed to be used on the Daily timeframe for Stocks and ETFs.
█ WHAT IS INTERNAL BAR STRENGTH (IBS)?
Internal Bar Strength (IBS) measures where the closing price falls within the high-low range of a bar. It is calculated as:
IBS = (Close - Low) / (High - Low)
- Low IBS (≤ 0.2) : Indicates the close is near the bar's low, suggesting oversold conditions.
- High IBS (≥ 0.8) : Indicates the close is near the bar's high, suggesting overbought conditions.
█ SIGNAL GENERATION
1. SHORT ENTRY
A Short Signal is triggered when:
The IBS value rises to or above the Upper Threshold (default: 0.9).
The Closing price is greater than the previous bars High (close>high ).
The signal occurs within the specified time window (between `Start Time` and `End Time`).
2. EXIT CONDITION
An exit Signal is generated when the IBS value drops to or below the Lower Threshold (default: 0.3). This prompts the strategy to exit the position.
█ ADDITIONAL SETTINGS
Upper Threshold: The IBS level at which the strategy enters trades. Default is 0.9.
Lower Threshold: The IBS level at which the strategy exits short positions. Default is 0.3.
Start Time and End Time: The time window during which the strategy is allowed to execute trades.
█ PERFORMANCE OVERVIEW
This strategy is designed for Stocks and ETFs markets and performs best when prices frequently revert to the mean.
The strategy can be optimized further using additional conditions such as using volume or volatility filters.
It is sensitive to extreme IBS values, which help identify potential reversals.
Backtesting results should be analyzed to optimize the Upper/Lower Thresholds for specific instruments and market conditions.
Pesquisar nos scripts por "reversal"

Overextension Oscillator [by DanielM]The Overextension Oscillator is an indicator that detects when a market move has extended significantly beyond its typical range, signaling potential areas for a correction or reversal. Unlike traditional oscillators that rely on fixed overbought/oversold levels, this tool dynamically adjusts its thresholds based on historical swing high and swing low movements.
By analyzing all swing points on the chart, the indicator determines the expected range of price movements and identifies when the price extends beyond normal levels. Since every asset has different price behavior and volatility, swing lengths may vary from asset to asset, ensuring that overextension is measured relative to each market's historical price behavior.
How It Works
1️⃣ Swing Detection & Data Collection
The indicator scans all available swing highs and swing lows on the chart to gather a complete dataset of past price fluctuations.
It records the percentage differences between swings to determine how much price typically moves in a given market.
2️⃣ Overextension Calculation
Using the stored swing data, the indicator calculates:
Average Swing Difference – Measures the average percentage difference between swings.
Average Move Percentage – Determines the typical magnitude of price moves within a trend cycle.
These values are used to create dynamic overextension thresholds that adjust based on historical data.
3️⃣ Price Distance & Overextension Measurement
The indicator calculates the distance between the current price and the closest historical swing point. If this distance exceeds the predefined threshold based on past swings, the move is considered overextended. The greater the deviation, the higher the probability of a pullback or short-term reversal.
4️⃣ Buy/Sell Signal Generation
A Buy signal is generated when the price has dropped below an overextended threshold relative to a past swing low.
A Sell signal is generated when the price has risen beyond an overextended threshold relative to a past swing high.
These signals indicate that the price has reached a level where it historically tends to slow down or reverse.

Internal Bar Strength (IBS) Strategy█ STRATEGY DESCRIPTION
The "Internal Bar Strength (IBS) Strategy" is a mean-reversion strategy designed to identify trading opportunities based on the closing price's position within the daily price range. It enters a long position when the IBS indicates oversold conditions and exits when the IBS reaches overbought levels. This strategy was designed to be used on the daily timeframe.
█ WHAT IS INTERNAL BAR STRENGTH (IBS)?
Internal Bar Strength (IBS) measures where the closing price falls within the high-low range of a bar. It is calculated as:
IBS = (Close - Low) / (High - Low)
- **Low IBS (≤ 0.2)**: Indicates the close is near the bar's low, suggesting oversold conditions.
- **High IBS (≥ 0.8)**: Indicates the close is near the bar's high, suggesting overbought conditions.
█ SIGNAL GENERATION
1. LONG ENTRY
A Buy Signal is triggered when:
The IBS value drops below the Lower Threshold (default: 0.2).
The signal occurs within the specified time window (between `Start Time` and `End Time`).
2. EXIT CONDITION
A Sell Signal is generated when the IBS value rises to or above the Upper Threshold (default: 0.8). This prompts the strategy to exit the position.
█ ADDITIONAL SETTINGS
Upper Threshold: The IBS level at which the strategy exits trades. Default is 0.8.
Lower Threshold: The IBS level at which the strategy enters long positions. Default is 0.2.
Start Time and End Time: The time window during which the strategy is allowed to execute trades.
█ PERFORMANCE OVERVIEW
This strategy is designed for ranging markets and performs best when prices frequently revert to the mean.
It is sensitive to extreme IBS values, which help identify potential reversals.
Backtesting results should be analyzed to optimize the Upper/Lower Thresholds for specific instruments and market conditions.

Edufx AMD~Accumulation, Manipulation, DistributionEdufx AMD Indicator
This indicator visualizes the market cycles using distinct phases: Accumulation, Manipulation, Distribution, and Reversal. It is designed to assist traders in identifying potential entry points and understanding price behavior during these phases.
Key Features:
1. Phases and Logic:
-Accumulation Phase: Highlights the price range where market accumulation occurs.
-Manipulation Phase:
- If the price sweeps below the accumulation low, it signals a potential "Buy Zone."
- If the price sweeps above the accumulation high, it signals a potential "Sell Zone."
-Distribution Phase: Highlights where price is expected to expand and establish trends.
-Reversal Phase: Marks areas where the price may either continue or reverse.
2. Weekly and Daily Cycles:
- Toggle the visibility of Weekly Cycles and Daily Cycles independently through the settings.
- These cycles are predefined with precise timings for each phase, based on your selected on UTC-5 timezone.
3. Customizable Appearance:
- Adjust the colors for each phase directly in the settings to suit your preferences.
- The indicator uses semi-transparent boxes to represent the phases, allowing easy visualization without obstructing the chart.
4. Static Boxes:
- Boxes representing the phases are drawn only once for the visible chart range and do not dynamically delete, ensuring important consistent reference points.

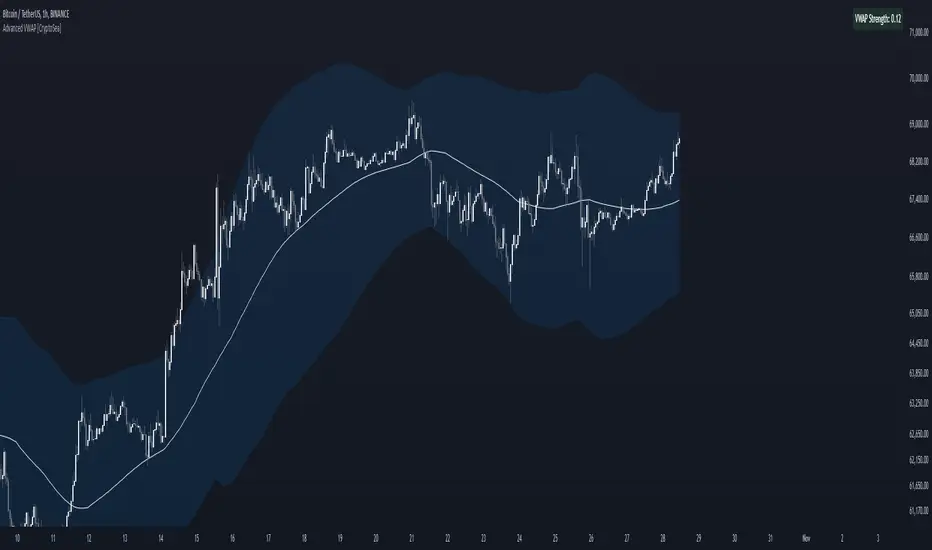
Advanced VWAP [CryptoSea]The Advanced VWAP is a comprehensive volume-weighted average price (VWAP) tool designed to provide traders with a deeper understanding of market trends through multi-layered VWAP analysis. This indicator is ideal for those who want to track price movements in relation to VWAP bands and detect key market levels with greater precision.
Key Features
Multi-Timeframe VWAP Bands: Includes multiple VWAP bands with different lookback periods (5, 10, 25, and 50), allowing traders to observe short-term and long-term price behavior.
Smoothed Band Options: Offers optional smoothing of VWAP bands to reduce noise and highlight significant trends more clearly.
Dynamic Median Line Display: Plots the median line of the VWAP bands, providing a reference for price movements and potential reversal zones.
VWAP Trend Strength Calculation: Measures the strength of the trend based on the price's position relative to the VWAP bands, normalized between -1 and 1 for easier interpretation.
In the example below we can see the VWAP Forecastd Cloud, which consists of multiple layers of VWAP bands with varying lookback periods, creating a dynamic forecast visualization. The cloud structure represents potential future price ranges by projecting VWAP-based bands outward, with darker areas indicating higher density and overlap of the bands, suggesting stronger support or resistance zones. This approach helps traders anticipate price movement and identify areas of potential consolidation or breakout as the price interacts with different layers of the forecast cloud.
How it Works
VWAP Calculation: Utilizes multiple VWAP calculations based on various lookback periods to capture a broad range of price behaviors. The indicator adapts to different market conditions by switching between short-term and long-term VWAP references.
Smoothing Algorithms: Provides the ability to smooth the VWAP bands using different moving average types (SMA, EMA, SMMA, WMA, VWMA) to suit various trading strategies and reduce market noise.
Trend Strength Analysis: Computes the trend strength based on the price's distance from the VWAP bands, with a value range of -1 to 1. This feature helps traders identify the intensity of uptrends and downtrends.
Alert Conditions: Includes alert options for crossing above or below the smoothed median line, as well as touching the smoothed upper or lower bands, providing timely notifications for potential trading opportunities.
This image below illustrates the use of smoothed VWAP bands, which provide a cleaner representation of the price's relationship to the VWAP by reducing market noise. The smoothed bands create a flowing cloud-like structure, making it easier to observe significant trends and potential reversal points. The circles highlight areas where the price interacts with the smoothed bands, indicating potential key levels for trend continuation or reversal. This setup helps traders focus on meaningful movements and filter out minor fluctuations, improving the identification of strategic entry and exit points based on smoother trend signals.
Application
Strategic Entry and Exit Points: Helps traders identify optimal entry and exit points based on the interaction with VWAP bands and trend strength readings.
Trend Confirmation: Assists in confirming trend strength by analyzing price movements relative to the VWAP bands and detecting significant breaks or touches.
Customized Analysis: Supports a wide range of trading styles by offering adjustable smoothing, band settings, and alert conditions to meet specific trading needs.
The Advanced VWAP by is a valuable addition to any trader's toolkit, offering versatile features to navigate different market scenarios with confidence. Whether used for day trading or longer-term analysis, this tool enhances decision-making by providing a robust view of price behavior relative to VWAP levels.
Adaptive SuperTrend Oscillator [AlgoAlpha]Adaptive SuperTrend Oscillator 🤖📈
Introducing the Adaptive SuperTrend Oscillator , an innovative blend of volatility clustering and SuperTrend logic designed to identify market trends with precision! 🚀 This indicator uses K-Means clustering to dynamically adjust volatility levels, helping traders spot bullish and bearish trends. The oscillator smoothly tracks price movements, adapting to market conditions for reliable signals. Whether you're scalping or riding long-term trends, this tool has got you covered! 💹✨
🔑 Key Features:
📊 Volatility Clustering with K-Means: Segments volatility into three levels (high, medium, low) using a K-Means algorithm for precise trend detection.
📈 Normalized Oscillator : Allows for customizable smoothing and normalization, ensuring the oscillator remains within a fixed range for easy interpretation.
🔄 Heiken Ashi Candles : Optionally visualize smoothed trends with Heiken Ashi-style candlesticks to better capture market momentum.
🔔 Alert System : Get notified when key conditions like trend shifts or volatility changes occur.
🎨 Customizable Appearance : Fully customizable colors for bullish/bearish signals, along with adjustable smoothing methods and lengths.
📚 How to Use:
⭐ Add the indicator to favorites by pressing the star icon. Customize settings to your preference:
👀 Watch the chart for trend signals and reversals. The oscillator will change color when trends shift, offering visual confirmation.
🔔 Enable alerts to be notified of critical trend changes or volatility conditions
⚙️ How It Works:
This script integrates SuperTrend with volatility clustering by analyzing ATR (Average True Range) to dynamically identify high, medium, and low volatility clusters using a K-Means algorithm . The SuperTrend logic adjusts based on the assigned volatility level, creating adaptive trend signals. These signals are then smoothed and optionally normalized for clearer visual interpretation. The Heiken Ashi transformation adds an additional layer of smoothing, helping traders better identify the market's true momentum. Alerts are set to notify users of key trend shifts and volatility changes, allowing traders to react promptly.

RSI DeviationAn oscillator which de-trends the Relative Strength Index. Rather, it takes a moving average of RSI and plots it's standard deviation from the MA, similar to a Bollinger %B oscillator. This seams to highlight short term peaks and troughs, Indicating oversold and overbought conditions respectively. It is intended to be used with a Dollar Cost Averaging strategy, but may also be useful for Swing Trading, or Scalping on lower timeframes.
When the line on the oscillator line crosses back into the channel, it signals a trade opportunity.
~ Crossing into the band from the bottom, indicates the end of an oversold condition, signaling a potential reversal. This would be a BUY signal.
~ Crossing into the band from the top, indicates the end of an overbought condition, signaling a potential reversal. This would be a SELL signal.
For ease of use, I've made the oscillator highlight the main chart when Overbought/Oversold conditions are occurring, and place fractals upon reversion to the Band. These repaint as they are calculated at close. The earliest trade would occur upon open of the following day.
I have set the default St. Deviation to be 2, but in my testing I have found 1.5 to be quite reliable. By decreasing the St. Deviation you will increase trade frequency, to a point, at the expense of efficiency.
Cheers
DJSnoWMan06

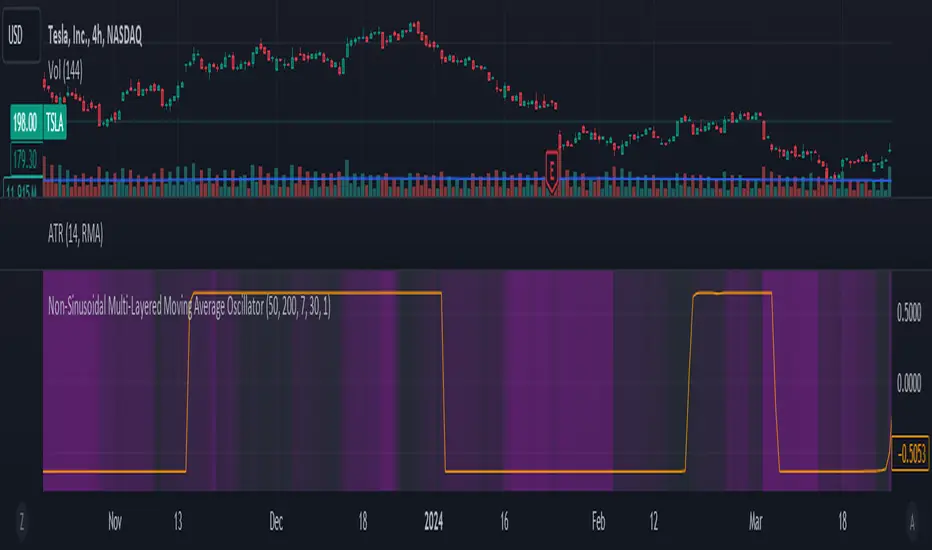
Non-Sinusoidal Multi-Layered Moving Average OscillatorThis indicator utilizes multiple moving averages (MAs) of different lengths their difference and its rate of change to provide a comprehensive view of both short-term and long-term market trends. The output signal is characterized by its non-sinusoidal nature, offering distinct advantages in trend analysis and market forecasting.
Combining the difference between two moving averages with the ROC allows to assess not only the direction and strength of the trend but also the momentum behind it. Transforming these signal in to non-sinusoidal output enhances its utility.
The indicator allows traders to select any one or more of seven moving average options. Larger timeframes (e.g., MA89/MA144) provide a broader identification of the overall trend, helping to understand the general market direction. Smaller timeframes (e.g., MA5/MA8) are more sensitive to price changes and can indicate better entry and exit points, aiding in the identification of retracements and pullbacks. By combining multiple timeframes, traders can get a comprehensive view of the market, enabling more precise and informed trading decisions.
Key Features:
Multiple Moving Averages:
The indicator calculates several exponential moving averages (EMAs) based on different lengths: MA5, MA8, MA13, MA21, MA34, MA55, MA89, and MA144.
These MAs are further smoothed using a secondary exponential moving average, with the smoothing length customizable by the user.
Percentage Differences:
The indicator computes the percentage differences between successive MAs (e.g., (MA5 - MA8) / MA8 * 100). These differences highlight the relative movement of prices over different periods, providing insights into market momentum and trend strength.
Short-term MA differences (e.g., MA5/MA8) are more sensitive to recent price changes, making them useful for detecting quick market movements.
Long-term MA differences (e.g., MA89/MA144) smooth out short-term fluctuations, helping to identify major trends.
Rate of Change (ROC):
The indicator applies the Rate of Change (ROC) to the percentage differences of the MAs. ROC measures the speed at which the percentage differences are changing over time, providing an additional layer of trend analysis.
ROC helps in understanding the acceleration or deceleration of market trends, indicating the strength and potential reversals.
Transformations:
The percentage differences undergo a series of mathematical transformations (either inverse hyperbolic sine transformation or inverse fisher transformation) to refine the signal and enhance its interpretability. These transformations include adjustments to stabilize the values and highlight significant movements.
checkbox allows users to select which mathematical transformations to use.
Non-Sinusoidal Nature:
The output signal of this indicator is non-sinusoidal, characterized by abrupt changes and distinct patterns rather than smooth, wave-like oscillations.
The non-sinusoidal signal provides clearer demarcations of trend changes and is more responsive to sudden market shifts.
This nature reduces the lag typically associated with sinusoidal indicators, allowing for more timely and accurate trading decisions.
Customizable Options:
Users can select which MA pairs to include in the analysis using checkboxes. This flexibility allows the indicator to adapt to different trading strategies, whether focused on short-term movements or long-term trends.
Visual Representation:
The indicator plots the transformed values on a separate panel, making it easy for traders to visualize the trends and potential entry or exit points.
Usage Scenarios:
Short-Term Trading: By focusing on shorter MAs (e.g., MA5/MA8), traders can capture quick market movements and identify short-term trends.
Long-Term Analysis: Utilizing longer MAs (e.g., MA89/MA144) helps in identifying major market trends.
Combination of MAs: The ability to mix different MA lengths provides a balanced view, helping traders make decisions based on both immediate price actions and overall market direction.
Practical Benefits:
Early Signal Detection: The sensitivity of short-term MAs provides early signals for potential trend changes, assisting traders in timely decision-making.
Trend Confirmation: Long-term MAs offer stable trend confirmation, reducing the likelihood of false signals in volatile markets.
Noise Reduction: The mathematical transformations and ROC applied to the percentage differences help in filtering out market noise, focusing on meaningful price movements.
Improved Responsiveness: The non-sinusoidal nature of the signal allows the indicator to react more quickly to market changes, providing more accurate and timely trading signals.
Clearer Trend Demarcations: Non-sinusoidal signals make it easier to identify distinct phases of market trends, aiding in better interpretation and decision-making.
Breakout Detector (Previous MTF High Low Levels) [LuxAlgo]The Breakout Detector (Previous MTF High Low Levels) indicator highlights breakouts of previous high/low levels from a higher timeframe.
The indicator is able to: display take-profit/stop-loss levels based on a user selected Win/Loss ratio, detect false breakouts, and display a dashboard with various useful statistics.
Do note that previous high/low levels are subject to backpainting, that is they are drawn retrospectively in their corresponding location. Other elements in the script are not subject to backpainting.
🔶 USAGE
Breakouts occur when the price closes above a previous Higher Timeframe (HTF) High or below a previous HTF Low.
On the advent of a breakout, the closing price acts as an entry level at which a Take Profit (TP) and Stop Loss (SL) are placed. When a TP or SL level is reached, the SL/TP box border is highlighted.
When there is a breakout in the opposite direction of an active breakout, previous breakout levels stop being updated. Not reaching an SL/TP level will result in a partial loss/win,
which will result in the box being highlighted with a dotted border (default). This can also be set as a dashed or solid border.
Detection of False Breakouts (default on) can be helpful to avoid false positives, these can also be indicative of potential trend reversals.
This indicator contains visualization when a new HTF interval begins (thick vertical grey line) and a dashboard for reviewing the breakout results (both defaults enabled; and can be disabled).
As seen in the example above, the active, open breakout is colored green/red.
You can enable the setting ' Cancel TP/SL at the end of HTF ', which will stop updating previous TP/SL levels on the occurrence of a new HTF interval.
🔶 DETAILS
🔹 Principles
Every time a new timeframe period starts, the previous high and low are detected of the higher timeframe. On that bar only there won't be a breakout detection.
A breakout is confirmed when the close price breaks the previous HTF high/low
A breakout in the same direction as the active breakout is ignored.
A breakout in the opposite direction stops previous breakout levels from being updated.
Take Profit/Stop Loss, partially or not, will be highlighted in an easily interpretable manner.
🔹 Set Higher Timeframe
There are 2 options for choosing a higher timeframe:
• Choose a specific higher timeframe (in this example, Weekly higher TF on a 4h chart)
• Choose a multiple of the current timeframe (in this example, 75 minutes TF on a 15 min chart - 15 x 5)
Do mind, that when using this option, non-standard TFs can give less desired timeframe changes.
🔹 Setting Win/Loss Levels
The Stop Loss (SL) / Take Profit (TP) setting has 2 options:
W%:L% : A fixed percentage is chosen, for TP and SL.
W:L : In this case L (Loss-part) is set through Loss Settings , W (Win-part) is calculated by multiplying L , for example W : L = 2 : 1, W will be twice as large as the L .
🔹 Loss Settings
The last drawing at the right is still active (colored green/red)
The Loss part can be:
A multiple of the Average True Range (ATR) of the last 200 bars.
A multiple of the Range Cumulative Mean (RCM).
The Latest Swing (with Length setting)
Range Cumulative Mean is the sum of the Candle Range (high - low) divided by its bar index.
🔹 False Breakouts
A False Breakout is confirmed when the price of the bar immediately after the breakout bar returns above/below the breakout level.
🔹 Dashboard
🔶 ALERTS
This publication provides several alerts
Bullish/Bearish Breakout: A new Breakout.
Bullish/Bearish False Breakout: False Breakout detected, 1 bar after the Breakout.
Bullish/Bearish TP: When the TP/profit level has been reached.
Bullish/Bearish Fail: When the SL/stop-loss level has been reached.
Note that when a new Breakout causes the previous Breakout to stop being updated, only an alert is provided of the new Breakout.
🔶 SETTINGS
🔹 Set Higher Timeframe
Option : HTF/Mult
HTF : When HTF is chosen as Option , set the Higher Timeframe (higher than current TF)
Mult : When Mult is chosen as Option , set the multiple of current TF (for example 3, curr. TF 15min -> 45min)
🔹 Set Win/Loss Level
SL/TP : W:L or W%:L%: Set the Win/Loss Ratio (Take Profit/Stop Loss)
• W : L : Set the Ratio of Win (TP) against Loss (SL) . The L level is set at Loss Settings
• W% : L% : Set a fixed percentage of breakout price as SL/TP
🔹 Loss Settings
When W : L is chosen as SL/TP Option, this sets the Loss part (L)
Base :
• RCM : Range Cumulative Mean
• ATR : Average True Range of last 200 bars
• Last Swing : Last Swing Low when bullish breakout, last Swing High when bearish breakout
Multiple : x times RCM/ATR
Swing Length : Sets the 'left' period ('right' period is always 1)
Colours : colour of TP/SL box and border
Borders : Style border when breakout levels stop being updated, but TP/SL is not reached. (Default dotted dot , other option is dashed dsh or solid sol )
🔹 Extra
Show Timeframe Change : Show a grey vertical line when a new Higher Timeframe interval begins
Detect False Outbreak
Cancel TP/SL at end of HTF
🔹 Show Dashboard
Location: Location of the dashboard (Top Right or Bottom Right/Left)
Size: Text size (Tiny, Small, Normal)
See USAGE/DETAILS for more information

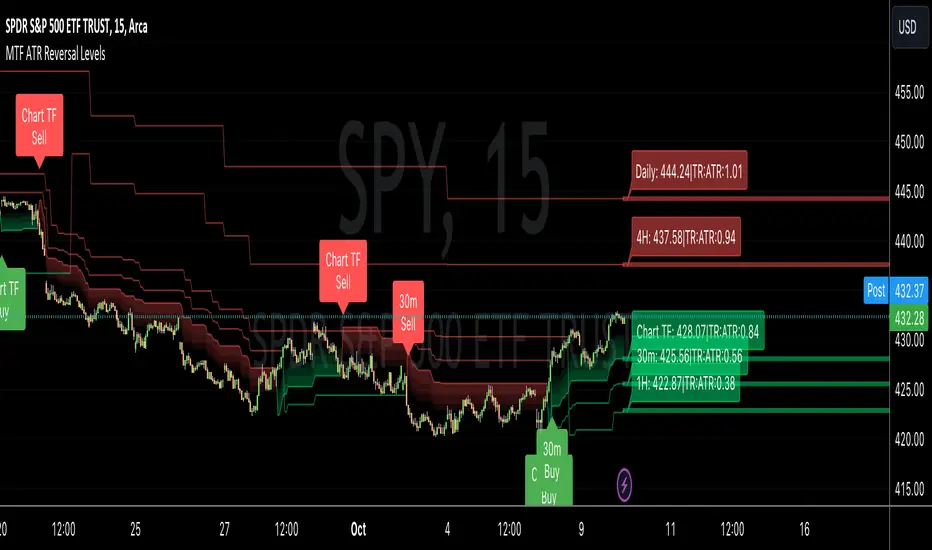
MTF ATR Reversal Levels (Open Source)
This is an open source version of the original I posted a couple of years ago.... Multitple TimeFrame Swingarm system borrowing from the Blackflag FTS indicator.
This throws up 5 resolutions of ATR thresholds, only showing the current bar level using a horizontal line across the full chart. I don't like the historical information charted, just need to know the current level for my trading purposes.
It will also give Sell/Buy alerts when the closing price exceeds one of those thresholds... essentially confirmation of a trend reversal.
On the primary resolution (defaulted to the current timeframe of the chart) it can show the fibonacci reversal levels using the ATR levels for that time resolution. This is if for the current trend.
I find it useful, so I thought I would share. Like all indicators, it'll work as long as you stick with a system, and let it work. :)
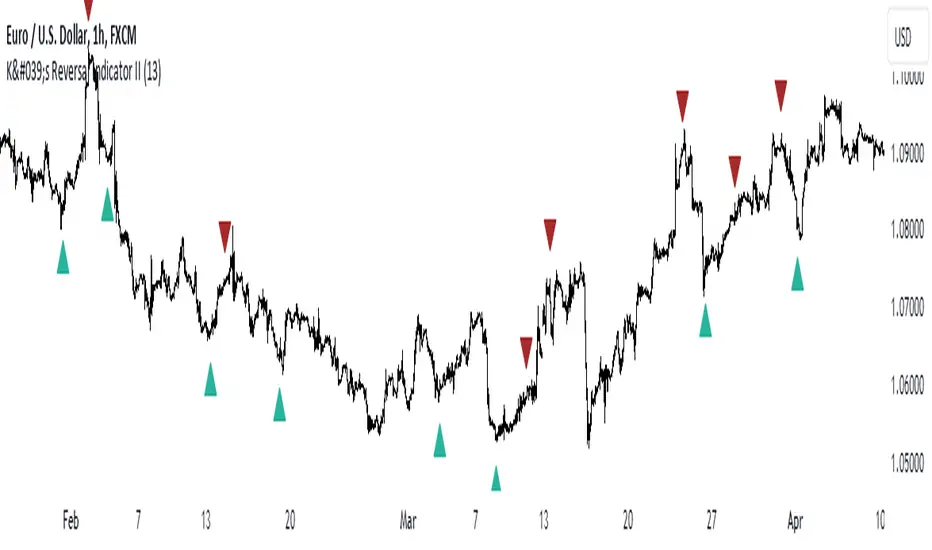
K's Reversal Indicator IIK’s Reversal Indicator II uses a moving average timing technique to deliver its signals. The method of calculation is as follows:
* Calculate a moving average (by default, a 13-period moving average).
* Calculate the number of times where the market is above its moving average. Whenever that number hits 21, a bearish signal is generated, and whenever that number if zero, a bullish signal is generated.
The indicator signals short-term to mid-term reversals as a mean-reversion move.
PinBar Detector [Mr_Zed]Pinbar Detector is a technical analysis tool designed to detect Pinbar patterns in financial markets. Pinbars are reversal patterns that indicate a potential change in trend.
This indicator is based on an existing Pinbar detector in MQ4/5 format, originally developed by "earnforex".
The PineScript version is written to work in TradingView, and can be applied to any chart to identify Pinbar formations. The indicator uses specific criteria to identify Pinbars, such as the length of the wick and the relationship between the wick and the body of the candlestick. By displaying the Pinbars on the chart, traders can make informed decisions about entering or exiting trades based on their analysis of the market's potential trend reversal.
enjoy !

FieryTrading: Buy The Dip - Sell The RipDear Tradingview community,
Today I want to share a very powerful, yet easy to use indicator with you. The indicator will find local tops or bottoms and will help you determine when it's a good time to trade a potential reversal.
How does it work?
The indicator makes use of the RSI to detect extremities and waits until the RSI reverses. Furthermore, a long-term moving average is used to determine whether we're in bullish or bearish market conditions. In bullish conditions the indicator will only go long, in bearish conditions the indicator will only go short.
How do I use it?
Favorite the indicator and apply it to your chart! You can add an alert to the indicator to receive a message once it has detected a good point for a reversal trade.
The indicator can be used on all assets and on all timeframes. Personally, I've found the 1 - 4 hourly timeframes to yield the best results.
Good luck!

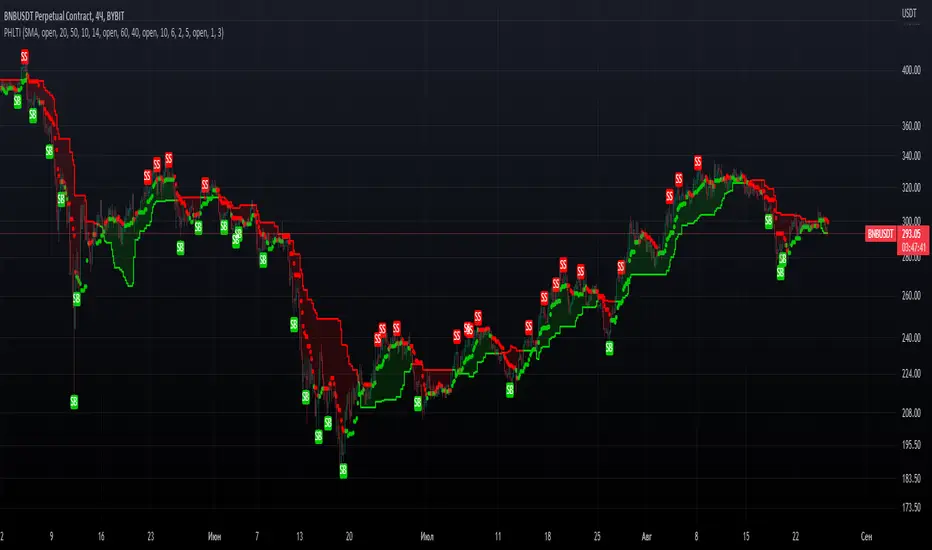
PrevHighLow Trend IndicatorPrevHighLow Trend Indicator which is calculated by using prev lowest and highest of p1 -period and p2 -period for two MAs.
First MA is made of prev highest of p1-period / prev lowest of p1-period.
Second MA is faster, made up of p2(<p1)- period(same formula).
Can be used in the next way: slower MA(straight line) shows main trend, faster shows temporary trend.
BUY, when first MA and second MA are green; Exit: second MA changes from green to red.
SELL, when first MA and second MA are red; Exit: second MA changes from red to green.
RSI Assistant basically filtres signals in the way, when signals from RSI and Faster MA are similar? it signals about it with labels: BUY for long, SELL for short. You can either enable or disable it. Also customizable so you can find your setup. RSI Assistant, depending on you customize it, can help you either follow trend or show reversals. Just find your own setup and watch things happen!
Feel free to leave valuable feedback and your setups which you consider to be good.
Hope you PHLTI usefull. Good luck!
50% Strat RetracementThe purpose of this script is to show/alert you when there is a 50% Strat Reversal. It works very well to find possible 3 candles.
The arrows, and line can be turned on and off.
You can change the 50% to say 45% so that you will be alerted before it actually hits the 50% retracement.
The script will only alert if the reversal is a 2up red candle, a 2up green candle which will hopefully turn into a 3 candle.

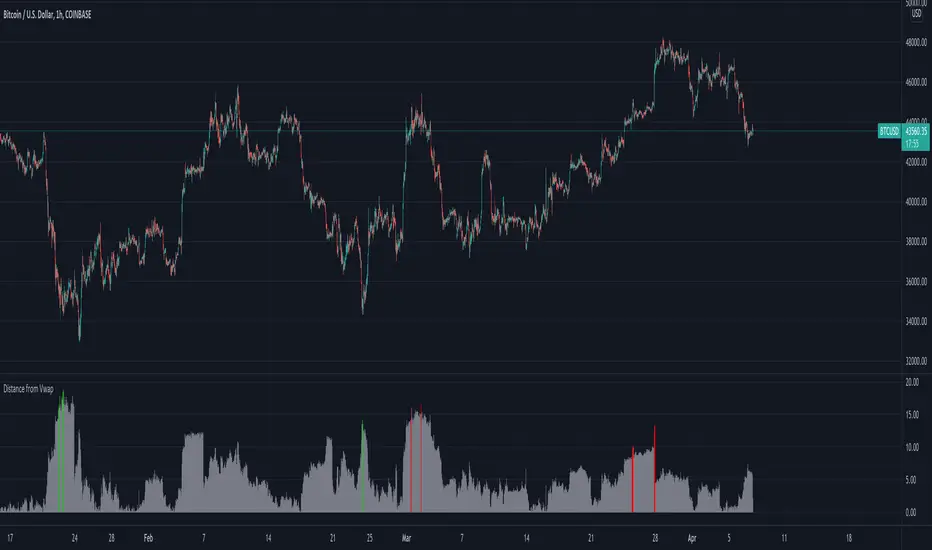
Distance from Vwap// How it Works \\
Measuring the distance of the close price from a higher timeframe VWAP - Volume Weighted Average Price
There is a threshold which is calculated by looking back at the previous x amount of bars and storing the highest/lowest values
If the distance from the vwap stretches above that threshold, the histogram will go green if price is above VWAP and red if its below the vwap
If the distance from the vwap reaches below the low threshold you will see the histogram flashes orange
// Settings \\
In the settings you have the ability to change what timeframe the indicator is calculated on, as well as this you can change the timeframe the VWAP is calculated on.
I always recommend using a higher timeframe vwap as they tend to me more respected
e.g on the hourly timeframe, I use the weekly VWAP, on 1 minute timeframe you may want to use 4 hour timeframe but obviously feel free to experiment
// Use Case \\
When histogram is flashing green, prices is pulling far away from the vwap, obviously you don't want to be buying a falling knife but if you have levels of confluence this can help spot reversals.
I personally wait until the first candle after its been green to get confirmation of the fall weakening. Vica versa for reds and shorts/sells.
When you see orange flashes, this shows that price has been consolidating and the price is very close to the higher time frame VWAP which could be considered a safe entry point as they tend to lead to a big move to follow
// Suggestions \\
Happy for anyone to make any suggestions on changes which could improve the script,
// Terms \\
Feel free to use the script, If you do use the script could you please just tag me as I am interested to see how people are using it. Good Luck!
Wick Reversal Hi the given strategy is based on detecting hammer and shooting star patterns to trade early reversals.

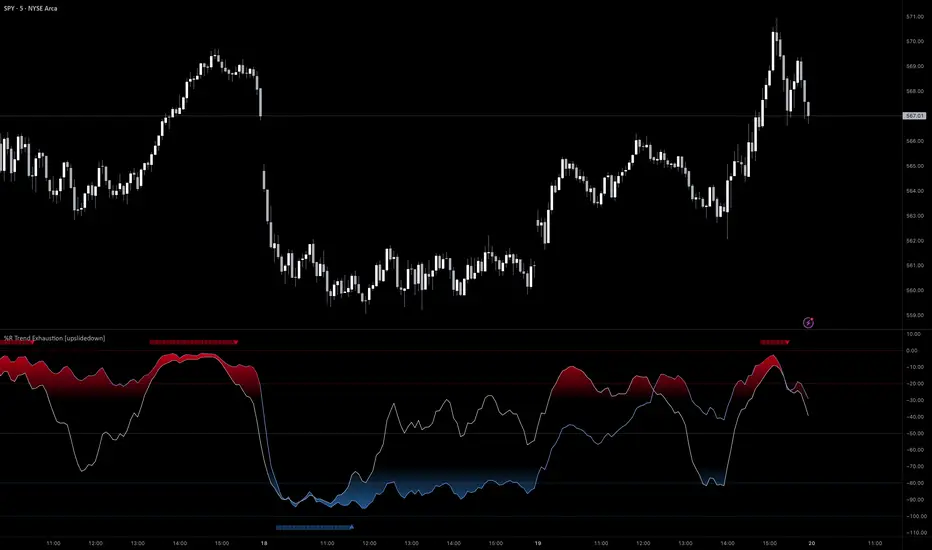
%R Trend Exhaustion [upslidedown]I love Williams %R! This indicator mixes two %R periods... a standard %R with a longer period %R. The longer period of 112 has interesting results for trend following strategies in the crypto market through backtesting.
Alone these are fairly ordinary but together they provide a very interesting trend exhaustion/reversal system while filtering out some noise. I have highlighted key areas of interest with filled boxes. An "area of interest" is when there is confluence between the short and long period %R values along with being overbought or oversold. Once there is a break in the overbought or oversold trend, an arrow will print.
This is one of my odder ideas that appears to have some merit and detects interesting tops or bottoms (or confirms a trend reversal) so I'm publicly publishing for the community to find. If you find this useful please reach out and let me know how you use it as it's fairly unique... and thus different than anything I've ever seen or used.
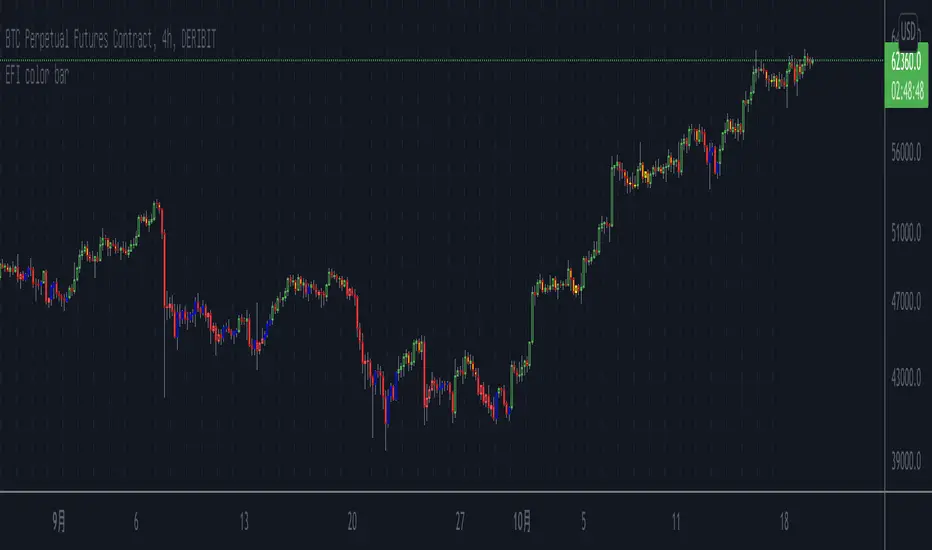
Elder's Force Index Color BarBased on the Elder's Force Index (EFI) , +/- of the EFI and its ema is used to describe the rise, fall or possible reversal of the market, and finally shown by bar color.
The green bar represents a strong bull and the red bar represents a strong bear;
The blue bar indicates that the downtrend is exhausted and may rise. Likewise the yellow bar.
Of course, it is difficult to buy the bottom and sell the top at any time. This indicator needs to be judged together with the pattern or other indicators that predict reversals in order to increase the win rate.
Happy Trading.
根据Elder's Force Index修改而成,取消了幅图指标,仅用bar color来表现上涨,下跌和转折。
绿色k线代表上涨动能充足,红色k线表示下跌动能充足;
蓝色k线表示下跌力竭,可能会上涨;
黄色k线表示上涨力竭,可能会下跌。
当然,任何时候抄底摸顶都是困难的,该指标需要和形态或者其他预测反转的指标一起判断才能增加成功率。
祝交易愉快。
緑は上昇トレンドで、赤は下落トレンドです;
青は下落が尽きて上昇する可能性があることを示すことで、黄色は上昇が終わり、下落の可能性があることを示しています。
成功率を高めるためには、パターンや反転を予測する他の指標と合わせて判断する必要があります。
Happy Trading。
Volume Pressure AnalysisVolume Pressure Analysis is a new concept I have been working on designed to show the effort required to move price. An ideal tool for confirming trends or locating reversals early. This indicator can highlight whale action and market manipulation. It calculates volume vs volatility and displays the results as a meter:
Above 0 shows how easy price action is traveling, the bigger these bars the less volume and effort is required to push price. These are indicated with a teal or red arrows and can confirm the beginning or continuation of a trend. This is the natural direction the chart wants to travel at that time.
Below 0 shows how hard price is to move. The bigger these bars the more volume and effort is required to push price. When whales and market makers push price against its will these bars will get bigger.
Yellow arrows signal pressure in that direction and excessive amounts of volume is required to move price. These signals can lead to reversal/ pivot points as price action struggles to continue its trend. These signals can be turned on in settings or use the overlay version of this script to display signals on chart. This is a very powerful tool when used with relative volume.

Center Of Gravity OscillatorThe COG Oscillator (center of gravity) is an indicator based on statistics and the Fibonacci golden ratio. It uses ALMA as a trigger and LSMA as "zero line". The trigger is set tight by default but can be tweaked by adjusting the window size and sigma in settings. This is a great indicator for setting up trades and spotting reversals. There are 2 main strategies that come with this indicator:
Strategy 1: Long positions are entered when current low point is higher than previous low. Short positions are entered as current high is lower than previous high. (Shown in image above)
Strategy 2 : If market is bullish long trades are entered as COG line crosses over red LSMA line. Traders have the option of scalping the first crossover or even scaling out of trade to close on second exit. This works the opposite for shorts when market is bearish.
Above shows different configurations of the indicator. Top shows length of 50, Middle has length of 21 and bottom is default 9.

Volatility OscillatorThis tool displays relative volatility and directional trend. Excellent way to pickup diversions and reversals. Length can be lowered to 11 or 13 in settings to show price range.
Can be used to identify patterns such as parallel channels and likely direction of price action as pictured below.

Turbulence reversalGiven that the market turbulence tends to cluster, I developed a turbulence moving average system to reveal the unseen underlying structure of the least resistance path for trend following.
Here, I used an SMA subset from the turbulence moving average system to determine the trend direction. This estimation is achieved by calculating the dynamic changes of SMA slope angle and distance between SMA. The former represents a possible reversal signal, and the latter shows the resistance from the intermediate-term SMA.
When the short-term slope angle crossovers the intermediate-term slope angle, the indicator will give a star sign, indicating a possible trend reversal.
Use this indicator together with the turbulence moving average system (Turbulence with direction).