Dual Session ORB S/R Lines Pro by Yendor_BShort description:
Clean opening-range breakout support/resistance lines for London and US sessions with confirmed breakout labels and alert-ready signals. UTC-based, adjustable start point, customizable styling, minimal clutter.
Detailed description:
What it does:
Captures the Opening Range (default first 15 minutes) for London and New York (US) sessions in UTC, plots the high and low as support/resistance lines, and marks confirmed breakouts when price closes beyond those levels. Lines can begin at either the range end or session start and persist for the configured session length.
Key Features:
ORB defined over the first N minutes after session open (configurable, default 15).
Two sessions: London and US (New York) with separate start times.
High/low support & resistance lines per session:
Selectable start point: Range End or Session Start.
Independently customizable color, width, and style (solid/dashed/dotted) for each high and low.
Confirmed breakout labels: only on the first candle that closes beyond the ORB high or low after the range completes (prior close must be inside).
Alerts and alertconditions for breakout long/short per session, usable in TradingView’s alert dialog.
Fully UTC-based. Works on any timeframe; 1-minute or 5-minute recommended for precision.
Minimal visual clutter; no persistent shaded boxes in this version.
Inputs explained:
ORB Duration (minutes): Length of the opening range used to calculate session high and low.
Session Length (hours): How long the S/R lines remain active (typically full session).
London / US Start (UTC): Session open times in UTC.
Line Start Point: Choose whether the lines begin at the range end or at the session start.
High/Low Styling: Independent color, thickness, and style for each session’s high and low.
Breakout Labels: Toggle one-time confirmed breakout annotations.
Alerts: Enable breakout alert messages.
Example workflows:
Monitor the first 15 minutes of the London session.
After the range, wait for a candle to close beyond the high or low for a confirmed breakout.
Use the label or alert to trigger entry logic (retest, continuation, etc.).
Repeat for the US session; compare overlaps for higher conviction.
Alert setup:
Open the Alerts panel. Choose one of the built-in alertconditions: London Breakout Long, London Breakout Short, US Breakout Long, US Breakout Short. Set frequency to Once Per Bar Close. Customize notification/webhook payload if automating.
Preset suggestions:
Standard London ORB: 15 minute range, lines from range end, green high / lime low.
Standard US ORB: 15 minute range, lines from range end, blue high / aqua low.
Overlap Bias: Both sessions active, lines start from session start, differentiated styles.
Tips & best practices:
Combine with external volume or volatility filters to reduce false breakouts. Use on correlated pairs to observe consistent session structure. Treat broken ORB levels as flipped support/resistance on revisit. Prefer confirmed closes beyond lines rather than wick touches.
Limitations / disclaimer:
Provides structural visualization and breakout signaling; does not guarantee profitability. Always apply proper risk management and confirm with additional context. Backtest settings before live use.
Tags:
#ORB #OpeningRangeBreakout #SessionTrading #LondonSession #NewYorkSession #SupportResistance #Breakout #Intraday #Pinev6 #TradingView #Forex #TrendStructure #Alerts #USD #EURUSD #TradingSignals #UTCBased #PriceAction #MarketStructure #IntradayBreakouts
Pesquisar nos scripts por "retest"

Fractal Support and Resistance [BigBeluga]🔵 OVERVIEW
The Fractal Support and Resistance indicator automatically identifies high-probability support and resistance zones based on repeated fractal touches. When a defined number of fractal highs or lows cluster around the same price zone, the indicator plots a clean horizontal level and shaded zone, helping traders visualize structurally important areas where price may react.
🔵 CONCEPTS
Fractal Points: Swing highs and lows based on user-defined left and right range (length). A valid fractal forms only when the center candle is higher or lower than its neighbors.
Zone Validation: A level is only confirmed when the price has printed the specified number of fractals (e.g., 3) within a narrow ATR-defined range.
Dynamic Zone Calculation: The plotted level can be based on the average of clustered fractals or on the extreme value (min or max), depending on the user’s choice.
Support/Resistance Zones: Once a zone is validated, a horizontal line and shaded box are drawn and automatically extended into the future until new valid clusters form.
Auto-Clean & Reactivity: Each zone persists until replaced by a new fractal cluster, ensuring the chart remains uncluttered and adaptive.
🔵 FEATURES
Detects swing fractals using adjustable left/right range.
Confirms zones when a defined number of fractals occur near the same price.
Plots horizontal level and shaded box for visual clarity.
Choice between average or min/max logic for level calculation.
Distinct color inputs for support (green) and resistance (orange) zones.
Adaptive auto-extension keeps valid zones projected into the future.
Displays optional triangle markers above/below bars where fractals form.
Clean design optimized for structural S/R analysis.
🔵 HOW TO USE
Use support zones (from low fractals) to look for potential long entries or bounce points .
Use resistance zones (from high fractals) to look for short setups or rejections .
Adjust the Fractals Qty to make zones more or less strict—e.g., 3 for higher reliability, 2 for quicker responsiveness.
Combine with liquidity indicators or break/retest logic to validate zone strength.
Toggle between average and min/max mode to fit your style (average for balance, extremes for aggression).
🔵 CONCLUSION
Fractal Support and Resistance offers a robust way to identify hidden levels that the market respects repeatedly. By requiring multiple fractal confirmations within a zone, it filters out noise and highlights clean structural areas of interest. This tool is ideal for traders who want automatic, adaptive, and reliable S/R levels grounded in raw market structure.

S&R Zones MTF (TechnoBlooms)S&R Zones MTF – Multi-Timeframe Support & Resistance Boxes
🔍 Overview
S&R Zones MTF is a professional-grade yet beginner-friendly indicator that dynamically plots Support & Resistance zones across multiple timeframes, helping traders recognize high-probability reversal areas, entry confirmations, and price reaction points.
This tool visualizes structured zones as colored boxes, allowing both new and experienced traders to analyze multi-timeframe confluence with ease and clarity.
🧠 What Is This Indicator?
S&R Zones MTF automatically detects the most significant support and resistance levels from up to four custom timeframes, using a configurable lookback period. These zones are displayed as colored horizontal boxes directly on the chart, making it easy to:
Spot where price has historically reacted
Identify potential reversal or breakout zones
Confirm entries with institutional-style precision
🛠️ Key Features
✅ Multi-Timeframe Zone Detection (up to 4 timeframes)
📦 Auto Plotted Boxes for Support (Blue) & Resistance (Pink)
🧱 Dynamic Height based on average price range or fixed input
🏷️ Timeframe Labels to instantly identify zone origin
🎛️ Customizable inputs: Lookback length, box color, height style
🔁 Real-time updates as price structure changes
🎓 Educational & Easy to Use
Whether you’re a new trader learning about price structure, or a professional applying institutional concepts, this tool offers an educational layout to understand:
How price respects historic zones
Why multi-timeframe zones offer stronger confluence
How to use zones for entry, exit, or risk placement
📈 How to Use (Multi-Timeframe Strategy)
Select Your Timeframes – Customize up to 4 higher timeframes (e.g., 1m, 5m, 15m, 1h).
Observe Overlapping Zones – When multiple timeframes agree, those zones are more significant.
Entry Confirmation – Wait for price to reach a zone, then look for reversal patterns (engulfing candle, pin bar, etc.)
Combine with Other Tools – Use alongside indicators like RSI, MACD, or Order Blocks for added confidence.
💡 Pro Tips
Zones from higher timeframes (1H, 4H) are often more powerful and reliable.
Confluence matters: If a 15m support zone aligns with a 1H support zone — that's a high-probability reaction area.
Use break-and-retest strategies with zone rejections for sniper entries.
Enable "Auto Height" for a more adaptive, volatility-based zone display.
🌟 Summary
S&R Zones MTF blends precision, clarity, and professional analysis into a visual structure that’s easy to understand. Whether you're learning support & resistance or optimizing your MTF edge — this tool will bring clarity to your charts and confidence to your trades.

Buyer/Seller Zone (Simplified Version)📌 Indicator: Buyer/Seller Zone (Simplified Version)
This indicator is designed to highlight potential areas of strong buyer or seller activity based on advanced volume and volatility analysis. It identifies key candles that exhibit anomalous behavior — those standing out from typical market noise — and marks them as potential interest zones.
🔍 What it does:
Detects candles with unusually high volume (anomalies).
Filters them further based on strong price movement (volatility).
Marks bullish and bearish zones using customizable visuals: area, circle, or diamond.
Provides optional alerts when a buyer/seller signal is detected.
💡 How to use:
Use this tool to identify potential reversal or continuation zones.
Zones may act as strong support/resistance areas.
Some levels are more significant than others — do not trade every level blindly. Combine with your own analysis or wait for a retest/confirmation before entry.
⚙️ Customization:
Volume filter threshold
Volatility sensitivity
Visualization type, size, and transparency
🚨 Alerts: Set alerts for bullish, bearish, or any signal type.

Impulse Alert - Supply (Sell) [Fixed]🟥 Supply Zone (Sell) – Institutional Order Block Detector
This custom indicator automatically detects valid Supply Zones (Sell Zones) based on Smart Money Concepts and institutional trading behavior.
🔍 How It Works:
Identifies strong bearish impulsive moves after price forms a potential Order Block
Valid supply zones are plotted after:
A valid rally–base–drop or drop–base–drop structure
A shift in structure or clear imbalance is detected
The zone is created from the last bullish candle before a strong bearish engulfing move
Zones remain on chart until price revisits and reacts
📊 Use Case:
Ideal for traders using Smart Money Concepts (SMC), Supply & Demand, or ICT-inspired strategies
Perfect for scalping, day trading, or swing setups
Designed for confluence with HTF bias and LTF execution
⚙️ Features:
Supply Zone auto-plotting
Customizable zone color and opacity
Alerts when price returns to the zone (retest entry opportunity)
🧠 Tip for Best Use:
Use in confluence with:
HTF Supply zones (manual or other indicator)
Market Structure breaks
Fair Value Gaps or Imbalance zones
Strong impulsive moves from HTF to LTF
🔁 Future Additions (Coming Soon):
Demand Zone detection
Zone strength rating system
Refined zone filters (volume, candle size, etc.)
Alerts for mitigation or invalidation
📌 Created by: Rohit Jadhav | Real-time market trader | YT/Insta - @GrowthByTrading
💬 Feedback? Drop a comment or connect via profile for updates and tutorials!

RSI Shift Zone [ChartPrime]OVERVIEW
RSI Shift Zone is a sentiment-shift detection tool that bridges momentum and price action. It plots dynamic channel zones directly on the price chart whenever the RSI crosses above or below critical thresholds (default: 70 for overbought, 30 for oversold). These plotted zones reveal where market sentiment likely flipped, helping traders pinpoint powerful support/resistance clusters and breakout opportunities in real time.
⯁ HOW IT WORKS
When the RSI crosses either the upper or lower level:
A new Shift Zone channel is instantly formed.
The channel’s boundaries anchor to the high and low of the candle at the moment of crossing.
A mid-line (average of high and low) is plotted for easy visual reference.
The channel remains visible on the chart for at least a user-defined minimum number of bars (default: 15) to ensure only meaningful shifts are highlighted.
The channel is color-coded to reflect bullish or bearish sentiment, adapting dynamically based on whether the RSI breached the upper or lower level. Labels with actual RSI values can also be shown inside the zone for added context.
⯁ KEY TECHNICAL DETAILS
Uses a standard RSI calculation (default length: 14).
Detects crossovers above the upper level (trend strength) and crossunders below the lower level (oversold exhaustion).
Applies the channel visually on the main chart , rather than only in the indicator pane — giving traders a precise map of where sentiment shifts have historically triggered price reactions.
Auto-clears the zone when the minimum bar length is satisfied and a new shift is detected.
⯁ USAGE
Traders can use these RSI Shift Zones as powerful tactical levels:
Treat the channel’s high/low boundaries as dynamic breakout lines — watch for candles closing beyond them to confirm fresh trend continuation.
Use the midline as an equilibrium reference for pullbacks within the zone.
Visual RSI value labels offer quick checks on whether the zone formed due to extreme overbought or oversold conditions.
CONCLUSION
RSI Shift Zone transforms a simple RSI threshold crossing into a meaningful structural tool by projecting sentiment flips directly onto the price chart. This empowers traders to see where momentum-based turning points occur and leverage those levels for breakout plays, reversals, or high-confidence support/resistance zones — all in one glance.

BornInvestor Gap Detector📈 BornInvestor Gap Detector
The BornInvestor Gap Detector is a powerful visual tool for identifying and analyzing price gaps on any chart. It automatically detects up and down gaps, highlights them with customizable boxes, and offers detailed labeling and alerting functionality.
🔍 Key Features:
Automatic Detection of bullish and bearish gaps based on customizable deviation settings.
Visual Highlighting of gaps using colored boxes with optional trail length limitation.
Gap Size Labels showing the percentage size of the gap, with the ability to display them only on the most recent N gaps.
Alerts for:
New gap appearance
Gap fully or partially closed
Price entering a gap zone (ideal for breakout/backfill strategies)
Customizable Colors for up/down gap borders and backgrounds.
Optional Message when no gaps are found on the current chart.
💡 Usefulness:
Gaps are an edge. They frequently act as support or resistance—especially on the first retest—when aligned with high-volume areas or other key price zones. Many strong stock moves begin with gaps, a concept central to strategies like Episodic Pivots.
This indicator helps you:
Identify gaps as potential entry zones on secondary setups
Quantify gaps via percentage size
Filter gaps based on size to suit your specific trading approach
Set alerts when price enters a gap or meets your custom criteria
Live Breakout Zones (No Repaint)The Live Breakout Zones indicator is a non-repainting, real-time breakout detection tool designed to help traders identify critical price breakouts as they happen — without lag and without repainting past signals.
This indicator scans recent price action to determine the highest high and lowest low over a user-defined lookback period. When price closes above the recent high or below the recent low, it immediately plots a breakout zone on the chart and provides a visual confirmation through labels and optional alerts.
🔍 Key Features:
✅ No Repainting – Signals are locked in as soon as a breakout happens; no future bar confirmation is needed.
⏱️ Minimal Lag – Reacts on breakout of recent range highs/lows without waiting for pivots or candle confirmation.
📦 Breakout Zones – Automatically draws colored rectangles showing the breakout level and zone width for clearer analysis.
🔔 Real-Time Alerts – Alerts for both bullish and bearish breakouts help you stay informed without watching the screen.
⚙️ Customizable – Adjustable lookback length, zone width, and color settings to match your strategy or chart style.
📈 Use Cases:
Identify key breakout moments for entry or retest zones.
Confirm breakout-based strategies in trending or consolidating markets.
Use zones for setting risk-reward areas, SL/TP levels, or re-entry planning.
⚙️ Settings:
Lookback Range (High/Low): Defines how many previous bars are checked for breakout levels.
Zone Width: Number of bars to extend the breakout box forward.
Bullish/Bearish Zone Color: Choose custom colors for breakout visualization.
🧠 Trading Tip:
Combine this tool with volume spikes, tail candles, or support/resistance for more reliable breakout setups.

cd_secret_candlestick_patterns_CxHi traders,
With this indicator, we aim to uncover secret candlestick formations that even advanced traders may miss—especially those that can't be detected by classic pattern indicators, unless you're a true master of candlestick patterns or candle math.
________________________________________
General Idea:
We'll try to identify candlestick patterns by regrouping candles into custom-sized segments that you define.
You might ask: “Why do I need this? I can just look at different timeframes and spot the structure anyway.” But it’s not the same.
For example, if you're using a 1-minute chart and add a higher-timeframe candle overlay (like 5-minute), the candles you see start at fixed timestamps like 0, 5, 10, etc.
However, in this indicator, we redraw new candles by grouping them from the current candle backward in batches of five.
These candles won't match the standard view—only when aligned with exact time multiples (e.g., 0 and 5 minutes) will they look the same.
In classic charts:
• You see 5-minute candles that begin every 0 and 5 minutes.
In this tool:
• You see a continuously updating set of 5 merged 1-minute candles redrawn every minute.
What about the structures forming in between those fixed timeframes?
That’s exactly what we’ll be able to detect—while also making the lower timeframe chart more readable.
________________________________________
Candle Merging:
Let’s continue with an example.
Assume we choose to merge 5 candles. Then the new candle will be formed using:
open = open
close = close
high = math.max(high , high , high , high , high)
low = math.min(low , low , low , low , low)
This logic continues backward on the chart, creating merged candles in groups of 5.
Since the selected patterns are made up of 3, 4, or 5 candles, we redraw 5 such merged candles to analyze.
________________________________________
Which Patterns Are Included?
A total of 18 bullish and bearish patterns are included.
You’ll find both widely known formations and a few personal ones I use, marked as (MeReT).
You can find the pattern list and visual reference here:
________________________________________
Entry and Filtering Suggestions:
Let me say this clearly:
Entering a trade every time a pattern forms will not make you profitable in the long run.
You need a clear trade plan and should only act when you can answer questions like:
• Where did the pattern appear?
• When and under what conditions?
It’s more effective to trade in the direction of the trend and look for setups around support/resistance, supply/demand zones, key levels, or areas confirmed by other indicators.
Whether you enter immediately after the pattern or wait for a retest is a personal choice—but risk management is non-negotiable.
One of the optional filters I’ve included is a Higher Timeframe (HTF) condition, which is my personal preference:
When enabled, the highest or lowest price among the pattern candles must match the high or low of the current HTF candle.
You can see in the image below the decrease in the number of detected patterns on the 1-minute chart when using no filter (blue labels) compared to when the 1-hour timeframe filter is applied (red labels).
Additionally, I’ve added a “protected” condition for engulfing patterns to help filter out weak classic engulf patterns.
________________________________________
Settings:
From the menu, you can configure:
• Number of candles for regrouping
• Distance between the last candle and newly drawn candles
• Show/hide options
• HTF filter toggle and timeframe selection
• Color, label placement, and text customization
• Pattern list (select which to display or trigger alerts for)
My preferred setup:
While trading on the 1-minute chart, I typically set the higher timeframe to 15m or 1H, and switch the candle count between 2 and 3 depending on the situation.
⚠️ Important note:
The “Show” and “Alert” options are controlled by a single command.
Alerts are automatically created for any pattern you choose to display.
________________________________________
What’s Next?
In future updates, I plan to add:
• Pattern success rate statistics
• Multi-broker confirmation for pattern validation
Lastly, keep in mind:
The more candles a pattern is based on, the more reliable it may be.
I'd love to hear your feedback and suggestions.
Cheerful trading! 🕊️📈
80% Rule Indicator (ETH Session + SVP Prior Session)I created this script to show the 80% opportunity on chart if setting lines up.
"80% rule: Open outside the vah or Val. Spend 30 mins outside there then break back inside spend 15 mins below or above depending which way u broke. Then come back and retest the vah/val and take it to the poc as a first target with the final target being the other Val/vah "
📌 Script Summary
The "80% Rule Indicator (ETH Session + SVP Prior Session)" overlays your chart with prior session value area levels (VAH, VAL, and POC) calculated from extended-hours 30-minute data. It tracks when the price reenters the value area and confirms 80% Rule setups during your chosen trading session. You can optionally trigger alerts, show/hide market sessions, and fine-tune line appearance for a clean, modular workflow.
⚙️ Options & Settings Breakdown
- Use 24-Hour Session (All Markets)
When checked, the indicator ignores time zones and tracks signals during a full 24-hour period (0000-0000), helpful if you're outside U.S. trading hours or want consistent behavior globally.
- Market Session
Dropdown to select one of three key market zones:
- New York (09:30–16:00 ET)
- London (08:00–16:30 local)
- Tokyo (09:00–15:00 local)
Used to gate entry signals during relevant hours unless you choose the 24-hour option.
- Show PD VAH/VAL/POC Lines
Toggle to show or hide prior day’s levels (based on the 30-min extended session). Turning this off removes both the lines and their white text labels.
- Extend Lines Right
When enabled, the VAH/VAL/POC lines extend into the current day’s session. If disabled, they appear only at their anchor point.
- Highlight Selected Session
Adds a soft blue background to help visualize the active session you selected.
- Enable Alert Conditions
Allows TradingView alerts to be created for long/short 80% Rule entries.
- Enable Audible Alerts
Plays an in-chart sound with a popup message (“80% Rule LONG” or “SHORT”) when signals trigger. Requires the chart to be active and sounds enabled in TradingView.

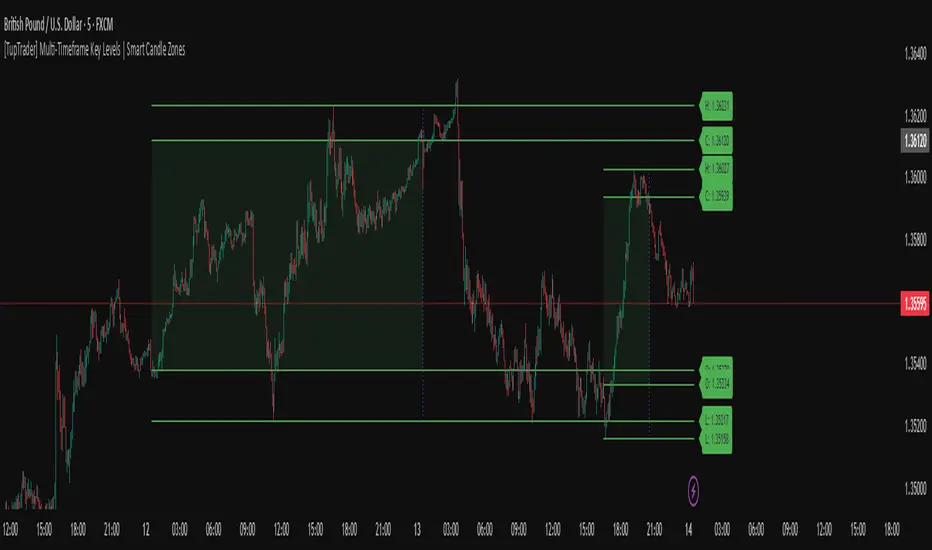
[TupTrader] Multi-Timeframe Key Levels | Smart Candle Zones
**Multi-Timeframe Key Levels | Smart Candle Zones**
Unlock the power of smart price levels with Multi-Timeframe Key Levels – a precision tool for traders who rely on higher timeframe structure.
🧠 This indicator automatically plots the key levels (Open, High, Low, Close) and optional body/fibonacci levels of the *previous candle* from two customizable higher timeframes, directly onto your lower timeframe chart.
💡 Recommended settings:
- 4H + Daily on 5-Minute Chart
- 8H + 1H on 1-Minute Chart
📈 Ideal for:
- Scalping around structure levels
- Day trading with HTF context
- Confirmation of breakout, retest, or rejection patterns
✅ Features:
- Dual reference timeframes
- Auto-adjusting line lengths
- Live price labels (e.g. H: 4321.50)
- Choice between body or Fibonacci zones
- Candle box visualization of HTF structure
🚨 Alerts:
- Alert when price touches any HTF key level
Lightweight and customizable, this tool is a must-have for intraday and structure-based traders.
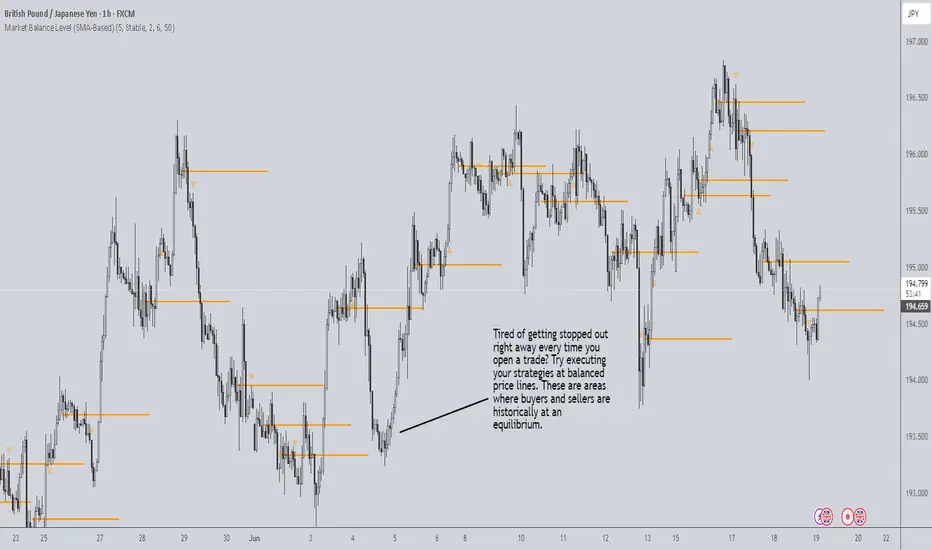
Market Balance LevelMarket Balance Level (MBL)
This indicator dynamically identifies price consolidation zones (market balance levels) and plots a horizontal line at the average midpoint of the range once a valid breakout occurs. It helps traders visualize key zones where the market was previously in equilibrium and is likely to retest before continuing its trend.
How It Works:
Detects consolidation ranges using consecutive candles within a tight high-low structure.
When a breakout occurs (above or below the range), it plots a line at the average midpoint of the consolidation.
Triangles are drawn on breakouts to visually confirm the breakout direction.
Lines can be customized by color, width, and breakout direction (bullish, bearish, or both).
Recommended Use:
Wait for price to return to the Market Balance Level (MBL). These levels often act as strong support or resistance.
Enter upon engulfment (candle closes strongly in the direction of the breakout), confirming continuation.
Features:
Adjustable consolidation sensitivity and line length.
Option to show/hide bullish or bearish MBLs.
Visual breakout markers (triangles) with alert support.
Optional alert messages for breakout events.
Use this tool to enhance your structure-based or SMC-style trading strategies.
Golden Crossover Momentum Check📊 Golden Cross Momentum Screener — Summary
🔍 What It Does
This indicator identifies Golden Cross events — where the 50 EMA crosses above the 200 EMA, signaling a potential long-term trend reversal — and evaluates the momentum strength to help determine whether price is likely to:
Surge immediately (Group B), or
Retrace first (Group A)
It uses 5 momentum-confirming conditions to score the quality of the breakout and display a single label on the chart with a classification.
✅ Momentum Conditions Validated
RSI > 60 and rising – Indicates bullish buying pressure
MACD Histogram > 0 and rising – Confirms increasing momentum
Volume > 2× 20-day average – Validates participation on the breakout
ADX > 25 – Measures trend strength
Price is >5% above 200 EMA – Confirms price extension above long-term trend
Each passing condition adds 1 point to the momentum score (0–5).
📈 How to Use
Watch for a Golden Cross signal (triangle appears below candle)
If momentum score ≥ 4, the script labels the setup as:
"🚀 Surge Likely (Group B)" — consider immediate breakout entries
If score is 2–3, labeled:
"🔄 Pullback Likely (Group A)" — expect retest/consolidation before continuation
If score < 2, labeled:
"❌ No Momentum Confirmed" — avoid or wait for confirmation

Forex Session Levels + Dashboard (AEST)This is a script showing all the key levels you will ever need for the breakout and retest strategy.
Follow my IG:
@liviupircalabu10

Curved Trend Channels (Zeiierman)█ Overview
Curved Trend Channels (Zeiierman) is a next-generation trend visualization tool engineered to adapt dynamically to both linear and non-linear market behavior. It introduces a novel curvature-based channeling system that grows over time during trending conditions, mirroring the natural acceleration of price trends, while simultaneously leveraging adaptive range filtering and dual-layer candle trend logic.
This tool is ideal for traders seeking smooth yet reactive dynamic channels that evolve with market structure. Whether used in curved mode or traditional slope mode, it provides exceptional clarity on trend transitions, volatility compression, and breakout development.
█ How It Works
⚪ Adaptive Range Filter Foundation
The core of the system is a volatility-based range filter that determines the underlying structure of the bands:
Pre-Smoothing of High/Low Data – Highs and lows are smoothed using a selectable moving average (SMA, EMA, HMA, KAMA, etc.) before calculating the volatility range.
Volatility Envelope – The range is scaled using a fixed factor (2.618) and further adjusted by a Band Multiplier to form the primary envelope around price.
Smoothed Volatility Curve – Final bands are stabilized using a long lookback, ensuring clean visual structure and trend clarity.
⚪ Curved Channel Logic
In Curved Mode, the trend channel grows over time when the trend direction remains unchanged:
Base Step Size (× ATR) – Sets the minimum unit of slope change.
Growth per Bar (× ATR) – Defines the acceleration rate of the channel slope with time.
Trend Persistence Recognition – The longer a trend persists, the more pronounced the slope becomes, mimicking real market accelerations.
This dynamic, time-dependent logic enables the channel to "curve" upward or downward, tracking long-standing trends with increasing confidence.
⚪ Trend Slope
As an alternative to curved logic, traders can activate a regular Trend slope using:
Slope Length – Determines how quickly the trend line adapts to price shifts.
Multiplicative Factor – Amplifies the sensitivity of the slope, useful in fast-moving markets or lower timeframes.
⚪ Candle Trend Confirmation
A robust second-layer trend detection method, the Candle Trend System evaluates directional pressure by analyzing smoothed price action:
Multi-tier Smoothing – Trend lines are derived from short-, medium-, and long-term candle movement.
█ How to Use
⚪ Trend Identification
When the Trend Line direction and Candle Colors are in agreement, this indicates strong, persistent directional conviction. Use these moments to enter with trend confirmation and manage risk more confidently.
⚪ Retest
During ongoing trends, the price will often pull back into the dynamic channel. Look for:
Support/resistance interactions at the upper or lower bands.
█ Settings
Scaled Volatility Length – Controls the historical depth used to stabilize the volatility bands.
Smoothing Type – Choose from HMA, KAMA, VIDYA, FRAMA, Super Smoother, etc. to match your asset and trading style.
Volatility MA Length – Smoothing length for the calculated range; shorter = more reactive.
High/Low Smoother Length – Additional smoothing to reduce noise from spikes or false pivots.
Band Multiplier – Widens or tightens the band range based on personal preference.
Enable Curved Channel – Toggle between curved or regular trend slope behavior.
Base Step (× ATR) – The starting point for curved slope progression.
Growth per Bar (× ATR) – How much the slope accelerates per bar during a sustained trend.
Slope – Reactivity of the standard trend line to price movements.
Multiplicative Factor – Sensitivity adjustment for HyperTrend slope.
Candle Trend Length – Lookback period for trend determination from candle structure.
-----------------
Disclaimer
The content provided in my scripts, indicators, ideas, algorithms, and systems is for educational and informational purposes only. It does not constitute financial advice, investment recommendations, or a solicitation to buy or sell any financial instruments. I will not accept liability for any loss or damage, including without limitation any loss of profit, which may arise directly or indirectly from the use of or reliance on such information.
All investments involve risk, and the past performance of a security, industry, sector, market, financial product, trading strategy, backtest, or individual's trading does not guarantee future results or returns. Investors are fully responsible for any investment decisions they make. Such decisions should be based solely on an evaluation of their financial circumstances, investment objectives, risk tolerance, and liquidity needs.

BAFD (Price Action For D.....s)🧠 Overview
This indicator combines multiple Moving Averages (MA) with visual price action elements such as Fair Value Gaps (FVGs) and Swing Points. It provides traders with real-time insight into trend direction, structural breaks, and potential entry zones based on institutional price behavior.
⚙️ Features
1. Multi MA Visualization (SMA & EMA)
- Plots short-, mid-, and long-term moving averages
- Fully customizable: MA type (SMA/EMA) and length per MA
- Dynamic color coding: green for bullish, red for bearish (based on close >/< MA)
2. Fair Value Gaps (FVG) Detection
Detects bullish and bearish imbalances using multiple logic types:
- Same Type: Last 3 candles move in the same direction
- Twin Close: Last 2 candles close in the same direction
- All: Shows all valid FVGs regardless of pattern
Gaps are marked with semi-transparent yellow boxes
Useful for identifying potential liquidity voids and retest zones
3. Swing Highs and Lows
- Automatically identifies major swing points
- Customizable sensitivity (strength setting)
Marked with subtle colored dots for structure identification or support/resistance mapping
📈 Use Cases
- Trend Identification: Visualize momentum on multiple timeframes
- Liquidity Mapping: Spot potential retracement zones using FVGs
- Confluence Building: Combine MA slope, FVG zones, and swing points for refined setups
🛠️ Customizable Settings
- Moving average type and length for each MA
- FVG logic selection and color
- Swing point strength
🔔 Note
This script does not generate buy/sell signals or alerts. It is designed as a visual decision-support tool for discretionary traders who rely on market structure, trend, and price action.

magic wand STSM"Magic Wand STSM" Strategy: Trend-Following with Dynamic Risk Management
Overview:
The "Magic Wand STSM" (Supertrend & SMA Momentum) is an automated trading strategy designed to identify and capitalize on sustained trends in the market. It combines a multi-timeframe Supertrend for trend direction and potential reversal signals, along with a 200-period Simple Moving Average (SMA) for overall market bias. A key feature of this strategy is its dynamic position sizing based on a user-defined risk percentage per trade, and a built-in daily and monthly profit/loss tracking system to manage overall exposure and prevent overtrading.
How it Works (Underlying Concepts):
Multi-Timeframe Trend Confirmation (Supertrend):
The strategy uses two Supertrend indicators: one on the current chart timeframe and another on a higher timeframe (e.g., if your chart is 5-minute, the higher timeframe Supertrend might be 15-minute).
Trend Identification: The Supertrend's direction output is crucial. A negative direction indicates a bearish trend (price below Supertrend), while a positive direction indicates a bullish trend (price above Supertrend).
Confirmation: A core principle is that trades are only considered when the Supertrend on both the current and the higher timeframe align in the same direction. This helps to filter out noise and focus on stronger, more confirmed trends. For example, for a long trade, both Supertrends must be indicating a bearish trend (price below Supertrend line, implying an uptrend context where price is expected to stay above/rebound from Supertrend). Similarly, for short trades, both must be indicating a bullish trend (price above Supertrend line, implying a downtrend context where price is expected to stay below/retest Supertrend).
Trend "Readiness": The strategy specifically looks for situations where the Supertrend has been stable for a few bars (checking barssince the last direction change).
Long-Term Market Bias (200 SMA):
A 200-period Simple Moving Average is plotted on the chart.
Filter: For long trades, the price must be above the 200 SMA, confirming an overall bullish bias. For short trades, the price must be below the 200 SMA, confirming an overall bearish bias. This acts as a macro filter, ensuring trades are taken in alignment with the broader market direction.
"Lowest/Highest Value" Pullback Entries:
The strategy employs custom functions (LowestValueAndBar, HighestValueAndBar) to identify specific price action within the recent trend:
For Long Entries: It looks for a "buy ready" condition where the price has found a recent lowest point within a specific number of bars since the Supertrend turned bearish (indicating an uptrend). This suggests a potential pullback or consolidation before continuation. The entry trigger is a close above the open of this identified lowest bar, and also above the current bar's open.
For Short Entries: It looks for a "sell ready" condition where the price has found a recent highest point within a specific number of bars since the Supertrend turned bullish (indicating a downtrend). This suggests a potential rally or consolidation before continuation downwards. The entry trigger is a close below the open of this identified highest bar, and also below the current bar's open.
Candle Confirmation: The strategy also incorporates a check on the candle type at the "lowest/highest value" bar (e.g., closevalue_b < openvalue_b for buy signals, meaning a bearish candle at the low, suggesting a potential reversal before a buy).
Risk Management and Position Sizing:
Dynamic Lot Sizing: The lotsvalue function calculates the appropriate position size based on your Your Equity input, the Risk to Reward ratio, and your risk percentage for your balance % input. This ensures that the capital risked per trade remains consistent as a percentage of your equity, regardless of the instrument's volatility or price. The stop loss distance is directly used in this calculation.
Fixed Risk Reward: All trades are entered with a predefined Risk to Reward ratio (default 2.0). This means for every unit of risk (stop loss distance), the target profit is rr times that distance.
Daily and Monthly Performance Monitoring:
The strategy tracks todaysWins, todaysLosses, and res (daily net result) in real-time.
A "daily profit target" is implemented (day_profit): If the daily net result is very favorable (e.g., res >= 4 with todaysLosses >= 2 or todaysWins + todaysLosses >= 8), the strategy may temporarily halt trading for the remainder of the session to "lock in" profits and prevent overtrading during volatile periods.
A "monthly stop-out" (monthly_trade) is implemented: If the lres (overall net result from all closed trades) falls below a certain threshold (e.g., -12), the strategy will stop trading for a set period (one week in this case) to protect capital during prolonged drawdowns.
Trade Execution:
Entry Triggers: Trades are entered when all buy/sell conditions (Supertrend alignment, SMA filter, "buy/sell situation" candle confirmation, and risk management checks) are met, and there are no open positions.
Stop Loss and Take Profit:
Stop Loss: The stop loss is dynamically placed at the upTrendValue for long trades and downTrendValue for short trades. These values are derived from the Supertrend indicator, which naturally adjusts to market volatility.
Take Profit: The take profit is calculated based on the entry price, the stop loss, and the Risk to Reward ratio (rr).
Position Locks: lock_long and lock_short variables prevent immediate re-entry into the same direction once a trade is initiated, or after a trend reversal based on Supertrend changes.
Visual Elements:
The 200 SMA is plotted in yellow.
Entry, Stop Loss, and Take Profit lines are plotted in white, red, and green respectively when a trade is active, with shaded areas between them to visually represent risk and reward.
Diamond shapes are plotted at the bottom of the chart (green for potential buy signals, red for potential sell signals) to visually indicate when the buy_sit or sell_sit conditions are met, along with other key filters.
A comprehensive trade statistics table is displayed on the chart, showing daily wins/losses, daily profit, total deals, and overall profit/loss.
A background color indicates the active trading session.
Ideal Usage:
This strategy is best applied to instruments with clear trends and sufficient liquidity. Users should carefully adjust the Your Equity, Risk to Reward, and risk percentage inputs to align with their individual risk tolerance and capital. Experimentation with different ATR Length and Factor values for the Supertrend might be beneficial depending on the asset and timeframe.

SMC ICT – Simplified Daily Trend & Reversal AnalyzerThis Pine Script provides a simplified approach to analyzing daily trends and potential reversals using concepts inspired by Smart Money Concepts (SMC) and ICT (Inner Circle Trader).
What It Does:
• Detects daily uptrend and downtrend conditions by comparing the current daily high/low to the previous day’s values.
• Highlights potential bullish or bearish reversal zones when price behavior suggests a shift in sentiment.
• Automatically draws dashed lines for the previous day's high and low.
• Labels these high/low levels for quick visual reference.
How to Use:
Apply this indicator to any timeframe chart. Use the plotted trend markers to assess daily direction and potential reversal signals. The dashed lines (previous high/low) can be used as reference points for liquidity zones or break/retest entries.
User Interface:
The indicator displays labels and shapes in English. This script is intended for educational and trading workflow enhancement purposes.
Note:
This is an open-source tool designed for clarity and basic SMC/ICT application. It is best used in combination with other confluences like FVGs, order blocks, and liquidity sweeps.

CANX Supply and Demand - Order Block - Candle Identification© CanxStixTrader
CANX Supply and Demand - Order Block - Candle Identification
Description
Designed as a visual aid, to highlight the last up or down candle before a fractal break. We can assume these candles where the point of origin that generated enough strength to break recent structure. By using them as reference points, traders are expected to follow their own set of rules and mark higher probability supply and demand zones in the area.
How to use:
Expect price to retest in these areas, and if they fail, a potential retest in the opposite direction . The greater the number of times a zone is tested, the more likely it is to break. A fresh zone that has not yet been tested will have a higher probability of a bounce.
Fractal period and candle break type can be customized in the settings. This works on all time frames.
**The indicator is set to my optimal settings for the 5 minute or 15 minute time frame** Please mess around to find your comfort zone and back test the results.
The lower the period number the more noise this creates on the market. The higher the number the less noise and more potential for a stronger zone.
Keep it simple
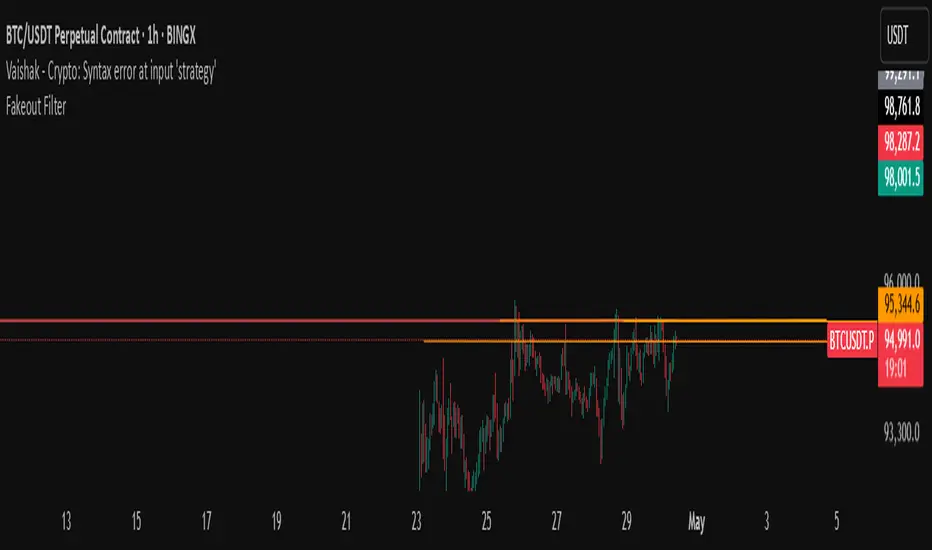
Fakeout Filter📈 Fakeout Filter by ARV
🔍 Overview:
The Fakeout Filter is a smart breakout validation tool designed to help traders avoid false breakouts and focus only on high-probability breakout trades. This indicator combines price action, volume analysis, RSI divergence detection, and OBV trend confirmation to filter out noise and improve your entries.
⚙️ Key Features:
✅ Breakout Detection
Detects when the price closes above a user-defined resistance level.
✅ Volume Spike Confirmation
Confirms breakouts only if there’s a significant increase in volume (customizable via settings).
✅ RSI Bearish Divergence Filter
Warns you of bearish RSI divergence, which often signals fakeouts during breakouts.
✅ OBV Trend Confirmation
Ensures On-Balance Volume (OBV) is rising, aligning volume flow with price movement.
✅ EMA Filter (Trend Confirmation)
Adds a safety filter using Exponential Moving Average (EMA) to ensure price action aligns with the short-term trend.
📌 How to Use:
Set Resistance Level:
In the indicator settings, input a key resistance level (manual input based on your chart analysis).
Watch for Signals:
A green background and “Breakout” label appear when:
Price closes above the resistance.
Volume is significantly higher than average.
OBV is rising.
No bearish RSI divergence is detected.
Price is above the EMA (trend confirmation).
Entry Suggestion:
Consider entering long positions only when the breakout label appears.
For additional confirmation, wait for a retest of the resistance as support before entering.
🔧 Settings:
Resistance Level – Manually set the level you're watching.
Volume Multiplier – Adjusts sensitivity to volume spikes (default: 1.5x average).
RSI Period – RSI used for divergence detection (default: 14).
EMA Period – For trend direction confirmation (default: 21).
✅ Best Use Cases:
Scalpers and intraday traders avoiding fakeouts on 5m–1H timeframes.
Swing traders validating breakout setups.
BTC, ETH, and major altcoins in consolidation or breakout zones.
⚠️ Disclaimer:
This tool is for educational purposes only. Always combine it with your own market analysis and risk management.
ICT Macro Zone Boxes w/ Individual H/L Tracking v3.1ICT Macro Zones (Grey Box Version
This indicator dynamically highlights key intraday time-based macro sessions using a clean, minimalistic grey box overlay, helping traders align with institutional trading cycles. Inspired by ICT (Inner Circle Trader) concepts, it tracks real-time highs and lows for each session and optionally extends the zone box after the session ends — making it a precision tool for intraday setups, order flow analysis, and macro-level liquidity sweeps.
### 🔍 **What It Does**
- Plots **six predefined macro sessions** used in Smart Money Concepts:
- AM Macro (09:50–10:10)
- London Close (10:50–11:10)
- Lunch Macro (11:30–13:30)
- PM Macro (14:50–15:10)
- London SB (03:00–04:00)
- PM SB (15:00–16:00)
- Each zone:
- **Tracks high and low dynamically** throughout the session.
- **Draws a consistent grey shaded box** to visualize price boundaries.
- **Displays a label** at the first bar of the session (optional).
- **Optionally extends** the box to the right after the session closes.
### 🧠 **How It Works**
- Uses Pine Script arrays to define each session’s time window, label, and color.
- Detects session entry using `time()` within a New York timezone context.
- High/Low values are updated per bar inside the session window.
- Once a session ends, the box is optionally closed and fixed in place.
- All visual zones use a standardized grey tone for clarity and consistency across charts.
### 🛠️ **Settings**
- **Shade Zone High→Low:** Enable/disable the grey macro box.
- **Extend Box After Session:** Keep the zone visible after it ends.
- **Show Entry Label:** Display a label at the start of each session.
### 🎯 **Why This Script is Unique**
Unlike basic session markers or colored backgrounds, this tool:
- Focuses on **macro moments of liquidity and reversal**, not just open/close times.
- Uses **per-session logic** to individually track price behavior inside key time windows.
- Supports **real-time high/low tracking and clean zone drawing**, ideal for Smart Money and ICT-style strategies.
Perfect — based on your list, here's a **bundle-style description** that not only explains the function of each script but also shows how they **work together** in a Smart Money/ICT workflow. This kind of cross-script explanation is exactly what TradingView wants to see to justify closed-source mashups or interdependent tools.
---
📚 ICT SMC Toolkit — Script Integration Guide
This set of advanced Smart Money Concept (SMC) tools is designed for traders who follow ICT-based methodologies, combining liquidity theory, time-based precision, and engineered confluences for high-probability trades. Each indicator is optimized to work both independently and synergistically, forming a comprehensive trading framework.
---
First FVG Custom Time Range
**Purpose:**
Plots the **first Fair Value Gap (FVG)** that appears within a defined session (e.g., NY Kill Zone, Custom range). Includes optional retest alerts.
**Best Used With:**
- Use with **ICT Macro Zones (Grey Box Version)** to isolate FVGs during high-probability times like AM Macro or PM SB.
- Combine with **Liquidity Levels** to assess whether FVGs form near swing points or liquidity voids.
---
ICT SMC Liquidity Grabs and OB s
**Purpose:**
Detects **liquidity grabs** (stop hunts above/below swing highs/lows) and **bullish/bearish order blocks**. Includes optional Fibonacci OTE levels for sniper entries.
**Best Used With:**
- Use with **ICT Turtle Soup (Reversal)** for confirmation after a liquidity grab.
- Combine with **Macro Zones** to catch order blocks forming inside timed macro windows.
- Match with **Smart Swing Levels** to confirm structure breaks before entry.
ICT SMC Liquidity Levels (Smart Swing Lows)
**Purpose:**
Automatically marks swing highs/lows based on user-defined lookbacks. Tracks whether those levels have been breached or respected.
**Best Used With:**
- Combine with **Turtle Soup** to detect if a swing level was swept, then reversed.
- Use with **Liquidity Grabs** to confirm a grab occurred at a meaningful structural point.
- Align with **Macro Zones** to understand when liquidity events occur within macro session timing.
ICT Turtle Soup (Liquidity Reversal)
**Purpose:**
Implements the classic ICT Turtle Soup model. Looks for swing failure and quick reversals after a liquidity sweep — ideal for catching traps.
Best Used With:
- Confirm with **Liquidity Grabs + OBs** to identify institutional activity at the reversal point.
- Use **Liquidity Levels** to ensure the reversal is happening at valid previous swing highs/lows.
- Amplify probability when pattern appears during **Macro Zones** or near the **First FVG**.
ICT Turtle Soup Ultimate V2
**Purpose:**
An enhanced, multi-layer version of the Turtle Soup setup that includes built-in liquidity checks, OTE levels, structure validation, and customizable visual output.
**Best Used With:**
- Use as an **entry signal generator** when other indicators (e.g., OBs, liquidity grabs) are aligned.
- Pair with **Macro Zones** for high-precision timing.
- Combine with **First FVG** to anticipate price rebalancing before explosive moves.
---
## 🧠 Workflow Example:
1. **Start with Macro Zones** to focus only on institutional trading windows.
2. Look for **Liquidity Grabs or Swing Sweeps** around key highs/lows.
3. Check for a **Turtle Soup Reversal** or **Order Block Reaction** near that level.
4. Confirm confluence with a **Fair Value Gap**.
5. Execute using the **OTE level** from the Liquidity Grabs + OB script.
---
Let me know which script you want to publish first — I’ll tailor its **individual TradingView description** and flag its ideal **“Best Used With” partners** to help users see the value in your ecosystem.

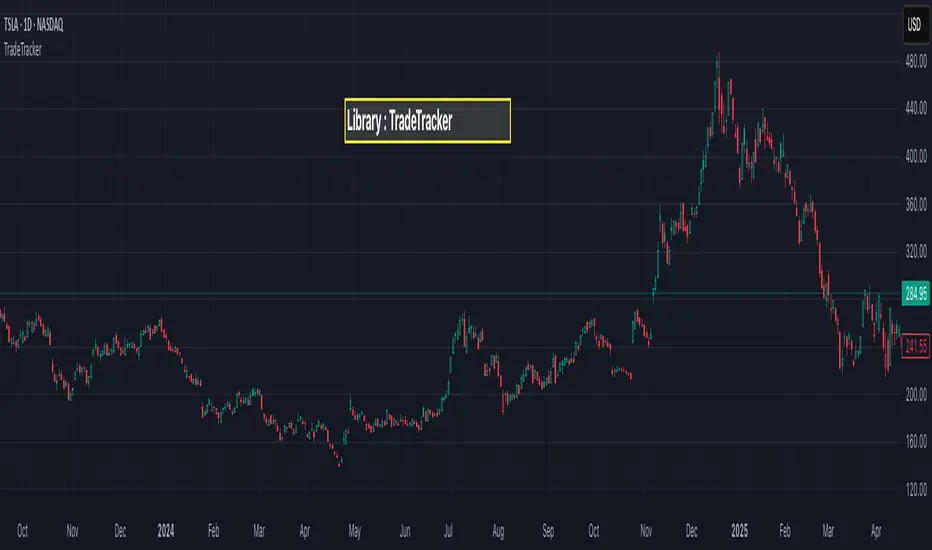
TradeTrackerLibrary "TradeTracker"
Simple Library for tracking trades
method track(this)
tracks trade when called on every bar
Namespace types: Trade
Parameters:
this (Trade) : Trade object
Returns: current Trade object
Trade
Has the constituents to track trades generated by any method.
Fields:
id (series int)
direction (series int) : Trade direction. Positive values for long and negative values for short trades
initialEntry (series float) : Initial entry price. This value will not change even if the entry is changed in the lifecycle of the trade
entry (series float) : Updated entry price. Allows variations to initial calculated entry. Useful in cases of trailing entry.
initialStop (series float) : Initial stop. Similar to initial entry, this is the first calculated stop for the lifecycle of trade.
stop (series float) : Trailing Stop. If there is no trailing, the value will be same as that of initial trade
targets (array) : array of target values.
startBar (series int) : bar index of starting bar. Set by default when object is created. No need to alter this after that.
endBar (series int) : bar index of last bar in trade. Set by tracker on each execution
startTime (series int) : time of the start bar. Set by default when object is created. No need to alter this after that.
endTime (series int) : time of the ending bar. Updated by tracking method.
status (series int) : Integer parameter to track the status of the trade
retest (series bool) : Boolean parameter to notify if there was retest of the entry price
((Range||Type||Swing))Consecutive Candle range boxes with gradient and number count. Inside Outside and Engulfing color bars plus plots. Strict swing filter plus bonus filter where the 3rd bar in the swing closes below the swing candles high or low respectfully.
How I Use
I use the candle stick patterns to gauge market conditions, the consecutive candle ranges to follow order flow using a closing break of the range and retest and the filtered swings to assist in identifying stronger. If any one wants to create a strategy around this that would be cool i know nothing of coding and do everything with A.I
turns