Amazing Oscillator (AO) [Algoalpha]Description:
Introducing the Amazing Oscillator indicator by Algoalpha, a versatile tool designed to help traders identify potential trend shifts and market turning points. This indicator combines the power of the Awesome Oscillator (AO) and the Relative Strength Index (RSI) to create a new indicator that provides valuable insights into market momentum and potential trade opportunities.
Key Features:
Customizable Parameters: The indicator allows you to customize the period of the RSI calculations to fine-tune the indicator's responsiveness.
Visual Clarity: The indicator uses user-defined colors to visually represent upward and downward movements. You can select your preferred colors for both bullish and bearish signals, making it easy to spot potential trade setups.
AO and RSI Integration: The script combines the AO and RSI indicators to provide a comprehensive view of market conditions. The RSI is applied to the AO, which results in a standardized as well as a less noisy version of the Awesome Oscillator. This makes the indicator capable of pointing out overbought or oversold conditions as well as giving fewer false signals
Signal Plots: The indicator plots key levels on the chart, including the RSI threshold(Shifted down by 50) at 30 and -30. These levels are often used by traders to identify potential trend reversal points.
Signal Alerts: For added convenience, the indicator includes "x" markers to signal potential buy (green "x") and sell (red "x") opportunities based on RSI crossovers with the -30 and 30 levels. These alerts can help traders quickly identify potential entry and exit points.
Pesquisar nos scripts por "relative strength"

Reverse Relative Strength Indicator [CC]The Reverse Relative Strength Index was created by Giorgos Siligardos (Stocks & Commodities V. 21:6 (18-30)). It is a handy indicator that reverse engineers the RSI price calculation to show what the price would have to be for the RSI value to match our chosen input. You can select your chosen RSI level using the RSI Level input for this indicator. For example if you wanted to see what the price would be for the RSI value to match the oversold level then you would set the RSI Level for 30 and it will plot that price on the chart. This uses some simple math to extrapolate the price with some basic algebra from the typical RSI calculation. This, of course, is a very similar concept to my previous Reverse Moving Average Convergence Divergence script. This indicator formula can be used for any oscillator with some slight tweaking and could also be customized to show the price for overbought and oversold levels, which I will probably do in the near future. This indicator is useful in many ways such as a trend indicator as my example shows or for a price projection tool. For example, if you had a current RSI level of 66 and it was going up and you want to see what the price would be if it reached the overbought level then you could do that. Let me know what works well for you and if you have any suggestions for how to further improve upon this script. I have included darker colors to show stronger signals and lighter colors to show normal signals. Buy when the line turns green and sell when it turns red.
I have a bunch of backlogged scripts that I'm trying to publish, so I figured I would focus on my RSI scripts since I have a bunch, so be prepared to see a bunch of those over the next week or so. Let me know if there are any other scripts you would like to see me publish!

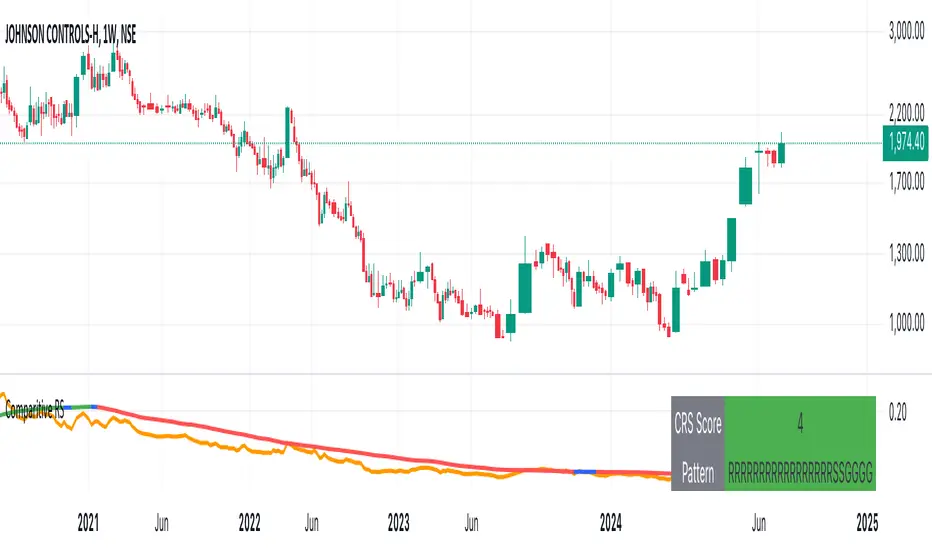
Comparative Relative Strength(CRS), ARS,SRS,Beta,RocShows comparative relative strength(CRS) against any benchmark script , if CRS is above ARS line than ARS is Positive and if CRS turns green than SRS is positive and vice versa.

Multi-Timeframe RSI GridThe relative strength index (RSI) is a momentum indicator that measures the magnitude of recent price changes to evaluate overbought or oversold conditions. The RSI is normally displayed as an oscillator separately from price and can have a reading from 0 to 100. This indicator displays the current RSI levels at up to 6 timeframes (of your choosing) in a grid. If the RSI levels reach overbought (above 70) or oversold (below 30) conditions, it changes the color to help you see that RSI has reached extreme levels. Note that in TradingView, when the chart is on a higher timeframe, the lower timeframe RSI levels don't calculate properly. If those conditions are met, this indicator will hide those values in the grid. If none of your selected values are available, it hides the table completely. There are configuration options, like:
Position the grid in any corner of the screen
Style customization (color, size)
Customize RSI length

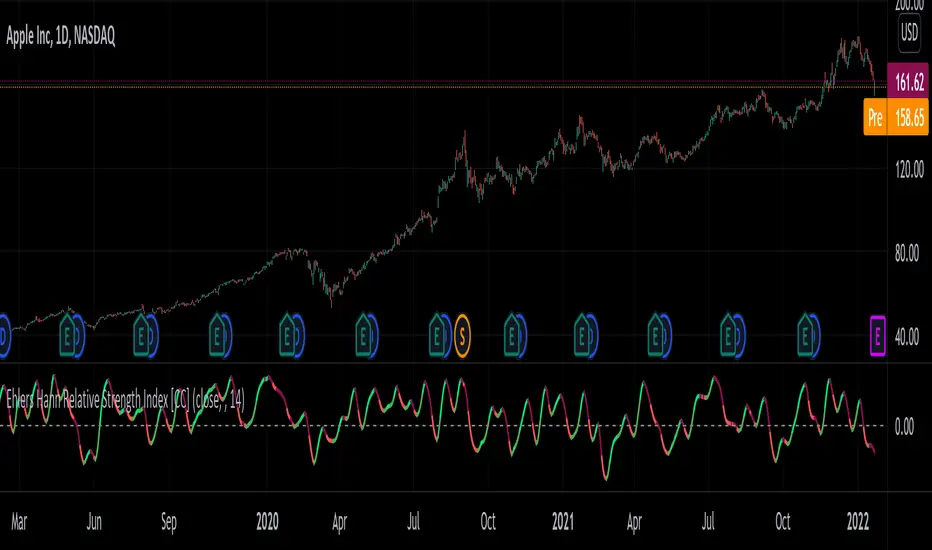
Ehlers Hann Relative Strength Index [CC]The Hann Relative Strength Index was created by John Ehlers (Stocks and Commodities Jan 2022 pgs 26-28) and this indicator builds upon his Hann Window Indicator to create an unique rsi indicator that doesn't rely on overbought or oversold levels to determine a reversal point and also provides a very superior smoothing without any of the lag associated with traditional smoothing. A much more useful RSI than the standard version in my honest opinion. Short term you buy when the line turns green and sell when it turns red. Medium to long term you buy when the indicator rises above the 0 line and sell when it falls below the 0 line. I have included strong buy and sell signals in addition to normal ones so strong signals are darker in color and normal signals are lighter in color.
Let me know if there are any other indicators or scripts you would like to see me publish!
RSI Levels, Multi-TimeframeThe relative strength index (RSI) is a momentum indicator that measures the magnitude of recent price changes to evaluate overbought or oversold conditions. RSI is normally displayed as an oscillator separately from price and can have a reading from 0 to 100. This indicator takes the RSI and plots the 30 & 70 levels onto the price chart so you can see when price is going to meet the 30 or 70 levels. The reason the 30 & 70 levels are important is because many traders (and bots) use those as signals to buy (at 30 RSI) or sell (at 70 RSI). Additionally, this indicator allows you to display not just the RSI levels of your currently viewed timeframe on the chart, but also shows the RSI levels of up to 6 different timeframes on the same chart. This allows you to quickly see if multiple RSI levels are aligning across different timelines, which is an even stronger indication that price is going to change direction when it meets those levels on the chart. There are a lot of nice configuration options, like:
Style customization (color, thickness, size)
Labels on the chart so you can tell which plots are the RSI levels
Optionally display the plot as a horizontal line if all you care about is the RSI level right now
Toggle overbought (RSI 70) or oversold (RSI 30) on/off completely

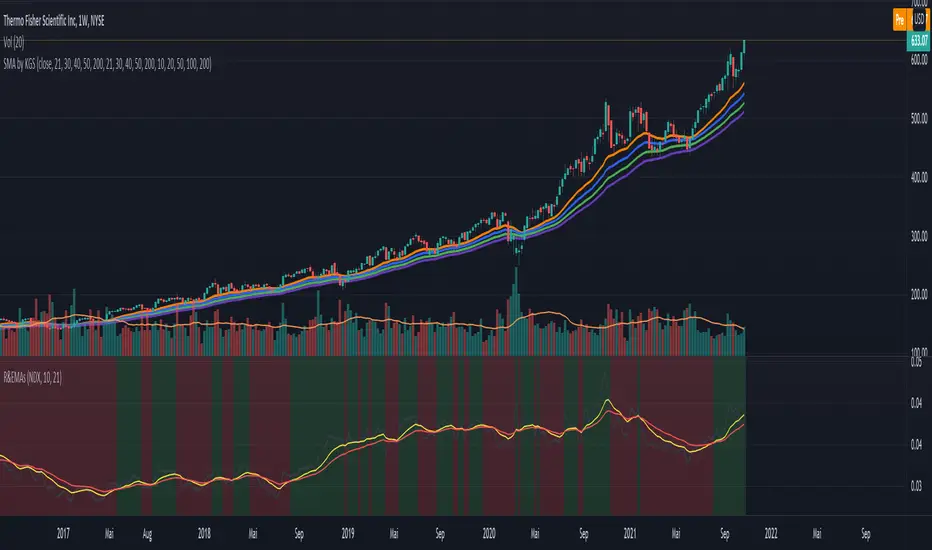
Ratio (Relative Strength) & EMAsRatio (Relative Strength) & EMAs
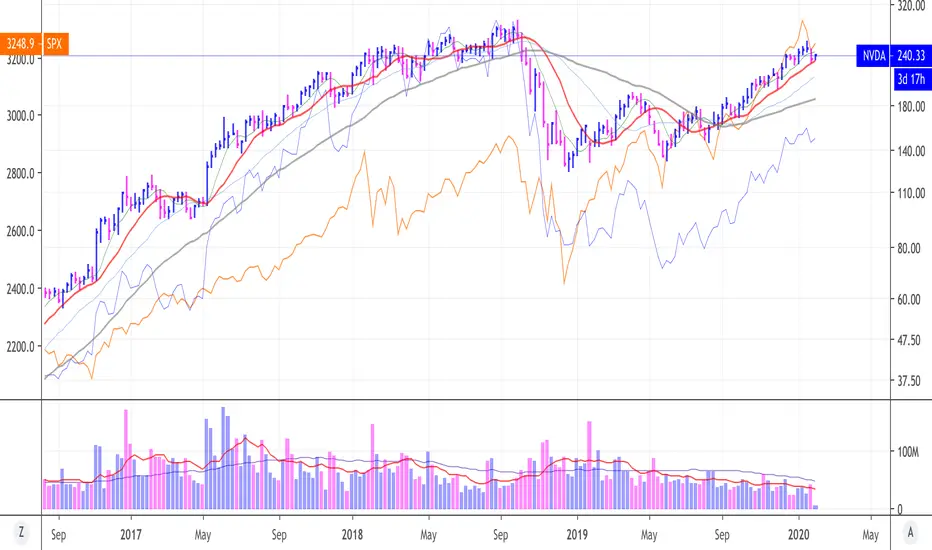
This indicator is used to compare the actual symbol with another one by calculating the ratio. EMA1 and EMA2 of the ration are shown as well. The idea is to choose an index like the NDX or SPX for comparison and to determine if the actual symbol outperforms the index or not - separate the wheat from the chaff. The rules are as follow:
When the calculation ratio (symbol divided ratio symbol) is above EMA1 and EMA1 is above EMA2) the background turs green. If not the background turn red.
QuantAnna: Relative Strength Plus (RS+)NSE:TATAMOTORS
Relative strength indicator which shows ratio between two stocks/assets .. usually between stock & its indices
features of indicator is as following.
1. Values oscillates around zero, it is bullish when above zero & bearish when below zero.
1. Weighted smoothing which removes unwanted whipsaws but keeps trend curve intact.
3. In-Built list of Nifty sector indices to show stocks comparison with its sector
please do send your feedback and suggestions.

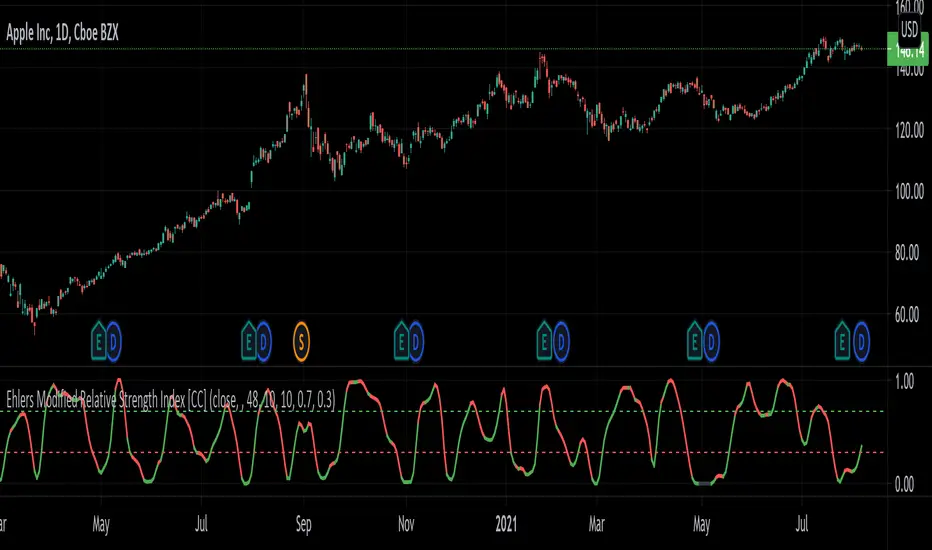
Ehlers Modified Relative Strength Index [CC]The Modified Relative Strength Index was created by John Ehlers (Cycle Analytics For Traders pgs 87-88) and this is a typical RSI that uses his roofing filter as the input. He smooths it with his own super smoother filter to provide signals. This indicator is extremely reactive and works in cycles so keep that in mind. I haven't been able to come up with clear buy and sell signals at this point so let me know if you any suggestions but I'm publishing the code to complete my goal of publishing all of his work one day. I will be publishing a bunch of Ehlers scripts in the next few weeks so stay tuned. What I recommend for buy and sell signals at this point are to buy when the indicator goes below the oversold line and starts going up and sell when the indicator goes below the oversold line a second time. Vice versa for sell signals.
Let me know if there are any other scripts you would like to see me publish!
Ehlers Adaptive Relative Strength Index V1 [CC]The Adaptive Relative Strength Index was created by John Ehlers and this is his first version. I will of course publish his updated version at a later date along with publishing the final script from Jim Sloman's Ocean Theory book. I have changed his script to include extra smoothing to provide clear buy and sell signals. This is a version of a RSI that is very adaptive to changes by finding the length of the current cycle and using that to calculate the rsi and I use this same basic process to provide extra smoothing. A great strategy of course is to buy right after the indicator goes from below the oversold level to right above it and stay in until the indicator turns red or when it reaches the overbought level. I have included strong buy and sell signals in addition to normal ones and the darker colors mean strong signals and lighter colors are normal signals.
Let me know what other indicators you would like to see me publish!
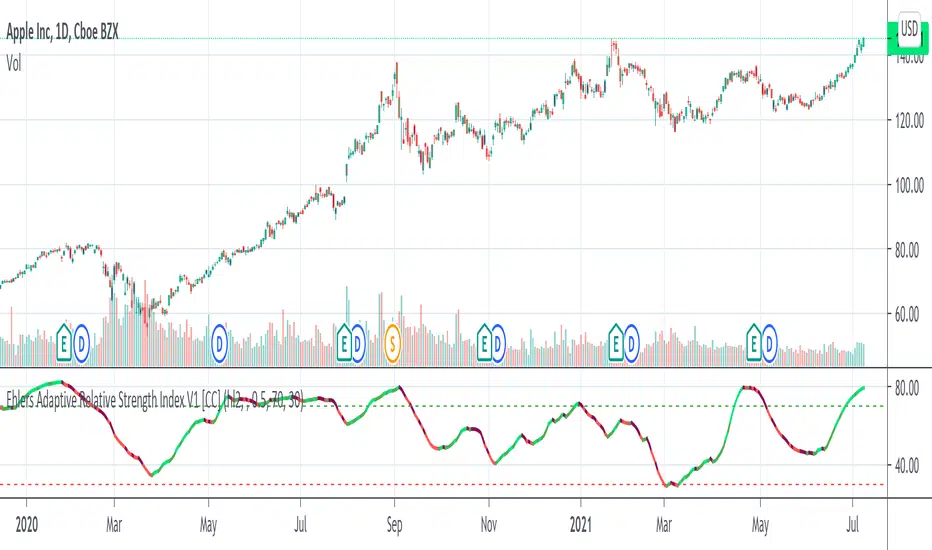
Table: Relative Strength Index (Multiple Timeframes) DESCRIPTION
It is the most popular and dependent Indicator, Relative Strength Index (RSI) . Now, I put inside a table to view chart momentum from Multiple timeframes.
This indicator tells different Timeframe (30 minutes, 1 hour, 4 hour, 1 day, 1 week, 1 month) of RSI value within table form.
HOW TO USE
Can consider a Long position when all timeframes go oversold while Short position when all timeframes go overbought. Alarm function is available. It sounds as all timeframes are overbought or oversold.
Modified The source of indicator from ©BeeHolder named "Performance"

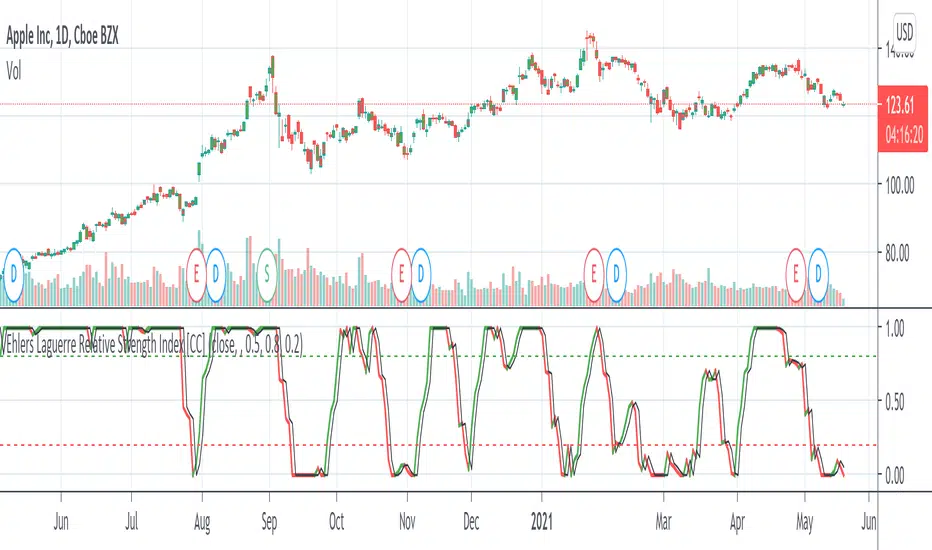
Ehlers Laguerre Relative Strength Index [CC]The Laguerre Relative Strength Index was created by John Ehlers and this is essentially his version of the RSI but I find that the buy and sell signals work better with his version as you can see. Buy when the line turns green and sell when the line turns red.
Let me know if there are any other indicators you want me to publish!
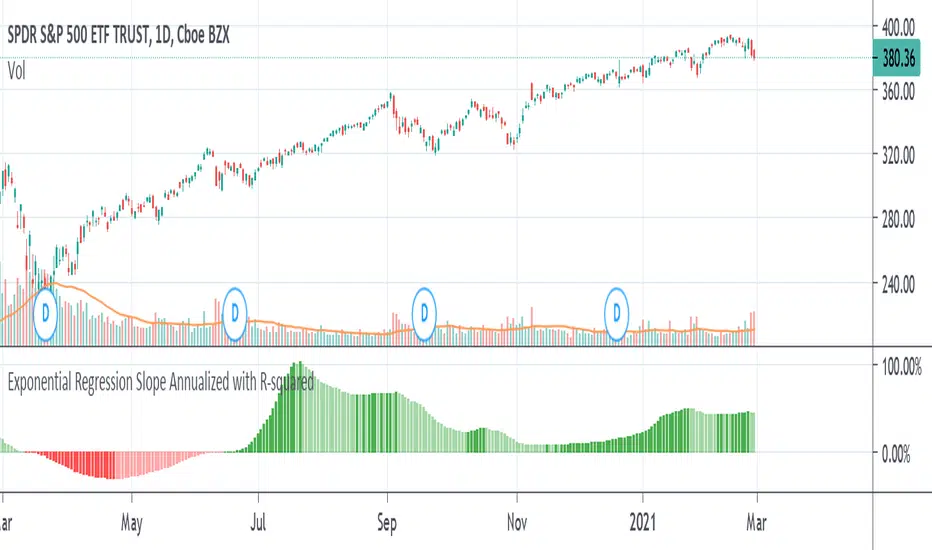
Exponential Regression Slope Annualized with R-squared HistogramMy other indicator shows the linear regression slope of the source. This one finds the exponential regression slope and optionally multiplies it by R-squared and optionally annualizes it. Multiplying by R-squared makes sure that the price movement was significant in order to avoid volatile movements that can throw off the slope value. Annualizing the exponential slope will let you see how much percentage you will make in a year if the price continues at its current pace.
The annualized number is the number of trading days in a year. This and the length might need adjusting for the extra bars that might be in futures or other markets. The number does not have to be a year. For example, it can be a month if you set the number to 20 or so trading days to find how much you would make in a month if price continues at its current pace, etc. This can also be used as an alternative to relative strength or rate of change.
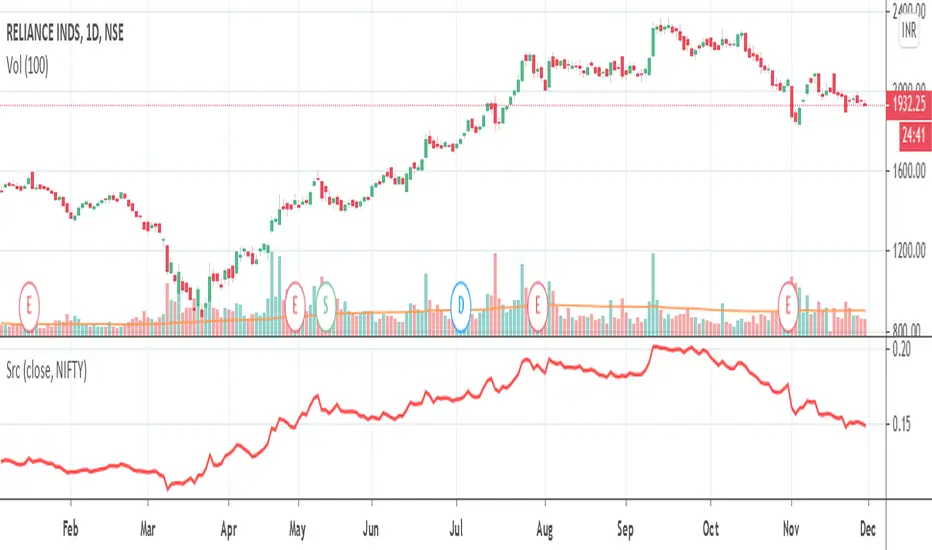
Sukrut relative strengthI am publising Relative Strength Comparative.
It is be used to compare a Stock's Performance against another stock/index (Default NIFTY50)
Example: ITC vs NIFTY 50 it will be ITC / NIFTY
[blackcat] L2 Ehlers Adaptive Relative Strength IndexLevel: 2
Background
John F. Ehlers introuced Adaptive Relative Strength Index in his "Rocket Science for Traders" chapter 21 on 2001.
Function
The concept of taking a difference of lagging line from the original function to produce a leading function suggests extending the concept to moving averages. There is no direct theory for this, but it seems to work pretty well. If taking a 7-bar WMA of prices, that average lags the prices by 2 bars. If taking a 7-bar WMA of the first average, this second average is delayed another 2 bars. If taking the difference between the two averages and add that difference to the first average, the result should be a smoothed line of the original price function with no lag. Sure, Dr. Ehlers tried to use more lag for the second moving average, which
should produce a better predictive curve. However, remember the lesson of Chapter 3 of the book. An analysis curve cannot precede an event. You cannot predict an event before it occurs. If then taking a 4-bar WMA of the smoothed line to create a 1-bar lag, this lagging line becomes a signal when the lines cross. This is as close to an ideal indicator as we can get.
Key Signal
Predict ---> moving average fast line
Trigger ---> moving average slow line
Pros and Cons
100% John F. Ehlers definition translation of original work, even variable names are the same. This help readers who would like to use pine to read his book. If you had read his works, then you will be quite familiar with my code style.
Remarks
The 17th script for Blackcat1402 John F. Ehlers Week publication.
Readme
In real life, I am a prolific inventor. I have successfully applied for more than 60 international and regional patents in the past 12 years. But in the past two years or so, I have tried to transfer my creativity to the development of trading strategies. Tradingview is the ideal platform for me. I am selecting and contributing some of the hundreds of scripts to publish in Tradingview community. Welcome everyone to interact with me to discuss these interesting pine scripts.
The scripts posted are categorized into 5 levels according to my efforts or manhours put into these works.
Level 1 : interesting script snippets or distinctive improvement from classic indicators or strategy. Level 1 scripts can usually appear in more complex indicators as a function module or element.
Level 2 : composite indicator/strategy. By selecting or combining several independent or dependent functions or sub indicators in proper way, the composite script exhibits a resonance phenomenon which can filter out noise or fake trading signal to enhance trading confidence level.
Level 3 : comprehensive indicator/strategy. They are simple trading systems based on my strategies. They are commonly containing several or all of entry signal, close signal, stop loss, take profit, re-entry, risk management, and position sizing techniques. Even some interesting fundamental and mass psychological aspects are incorporated.
Level 4 : script snippets or functions that do not disclose source code. Interesting element that can reveal market laws and work as raw material for indicators and strategies. If you find Level 1~2 scripts are helpful, Level 4 is a private version that took me far more efforts to develop.
Level 5 : indicator/strategy that do not disclose source code. private version of Level 3 script with my accumulated script processing skills or a large number of custom functions. I had a private function library built in past two years. Level 5 scripts use many of them to achieve private trading strategy.

Comparative Relative StrengthPlots the relative strength between a scrip and the broader index (Nifty50 in this case) in a lower pane of the chart. Scrip shared by ST_PSI - TradeWithTrend.

Comparative Relative Strength of a stockPerform comparative relative strength of a stock. Default base is NIFTY 50.
IBD Relative Strength + Linear RegressionThis is a slight extension to the excellent script by: jamiespips
It shows the Relative Strength of a Stock compared to a suitable Index.
My extension consists of:
- A selection of comparative indices.
- A short EMA-3 to the RS-curve to smooth it out.
- A linear regression trend line to the last part of the RS-curve.

VWAP Relative Strength Index [CC]This is a custom indicator of mine that uses the volume weighted average price instead of the close price as the source for calculations of the relative strength index. Buy when the indicator line is green and sell when it is red.
This was a custom request so let me know if there are any other scripts you would like to see me do or if you want something custom done!

Weighted Moving Average of Relative Strength IndexJust weighted moving average of Relative Strength Index to see a clearer picture.

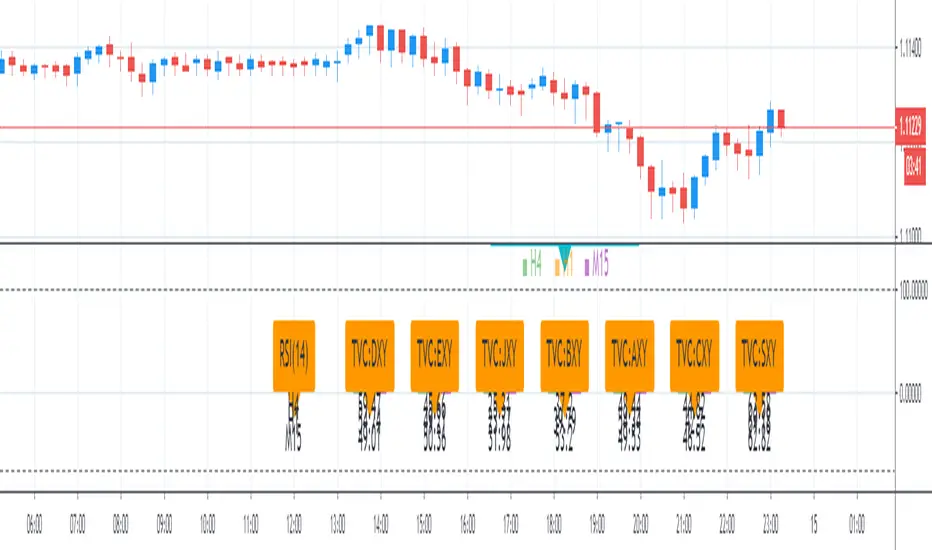
Currency Relative Strength IndexCurrency Relative Strength Index
This scripts show current RSI value and histogram of 7 Currency index on 3 time frame: 4H, 1H, 15M
//=== RSI Function ===\\
rsi_period=input(14)
M15_RSI( sym ) =>
M15_RSI = security( sym , "15", rsi (close,rsi_period))
H1_RSI( sym ) =>
H1_RSI = security( sym , "60", rsi (close,rsi_period))
H4_RSI( sym ) =>
H4_RSI = security( sym , "240", rsi (close,rsi_period))
//=== Currency Index ===\\
1. DXY - USD Index - U.S. Dollar Index
2. EXY - EUR Index - Euro Currency Index
3. JXY - JPY Index - Japanese Yen Index
4. BXY - GBP Index - British Pound Index
5. AXY - AUD index - Australian Dollar Index
6. CXY - CAD Index - Canadian Dollar Index
7. SXY - CHF Index - Swiss Franc Currency Index
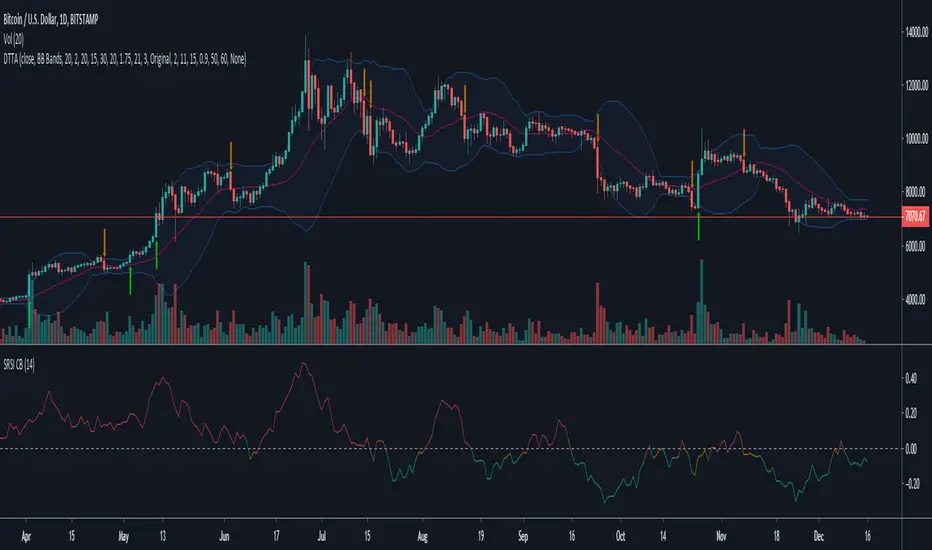
Sell Relative Strength Index [ChuckBanger]This is Sell Relative Strength Index (SRSI or “sell gravitation index”). This indicator was developed by Howard Wand as featured in the February 2019 issue of TASC magazine.
"Traders accumulate profits trade by trade, with the goal of maximizing profits. But selloffs happen and when they do, you see significant price drops that are fast. Here’s an indicator that uses the profit accumulation size to estimate subsequent selloff size.
Green lines represent buy, red represents sell and yellow represents a balance between buy and sell signals on the SRSI."