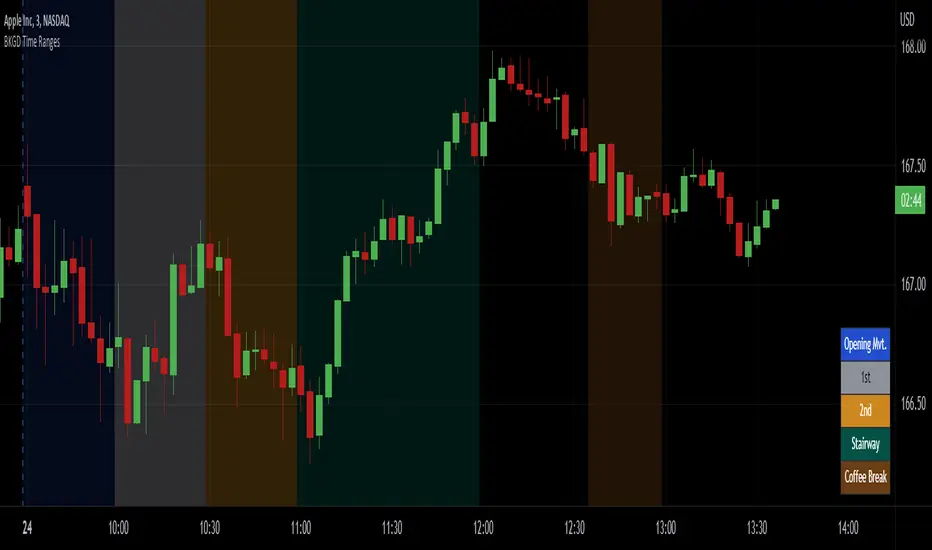
Intraday Background Time RangesThis simple script was written for studying recurring intraday behaviours of financial instruments. With it, you can highlight up to 13 customizable time ranges on your chart, filling the corresponding background space with colors you prefer. You can then write a note for each range and it will be shown in the optional related table.
The experience shows that every financial instrument has its own personality. With this in mind, the script can be useful to study intraday charts with the purpose of discovering recurring behaviours of specific instruments over a certain time range and under specific circumstances (normal days, earnings days, days with catalysts, etc.) This can help the trader to deeply understand the instrument personality, and therefore also to decide whether to enter or exit the market if its behaviour meets or not his expectations.
Please note that this script only works on minute/hourly charts.
Pesquisar nos scripts por "range"
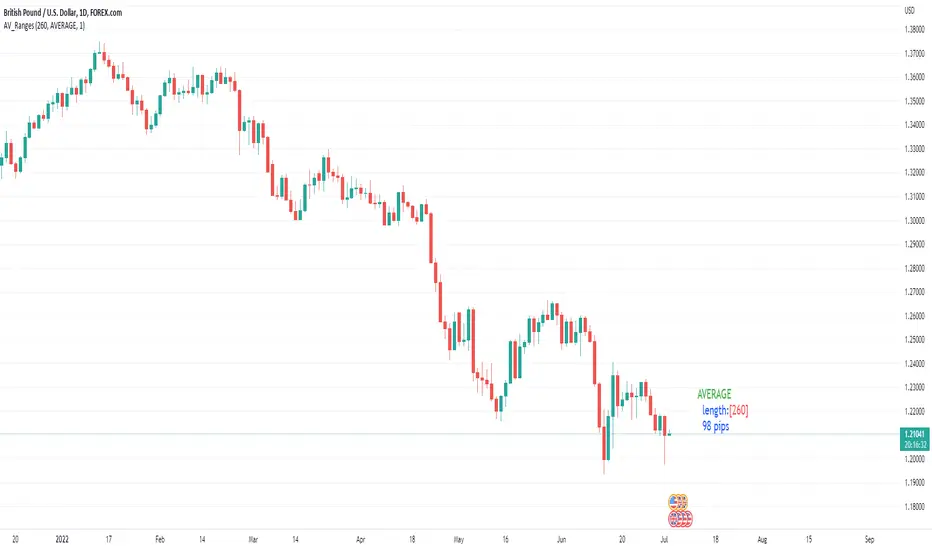
Average, Median, Mode, Biggest: Pip Range Measures & LabelsApply various simple statistical measures to series of full candle ranges over user input length (in bars).
Choose between AVERAGE, MEDIAN, MODE, BIGGEST.
All calculations derive from the high-low range of a candle.
Default length = 260, the number of daily candles in a year.
MODE is calculated from pip ranges rounded to reasonable increments (to nearest 10pips foreign currencies; to nearest 100 pips for DXY ; nearest $10 for other assets). Best only use MODE for the major FX pairs encoded, and on Daily timeframe .
User input 'unit multiplier' only applies when asset is NOT a major Forex pair (unit and multiplier is auto applied for for major FX pairs).
© twingall
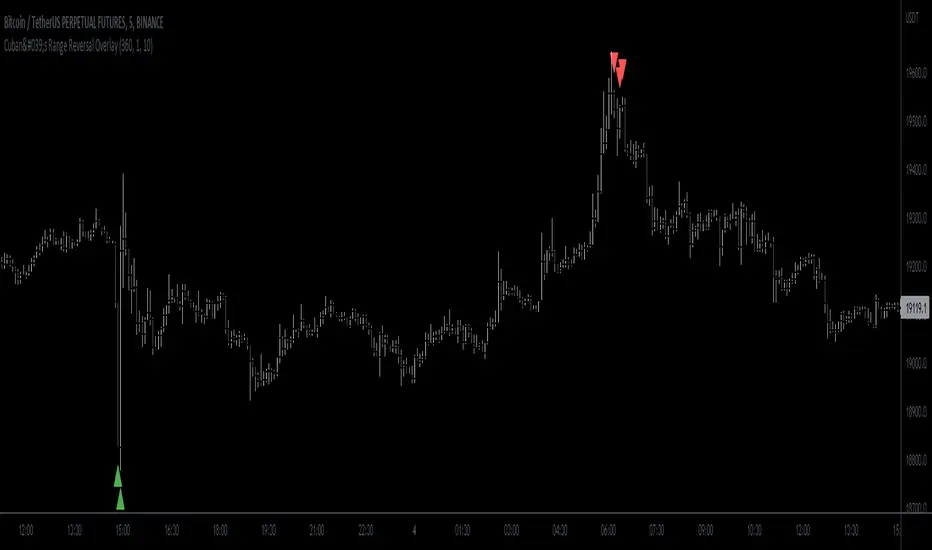
Cuban's Range Reversal OverlayBeen a minute since a public script!
This one looks at the range and recommends potential reversal depending on degree of overextension.
Originally intended for low timeframe short time horizon reversals but works well on higher timeframes as well.
Oscillator included in the image so you can see under the skirt and check what's happening.
ATR Timeframe RangeThis indicator shows the ATR range on the daily or any other timeframe on your current chart. All settings are fully customize-able.

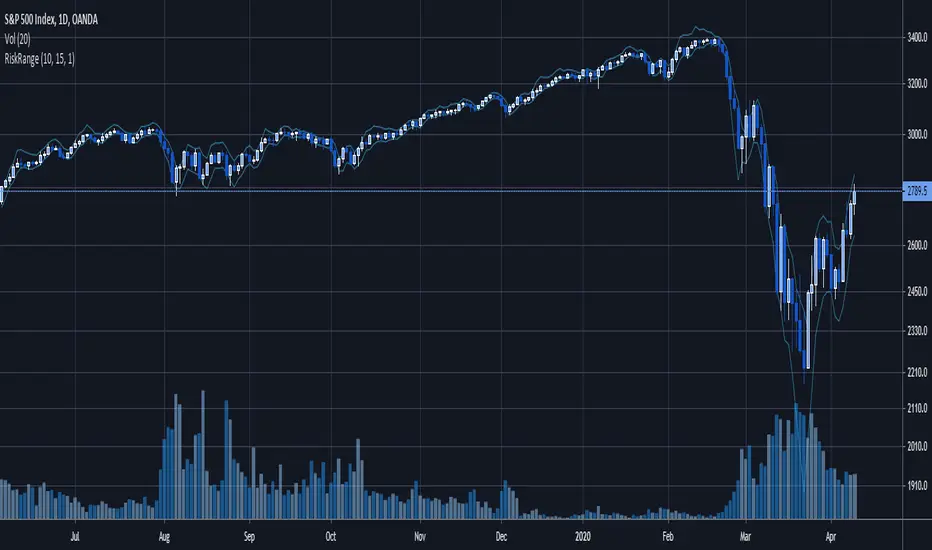
Daily Risk RangeThis was inspired by Hedgeye's Risk Ranges product and calculates daily risk ranges for assets. It uses volatility , the volatility of volatility , the skew of volatility and price to calculate a range that can be used for entries either long or short.
Message me for a free 7-day trial and pricing
[C] Dynamic Range Channel based on ATR on Multi Time FramePlots the dynamic range from the calculated Average True Range of the security. The calculated price that it could return to from high to low and vice versa. Has been tested on multiple time frames on NSE equity stocks.

Range OscillatorRange Oscillator is a centered oscillator that can be classified as both trend and momentum indicator and also as either bound limited or non-limited one.
The main part is a measure of difference between specified source (Price, if source is set to close) and average of highest and lowest price in a given period(Range), plotted as histogrsam.
Thus when level of price is above this average, oscillator shows bullish trend and if the price trades below it, oscillator will show bearish trend.
Height of histogram shows momentum, as price diverges from base bars of histogram will grow longer and this also indicates a rising momentum. And a narrowing histogram shows that trend and momentum are fading.
Indicator can be modified in various ways as there are plenty of options available...
The first option you will see is the mode option. Oscillator can be set to basic, percent and index modes.
Basic mode is simply the distance of source from base. Percent mode calculates the percent of this distance. And Index mode limits the oscillator to percent of range, where 50 is the center.
Look-back period is the number of bars that will be checked to canculate range. (20-60 is suggested)
Then there is smoothing option which is enabled as default and you have 4 types of moving averages (SMA, EMA, WMA, RMA) to choose as smoothing method of signal or turn it off.
Another double moving average is provided if you would like to add more filtering layers to signals. Histogram will be changing colors based on moving average crosses if they are enabled. Second MA can be used as source of first MA to simulate K and D.
Next option is to whether have wicks included in range calculation or not.
And levels and source can be modified at the end.
Overbought/Oversold...
Oversold and overbought levels can be seen in all modes. In non-index modes the levels are not fixed, but canculated in percent and plotted around center level dynamically.
Remeber that these areas are not there to signal reversal but trend strength.
Default threshold is set to 70 for overbought and 30 for oversold, and can be changed according to security or self preferences.
Readings above overbought level would indicate that the underlying security was trading near the top of high-low range for the specified period of bars back. Readings below oversold occur when a security is trading at the low end of its high-low range.
Signals...
Center Cross
As explained, Center Cross (The most basid signal generated by indicator) could be a result of possible change in trend.
Bull/Bear Divergences
Divergences form when a new high or low in price is not confirmed by the oscillator. A bullish divergence forms when price records a lower low, but the Range Oscillator forms a higher low. This shows less downside momentum that could forecast a bullish reversal. A bearish divergence forms when price records a higher high, but the Range Oscillator forms a lower high. This shows less upside momentum, and indicates a possible bearish reversal. Once a divergence happens, other confirmation such as Center Line cross or a trend break-out on the chart, should be considered to signal an actual reversal.
Twin Peaks
Since the similarity of Range Oscillator and Awsome Oscillator, Twin Peaks can also be considered as signals in non-Index modes.
Twin Peaks is a method which considers the differences between two peaks on the same side of the Center Line.
A Bullish Twin Peaks setup occurs when there are two peaks below the Center Line. The second peak is higher than the first peak and followed by a light bar. The trough between the two peaks, is recommended to remain below the Center Line the entire time.
A Bearish Twin Peaks setup occurs when there are two peaks above the Center Line. The second peak is lower than the first peak and followed by a dark bar.
Momentum Failure
The situation happens when signal bars can't cross into overbought/oversold areas, which can lead to a strong trend reversal.
Saucer
A Saucer Setup looks for fast momentum changes in three consecutive bars on non-Index modes specially. Bars must be on the same side of the Center Line.
A Bullish Saucer setup occurs when the Oscillator is above the Center Line. It entails two consecutive dark bars (with the second bar being lower than the first bar) being followed by a light Bar.
A Bearish Saucer setup occurs when the Oscillator is below the Center Line. It entails two consecutive light bars (with the second bar being higher than the first bar) being followed by a dark bar.
Break-outs
Break-outs of lines generated from connecting peaks on non-Index modes can be considered as signal. Break-outs often provide faster signals that Center Line cross.
Example chart with Basic mode:
GBPUSD, 1D
Attention: Like most of other indicators, the point that it is based on historical data of price will often result in false signals.
It is very important to use the Range Oscillator with causion, And in conjunction with other technical analysis.

AEONDRIFT {Expected Ranges}Expected Ranges base on AEONDRIFT implementation of Standard Deviation bands.
Note: In no way is this intended as a financial/investment/trading advice. You are responsible for your own investment/trade decisions.
Please PM me for access information.

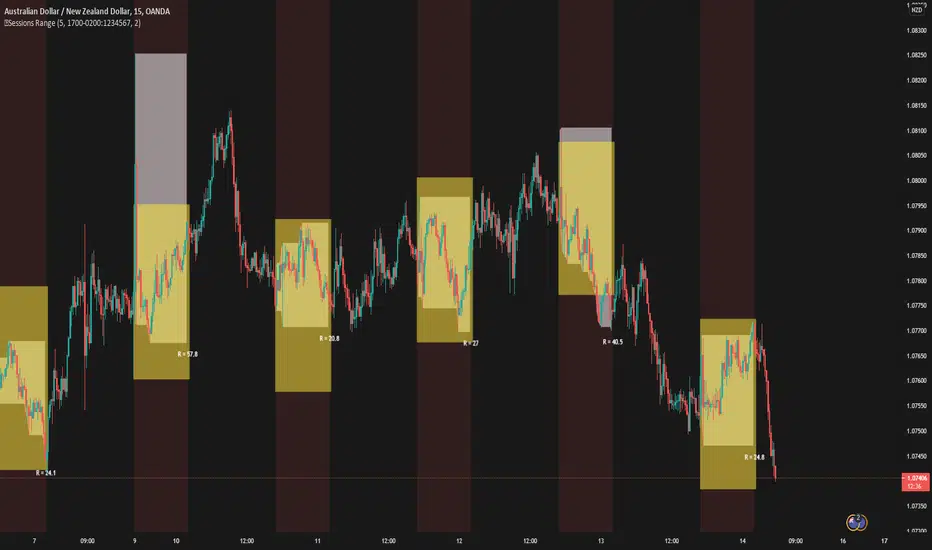
5 Sessions RangeThis script averages the range of the previous 5 sessions and displays it on the chart
The sessions are adjustable
True Rolling Pivot Range IndicatorHere is the actual 3 day rolling pivot range indicator as detailed in Mark Fisher's book The Logical Trader.
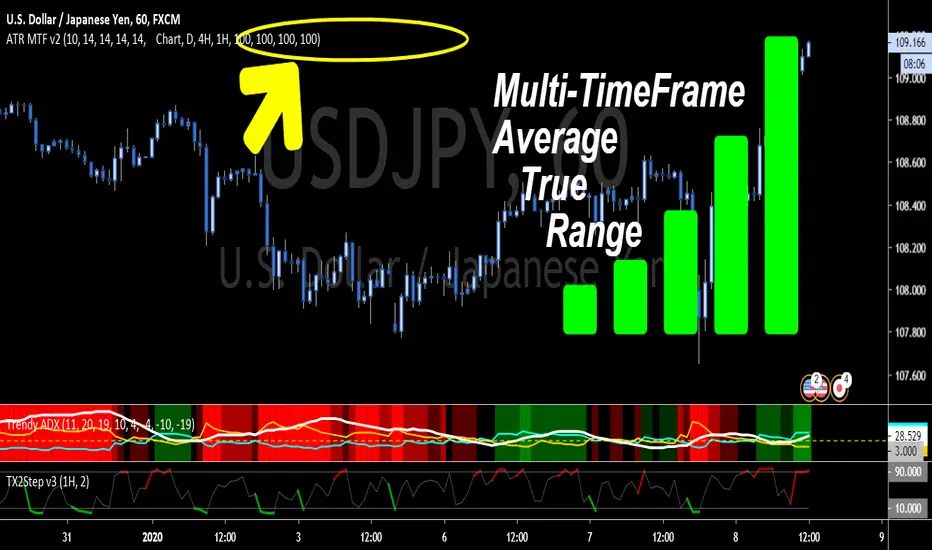
ATR True Range - Multi Timeframe - BonavestTo add this indicator to your charts:
Click the 'Add to Favorite Scripts' button down below this description.
This simple indicator is merely for displaying mulitple ATR ranges at a glance on one chart.
SETTINGS
Each ATR is completely configurable:
Length - to base the ATR on
Timeframe - 'Chart' uses the current chart resolution; other timeframes are available on pull downs
Multiplier - Each ATR can use a multiplier to be able to show multiples or fractions of the full ATR. (i.e. 85=85%, 150=150%)
Dark Theme - Default colors for black or dark backgrounds
I use this indicator for:
Determining price ranges
Setting stop losses and take profit levels
CD_Average Daily Range Zones- highs and lows of the dayUses daily average ranges of 5 and 10 (most used) as buy (support) and highs (resistance) areas - half ranges used in calculations for a more accurate "forecast" of the H and L . Uses open but not close, so it does not repaint - experimental

Range Trend Channels with Flip Signals 0.1.0Range Trend Channels with Flip Signals 0.1.0
Purpose:
- Detects "range trend" patterns on the chart using
4-bar structures.
- Draws main channel lines, parallel lines, and "third lines"
on valid hard closes above/below.
- Generates BUY/SELL signals based on candle interaction
with the third lines.
Features:
• Configurable number of recent patterns to keep.
• Adjustable hard-close buffer in ticks.
• Adjustable line width and style.
• Separate colors for bullish (green) and bearish (black) ranges.
• Extra third line colors for each type.
• Option to enable/disable hard-close detection per side.
• Signal system with:
– Strict next-bar or window-based mode
– Candle color filtering
– Minimum body size requirement
– Optional momentum filter
• Alerts for BUY/SELL signals.
Usage Tips:
- Use on your preferred timeframe for spotting
structure-based continuation/reversal points.
- "Hard-close buffer" helps prevent false triggers
from small overlaps.
- In strict mode, signals fire on the very next bar
after the third line is created.
- In window mode, signals can trigger within a
specified number of bars after third line creation.

ATR - Average True Range + Dynamic Trend w/ Signals | by Octopu$↕ ATR - Average True Range + Dynamic Trend w/ Signals | by Octopu$
What is ATR?
ATR stands for Average True Range
A Technical Analysis Indicator that measures market volatility by decomposing the range of a Security Price in a specific period.
The ATR can be used as a High Low Spectrum,
As well as a variation of a Moving Average, considering the ranges on a timeframe, generally this being 14 days.
Shorter periods can be used (will generate more signals) or longer periods for steadier trends (for fewer signals)
A ticker on a high volatility has a high ATR.
A ticker on a low volatility has a low ATR.
It is an useful resource for a trading system:
Can be used to enter or exit trades and/or also measure the daily spectrum of a stock.
Does not necessarily points price direction, but takes into account gaps and strong legs.
Can also be used as trading positions confirmation,
Rather be it for stop losses or take profits,
As well as setting trailing stops or limit orders.
This tool offers a great Risk to Reward Ratio, considering the fact you will be aware of the possible moves that an asset can perform.
This indicator should not be used as a standalone tool.
(The combination of factors relies on your own knowledge about Confluence Factors along with your Due Diligence)
This indicator is not an advice to buy or sell securities.
www.tradingview.com
SPY
ANY Ticker. ANY Timeframe.
(Used SPY 5m as Example only)
Features:
• ATR ( Average True Range )
• Range UP and DOWN
• Movement from Price Line
• Dynamic ATR
• Cross/Test Signals
• Live and Last Close
Options:
• Specific Factors Setup
• Length Customization
• Toggle On/Off
• Color PIcker
• Styling Options
Notes:
v1.0
Indicator release.
Changes and updates can come in the future for additional functionalities or per requests. Follow and Stay Tuned!
Did you like it? Please Support and Shoot me a message! I'd appreciate if you dropped by to say thanks! Thank you.
- Octopu$
🐙

Michigandolf's 30min Opening Range (w/Extensions)See previous version for explanation of the 30min Opening Range:
This new version is for users that prefer to see the Opening Range Extensions.
The extensions are based on the distance from the Opening Range High to the Mid Point (or Low to the Mid Point).

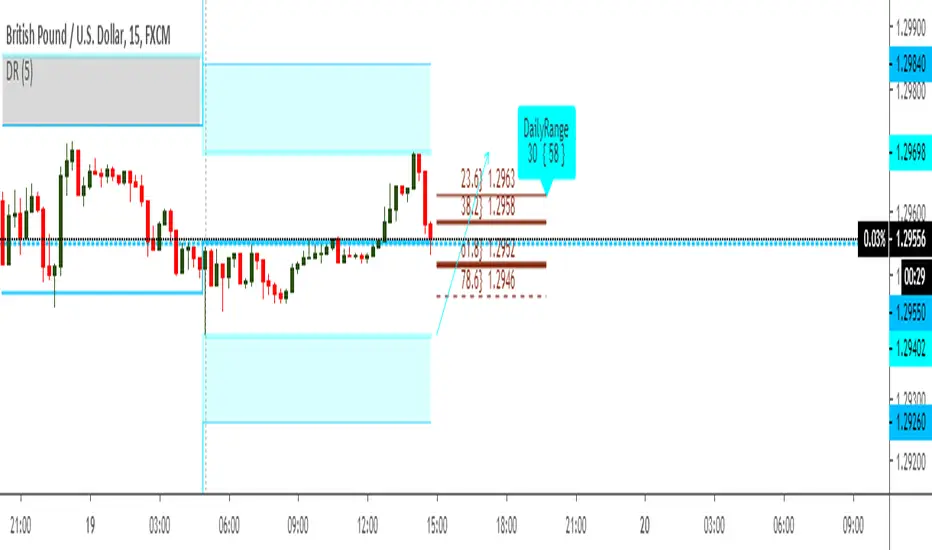
Operietur ⸗ Time Range BreakoutOur T.R.B ( Time Range Breakout ) indicator is very similar to the O.R.B ( Open Range Breakout ) indicator. This script plots the high/Low within a custom time-range which then extends that plot to end-of-day. A Fibonacci extension is then drawn from that range. The default settings of this indicator set the similarities to the ORB. This script only displays the last trading day.
Due to Tradingview's singular refresh rate for the larger timeframes("resolutions"); this indicator works on timeframes LESS than 60min. Additionally, the smaller the timeframe the more accurate the price range will be.
The movements within the specified period of time define the projected Fibonacci prices associated with the allotted time's price range.
• Custom Time Range
• Fibonacci Extensions
• Up to 5 PTs
• Customizable Multiplier
Additional script features allow for fully adjustable settings and configurations:
• Adjustable; PT Colors
• Adjustable; Range Color
• Adjustable; Toggles

Pre Market \ Opening Range High LowGreen vertical lines are showing pre market open and then the opening range as the first hour of market NYSE market open
Pre market high and low are blue lines | intraday opening range high low are in white
Trades are taken in the current direction above | below range breaks with the direction of price action using the moving averages
Price breaking through moving averages and a range is the optimal trade to enter - exit at next range for target - stop loss below the lower | higher moving average depending on short or long
A break above or below the intraday high or low and pre market high or low can give massive profits trailing your stop loss as price runs
Using MA 5 and 12 to filter out entries and exits above or below the ranges short or long is also another strategy to implement
BEST TIME FRAME TO USE IS 5 MINUTE

Session's First Bar RangeFirst Bar is crucial when there is gap up or gap down opening. It is recommended to use 15m Timeframe for better use.
Crossing this range signifies the absorption of existing buyers/sellers in the opening session and sometimes decide the trend onwards.

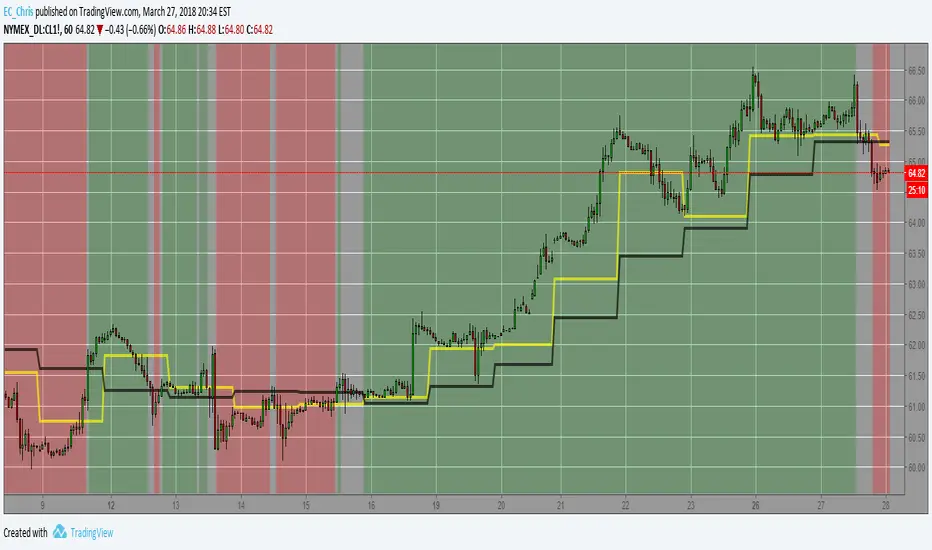
Trading Range FinderWhat is it?
This indicator is a visual representation of the ADX indicator that shows where the areas of weak trends are. Anything shaded in a gray background implicates that the chosen market is experiencing a weak trend.
These areas of weak trends are seen typically when ADX drops below 20-25 but this script is customizable to change where you want that threshold.
Why did I make it?
I made this indicator to be used in combination with other trading indicators to eventually be used to identify when a market is range-bound/sideways.
Since momentum-based indicators can be "thrown off" in sideways market conditions, I will be using this visual indicator to identify when it is best to filter out a trade signal in a momentum-based strategy.

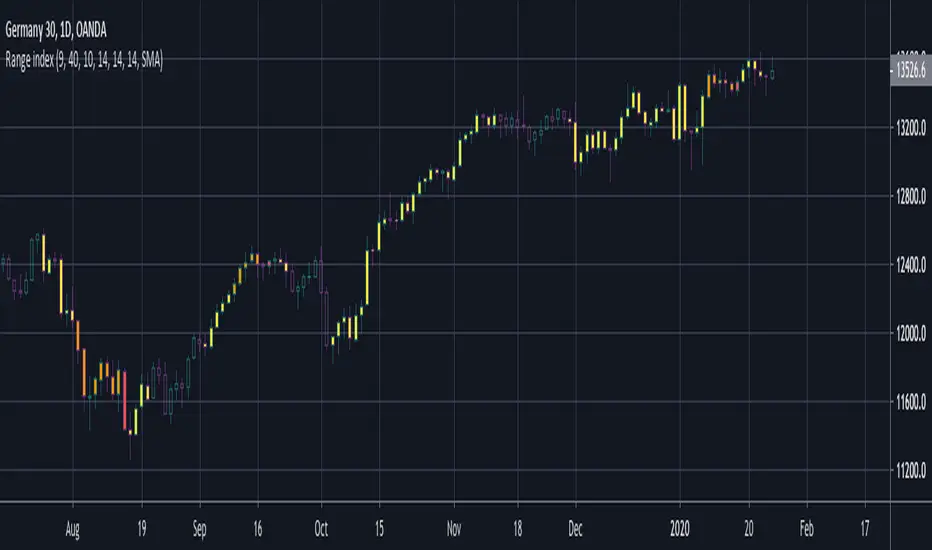
BERLIN Range Index | Panel versionThe original problem: The choppiness index is great at finding ranging markets, but it is sometimes very slow, which means most of the time it only catches the end of a trend.
This indicator tries to solve this. It uses the choppiness index and filters it using a factor that is based on the standard deviation of the ATR.
The ATR based filter is calculated by first calculating the running standard deviation of the ATR, and then looking at that in relation to its recent low to find a filtering factor to use on the choppiness index. This makes the choppiness index more reactive to trends, but also slightly more likely to missidentify ranges.
This is the panel version of the indicator. It plots the index and min/max values, as well as background colors to tell you when it thinks the market is ranging or trending.
Yellow = Trending
Transparent gray = Ranging

BERLIN Range Index | Bar color versionThe original problem: The choppiness index is great at finding ranging markets, but it is sometimes very slow, which means most of the time it only catches the end of a trend.
This indicator tries to solve this. It uses the choppiness index and filters it using a factor that is based on the standard deviation of the ATR.
The ATR based filter is calculated by first calculating the running standard deviation of the ATR, and then looking at that in relation to its recent low to find a filtering factor to use on the choppiness index. This makes the choppiness index more reactive to trends, but also slightly more likely to missidentify ranges.
This is the bar color version of the indicator. It changes the color of the bars when it it thinks the market is ranging and when it thinks it is trending.
Yellow = Trending
Transparent gray = Ranging
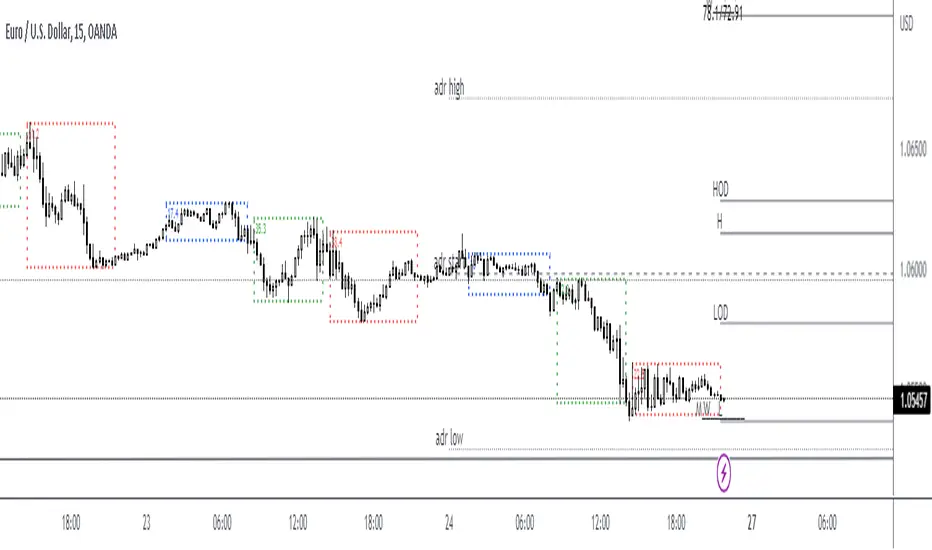
Average Daily Range Label by Theoris (ADR)This indy show Label of
* Last price
* Range of Low - High ( from Average daily range calculation )
* ADR (14 ) default period 14
* value of current range ( pip ) / Average daily range.
Example
now price is
1499.4
( 1486.959 - 1510.841 ) --- > This is range calculate from ADR for normal range.
ADR(14)
58/148.41
meaning use ADR period 14
today run 58 pips
from average 14 period is 148.41 pips
can change period to other normally I use 10 or 14
Timeframe to use default is Daily