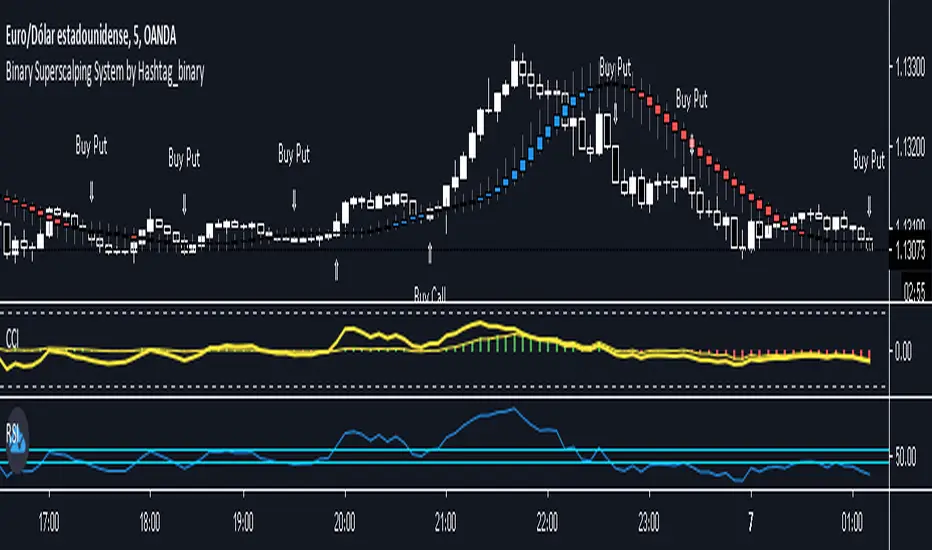
Binary Superscalping System by Hashtag_binaryBinary Superscalping Systyemis a trend momentum strategy designed for scalping and trading with binary options. This trading system is very accurate with the 80% profitable trades.
- Markets: Forex (EUR/USD, GBP/USD, AUD/USD, USD/CHF, USD/CAD, NZF/USD, USD/JPY,) Indicies (S&P500, Dow Jones, DAX, FTSE100) and Gold.
- Time Frame 5 min, 15min, 30min.
- Expiry Time (4-6 candles).
Buy Call or Buy:
- Trend CCI (170) crossed the zero line upwards (green bar >0);
- Entry CCI (34) crosses upward the zero line ;
- RSI (Relative Strength Index) indicator value is greater than 55 level;
- Heiken Ashi Smoothed indicator is color blue (optional).
Buy Put or Sell
- Trend CCI (170) crossed the zero line downwards (red bar <0);
- Entry CCI (34) crosses downward the zero line ;
- RSI indicator value is lower than 45 level;
- Heiken Ashi Smoothed indicator is color red (optiona).
Exit position for Scalping options:
- Entry CCI (34) crosses in opposite direction trend CCI (170),
- Profit Target:5 min time frame 7-10 pips, 15 min time frame (9-14 pips), 30 min time frame (15- 18 pips).
- Make Profit at fibopivot levels.
- Initial stop loss on the previous swing.
Pesquisar nos scripts por "profitable"
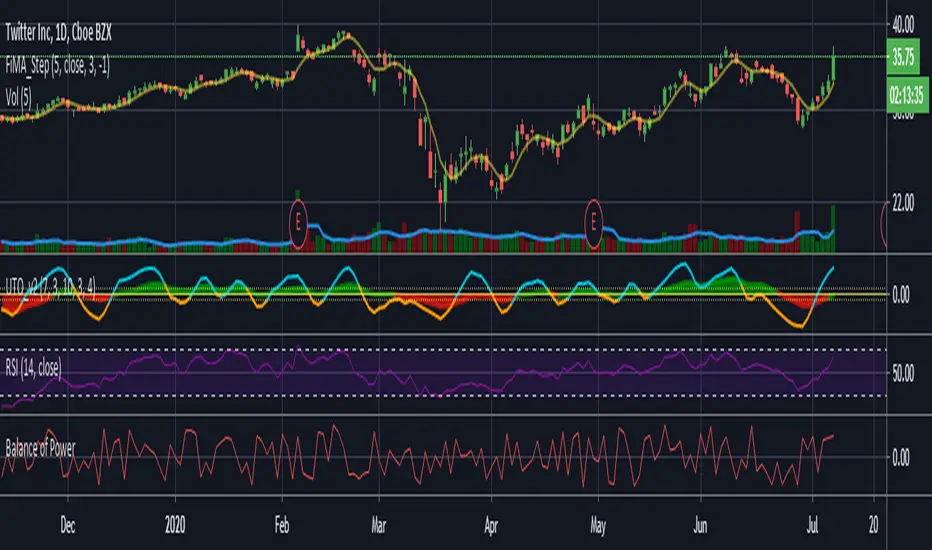
Ultimate Trader Oscillator - UTO v1Note; this is experimental / learning work -- has nothing to do with the existing "Ultimate Oscillator" -- i call this project UTOpia :)
This is based on some research work i was doing around the Balance Of Power - which i posted about in the past
the conclusion form there was a questions of, what would we get if we create an indicator that takes into consideration other factors that may be affecting momentum - so while the classic Balance of Power formula looks at where the open and close of a bar are compared to the full bar range, this is only a small part of the insight we need - when we visually inspect a price chart, we also look at many other factors. for example, how the bar closes compared to previous bar(s), how much did the bulls (or bears) managed to move the high (or low) of the bar compared to previous one, how much volume, how is the price spread ...etc
so i wanted to build an indicator that does exactly that - we will give a score of +100 / -100 to each bar based on these factors (some were identified in the linked post) -- imagine here that we are a judge in a tug of war contest (or a beauty contest if you would :)) and we give a score to the participating teams - the scores are given in different "categories" as these teams make effort to win the game (each bar) - to be totally fair, in some scoring categories, we choose to take the average of 3 points for a fair assessment - the final score is calculated based on the average from all judges - and then and average over the desired length is calculated. this score should be very fair and represents the true effort from all angles, right? that would be our UTOPIA :)
in our case, we don't use an average of total score after each category is evaluated, but rather create a directional index (similar to RSI) -- so we can avoid big spikes in the resulting numbers, and maintain a oscillator -like result.
-- the code is commented to explain the various pieces - and how the scoring happen.
the results are interesting - and you can see how the UTO stacks against the classic RSI and BoP - but it's more of a work to build on, rather than a usable indicator - although i do use it in my own trading :)
one final thought here, i came to learn after few years that the best indicators do not necessarily lead to profitable trading. from an indicator standpoint, if everyone else is trading using (for example) a moving average crossover or RSI, then a successful trader should be looking at these classic indicators too, cause these common indicators will drive the mass behavior - and will at many times trigger "self- fulfilling prophesies" in price action - but that's not the only or the biggest reason - the big reasons have to do with the fact that trading needs a lot of effort outside the charts, in researching markets, learning the discipline, then managing positions and managing the portfolio. these are all big topics to put in such short words.
i hope some will find this work inspiring.
Milan OscillatorBill Williams Breakout Setup
I have referred to the man multiple times whether tweeting about him or writing a blog post. Now I want to relearn how breakout trading works, again. A while ago, my friend invited a bunch of us into a Zoom conference sharing us how his setup works for him. He reintroduced me to Bill Williams' indicators which looked like below.
The rules are simple:
Prices are moving away from Alligator, open and closed above the first time.
AC is twice consecutively at par with the direction.
AO is twice consecutively at par with the direction.
Entry on the third candle to be sure, or the second if you're willing to risk it.
The chart above is an example from the 4 hourly time-frame. Before going into any entry, to get a macro perspective, should check on these time-frames first:
Weekly
3 Days
Daily
Bonus points if monthly time-frame is also at par with the bias. Here are the charts for the larger time-frame.
It's been profitable trading with the above setup but then I have an itch to scratch. I wanted to have just a single oscillator instead of two to look at. It will enable me to make decisions faster and can use my brain juice to think about something else.
So I combined the two to create a new oscillator. I call it the `Milan Oscillator` in honor of my friend Patris who reintroduced me to Bill Williams yet again. Patris' favorite team is AC Milan, here's to you bro 🍺
Here are the same charts above with Milan Oscillator.
The rules are a bit different than the rules above:
No entry when the oscillator is gray, this means AC and AO are disagreeing.
Prices are moving away from Alligator, open and closed above the first time.
Oscillator is twice consecutively at par with the direction.
Entry on the third candle to be sure, or the second if you're willing to risk it.
On lower volume moves, prices will retest alligator, can be an entry if the retest fails.
Feedbacks are appreciated.

HFT Scalper IndicatorThis strategy is a scalper strategy developed by HFT Research. Scalper is highly customizable and provides endless opportunities to find profitable setups in the market.
Use Bollinger Bands
This piece of the settings will turn and off Bollinger band’s input in the decision making. BB Length will determine the Moving average you are using to take the standard deviation off of which is named as BB Multiplier. Default settings will use 20 moving average and take standard deviation of 2 to create lower and upper bands. Increasing the Multiplier will give you fewer but safer entries.
Use Bollinger Bands %
This setting will allow the user to determine at what Bollinger band width %, he wants to take start looking to take trades. It is known that when prices are stable and moving sideways, Bollinger bands contract and it becomes more reactive to small moves in the market. Using this setting, you can ignore the signals that would be generated while Bollinger bands are contracted. This setting will allow the user to weed out the noise in the market and really allow them to make the most out of Bollinger bands.
Use RSI
You can also turn on and off the RSI as well. Alternatively, there is an option to use RSI on a different time frame than you are currently on. For example, if you are looking at the 5min chart to use Bollinger bands but you would like to look at the RSI value on the 15min chart. You can do so by selecting the custom RSI timeframe as well as adjusting the Oversold and Overbought value.
Use STOCH
For those who want extra protection on their entry can throw STOCH into their decision making. STOCH acts like RSI but it is more prone to small moves. It will help the users to get a better entry if used correctly. Stoch may not be in the buy zone when RSI is at say 35, however, if price dips a little more and STOCH might be in the buy zone when RSI is at say 20. This way it will help you have better entries than just using RSI. In a way, you can use STOCH to scalp RSI.
Use VWAP
VWAP stands for volume weighted average price. It is an extremely useful indicator when trading intra-day. It does reset every trading session which is at 00:00 UTC. Instead of looking at x number of candles and providing an average price, it will take into consideration volume that’s traded at a certain price and weigh it accordingly.
Use ADX
ADX stands for average directional index. It is an indicator that measures volatility in the market. Unfortunately, the worst market condition for this strategy is sideways market. ADX becomes a useful tool since it can detect trend. If the volatility is low and there is no real price movement, ADX will pick that up and will not let you get in trades during a sideways market. It will allow you to enter trades only when the market is trending.
Use MA Filters
Lookback: It is an option to look back x number of candles to validate the price crossing. If the market is choppy and the price keeps crossing up and down the moving average you have chosen, it will generate a lot of “noisy” signals. This option allows you to confirm the cross by selecting how many candles the price needs to stay above or below the moving average. Setting it 0 will turn it off.
MA Filter Type: There is a selection of moving averages that is available on TradingView currently. You can choose from 14 different moving average types to detect the trend as accurate as possible.
Filter Length: You can select the length of your moving average. Most commonly used length being 50,100 and 200.
Filter Type: This is our propriety smoothing method in order to make the moving averages lag less and influence the way they are calculated slightly. Type 1 being the normal calculation and type 2 being the secret sauce.
Reverse MA Filter: This option allows you to use the moving average in reverse. For example, the strategy will go long when the price is above the moving average. However, if you use the reserve MA Filter, you will go short when the price is above the moving average. This method works best in sideways market where price usually retraces back to the moving average. So in an anticipation of price reverting back to the moving average, it is a useful piece of option to use during sideway markets which is the worst market condition for scalper.
Please visit our website for more information

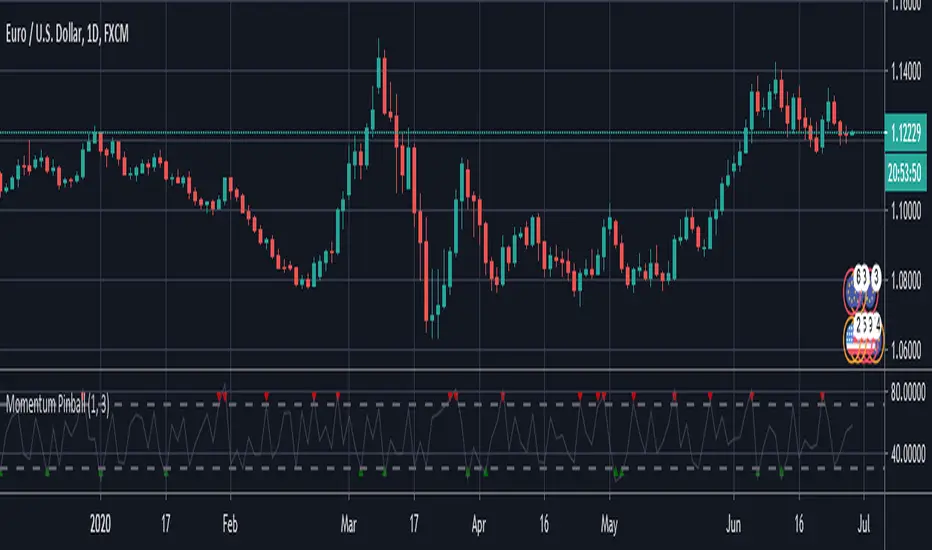
Momentum Pinball////////////////////////////////////////////////////////////////////////////////////////////////
//// Momentum Pinball, when you get a buy/sell signal, wait for the next day
//// enter on the high or low of the first hour and place a stop in the low/high
//// of the first hour. If the day you get filled closes profitable you can decide to close
//// the trade buy the end of the day or hold overnight and exit the following morning
////////////////////////////////////////////////////////////////////////////////////////////
Brick IndicatorBrick Indicator :-
A wonderful book written by "Prashant Shah" named "The profitable trading with renko chart" has been mentioned many technical indicator in this book. But today we are going to tell about an indicator who does a lot of amazing work inside the Renko chart. The Indicator name is "Brick Indicator" works on very simple calculations. Inside it, it is seen how much Brick Bullish was and how Brick was Bearish. Which shows whether the trend is upwards or downwards. At the same time, inside it we use the line of EMA. So that we can catch the trend quickly.
Brick Line Formula: - Numbers of periods bullish candles - Numbers of periods bearish candles
With this line, we put the line of EMA, so that the signals of the market get even better.

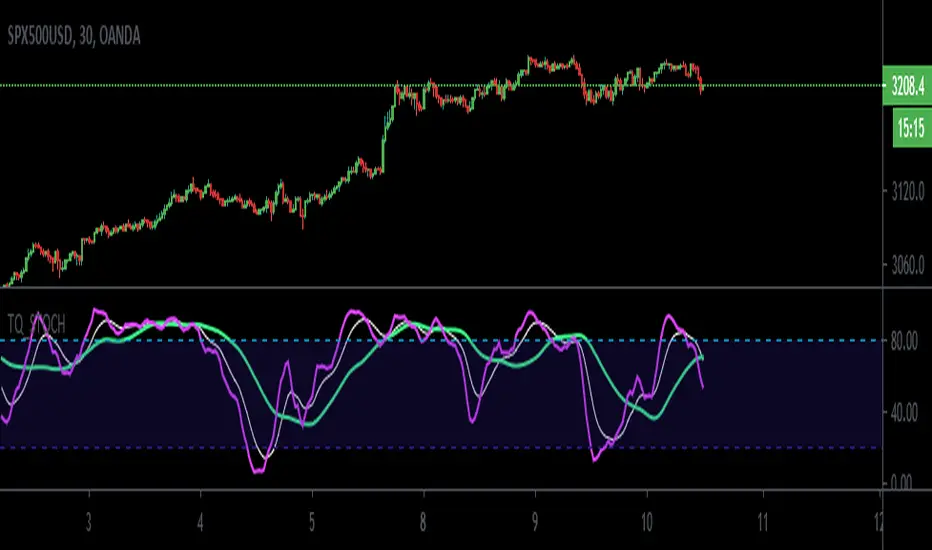
TQ_STOCHThis is a modified stochastic oscillator. It works very well with Forex pairs, traditional markets and has also proved itself profitable with BTC. The aim of this indicator is to help you predict a change in direction of the market.
When lower periods are above higher periods you are looking to buy of support and when lower periods are below higher periods you are looking to sell of resistance.
Lowest period: pink
Medium period: white
Longest period: turquoise
PERFECT LONG: pink line above the white and white above the turquoise. Turquoise should serve as support for the white line and white line should serve as support for the pink line. BUY when pink line tests the white line and bounces off.
PERFECT SHORT: pink line below the white and white below the turquoise. Turquoise should serve as resistance for the white line and white line should serve as resistance for the pink line. SELL when pink line tests the white line and bounces down.
You can also play less perfect signals where pink or white tests blue as support or where white is not above the blue line yet but you still get a test of the white from the pink. These are slightly more risky.
- SOME SIGNAL EXAMPLES:
Enjoy :)
Brick ZoneBrick Zone
Bullish patterns can be traded when the brick count indicator is in a bullish zone while bearish patterns can be traded when it is in a bearish zone. Brick Zone indicator specially designed for renko chart. The brick zone indicator oscillates around the zero line and can also become negative. It will show a positive value when the number of bullish bricks is greater than zero and will turn up a negative value when the number lesser than zero.
Brick Zone = Number of Bullish Bricks – Number of Bearish Bricks
Above zero – Market Bullish
Below Zero – Market Bearish
This indicator inventor name is “Prashant Shah” and this indicator introduced in “Profitable Trading With Renko Chart” Book.

Ema System Ajeet v1.0This is a 5 min, Trend following system
using two Ema's: 20 and 50
Probability of hitting the target is high when both Ema's are:
Rising and almost parallel, for Buying
Falling and almost parallel, for Selling
This will decrease the number of entries but probability of hitting the target is 88%
(Tested on 8 months data for FnO scrips cash on 5 mins data)
Target fixed at 1% or you can trail
SL fixed at 1% or you can take close above Ema20 as stop for buying and vice versa
I tested it on FnO stocks Nseindia with 5 mins chart, you are free to explore
-Ajeet Singh

Vicious Cycle 1.2 [CR] - Enhanced█ OVERVIEW
Vicious Cycle 1.2 is an advanced oscillator-based momentum indicator designed to identify high-probability reversal and continuation setups. This new version features adaptive threshold technology, visual trend state classification, and a higher timeframe alignment system to filter low-quality signals.
The indicator analyzes multiple timeframe components and market dynamics to generate a composite momentum score, which is then smoothed and compared against statistical thresholds. Unlike traditional static oscillators, Vicious Cycle adapts its sensitivity zones to current market conditions, reducing false signals during volatile periods and increasing responsiveness during consolidation.
█ FEATURES
Adaptive Threshold System
The indicator employs percentile-based threshold calculations that automatically adjust to recent market behavior. This ensures optimal signal generation across different instruments and market regimes without manual recalibration.
• Toggle between dynamic and fixed threshold modes
• Adjustable lookback period for threshold calculation (50-500 bars)
• Customizable percentile levels for sensitivity tuning
• Separate calibration for overbought and oversold zones
Visual Trend State Classification
Background coloring provides instant visual feedback on market condition strength without requiring analysis of indicator position. The six-state classification system combines oscillator position with signal line relationship to identify:
• Strong bullish momentum
• Moderate bullish bias
• Weak bullish condition
• Weak bearish condition
• Moderate bearish bias
• Strong bearish momentum
Higher Timeframe Trend Alignment
An optional filtering system analyzes higher timeframe trend direction to block counter-trend signals. Two modes are available:
• Single EMA Mode: Uses price position relative to a customizable moving average
• Dual EMA Mode: Employs fast and slow moving average crossover logic
The filter only permits long signals during bullish trends and short signals during bearish trends, significantly improving signal quality in trending markets.
Signal Detection Modes
Multiple signal generation methods accommodate different trading styles:
• Zone-Based Signals: Fires when oscillator crosses key threshold levels
• Signal Line Cross: Generates entries based on oscillator and signal line interaction
Comprehensive Alert System
Pre-configured alert conditions cover all major indicator events:
• Primary signal alerts (zone cross and signal line methods)
• Zone entry and exit warnings
• Extreme level notifications
• Trend filter status changes
• Convenience aggregators for "any long" or "any short" condition
█ HOW TO USE
Initial Configuration
The indicator ships with optimized default settings suitable for most instruments and timeframes. New users should observe the indicator's behavior for at least 50 signals before adjusting parameters.
1 — Add the indicator to your chart and leave default settings unchanged.
2 — Monitor signal generation and background color transitions for several trading sessions.
3 — Set up basic alerts using the "ANY LONG Signal" and "ANY SHORT Signal" conditions.
4 — After observation period, adjust sensitivity based on your instrument's characteristics.
Threshold Configuration
For instruments with higher volatility, increase the percentile values (example: 90/75 instead of 85/65). For ranging or lower volatility instruments, decrease percentile values (example: 80/60 or 75/55).
The lookback period controls how quickly thresholds adapt to changing conditions. Longer lookbacks (150-200) provide smoother adaptation, while shorter lookbacks (50-75) offer more responsive adjustments.
Trend Filter Guidelines
Enable the trend filter in clearly trending markets to reduce whipsaw trades. In ranging or choppy conditions, consider disabling the filter or using a shorter EMA period.
• For position trading: Use 200-period single EMA
• For swing trading: Use 150-period single EMA or 50/200 dual EMA
• For day trading: Use 100-period single EMA or 50/100 dual EMA
If the filter blocks all signals, the market may be ranging near the trend reference level. This is intentional behavior designed to keep you out of low-probability setups.
Signal Interpretation
Primary signals occur when the oscillator crosses threshold zones or intersects the signal line in extreme regions. The strongest setups combine:
• Signal generation in the expected direction
• Background color matching the trade direction (bright colors indicate high conviction)
• Trend filter alignment
• Price action confirmation at key support or resistance levels
█ NOTES
Alert Configuration
Alerts must be manually configured in TradingView and do not activate automatically. Access the alert menu by clicking the indicator name and selecting "Add Alert on Vicious Cycle 1.2...". Choose your desired condition from the dropdown menu and configure notification preferences.
We recommend starting with the aggregated "ANY" alerts rather than subscribing to all individual signal types, as this prevents notification overload during active market periods.
Dynamic Threshold Behavior
The adaptive threshold system requires sufficient historical data (minimum equal to the lookback period setting) to calculate percentiles accurately. During the initial bars, threshold values may appear unusual until adequate history accumulates. This is expected behavior and resolves automatically.
Performance Considerations
The indicator performs percentile calculations on each bar using array operations. While optimized for efficiency, users experiencing performance issues on lower-end devices may reduce the dynamic lookback period or disable the adaptive threshold feature to use fixed thresholds instead.
Compatibility
Vicious Cycle 1.2 is built on Pine Script version 6 and works on all instrument types and timeframes. The indicator does not repaint—all signals finalize at bar close. Historical signals remain stable and do not change with additional price data.
█ RISK DISCLOSURE
This indicator is an analytical tool and does not constitute financial advice. No indicator or trading system guarantees profitable results. Always employ proper risk management, position sizing, and stop-loss protocols. Past performance does not indicate future results. Users are responsible for their own trading decisions and outcomes.

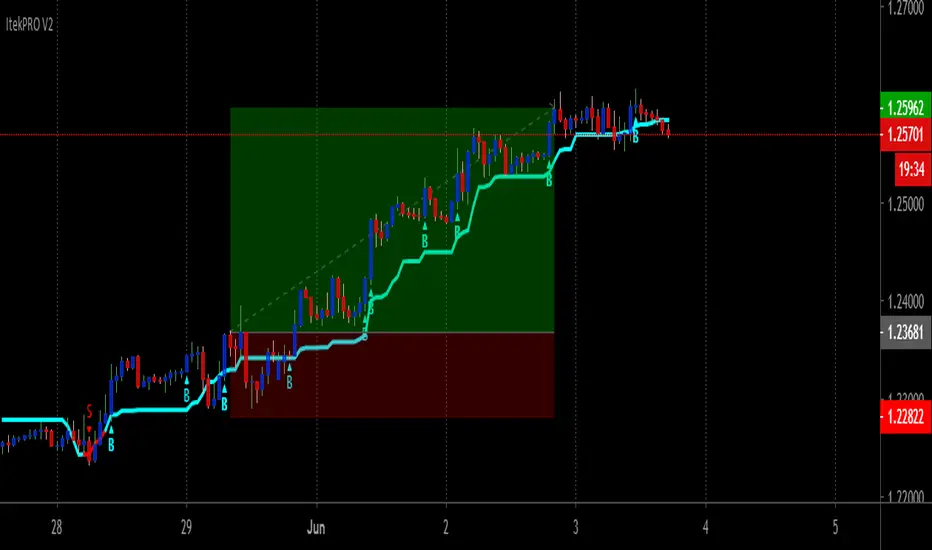
ItekPRO V2Itek PRO V2 Is An New Version of Iteksignal Trading System With Multiple BUY/SELL Entries And Exits That Can Be Used On Any Market!
An efficient way to Trade Manually Rule-Based and safely is with Itek PRO V2, a price action trend continuation Systen Trading.
GREAT for Swing Traders, Position Traders, or Investors. Works on Forex, Crypto, Stocks, Commodities.
This powerful indicator will work on just about ANY symbol and chart so that you can capture either smaller moves, or larger moves.. find the right symbol and time frame for your style of trading and use this amazing strategy to pull profitable trades.
TREND Direction and Trend Turns Are Clearly Indicated With The Built In Color-Coded Trend Line Indicator
When the trend line is BLUE the trend is headed UP, when its RED the trend is headed DOWN, when the trend line is flat it may indicate sideways conditions. The potential TREND TURNS can be seen by the change in the SLOPE and confirm by the change in the COLOR.
Signals produced by the indicator are very easy to read, completely Non-Discretionary.
Here’s How It Works
Entry Signals
Once Itek PRO V2 indicator has spotted an entry point, it clearly displays a Buy or Sell Signal on your chart, showing you exactly where possible entry to continue with the trend or start a new one.
Trade Setup Definitions
· Signal bar: It is the closed bar where the indicator is plotted (Blue or Red dots) in the chart.
· Entry bar: The first bar after the signal bar that reach the high of the Signal bar.
Setup Entry Rules
· Rule 1: Wait for the Signal bar closes. Enter the Long trade 1-2 pips above the high of the signal bar (Opposite for Short).
· Rule 2: If the HIGH of Signal Bar is near an important resistance level enter the trade 1-2 tick above resistance.
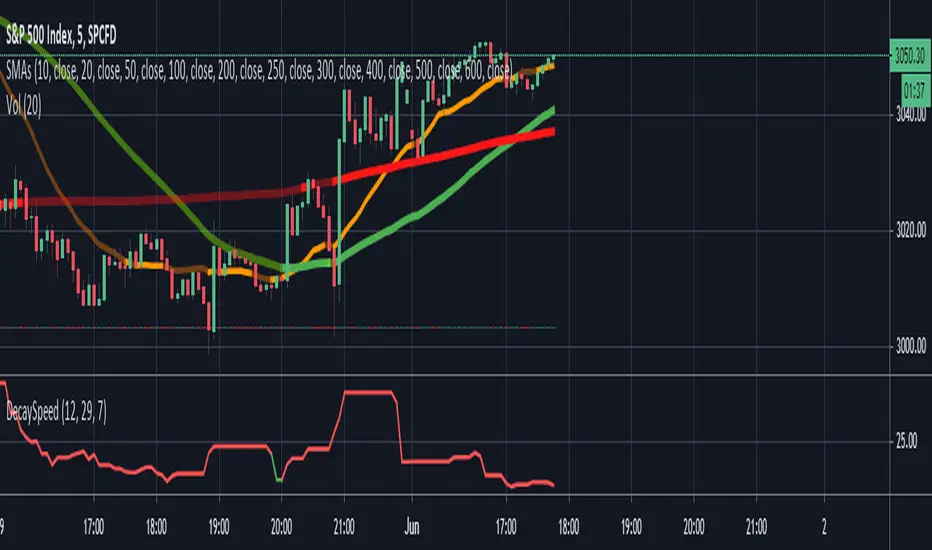
Options Decay Speed for 0DTEUse only for:
SPX, 5 minutes time frame
This indicator is complementing options 0DTE strategy - selling options for SPX index in the same day as they are expiring. Output of the indicator (red or green color of the curve) indicates whether is profitable to sell options at given moment at delta and VIX specified in the parameters. Changing parameter "Candles" is not recommended.
Main thought is that options expire with certain speed (theta decay) when stock doesnt move. When stock moves in unfavorable direction slowly enough, decay speed can compensate for disadvantage coming from option delta. Intuitively there must be certain speed of stock value change (expressed in stock value per 5 minutes) that is exactly compensating theta decay. This indicator calculates those two values (details below) and shows, where theta decay is faster than stock movement in the last hour and thus favorable to sell options.
Indicator gets its result from comparing two values:
1) volatility in the form of highest high and lowest low for past 12 candles (one hour in total) divided by 12 - meaning average movement of stock expressed in
2) speed of options value decay in form of combination of theta decay and option delta. Formulas are approximation of Black-Scholes model as Pine script doesnt allow for advanced functions. Approximations are accurate to 2 decimal points from market open to one hour before market close and will not indicate green when accuracy is not sufficient. Its value is also expressed in so its mutualy comparable.
My focus was not on code elegance but on practical usability.
Written by Ondřej Škop.
DMT Ladder AutobotDMT Ladder Autobot Study it's unique super trend indicators that measure the volatility from the current price action with ATR recognitions and custom setting
in this version, we can find that DMT Autbot also Ladders long entry and short entry in 4 different steps you can set your calculations depending on your requirements and pair volatility calculations
to recover your entry DMT will turn loosing trading into winning trades with the right risk management.
1 long signals
4 ladder Long add signals
1 short signals
4 ladder short add signals
1 dynamic stop calculated from your average entry price
1 dynamic take profit calculated from your average entry price
Please pm me for access or larger explanations about the script or for full pdf tutorial
thx for your support
@Shenlong

LuxAlgo® - Oscillator Matrix™Oscillator Matrix™ is an all-in-one indicator that incorporates 6+ unique components designed for interoperability & confluence with one another to provide a powerful trend following & reversal detection experience.
Users can create various ways to utilize the indicator's features together such as looking for excess money flowing into the market alongside strong reversal signals appearing or getting real-time divergence signals alongside a lack of money flowing into the market to predict upcoming trends.
This indicator is described as an 'Oscillator Matrix' as it's made up of many different components that can create a systematic approach to analyzing markets alone, however, the indicator also can serve as a great secondary piece to a user's primary analysis with or without our other LuxAlgo Premium indicators.
🔶 FEATURES
Below we describe each component of Oscillator Matrix™ in order of each's significance for the most confluent analysis possible.
Money Flow - Easily see the amount of buying or selling liquidity entering the market by analyzing the green & red waves and how they react with their thresholds to achieve further insight. Best to analyze first before considering any signals the indicator can generate.
Thresholds - Dynamic levels that align above/below the Money Flow to show at which level significant buying or selling is actually taking place.
Overflow - Small lighter waves that occur within the Money Flow's display when excess buying or selling activity is occurring to accurately predict upcoming reversals.
Hyper Wave - An oscillator ribbon in green/grey that provides highly reactive trend following signals & powerful divergence detection.
Real-Time Divergences - Real-time divergence labels that appear on the Hyper Wave oscillator's adaptive ribbon. A highly effective approach to a concept that's not typically done for oscillators. Users can also increase the sensitivity of divergences within the settings.
Reversal Signals - Small dots on the upper or lower boundaries represent high frequency points that indicate possible reversals or a warning signal to upcoming larger reversal signals which are indicated separately by the large triangular arrows on the top & bottom of the indicator's panel.
Confluence Zones - Allows the Money Flow & Hyper Wave oscillator to be used together to display easily interpretable shades of bullish & bearish activity. Brighter, more vibrant colors indicate strong bullish or bearish confluence between these 2 features.
Confluence Meter - An optional display at the current bar to easily find the current level of confluence between all features within Oscillator Matrix™ indicated by the arrow pointing to bullish or bearish levels. (Disabled by default)
Generally, we recommend using these features in order from first to last, whereas analyzing components of the Smart Money Flow category prior to considering other features in your analysis is most productive to ensure you find proper confluence alongside any signal that is generated.
🔶 USAGE
In the image below, we can see 5 points of interest to a user analyzing Oscillator Matrix™ based on various different behaviors.
Point 1 : Here we can see a large reversal signal arrow at the bottom of the panel. These signals, like all signals in LuxAlgo Premium & any indicator in general are not meant to be used as buy/sell signals themselves.
What makes this signal particularly more of interest opposed to other reversal signals that may not play out right away is the Money Flow that corresponding as weak. We can tell the Money Flow is weak because it is not near the red threshold level.
This indicates to us that there is not real selling pressure occurring and that the market could easily reverse in these conditions.
Point 2 : In this specific area we can notice the Money Flow in green is moving upwards alongside the green threshold level. This combination indicates a high probability there is a lot of real buying volume coming into the market, opposed to the previous example (point 1) where the Money Flow was not near the threshold level.
We can also notice the Hyper Wave Oscillator is printing a green dot while above the 50 value on Oscillator Matrix™ panel, further indicating a likely bullish impulse to come.
Point 3 : There are multiple indications here showing us the market may potentially be reversing. The most notable being the larger red reversal arrow, however, as we mentioned previously these cannot be used by themselves.
A further indication is that on the Money Flow we can see Overflow has occurred by the lighter small wave that has appeared & is now turning downwards. This indicates that an excess of buyers have come into the market & are likely to be washed out with a move to the downside.
We can see this happen once again about 8 candles later paired with a high frequency reversal signal (red dot) which marked a local high before the larger impulse down.
Point 4 : You can notice during the recent 25 or so candles the high frequency reversal points (green & red dots) have been highly effective for indicating potential local highs & lows in real-time.
There was a previous real-time bullish divergence detected while Money Flow was strongly in the red and this did indicate a small move upwards, however, with the Money Flow still holding in the red, another high frequency reversal dot, and then as the Money Flow begins to decrease further, we see a clean local top detected here at point 4.
Point 5 : As the lower Confluence Zone moved into the bright red, we saw a large move to the downside and a large bullish reversal signal printed in real-time as well.
Just like point 1, we have a very clear indication the selling has stopped as we further analyze the Money Flow is nowhere near it's true Activity Line.
This analysis combined gave us a further indication of a larger reversal which played out with no lag at all as all reversal signals are fully predictive separate from the Hyper Wave oscillator itself, which can be used as a further trend following approach alongside signals & money flow.
🔶 NAVIGATING MARKET CONDITIONS
In the image above we can see another example with 6 new points of interest marked in green & red shaded areas, all accompanied by a list of possible interpretations of the indicator.
The importance of this usage example is to demonstrate the ability to focus on certain components of the indicator during specific market conditions. For any indicator attempting to catch reversals, trending market conditions will be a detriment to its usability.
The same amount of the components within Oscillator Matrix™ will support trending market conditions as there are components to support ranging market conditions. The indicator further aims to provide clear abilities to detect when the market is likely trending or ranging.
With an understanding of the components within the Smart Money Flow section particularly such as the Overflow & Thresholds, it's possible to develop a more significant understanding of when to consider the market is trending vs when to consider the market may be ranging.
By doing this, we can potentially determine at certain points when to 'filter out' reversal signals or to just consider them merely indications of local tops/bottoms opposed to significant tops/bottoms.
Analyzing a significant Overflow particularly is useful to consider a trend potentially coming to an end. For example, at point 5 in the image above we had a clear downtrend only until there was a very considerable amount of Overflow that begun a real reversal.
We recommend studying the outlined chart above & the list of indications at each shaded area to develop a deep understanding of how to navigate varying market conditions & spot various points of confluence during reversals.
🔶 CONCLUSION & ACCESS
This indicator is an extremely comprehensive approach to an oscillator that allows users to further develop a systematic approach to trading and can be paired great alongside other forms of technical analysis such as our LuxAlgo Signals & Overlays indicator.
Although we believe this indicator to be useful, it's critical to understand that past performance is not necessarily indicative of future results and there are many more factors that go into being a profitable trader.
You can see the Author's instructions below to get instant access to Oscillator Matrix™ & our LuxAlgo Premium suite.

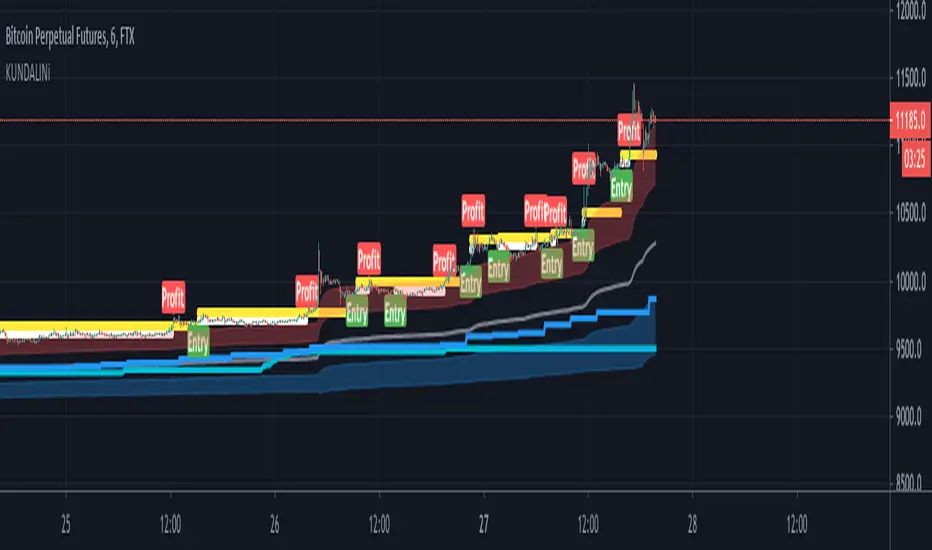
KUNDALINiThis is the STudy Version of The Kundalini is a technical indicator. Based on algorithm calculations, this indicator extrapolates the previous price for the next bar. Plus addition Multi time frame ATR volatility Reading environment for higher conditions
Here is how Dominator is calculated:
1. The study estimates the price projected for the next bar. The estimated price is based on the algorithm method.
2. The study extrapolates this value to find a projected price change for the next bar.
The resulting extrapolated value is shown as a histogram on a lower subgraph. By default, sections of the histogram where the extrapolated value is increasing are shown in green; sections corresponding to the decreasing value are shown in red.
Note: Value projection is purely mathematical as all calculations are based on algorithm averaging of previous values.
additional volatility models clouds on blue and red for bearish and bullish markets
Overlay True
The strategy includes 3 different adjustable levels for the ladder , plus automatic adjustable stop loss and takes profit calculated from your average entry price after each ladder adds.
Adjustable BAcktest Window.
1 long signals
3 ladder long add signals
1 short signals
3 ladder short add signals
1 dynamic stop calculated from your average entry price
1 dynamic take profit calculated from your average entry price
Please Private Msg me if you like more info about the script Full pdf available or if you need access to it
thx for your time and support
Correlation Cycle, CorrelationAngle, Market State - John EhlersHot off the press, I present this "Correlation Cycle, CorrelationAngle, and Market State" multicator employing PSv4.0, originally formulated by Dr. John Ehlers for TASC - June 2020 Traders Tips. Basically it's an all-in-one combination of three Ehlers' indicators. This power packed triplet indicator, being less than a 100 line implementation at initial release, is a heavily modified version of the original indicator using novel techniques that surpass John Ehlers' original intended design.
This is also a profound script in numerous ways. First of all, these three indicators are directly from the illustrious mastermind himself Dr. John Ehlers. Secondarily, this is my "50th" script published on TV, which makes it even more significant. I'm especially proud of this script to "degrees" of imagination I once didn't know was theoretically possible in code. My intellect has once again been mathemagically unlocked pondering new innovations with this code revelation. Thirdly, this PSv4.0 script shows the empowering beauty and elegance of hacking the stock markets with TV's ultra utilitarian Pine Editor(PE) in a common browser! Some of you may be wondering if I worked on this for days... nope! This only took a few hours, followed by writing this description for another hour plus.
I have created many of Ehlers' indicators in PE, a few of which I have published in my profile, but I wanted to show how programming with Pine Script can be an artistic form of craftsmanship and poetry. None of this would be possible without the ingeniously minded Tradingview staff revolutionizing algorithmic trading at it's finest. If you should ever encounter them by chance, ponder humbly thanking these computing wizards for their diligence and dedication. They are providing, and shall award to us members, some of the most fascinating conceptualized tech imaginable in the coming future. I can assure you, much, much more is yet to be unveiled for us TV members/enthusiasts. Thank you TV and all you offer to this community.
As always, I have included advanced Pine programming techniques that conform to proper "Pine Etiquette" by example. There are so many Pine mastery techniques included, I don't have an abundance of time to elaborate on all of them. For those of you are code savvy, you may have notice I only used one "for" loop for increased server efficiency, instead of the two "for" loops in the original formulation. For those of you who are newcomers to Pine Script, this code release may also help you comprehend the immense "Power of Pine" by employing advanced programming techniques while exhibiting code utilization in a most effective manner. This is commonly what my dense intricate code looks like behind the veil. If you are wondering why there is hardly any notes, that's because the notation is primarily in the variable naming.
Features List Includes:
Dark Background - Easily disabled in indicator Settings->Style for "Light" charts or with Pine commenting
AND a few more... Why list them, when you have the source code!
The comments section below is solely just for commenting and other remarks, ideas, compliments, etc... regarding only this indicator, not others. When available time provides itself, I will consider your inquiries, thoughts, and concepts presented below in the comments section, should you have any questions or comments regarding this indicator. When my indicators achieve more prevalent use by TV members, I may implement more ideas when they present themselves as worthy additions. As always, "Like" it if you simply just like it with a proper thumbs up, and also return to my scripts list occasionally for additional postings. Have a profitable future everyone!

Percent Trailing Stop (%) - For Study Scripts===========
Percent Trailing Stop (%) - { FOR STUDY SCRIPTS }
===========
Wow - this is an example of how to implement Alerts relating to a Trailing Stop (%) within your Study Script. It's taken a bit of effort to get this working but I think we got there!
Alerts include Open Long/Short, Trailing Stop Hit, and (the most important one) Movement of Trailing Stop! <- this is actually really quite good, by the way! :)
You can ignore the actual entry/exit orders - they're based on a simple MA cross and are therefore NOT relevant, NOT profitable and NOT recommended!
You should be using this code as a way of adding a Trailing Stop to your own scripts - hope it helps!
Set your "Open Long/Short" Alert to "Once per Bar Close" - Set your "Trailing Stop Hit" Alert to "Once per Bar" - Set your "Move TSL" Alert to "Once per Bar Close". - You're all done! Enjoy.
-----------
Good Luck and Happy Trading!

Fixed Percent Stop Loss & Take Profit % - For Study Scripts===========
Fixed Percent Stop Loss & Take Profit % - { FOR STUDY SCRIPTS! }
===========
A neat example of how to set up Fixed Stops and Take Profit as a percent of the entry price - This is for setting Alerts within your own Study Script for when either your SL or TP get hit.
Yup, that's about it!
You can ignore the actual entry/exit orders - they're based on a simple MA cross and are therefore NOT relevant, NOT profitable and NOT recommended!
You should be using this code as a way of adding Stops and Takes to your own scripts - hope it helps!
Set your "Open Long/Short" Alerts to be triggered "Once per Bar Close" - Set your "SL/TP" Alerts to trigger "Once per Bar".
--
We wrote this with a bit of a rush on! ~ If you spot any mistakes/bugs just let us know and we'll get round to them asap!
-----------
Good Luck and Happy Trading!

CactusTrend-8HThis a trend based indicator that can help with finding both low timeframe and high timeframe trends within price action. I personally like to use this indicator on a 8H timeframe (2h also works well), the clouds represent high timeframe trend, bullish when blue and bearish when red. The candles themselves are coloured based on low timeframe trend when red PA is bearish LTF and when blue PA is bullish LTF. I think using both trend indicators together can be pretty rewarding, as it can be super profitable to take LTF profits when price is touching HTF trend support etc.

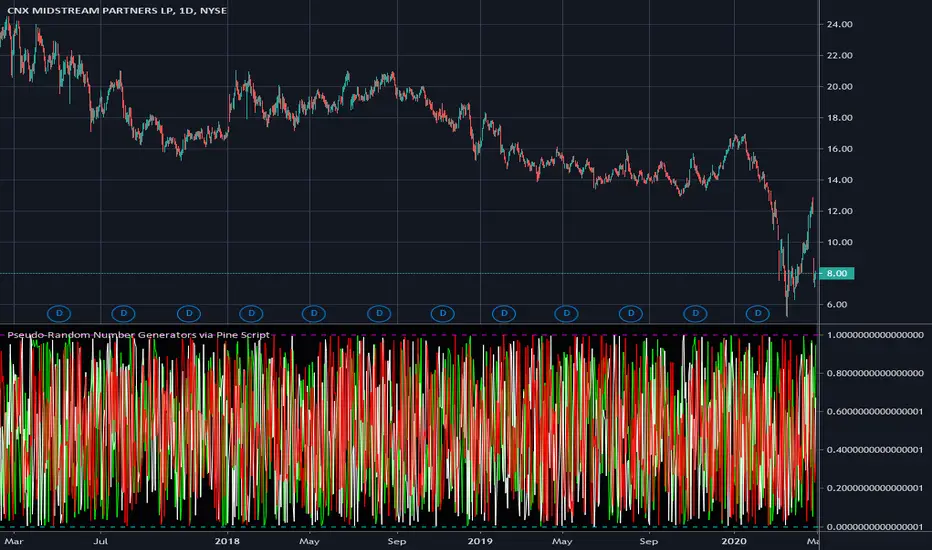
Pseudo-Random Number Generators via Pine ScriptThese are my "Pseudo-Random Number Generators via Pine Script", having uniform distribution between 0 and 1. In my quest for sequential pseudo-random numbers in Pine, tinkering with mathematical chaos, I have come up with these three simple yet handy generators. I believe these may be useful in the future by developers of the Tradingview community.
NOTICE: Use it as you please, this is free code to implement into your new Pine projects. You don't have to ask for my permission to reuse these functions in your published scripts, simply because I have better things to do than answer requests for the reuse of these simplistic PRNG functions. I don't require accreditation for members to reuse these functions either. I simply don't want any credit. I only require that you respectfully put it to "good and proper use" complimenting the elaborate script you have in mind. I would however like to see some great ideas utilizing these when I randomly and accidentally come across them in the public library. I didn't know where to put this script, so I just tossed it into the "Trend Analysis" category.
The comments section below is solely just for commenting and other remarks, ideas, compliments, etc... regarding only this indicator, not others. When available time provides itself, I will consider your inquiries, thoughts, and concepts presented below in the comments section, should you have any questions or comments regarding this indicator. When my indicators achieve more prevalent use by TV members, I may implement more ideas when they present themselves as worthy additions. As always, "Like" it if you simply just like it with a proper thumbs up, and also return to my scripts list occasionally for additional postings. Have a profitable future everyone!
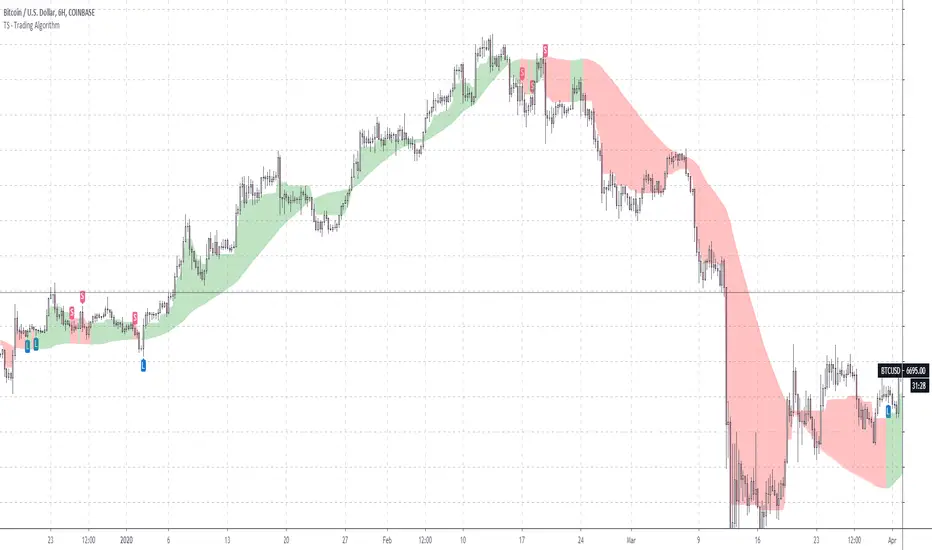
TS - Trading AlgorithmWhat is it?
The Tradespot MA Algo is an all in one, profitable moving average based trading strategy that presents long and short opportunities.
This indicator does not repaint. Once a bar has closed, the signal will remain permanently printed onto the chart.
What can I do with it?
Use on the following markets:
COINBASE:BTCUSD
COINBASE:ETHUSD
COINBASE:ETHBTC
Timeframe: 1D
What does each signal mean?
Long label is a strong buy signal
Short label is a strong sell signal
X's indicate a warning telling you that you should possibly exit your position. You should review these signals alongside other indicators such as volatility.
Review X signals?
Yes, there are concrete buys and sells but the X's indicate possible exits that might also be fakeouts, we can created the perfect indicator set up to review these with our TS - Trend Confirmation indicator and our TS - Volatility Screener indicator
How do I get access?
Please contact me on TradingView for details.
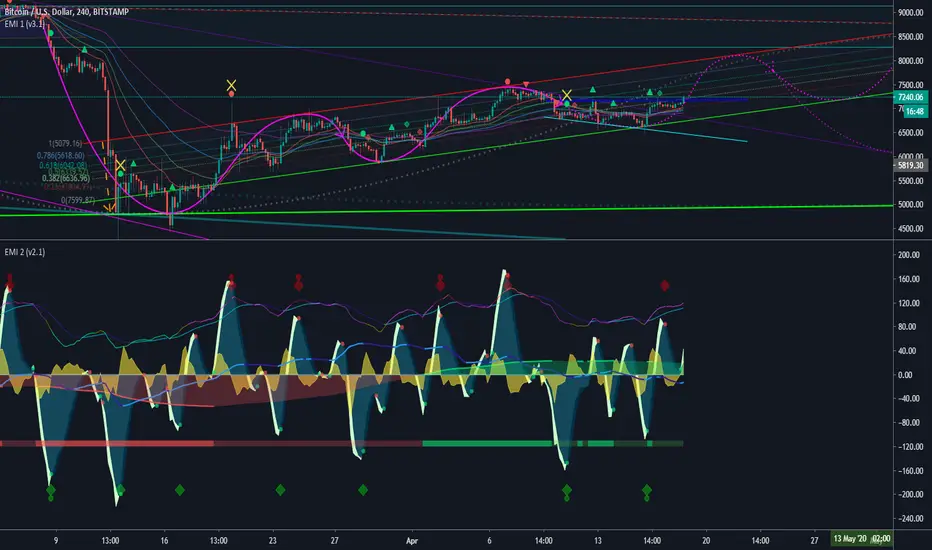
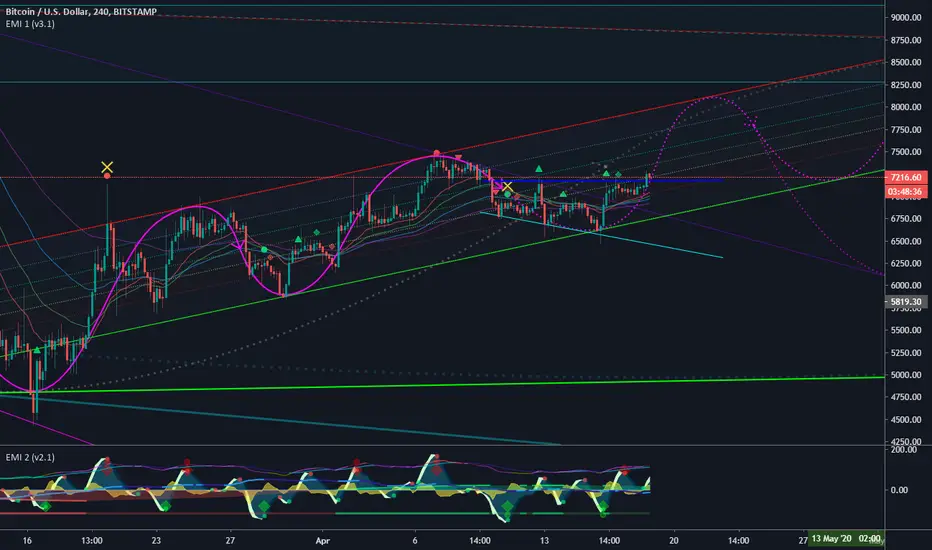
EMI 1 (v3.1)After months and months of back-testing. I finally decided to release this update. Would also like to give out a special thanks to TradingView for making it possible to create scripts and share this with the community. I have acquired a lot of information in this community. I believe that when you take, you should also share. That’s why I am sharing this wonderful indicator for free. Remember, knowledge and experience is the most valuable things in life.
EMI, short for Epic Market Indicator:
60-80% theoretically profitable trades, depending on the time period. However if you use EMI blindly, the percentage might even go lower. Nevertheless, there should be enough presenting opportunities, if you use her wisely. Remember, like any instrument, 'practice makes perfect'.
EMI 1 is actually a combination of diverse indicators:
Tesla EMA/SMA Ribbon: Periods based upon Nikola Tesla's favorite numbers; 3, 6, 9. (Disabled by default)
Fibonacci EMA Ribbon: Periods based upon Fibonacci frequency; 21, 34, 55, 89. (Enabled by default)
Regular EMA/SMA Ribbon: Periods based upon Standard frequency; 10, 20, 100, 200. (Disable by default)
Pivots (Disabled by default).
Bollinger bands (Disabled by default).
Bar trend color (Disabled by default).
Buy & Sell signals, which makes EMI a unique indicator: Based upon diverse indicators & oscillators buy or sell signals. Not predictions, but high probabilities.(Enabled by default, obviously ^^ )
Red symbols are sell or short signals / Green symbols are buy or long signals.
Dots represents possible price action trend reversals and the diamond symbols could be a possible confirmation and the big X is even a stronger confirmation signal. (A top or bottom, not THE bottom or top). These signals are based upon certain buy & sell conditions by a diversity of indicators known by most traders. Think for example, crossing EMA’s, Stochastic RSI , MACD , oversold and overbought territories.
New v3.1:
Modified to even more accurate buy & sell signals
Yellow X
Bar trend colors based on Money Flow Velocity or Money Flow
The signal conditions are based on different oscillators, known by many traders. ALWAYS wait for the candle to close and preferring even more confirmations before taking any consideration nor actions. No signals means most of the time trend continuation. EMI 2 in combination with EMI 1 and traditional authentic pattern formations with a darkened theme is recommended. For more explanation please ask my on streams or join my academy once it's online!
Good luck fellow traders and don't forget to tap the like & follow button. Thanks in advance.
EMI 2 (v2.1)After months and months of back-testing. I finally decided to release this update. Would also like to give out a special thanks to TradingView for making it possible to create scripts and share this with the community. I have acquired a lot of information in this community. I believe that when you take, you should also share. That’s why I am sharing this wonderful indicator for free. Remember, knowledge and experience is the most valuable things in life.
EMI, short for Epic Market Indicator:
60-80% theoretically profitable trades, depending on the time period. However if you use EMI blindly, the percentage might even go lower. Nevertheless, there should be enough presenting opportunities, if you use her wisely. Remember, like any instrument, 'practice makes perfect'.
This indicator is a combination of different oscillators:
Common:
MACD
VWAP
RSI
Stochastic
Money Flow
Money Flow Velocity
Buy & Sell signals
Bottom & Top signals
Volume Flow heat map
New v2.1:
Money Flow Velocity
RSI added level 1 & 2 over-bought or -sold territories
Modified Top & Bottom conditions
Modified algorithms for even more accurate analysis
Modified Money Flow settings
RSI turns green or red when entering overbought or oversold territories.
Dots on wave crossings are buy or sell signals.
Diamonds above are possible bottoms and tops.
Green = Possible Bull/Bottom signals
Red = Possible Sell/Top signals
The signal conditions are based on different oscillators, known by many traders. ALWAYS wait for the candle to close and preferring even more confirmations before taking any consideration nor actions. No signals means most of the time trend continuation. EMI 2 in combination with EMI 1 and traditional authentic pattern formations with a darkened theme is recommended.
Good luck fellow traders and don't forget to tap the like & follow button. Thanks in advance.