Volume Profile Bar-Magnified Order Blocks [MyTradingCoder]Introducing "Volume Profile Bar-Magnified Order Blocks", an innovative and unique trading indicator designed to provide traders with a comprehensive understanding of market dynamics. This tool takes the concept of identifying order blocks on your chart and elevates it by integrating a detailed volume profile within each order block zone.
Unlike standard order block indicators, Volume Profile Bar-Magnified Order Blocks pulls data from lower timeframe bars and assigns it to various segments of the order block. By providing this volume profile inside the order block, the indicator supplies a deeper, multi-dimensional view of market activity that can enhance your trading decisions.
Crucially, users have the ability to fine-tune the detection of order blocks. This is made possible through a single input setting called "Tuning". This integer value allows you to control the significance and frequency of the order blocks. Higher numbers will produce more significant order blocks, though they will appear less frequently. Lower numbers, on the other hand, will yield less significant order blocks, but they will occur more often. This enables you to adjust the sensitivity of the indicator according to your specific trading strategy and style.
Key Settings:
Number of Segments: Customize the level of detail in your volume profile by selecting the number of segments you want inside each order block.
Tuning: Adjust the sensitivity of order block detection to align with your trading strategy. Higher values produce more significant but less frequent order blocks, while lower values yield less significant but more frequent order blocks.
Color Inputs: Personalize the look of your chart by selecting the colors for various elements of the indicator. This ensures a seamless integration with your current chart aesthetics and improves visual clarity.
Here is a s creenshot that beautifully demonstrates the power of this indicator. You'll see how the price rejects perfectly off the highest volume segment in an order block, showcasing the indicator's potential for pinpointing high-impact price levels.
While Volume Profile Bar-Magnified Order Blocks offers many unique features, it should be used in conjunction with other indicators and forms of analysis for a complete trading strategy. As with all tools, it does not guarantee profitable trades but is intended to give traders more information to base their decisions on. Use it to complement your existing analysis and enhance your understanding of market behavior.
Experience a new level of clarity in your trading with Volume Profile Bar-Magnified Order Blocks - an indicator that goes beyond the surface to help you navigate the markets more effectively.
Pesquisar nos scripts por "profitable"

nNouSignnNouSign
☆
Welcome to a path to trading success in the world of trading, where fortunes are made and dreams come true.
But amidst the excitement and possibilities, there lies the challenge of deciphering the market's complexities.
Fear not, for we present to you the ultimate weapon in your trading arsenal: the nNouSign indicator.
Prepare to embark on a thrilling journey of trading mastery as we guide you through its optimal usage, enlightening you with its potential and empowering you with the ability to navigate the markets with confidence.
Embracing the nNouSign magic as you apply the nNouSign indicator to your TradingView chart, envision a realm where the convergence of art and science births incredible trading opportunities.
• The indicator's smooth moving average line, represented by a vibrant orange hue, acts as your guiding light. It captures the essence of market sentiment and unveils the hidden patterns that govern price movements.
Decoding the colors of success, possess a mystical power to evoke emotions and ignite motivation . The nNouSign indicator harnesses this power, allowing you to personalize your trading experience.
• Choose the color of prosperity for your buy signals, perhaps a vivid shade of green. Let it symbolize the life-giving force of profits flowing into your trading account.
• As for sell signals, embrace the passionate intensity of red, signifying your ability to seize opportunities and protect your gains.
Riding the trend waves is one of the nNouSign indicator's core strengths. It lies in its ability to identify trends.
Whether the market surges upwards like a fearless tide or recedes like a wise old ocean, the indicator whispers the secrets of trend direction.
• When the moving average is conquered by the closing price, rejoice, for it signals a bullish trend.
• Conversely, when the closing price descends beneath the moving average, it reveals a bearish trend.
Harmonizing with the trading signals which are the magical spells that teleport you to the forefront of profitable trades.
Watch as the nNouSign indicator casts its spells in the form of tiny triangles on your chart.
• When a bullish trend is confirmed, a mystical triangle points upwards, signaling a buy opportunity.
• On the contrary, when a bearish trend emerges, a bewitching triangle points downwards, beckoning you to sell.
Embrace these signals and let them guide your path to success.
Unleashing the power of alerts like the modern trader(s) whom thrives on speed and efficiency.
The nNouSign indicator empowers you with its alert system , ensuring you never miss a precious trading moment.
• Customize your alerts to receive notifications when the bullish or bearish trends are confirmed.
Imagine the thrill of being the first to seize an opportunity, swiftly executing trades with confidence, and reaping the rewards.
Dance with the trendline as you journey through the market's ebb and flow, through the nNouSign indicator its visual masterpiece.
Behold the trendline , gracefully drawn on your chart.
• In the presence of a bullish trend, it steps aside, allowing the moving average to shine brightly.
• Yet, in the depths of a bearish trend, it emerges, painted in shades of red, serving as a reminder to exercise caution.
Let this visual spectacle guide your decision-making process.
☆
Intrepid trader! ,may you now have unlocked the secrets of the nNouSign indicator and embark on a journey that will forever transform your trading experience.
Armed with its wisdom and most importantly YOUR OWN WISDOM, may you possess the ability to navigate the markets with confidence and precision.
Embrace its vibrant colors, heed its trading signals and dance with the trendline as you ride the waves of market trends. Let the indicator be your constant companion, guiding you through the ever-changing tides of the financial world.
Remember, trading is not just a science; it is an art. The nNouSign indicator provides you with the tools to create your masterpiece.
Embrace its colors, for they evoke the emotions and motivation necessary for success.
Let the green of buy signals ignite your passion for profit, and the red of sell signals fuel your determination to protect your gains.
But trading is more than just following signals; it requires discipline and adaptability.
Observe the trendlines and understand the market's rhythm.
Be patient when the trend favors the bulls, and exercise cautio n when the bears take control.
The nNouSign indicator, with its magical trendline, will be your compass in navigating these changing conditions.
In the fast-paced world of trading, timing is everything. The alerts generated by the nNouSign indicator will keep you informed, ensuring you never miss an opportunity.
Stay alert, for swift and decisive action can be the key to reaping substantial rewards.
☆
Finally, remember that trading is a journey of growth and learning.
Embrace the educational aspect of using the
nNouSign indicator.
Analyze your trades, study the outcomes, and fine-tune your strategies.
With each trade , you'll gain valuable insights and develop the skills necessary for long-term success .
☆
So, fellow trader, take this guide as your roadmap to trading mastery.
Let the nNouSign indicator be your guide, entertaining you with its vibrant colors, motivating you with its signals, and educating you through each trading experience.
Embrace the power it bestows upon you, and let it unleash your full potential in the exciting world of trading.
Success awaits those who dare to seize it!
-HappyTrading- J

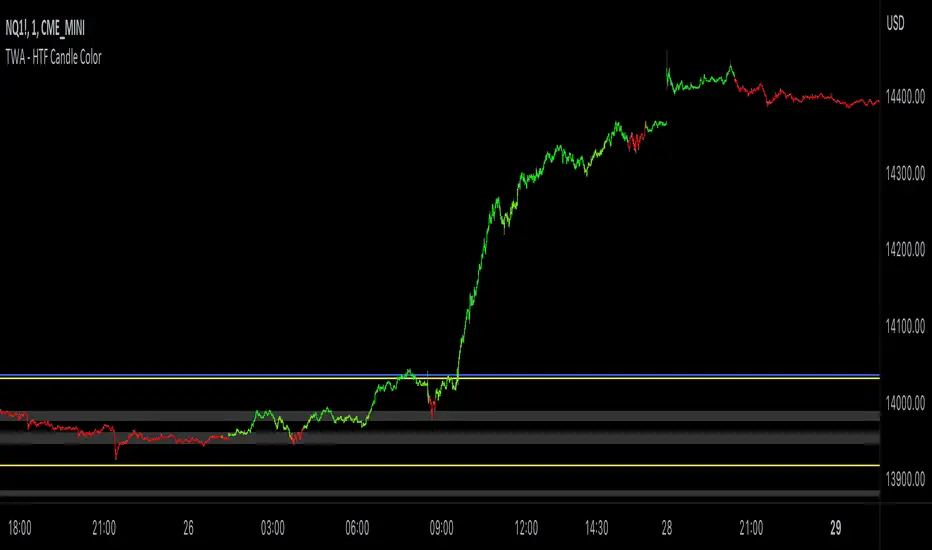
TWA - HTF Candle ColorOverview:
This indicator is designed to assist trend traders by confirming the market's direction on a higher timeframe and providing overlays to determine the strength and longevity of the current trend. Its goal is to help traders develop a probability-based mindset, enabling them to remain in profitable trades for longer periods and to identify when the trend might be shifting.
Main features and how to use:
The main feature of the indicator is the green and red coloring of the candles. The candles can be used to determine market direction and use that bias to pick a trading direction. The contrarian candle overlay is another useful feature that helps trend traders identify potential trend reversals. To use this feature, traders should wait until the overlay candle coloring "clicks off" to determine the probability that the current move has reached its peak or bottom and to look for a larger retracement. The unique flexibility of this feature allows trend traders to see both sides of the story.
Calculations and what makes this original:
- It finds breaks of common fibonacci retracement and extension values on a higher time frame using my proprietary williams % R indicator to find
trend direction
- To help add more confirmation to trend direction the proprietary algorithm combines the above fibonacci breaks with confirmation from price
breaking beyond multiple deviations measured from bollinger bands.
- From your current charts timeframe it automatically calculates which higher timeframe to analyze.
- The above algorithm from the higher timeframe is distilled down to a green or red candle color on the chart to show market direction.
- It uses a blend of rsi and CCI to calculate contrarian candle coloring to show trend exhaustion.
Additional features
Contrarian candle coloring:
The contrarian candle coloring feature is designed to help trend traders see possible reversals. It overlays a different candle color on top of the HTF candles at certain periods. The unique feature of this addition is its ability to transform a trend-following indicator into a tops and bottom reversion indicator all in one. This flexibility allows traders to see both the contrarian and trend-following perspectives.
Enhanced probability:
This feature helps traders determine the probability of their potential trades long-running potential by changing the background color to green or red. Traders can use this information to help define their risk per trade. For example, if the candle coloring matches the background color, they might choose a long-running move, whereas if the candle coloring does not match the background color, they might opt for a scalping trade. The unique feature of this addition is how it gives traders the ability to view the market from different perspectives all on one screen.
Use Alternate Symbol:
Allows for the candle color to be derived from a separate symbol than the current chart .
Candle Color as Line:
Plots a line across the top or bottom of the chart showing the current color which allows users the ability to use an additional indicator that colors candles.
Contrarian Color as Line:
Plots a line across the top or bottom of the chart showing the current candle color which allows users the ability to use an additional indicator that colors candles.
Candle Color as Background:
Colors the chart background the color of the current HTF candle color which allows users the ability to use an additional indicator that colors candles.
Increase Market Sensitivity:
Quickens the response time for candles to change color which can be helpful for scalping on 1 minute charts.
ALERTS
- Get an alert when the candle color changes to green or red
-Get an alert when the enhanced probability color changes to green or red
-Get an alert when the candle color and enhanced probability color align green or red
Multi-Divergence Buy/Sell IndicatorThe "Multi-Divergence Buy/Sell Indicator" is a technical analysis tool that combines multiple divergence signals from different indicators to identify potential buy and sell opportunities in the market. Here's a breakdown of how the indicator works and how to use it:
Input Parameters:
RSI Length: Specifies the length of the RSI (Relative Strength Index) calculation.
MACD Short Length: Specifies the short-term length for the MACD (Moving Average Convergence Divergence) calculation.
MACD Long Length: Specifies the long-term length for the MACD calculation.
MACD Signal Smoothing: Specifies the smoothing length for the MACD signal line calculation.
Stochastic Length: Specifies the length of the Stochastic oscillator calculation.
Stochastic Overbought Level: Defines the overbought level for the Stochastic oscillator.
Stochastic Oversold Level: Defines the oversold level for the Stochastic oscillator.
Calculation of Indicators:
RSI: Calculates the RSI based on the specified RSI Length.
MACD: Calculates the MACD line, signal line, and histogram based on the specified MACD parameters.
Stochastic: Calculates the Stochastic oscillator based on the specified Stochastic parameters.
Divergence Detection:
RSI Divergence: Identifies a bullish divergence when the RSI crosses above its 14-period simple moving average (SMA).
MACD Divergence: Identifies a bullish divergence when the MACD line crosses above the signal line.
Stochastic Divergence: Identifies a bullish divergence when the Stochastic crosses above its 14-period SMA.
Buy and Sell Conditions:
Buy Condition: Triggers a buy signal when all three divergences (RSI, MACD, and Stochastic) occur simultaneously.
Sell Condition: Triggers a sell signal when both RSI and MACD divergences occur, but Stochastic divergence does not occur.
Plotting Buy/Sell Signals:
The indicator plots green "Buy" labels below the price bars when the buy condition is met.
It plots red "Sell" labels above the price bars when the sell condition is met.
Usage:
The indicator can be used on any timeframe and for any trading instrument.
Look for areas where all three divergences (RSI, MACD, and Stochastic) align to generate stronger buy and sell signals.
Consider additional technical analysis and risk management strategies to validate the signals and manage your trades effectively.
Remember, no indicator guarantees profitable trades, so it's essential to use this indicator in conjunction with other tools and perform thorough analysis before making trading decisions.
Feel free to ask any questions

Inside Day ProbabilityThe "Inside Day Probability" indicator is a tool developed for market analysis on the TradingView platform. Its main objective is to calculate the probability of success of a pattern known as "Inside Day" (Día Interior in Spanish).
An Inside Day occurs when the price range (difference between the high and low) of a candle is completely contained within the price range of the previous candle. This pattern indicates a consolidation in the market and is usually followed by a sharp move in a certain direction.
The indicator uses a combination of statistical and mathematical analysis to determine the probability that an Inside Day will result in a successful market move. It is based on historical data and past patterns to calculate the probability of a significant price rise or sharp decline following an Inside Day.
The indicator provides a graphical display of the probability of success, usually in the form of a percentage value or a color scale. This allows traders to easily identify potentially profitable trading opportunities based on the occurrence of Inside Days.
It is important to note that this indicator is a decision support tool and does not guarantee accurate results in all cases. It is recommended to use it in conjunction with other technical analysis tools and consider other relevant factors before making operations in the financial market.
Remember that the proper interpretation and use of this indicator requires an understanding and knowledge of technical analysis and trading principles.

Volume-Weighted RSI with Adaptive SmoothingThis indicator is designed to provide traders with insights into the relative strength of a security by incorporating volume-weighted elements, effectively combining the concepts of Relative Strength Index (RSI) and volume-weighted averages to generate meaningful trading signals.
The indicator calculates the traditional RSI, which measures the speed and change of price movements, as well as the volume-weighted RSI, which considers the influence of trading volume on price action. It then applies adaptive smoothing to the volume-weighted RSI, allowing for customization of the smoothing process. The resulting smoothed volume-weighted RSI is plotted alongside the original RSI, providing traders with a comprehensive view of the price strength dynamics.
The line coloration in this indicator is designed to provide visual cues about the relationship between the RSI and the volume-weighted RSI. When the RSI line is above or equal to the volume-weighted RSI line, it suggests a potentially bullish condition with positive market momentum. In such cases, the line is colored lime. Conversely, when the RSI line (fuchsia) is below the volume-weighted RSI line, it indicates a potentially bearish condition with negative market momentum. The line color is set to fuchsia. By observing the line color, traders can quickly assess the relative strength between the RSI and the volume-weighted RSI, aiding their decision-making process.
The bar color and background color further enhance the visual interpretation of the indicator. The bar color reflects the RSI's relationship with the volume-weighted RSI and the predefined thresholds. If the RSI line is above both the volume-weighted RSI line and the overbought threshold (70), the bar color is set to lime, indicating a potentially overbought condition. Conversely, if the RSI line is below both the volume-weighted RSI line and the oversold threshold (30), the bar color is set to fuchsia, suggesting a potentially oversold condition. When the RSI line is between these two thresholds, the bar color is set to yellow, indicating a neutral or intermediate state. The background color, displayed with a semi-transparent shade, provides additional context by reflecting the prevailing market conditions. It turns lime if the volume-weighted RSI is above the overbought threshold, fuchsia if below the oversold threshold, and yellow if it falls between these two thresholds. This coloration scheme aids traders in quickly assessing market conditions and potential trading opportunities.
Calculations:
-- RSI Calculation : The traditional RSI is calculated based on the price movements of the asset. The up and down movements are determined, and exponential moving averages are used to smooth the values. The RSI value ranges from 0 to 100, with levels above 70 indicating overbought conditions and levels below 30 indicating oversold conditions.
-- Volume-Weighted RSI Calculation : The volume-weighted RSI incorporates the trading volume of the asset into the calculations. The closing price is multiplied by the corresponding volume, and the average is taken over a specific length. The up and down movements are smoothed using exponential moving averages to generate the volume-weighted RSI value.
-- Adaptive Smoothing : The indicator offers an adaptive smoothing option, allowing traders to customize the smoothing process of the volume-weighted RSI. By adjusting the smoothing length, traders can fine-tune the responsiveness of the indicator to changes in market conditions. Smoothing helps reduce noise and enhances the clarity of the signals.
Interpretation:
The indicator provides two main components for interpretation:
-- RSI : The traditional RSI reflects the price momentum and potential overbought or oversold conditions. Traders can look for RSI values above 70 as potential overbought signals, suggesting a possible price reversal or correction. Conversely, RSI values below 30 indicate potential oversold signals, indicating a potential price rebound or rally.
-- Volume-Weighted RSI : The volume-weighted RSI incorporates trading volume, which provides insights into the strength of price movements. When the volume-weighted RSI is above the traditional RSI, it suggests that the buying pressure supported by higher volume is stronger, potentially indicating a more reliable trend. Conversely, when the volume-weighted RSI is below the traditional RSI, it suggests that the selling pressure supported by higher volume is stronger, potentially indicating a more significant price reversal.
Potential Strategies:
-- Overbought and Oversold Signals : Traders can utilize the RSI component of the indicator to identify overbought and oversold conditions. A potential strategy is to consider taking short positions when the RSI is above 70 and long positions when the RSI is below 30. These levels can act as dynamic support and resistance areas, indicating possible price reversals.
-- Confirmation with Volume : Traders can use the volume-weighted RSI as a confirmation tool to validate price movements. When the volume-weighted RSI is above the traditional RSI, it may provide additional confirmation for long positions, suggesting stronger buying pressure. Conversely, when the volume-weighted RSI is below the traditional RSI, it may provide confirmation for short positions, indicating stronger selling pressure.
-- Trend Reversal Strategy : Watch for the volume-weighted RSI to reach extreme levels above 70 (overbought) or below 30 (oversold). Look for a reversal signal where the RSI line (green or fuchsia) crosses below or above the volume-weighted RSI line. Enter a trade when the reversal signal occurs, and the RSI line changes color. Exit the trade when the RSI line crosses back in the opposite direction or reaches the opposite extreme level.
-- Divergence Strategy : Compare the direction of the RSI line (green or fuchsia) with the volume-weighted RSI line. A bullish divergence occurs when the RSI line makes higher lows while the volume-weighted RSI line makes lower lows. A bearish divergence occurs when the RSI line makes lower highs while the volume-weighted RSI line makes higher highs. Once a divergence is identified, wait for the RSI line to cross above or below the volume-weighted RSI line as confirmation of a potential trend reversal. Consider using additional indicators or price action analysis to time the entry more accurately. Use stop-loss orders and profit targets to manage risk and secure profits.
-- Trend Continuation Strategy : Assess the overall trend direction by observing the RSI line's position relative to the volume-weighted RSI line. When the RSI line consistently stays above the volume-weighted RSI line, it indicates a bullish trend, while the opposite suggests a bearish trend. Look for temporary pullbacks within the ongoing trend where the RSI line (green or fuchsia) touches or crosses the volume-weighted RSI line. Enter trades in the direction of the dominant trend when the RSI line crosses back in the trend direction. Exit the trade when the RSI line starts to deviate significantly from the volume-weighted RSI line or when the trend shows signs of weakening through other technical or fundamental factors.
Limitations:
-- False Signals : Like any indicator, the "Volume-Weighted RSI with Adaptive Smoothing" may produce false signals, especially during periods of low liquidity or choppy market conditions. Traders should exercise caution and consider using additional confirmation indicators or tools to validate the signals generated by this indicator.
-- Lagging Nature : The indicator relies on historical price data and volume to calculate the RSI and volume-weighted RSI. As a result, the signals provided may have a certain degree of lag compared to real-time price action. Traders should be aware of this inherent lag and consider combining the indicator with other timely indicators to enhance the accuracy of their trading decisions.
-- Parameter Sensitivity : The indicator's effectiveness can be influenced by the choice of parameters, such as the length of the RSI, smoothing length, and adaptive smoothing option. Different market conditions may require adjustments to these parameters to optimize performance. Traders are encouraged to conduct thorough testing and analysis to determine the most suitable parameter values for their specific trading strategies and preferences.
-- Market Conditions : The indicator's performance may vary depending on the prevailing market conditions. It is essential to understand that no indicator can guarantee accurate predictions or consistently profitable trades. Traders should consider the broader market context, fundamental factors, and other technical indicators to complement the insights provided by the "Volume-Weighted RSI with Adaptive Smoothing" indicator.
-- Subjectivity : Interpretation of the indicator's signals involves subjective judgment. Traders may have varying interpretations of overbought and oversold levels, as well as the significance of the volume-weighted RSI in relation to the traditional RSI. It is crucial to combine the indicator with personal analysis and trading experience to make informed trading decisions.
Remember, no single indicator can provide foolproof trading signals. The "Volume-Weighted RSI with Adaptive Smoothing" indicator serves as a valuable tool for analyzing price strength and volume dynamics. It can assist traders in identifying potential entry and exit points, validating trends, and managing risk. However, it should be used as part of a comprehensive trading strategy that considers multiple factors and indicators to increase the likelihood of successful trades.

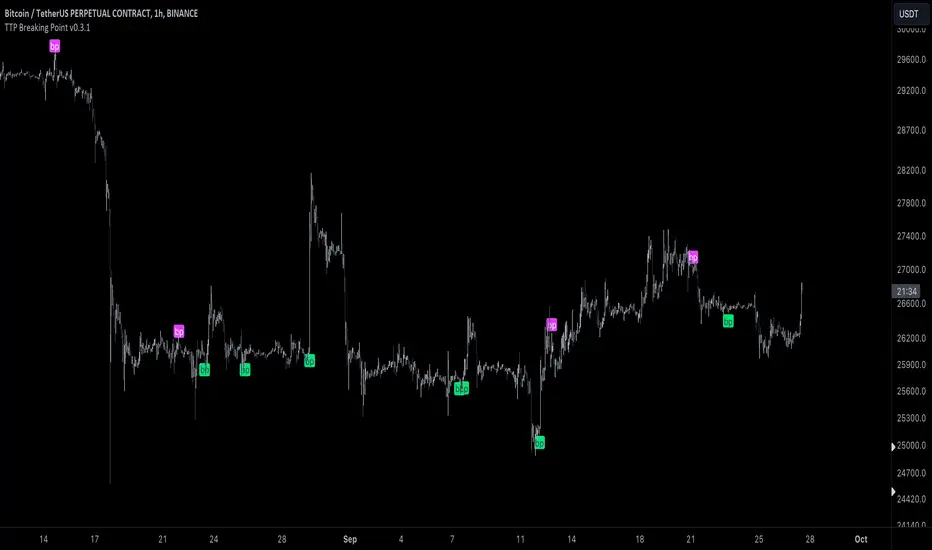
TTP Breaking PointThis signal uses information from BITFINEX:BTCUSDLONGS and BITFINEX:BTCUSDSHORTS to forecast tops and bottoms.
The idea behind is very simple.
We calculate the RSI of the ratio of longs vs shorts and find areas where both the SMA of this RSI and the RSI itself are overextended.
You might notice that the win rate is not high but most of the wins provide a decent move that, if combined with proper risk management, can be used to build profitable strategies.
The signal offers a backtesting stream: 1 for buy and 2 for sell.
Shortly I'll be adding new features including: alerts, support for other symbols, filters, etc.
Step RSI [Loxx]Enhanced Moving Average Calculation with Stepped Moving Average and the Advantages over Regular RSI
Technical analysis plays a crucial role in understanding and predicting market trends. One popular indicator used by traders and analysts is the Relative Strength Index (RSI). However, an enhanced approach called Stepped Moving Average, in combination with the Slow RSI function, offers several advantages over regular RSI calculations.
Stepped Moving Average and Moving Averages:
The Stepped Moving Average function serves as a crucial component in the calculation of moving averages. Moving averages smooth out price data over a specific period to identify trends and potential trading signals. By employing the Stepped Moving Average function, traders can enhance the accuracy of moving averages and make more informed decisions.
Stepped Moving Average takes two parameters: the current RSI value and a size parameter. It computes the next step in the moving average calculation by determining the upper and lower bounds of the moving average range. It accomplishes this by adjusting the values of smax and smin based on the given RSI and size.
Furthermore, Stepped Moving Average introduces the concept of a trend variable. By comparing the previous trend value with the current RSI and the previous upper and lower bounds, it updates the trend accordingly. This feature enables traders to identify potential shifts in market sentiment and make timely adjustments to their trading strategies.
Advantages over Regular RSI:
Enhanced Range Boundaries:
The inclusion of size parameters in Stepped Moving Average allows for more precise determination of the upper and lower bounds of the moving average range. This feature provides traders with a clearer understanding of the potential price levels that can influence market behavior. Consequently, it aids in setting more effective entry and exit points for trades.
Improved Trend Identification:
The trend variable in Stepped Moving Average helps traders identify changes in market trends more accurately. By considering the previous trend value and comparing it to the current RSI and previous bounds, Stepped Moving Average captures trend reversals with greater precision. This capability empowers traders to respond swiftly to market shifts and potentially capture more profitable trading opportunities.
Smoother Moving Averages:
Stepped Moving Average's ability to adjust the moving average range bounds based on trend changes and size parameters results in smoother moving averages. Regular RSI calculations may produce jagged or erratic results due to abrupt market movements. Stepped Moving Average mitigates this issue by dynamically adapting the range boundaries, thereby providing traders with more reliable and consistent moving average signals.
Complementary Functionality with Slow RSI:
Stepped Moving Average and Slow RSI function in harmony to provide a comprehensive trading analysis toolkit. While Stepped Moving Average refines the moving average calculation process, Slow RSI offers a more accurate representation of market strength. The combination of these two functions facilitates a deeper understanding of market dynamics and assists traders in making better-informed decisions.
Extras
-Alerts
-Signals

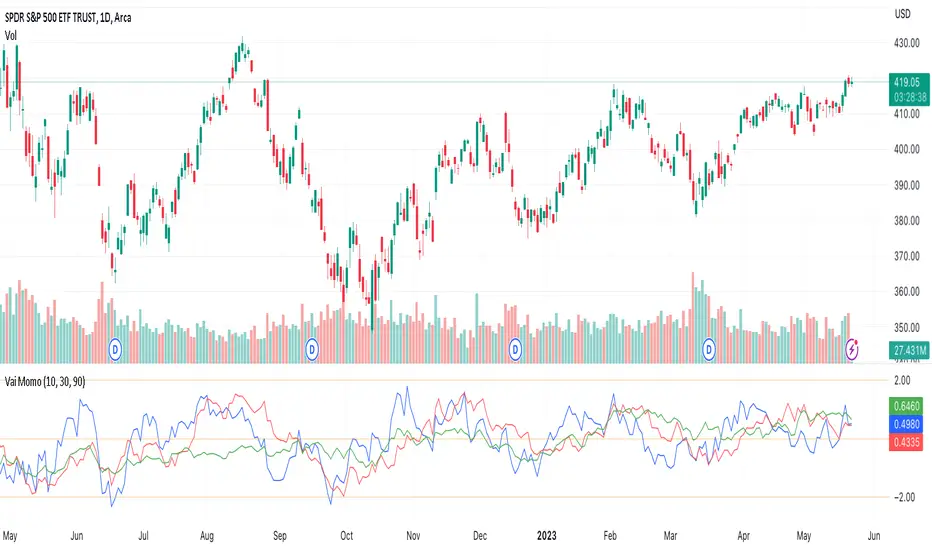
Vaidotas Momentum ScoreHello Traders!
Discover Myfractalrange latest addition on TradingView, Vaidotas Segenis Momentum Score.
How people calculate Momentum is subjective and many people (even professionals) use different Momentum formulas depending on how they view it. This is sometimes confusing for traders.
The purpose of this indicator is to identify periods of strong price momentum relative to historical volatility. Higher momentum scores indicate stronger price trends, while lower scores suggest weaker trends. Traders and investors may use this indicator to identify potential buy or sell signals based on the strength of price movements. The formula Vaidotas uses calculate Momentum Score for different periods based on the price data.
There are 3 different look back periods in the script, you will find them in "Input":
Period 1 : 10 Days
Period 2 : 30 Days
Period 3 : 90 Days
Now let's go over the different steps of the formula:
Step 1 - Calculate the daily normal returns : this gives the daily percentage change in price
Step 2 - Calculate the standard deviation of the daily normal returns over a specific look back period (Default: 100 days) : the standard deviation measures the volatility or dispersion of the returns
Step 4 - Calculate the squared standard deviation multiplied by the square root of the respective period: This is done for three different periods (Period 1, Period 2, Period 3), it amplifies the standard deviation by the square root of the period, which gives more weight to recent price changes.
Step 5 - Calculate the normal returns for each period: This calculates the percentage change in price over the specified period
Step 5 - Calculate the momentum score for each period: This score represents the relative strength or momentum of the price change compared to the expected volatility.
Using the momentum indicator involves interpreting the values and considering certain thresholds to make trading decisions. While there is no definitive rule for all markets and assets, we can provide you with a general guideline on how traders may want to use the indicator and explain the significance of certain values:
1) Strong Trend: When the momentum score is significantly positive (above a certain threshold, such as +2), it suggests a strong upward price trend.
2) Weak Trend: Conversely, when the momentum score is significantly negative (below a certain threshold, such as -2), it indicates a strong downward price trend. Traders may interpret this as a potential signal to enter or maintain a short position, expecting the trend to continue.
3) Lack of Trend: When the momentum score is close to zero, it suggests a lack of significant trend or sideways movement in the price. Values around 0 indicate a potential range-bound market or consolidation.
However, it's important to note that the specific threshold values for defining significant trends or reversals may vary depending on the asset, timeframe, and market conditions. Traders often adjust these thresholds based on their own experience and backtesting results.
Here are a few more examples to illustrate the use of the momentum indicator:
- Example 1 - Strong Uptrend Confirmation :
The momentum score is consistently above +2, indicating a strong upward trend. Traders may consider this as a potential signal to enter or maintain a long position, expecting the trend to continue.
- Example 2 - Reversal Signal :
The momentum score has been positive for an extended period but starts to decline and eventually crosses below -2. This could be seen as a potential reversal signal, suggesting that the uptrend is losing strength and a bearish trend might develop. Traders may consider exiting long positions or even taking short positions based on this reversal signal.
- Example 3 - Sideways Market :
The momentum score fluctuates around 0, without displaying any significant positive or negative values. This indicates a lack of clear trend and suggests that the asset is trading in a range or consolidating. Traders may choose to avoid taking new positions until a stronger trend emerges.
Why is it interesting to use different look back periods?
The use of different look back periods in the momentum indicator formula allows traders to assess momentum across multiple timeframes. By comparing the momentum results for each period, traders can gain a broader perspective on the strength of the trend and potential opportunities. Here's how a trader might use the different look back periods and their corresponding momentum results:
1) Identifying Consistency: Traders can compare the momentum results for different periods to assess the consistency of the trend. If the momentum scores for all periods are consistently positive or negative, it suggests a strong and consistent trend across multiple timeframes. This can provide traders with higher confidence in the trend's strength and potential trading opportunities.
2) Convergence or Divergence: Traders can analyze the relationship between the momentum results for different periods. If the momentum scores for all periods are converging (moving closer together), it indicates a higher degree of agreement across different timeframes and strengthens the signal. Conversely, if the momentum scores for different periods diverge (move apart), it may suggest a weakening or conflicting trend. Traders should exercise caution when the momentum scores diverge as it may signal a potential reversal or market uncertainty.
3) Confirmation of Momentum: Traders can use the momentum results for different periods to confirm the strength of a trend. For example, if the momentum scores for shorter periods (e.g., Period 1) are significantly higher than those for longer periods (e.g., Period 2 and Period 3), it suggests a recent increase in momentum and a potentially stronger trend. This confirmation can assist traders in making more informed trading decisions and timing their entries or exits.
4) Multiple Timeframe Analysis: Traders often employ a multiple timeframe analysis approach to validate their trading decisions. By comparing the momentum results for different periods, traders can assess the alignment of momentum across various timeframes. For instance, if the momentum scores for shorter, medium, and longer periods all indicate a strong trend in the same direction, it reinforces the conviction in the trade.
As a conclusion, the momentum indicator can be useful to traders for several reasons:
1) Identifying Trend Strength: The momentum indicator helps traders assess the strength of a price trend. When the momentum score is high, it suggests that the trend is strong and likely to continue. This information can be valuable for trend-following strategies, as it helps traders identify potentially profitable opportunities and stay on the right side of the market.
2) Spotting Reversals: Momentum indicators can also help traders identify potential trend reversals. When the momentum score diverges from the price movement, it may indicate a weakening trend or an upcoming reversal. Traders can use this signal to adjust their positions or look for opportunities to enter or exit trades.
3) Confirming Breakouts: Breakout traders often use momentum indicators to confirm the validity of a breakout. If a price breaks above a resistance level, and the momentum score also increases significantly, it provides additional confirmation that the breakout is strong and may continue. This helps traders have more confidence in their breakout trades.
4) Setting Stop Loss and Take Profit Levels: By understanding the strength of a price trend through the momentum indicator, traders can set appropriate stop-loss and take-profit levels. A strong momentum score may indicate that a trend is likely to continue, allowing traders to set wider profit targets. Conversely, a weak momentum score may suggest that the trend is losing steam, prompting traders to set tighter stop-loss levels to protect their capital.
4) Divergence Analysis: Momentum indicators can be used in conjunction with other technical indicators to identify divergences. Divergence occurs when the price and momentum indicator move in opposite directions. It can signal potential trend reversals or shifts in market sentiment, providing traders with opportunities to adjust their positions.
It's important to note that while momentum indicators can be useful tools, they should not be relied upon solely for making trading decisions. It's recommended to use them in conjunction with other technical analysis tools and consider other factors such as market conditions, risk management, and fundamental analysis. Remember that the momentum indicator is just one tool among many, and it's important to consider other factors such as volume, trend, volatility, and overall market conditions when making trading decisions. Additionally, using stop-loss orders and proper risk management techniques is crucial to mitigate potential losses.
We hope that you will find these explanations useful, please contact us by private message for access.
Enjoy!
DISCLAIMER: No sharing, copying, reselling, modifying, or any other forms of use are authorised. This script is strictly for individual use and educational purposes only. This is not financial or investment advice. Investments are always made at your own risk and are based on your personal judgement. Myfractalrange is not responsible for any losses you may incur. Please invest wisely.
ICT Donchian Smart Money Structure (Expo)█ Concept Overview
The Inner Circle Trader (ICT) methodology is focused on understanding the actions and implications of the so-called "smart money" - large institutions and professional traders who often influence market movements. Key to this is the concept of market structure and how it can provide insights into potential price moves.
Over time, however, there has been a notable shift in how some traders interpret and apply this methodology. Initially, it was designed with a focus on the fractal nature of markets. Fractals are recurring patterns in price action that are self-similar across different time scales, providing a nuanced and dynamic understanding of market structure.
However, as the ICT methodology has grown in popularity, there has been a drift away from this fractal-based perspective. Instead, many traders have started to focus more on pivot points as their primary tool for understanding market structure.
Pivot points provide static levels of potential support and resistance. While they can be useful in some contexts, relying heavily on them could provide a skewed perspective of market structure. They offer a static, backward-looking view that may not accurately reflect real-time changes in market sentiment or the dynamic nature of markets.
This shift from a fractal-based perspective to a pivot point perspective has significant implications. It can lead traders to misinterpret market structure and potentially make incorrect trading decisions.
To highlight this issue, you've developed a Donchian Structure indicator that mirrors the use of pivot points. The Donchian Channels are formed by the highest high and the lowest low over a certain period, providing another representation of potential market extremes. The fact that the Donchian Structure indicator produces the same results as pivot points underscores the inherent limitations of relying too heavily on these tools.
While the Donchian Structure indicator or pivot points can be useful tools, they should not replace the original, fractal-based perspective of the ICT methodology. These tools can provide a broad overview of market structure but may not capture the intricate dynamics and real-time changes that a fractal-based approach can offer.
It's essential for traders to understand these differences and to apply these tools correctly within the broader context of the ICT methodology and the Smart Money Concept Structure. A well-rounded approach that incorporates fractals, along with other tools and forms of analysis, is likely to provide a more accurate and comprehensive understanding of market structure.
█ Smart Money Concept - Misunderstandings
The Smart Money Concept is a popular concept among traders, and it's based on the idea that the "smart money" - typically large institutional investors, market makers, and professional traders - have superior knowledge or information, and their actions can provide valuable insight for other traders.
One of the biggest misunderstandings with this concept is the belief that tracking smart money activity can guarantee profitable trading.
█ Here are a few common misconceptions:
Following Smart Money Equals Guaranteed Success: Many traders believe that if they can follow the smart money, they will be successful. However, tracking the activity of large institutional investors and other professionals isn't easy, as they use complex strategies, have access to information not available to the public, and often intentionally hide their moves to prevent others from detecting their strategies.
Instantaneous Reaction and Results: Another misconception is that market movements will reflect smart money actions immediately. However, large institutions often slowly accumulate or distribute positions over time to avoid moving the market drastically. As a result, their actions might not produce an immediate noticeable effect on the market.
Smart Money Always Wins: It's not accurate to assume that smart money always makes the right decisions. Even the most experienced institutional investors and professional traders make mistakes, misjudge market conditions, or are affected by unpredictable events.
Smart Money Activity is Transparent: Understanding what constitutes smart money activity can be quite challenging. There are many indicators and metrics that traders use to try and track smart money, such as the COT (Commitments of Traders) reports, Level II market data, block trades, etc. However, these can be difficult to interpret correctly and are often misleading.
Assuming Uniformity Among Smart Money: 'Smart Money' is not a monolithic entity. Different institutional investors and professional traders have different strategies, risk tolerances, and investment horizons. What might be a good trade for a long-term institutional investor might not be a good trade for a short-term professional trader, and vice versa.
█ Market Structure
The Smart Money Concept Structure deals with the interpretation of price action that forms the market structure, focusing on understanding key shifts or changes in the market that may indicate where 'smart money' (large institutional investors and professional traders) might be moving in the market.
█ Three common concepts in this regard are Change of Character (CHoCH), and Shift in Market Structure (SMS), Break of Structure (BMS/BoS).
Change of Character (CHoCH): This refers to a noticeable change in the behavior of price movement, which could suggest that a shift in the market might be about to occur. This might be signaled by a sudden increase in volatility, a break of a trendline, or a change in volume, among other things.
Shift in Market Structure (SMS): This is when the overall structure of the market changes, suggesting a potential new trend. It usually involves a sequence of lower highs and lower lows for a downtrend, or higher highs and higher lows for an uptrend.
Break of Structure (BMS/BoS): This is when a previously defined trend or pattern in the price structure is broken, which may suggest a trend continuation.
A key component of this approach is the use of fractals, which are repeating patterns in price action that can give insights into potential market reversals. They appear at all scales of a price chart, reflecting the self-similar nature of markets.
█ Market Structure - Misunderstandings
One of the biggest misunderstandings about the ICT approach is the over-reliance or incorrect application of pivot points. Pivot points are a popular tool among traders due to their simplicity and easy-to-understand nature. However, when it comes to the Smart Money Concept and trying to follow the steps of professional traders or large institutions, relying heavily on pivot points can create misconceptions and lead to confusion. Here's why:
Delayed and Static Information: Pivot points are inherently backward-looking because they're calculated based on the previous period's data. As such, they may not reflect real-time market dynamics or sudden changes in market sentiment. Furthermore, they present a static view of market structure, delineating pre-defined levels of support and resistance. This static nature can be misleading because markets are fundamentally dynamic and constantly changing due to countless variables.
Inadequate Representation of Market Complexity: Markets are influenced by a myriad of factors, including economic indicators, geopolitical events, institutional actions, and market sentiment, among others. Relying on pivot points alone for reading market structure oversimplifies this complexity and can lead to a myopic understanding of market dynamics.
False Signals and Misinterpretations: Pivot points can often give false signals, especially in volatile markets. Prices might react to these levels temporarily but then continue in the original direction, leading to potential misinterpretation of market structure and sentiment. Also, a trader might wrongly perceive a break of a pivot point as a significant market event, when in fact, it could be due to random price fluctuations or temporary volatility.
Over-simplification: Viewing market structure only through the lens of pivot points simplifies the market to static levels of support and resistance, which can lead to misinterpretation of market dynamics. For instance, a trader might view a break of a pivot point as a definite sign of a trend, when it could just be a temporary price spike.
Ignoring the Fractal Nature of Markets: In the context of the Smart Money Concept Structure, understanding the fractal nature of markets is crucial. Fractals are self-similar patterns that repeat at all scales and provide a more dynamic and nuanced understanding of market structure. They can help traders identify shifts in market sentiment or direction in real-time, providing more relevant and timely information compared to pivot points.
The key takeaway here is not that pivot points should be entirely avoided or that they're useless. They can provide valuable insights and serve as a useful tool in a trader's toolbox when used correctly. However, they should not be the sole or primary method for understanding the market structure, especially in the context of the Smart Money Concept Structure.
█ Fractals
Instead, traders should aim for a comprehensive understanding of markets that incorporates a range of tools and concepts, including but not limited to fractals, order flow, volume analysis, fundamental analysis, and, yes, even pivot points. Fractals offer a more dynamic and nuanced view of the market. They reflect the recursive nature of markets and can provide valuable insights into potential market reversals. Because they appear at all scales of a price chart, they can provide a more holistic and real-time understanding of market structure.
In contrast, the Smart Money Concept Structure, focusing on fractals and comprehensive market analysis, aims to capture a more holistic and real-time view of the market. Fractals, being self-similar patterns that repeat at different scales, offer a dynamic understanding of market structure. As a result, they can help to identify shifts in market sentiment or direction as they happen, providing a more detailed and timely perspective.
Furthermore, a comprehensive market analysis would consider a broader set of factors, including order flow, volume analysis, and fundamental analysis, which could provide additional insights into 'smart money' actions.
█ Donchian Structure
Donchian Channels are a type of indicator used in technical analysis to identify potential price breakouts and trends, and they may also serve as a tool for understanding market structure. The channels are formed by taking the highest high and the lowest low over a certain number of periods, creating an envelope of price action.
Donchian Channels (or pivot points) can be useful tools for providing a general view of market structure, and they may not capture the intricate dynamics associated with the Smart Money Concept Structure. A more nuanced approach, centered on real-time fractals and a comprehensive analysis of various market factors, offers a more accurate understanding of 'smart money' actions and market structure.
█ Here is why Donchian Structure may be misleading:
Lack of Nuance: Donchian Channels, like pivot points, provide a simplified view of market structure. They don't take into account the nuanced behaviors of price action or the complex dynamics between buyers and sellers that can be critical in the Smart Money Concept Structure.
Limited Insights into 'Smart Money' Actions: While Donchian Channels can highlight potential breakout points and trends, they don't necessarily provide insights into the actions of 'smart money'. These large institutional traders often use sophisticated strategies that can't be easily inferred from price action alone.
█ Indicator Overview
We have built this Donchian Structure indicator to show that it returns the same results as using pivot points. The Donchian Structure indicator can be a useful tool for market analysis. However, it should not be seen as a direct replacement or equivalent to the original Smart Money concept, nor should any indicator based on pivot points. The indicator highlights the importance of understanding what kind of trading tools we use and how they can affect our decisions.
The Donchian Structure Indicator displays CHoCH, SMS, BoS/BMS, as well as premium and discount areas. This indicator plots everything in real-time and allows for easy backtesting on any market and timeframe. A unique candle coloring has been added to make it more engaging and visually appealing when identifying new trading setups and strategies. This candle coloring is "leading," meaning it can signal a structural change before it actually happens, giving traders ample time to plan their next trade accordingly.
█ How to use
The indicator is great for traders who want to simplify their view on the market structure and easily backtest Smart Money Concept Strategies. The added candle coloring function serves as a heads-up for structure change or can be used as trend confirmation. This new candle coloring feature can generate many new Smart Money Concepts strategies.
█ Features
Market Structure
The market structure is based on the Donchian channel, to which we have added what we call 'Structure Response'. This addition makes the indicator more useful, especially in trending markets. The core concept involves traders buying at a discount and selling or shorting at a premium, depending on the order flow. Structure response enables traders to determine the order flow more clearly. Consequently, more trading opportunities will appear in trending markets.
Structure Candles
Structure Candles highlight the current order flow and are significantly more responsive to structural changes. They can provide traders with a heads-up before a break in structure occurs
-----------------
Disclaimer
The information contained in my Scripts/Indicators/Ideas/Algos/Systems does not constitute financial advice or a solicitation to buy or sell any securities of any type. I will not accept liability for any loss or damage, including without limitation any loss of profit, which may arise directly or indirectly from the use of or reliance on such information.
All investments involve risk, and the past performance of a security, industry, sector, market, financial product, trading strategy, backtest, or individual's trading does not guarantee future results or returns. Investors are fully responsible for any investment decisions they make. Such decisions should be based solely on an evaluation of their financial circumstances, investment objectives, risk tolerance, and liquidity needs.
My Scripts/Indicators/Ideas/Algos/Systems are only for educational purposes!

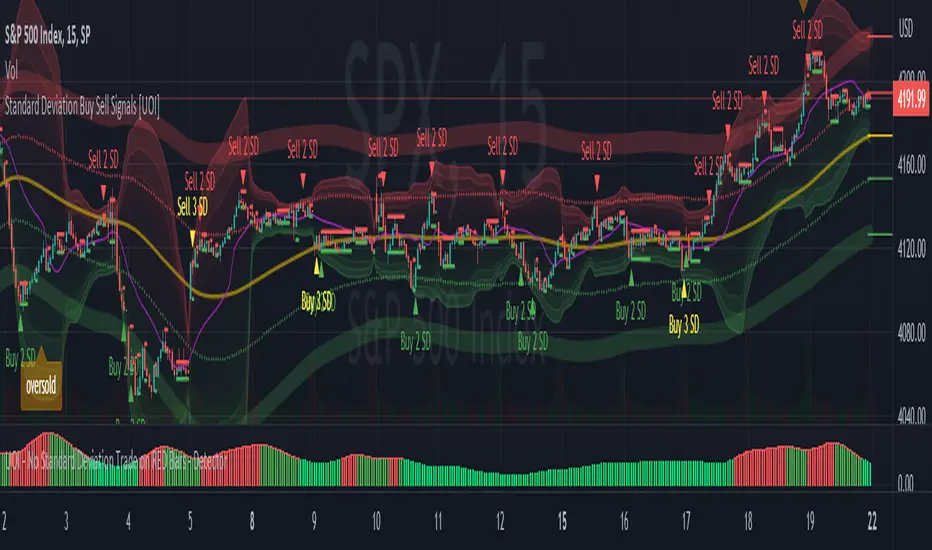
Standard Deviation Buy Sell Signals [UOI]The "Standard Deviation Buy Sell Signals" which is a Mean and VWAP Deviation Super Pack that includes many additional features is an advanced technical analysis tool designed to assist traders in making well-informed decisions in the financial markets. It incorporates various functions and calculations to provide a comprehensive analysis of price movements, trends, and potential trading opportunities in different timeframes. The Super Pack combines elements of volume-weighted average price (VWAP), mean calculation on multiple time frames, standard deviation signals and bands, overbought and oversold signals, measures of central tendency, and multiple time frame calculations of mean reversion. A truly unique indicator.
Here is the details of the supper pack and what is included:
1. VWAP (Volume-Weighted Average Price): The Mean and VWAP Deviation Super Pack includes VWAP, which calculates the average price of a security weighted by its trading volume. This helps traders identify the average price at which a significant amount of trading activity has occurred and can serve as a reference point for determining whether the current price is overvalued or undervalued.
2. Standard Deviation Signals and Bands: The Super Pack incorporates standard deviation signals and bands to measure the volatility of price movements. By calculating the standard deviation of price data, it identifies price levels that deviate significantly from the average, indicating potential overbought or oversold conditions. The standard deviation bands provide visual boundaries that help traders assess the likelihood of a price reversal or continuation. The bands are hidden to avoid too many lines but you can enable them in the setting. See image below:
3. Overbought and Oversold Signals: Using the standard deviation calculations, the Mean and VWAP Deviation Super Pack generates overbought and oversold signals. These signals indicate when a security's price has moved to an extreme level, suggesting a potential reversal or correction in the near future. Traders can use these signals to time their entries or exits in the market. You can change the RSI number in the setting to get more or less signals.
4. Measures of Central Tendency: The Super Pack incorporates measures of central tendency, such as the mean, median, or mode, to provide a sense of the average or typical price behavior. These measures help traders identify the prevailing trend or price direction and assess the likelihood of a trend continuation or reversal. This provide reassurance of whether price is too far from center in multiple time frames.
5. Multiple Time Frame Calculation of Mean Reversion: The Mean and VWAP Deviation Super Pack employs multiple time frame calculations to identify mean reversion opportunities. It compares the current price with the historical average price over different time periods, allowing traders to identify situations where the price has deviated significantly from its mean and is likely to revert back to its average value. This can be useful for swing trading or short-term trading strategies.
By combining these various functions, the Mean and VWAP Deviation Super Pack provides traders with a comprehensive analysis of price dynamics, trend strength, potential reversals, and mean reversion opportunities. It aids in making more informed trading decisions and improving overall trading performance.
Why is this super pack indicator an essential trading strategy for every trader:
Standard deviation and mean reversion are valuable tools for traders, especially when the market is in a ranging phase. A ranging market is characterized by price movements that oscillate between defined support and resistance levels, with no clear trend in either direction. In such market conditions, standard deviation and mean reversion strategies can be particularly effective. Here's why:
1. Standard Deviation: Standard deviation is a statistical measure that quantifies the volatility or dispersion of price data around its average. In a ranging market, where prices tend to fluctuate within a certain range, standard deviation can help identify overbought and oversold levels. When the price reaches the upper end of the range, the standard deviation bands widen, indicating higher volatility and a potential selling opportunity. Conversely, when the price reaches the lower end of the range, the bands narrow, suggesting lower volatility and a potential buying opportunity. Traders can use these signals to anticipate price reversals and take advantage of the predictable nature of ranging markets.
2. Mean Reversion: Mean reversion is a concept that suggests prices tend to move back toward their average or mean over time. In a ranging market, where prices repeatedly move between support and resistance levels, mean reversion strategies can be highly effective. By identifying when the price has deviated significantly from its mean, traders can anticipate a potential reversal back toward the average. When the price reaches extreme levels, indicating overbought or oversold conditions, traders can enter positions in the opposite direction, expecting the price to revert to its mean. Mean reversion strategies can be implemented using various indicators, including Bollinger Bands, moving averages, or standard deviation bands.
3. Range Boundaries: In a ranging market, the upper and lower boundaries of the price range serve as reliable reference points for traders. Standard deviation and mean reversion strategies capitalize on the repetitive nature of price movements within these boundaries. Traders can set their entry and exit points based on the standard deviation bands or mean reversion signals to take advantage of price reversals near the range boundaries. By properly identifying and reacting to these levels, traders can profit from the price oscillations within the range.
4. Risk Management: Standard deviation and mean reversion strategies provide traders with clear entry and exit points, allowing for effective risk management. By placing stop-loss orders beyond the range boundaries or the standard deviation bands, traders can limit their potential losses if the price continues to move against their positions. Additionally, by taking profits near the opposite range boundary or when the price reverts back to the mean, traders can secure their gains and maintain a disciplined approach to trading.
Standard deviation and mean reversion strategies offer traders a systematic approach to capitalize on ranging markets. But the cherry on top is the overbought and oversold signals:
The concept of overbought and oversold levels is widely used in technical analysis to identify potential reversals in price trends. Typically, indicators like the Relative Strength Index (RSI) are employed to determine when an asset may be overbought or oversold. However, you have developed a unique approach by incorporating an interactive variable with RSI and Average True Range (ATR) to create a distinct overbought and oversold signal. Here's why this approach stands out:
1. Divergence: Your approach introduces a divergence concept by combining RSI and ATR. Traditionally, overbought and oversold signals rely solely on RSI readings. However, by considering the interaction between RSI and ATR, you bring a new dimension to these signals. The divergence occurs when the RSI indicates overbought conditions while simultaneously ATR crosses over into bearish territory, or when the RSI signals oversold conditions along with ATR crossing over into bullish territory. This divergence adds an extra layer of confirmation to the overbought and oversold signals.
2. Reduced False Signals: The incorporation of ATR in conjunction with RSI helps filter out false signals that may occur during trending market conditions or short squeezes. Trend days or periods of increased volatility can cause RSI to remain in overbought or oversold territory for an extended period, generating numerous signals that may not be reliable. By considering the crossing of ATR into bearish or bullish territory, your approach adds a dynamic element to the signal generation process. This interactive variable helps ensure that the overbought and oversold signals are not solely based on RSI getting hot, reducing the likelihood of false signals during trending or volatile periods.
3. Improved Timing: The interaction between RSI and ATR provides a more nuanced approach to timing overbought and oversold signals. By waiting for the ATR to confirm the RSI signal, you introduce an additional condition that enhances the precision of the timing. The bearish or bullish crossover of ATR serves as a confirmation that market conditions align with the overbought or oversold signal indicated by RSI. This combined approach allows for more accurate entry or exit points, increasing the potential profitability of trades.
4. Customization and Adaptability: By creating this interactive variable with RSI and ATR, you have developed a customizable approach that can be adapted to different trading styles and preferences. Traders can adjust the sensitivity of the signals by modifying the parameters of the RSI and ATR. This flexibility allows for a personalized trading experience and enables traders to align the signals with their specific risk tolerance and market conditions.
This approach to overbought and oversold signals utilizing RSI and ATR introduces a unique perspective to technical analysis. By incorporating divergence and interactive variables, you enhance the reliability of these signals while reducing false readings. This approach provides improved timing and adaptability, making it a valuable tool for traders seeking to identify potential reversals in price trends with greater accuracy and confidence.
HOW to avoid fake signals?
When it comes to trading with standard deviation as a strategy, it's important to note that on extreme trend days, this indicator may generate false signals. This occurs because standard deviation is primarily designed to measure volatility and deviations from the mean in a range-bound market. During strong trending periods, the price tends to move in one direction with minimal deviations, rendering the standard deviation less effective.
To avoid trading based solely on standard deviation during extreme trend days, it is advisable to incorporate additional indicators that can provide insights into the stock's trend or squeeze conditions. These indicators can help determine whether the market is experiencing a strong trend or a squeeze, allowing you to avoid false signals generated by standard deviation.
By utilizing complementary indicators such as trend-following indicators (e.g., moving averages, trendlines) or volatility indicators (e.g., Bollinger Bands), you can gain a more comprehensive understanding of the market environment. These indicators can help confirm whether the stock is in a trending phase or experiencing a squeeze, helping you avoid entering trades solely based on standard deviation during these extreme trend days.
In summary, while standard deviation is a valuable tool in range-bound markets, it may produce unreliable signals on extreme trend days. By incorporating other indicators that provide insights into the stock's trend or squeeze conditions, traders can better assess the market environment and avoid false signals generated by standard deviation during these periods. This approach enhances the overall effectiveness and accuracy of trading strategies, leading to more informed and profitable decision-making.
Broadview Delta (ROC)The Broadview Delta (ROC) is a trading indicator designed to provide insights into significant price changes in financial markets. ROC stands for Rate of Change, and it measures the percentage difference between the current price and a price from a specific number of periods ago. The Broadview Delta takes the concept of ROC a step further by incorporating bands of significance based on the highest and lowest price values within a defined time window. This allows traders to identify significant changes in price that are directly correlated with recent highs and lows.
The ROC indicator is widely used by traders and investors to assess the momentum and strength of price movements. It is particularly helpful in identifying potential trend reversals, overbought or oversold conditions, and divergences between price and momentum. By comparing the current price to a historical price point, ROC provides a normalized measurement of price change, enabling traders to gauge the speed and magnitude of market movements.
The Broadview Delta builds upon the traditional ROC by setting bands of significance based on recent highs and lows. These bands provide a contextual reference point for evaluating the significance of price changes. When the current price exceeds a significant upper band, it suggests a potential overbought condition, indicating that the price may be due for a correction. Conversely, if the current price falls below a significant lower band, it signals a potential oversold condition, implying that the price may be primed for a rebound. The bands of significance allow traders to identify crucial price levels where significant market reactions are likely to occur.
By mapping significant changes in price in relation to recent highs and lows, the Broadview Delta offers traders a clearer picture of market dynamics. It helps traders identify critical inflection points where price action is likely to encounter resistance or support. This information empowers traders to make informed decisions about entering or exiting trades, setting profit targets, and placing stop-loss orders.
The Broadview Delta indicator can be applied to various financial instruments, such as stocks, commodities, currencies, and indices. It can be used on different timeframes, ranging from intraday charts to longer-term charts, depending on the trader's preferred trading style and objectives.
The Broadview Delta (ROC) is a powerful trading indicator that combines the principles of the Rate of Change with bands of significance based on recent highs and lows. By providing a direct correlation between significant price changes and recent price extremes, it enhances the ability of traders to identify crucial market turning points. Incorporating the Broadview Delta into trading strategies can improve decision-making, increase the accuracy of trade entries and exits, and ultimately contribute to more profitable trading outcomes.

RSI, SRSI, MACD and DMI cross - Open source codeHello,
I'm a passionate trader who has spent years studying technical analysis and exploring different trading strategies. Through my research, I've come to realize that certain indicators are essential tools for conducting accurate market analysis and identifying profitable trading opportunities. In particular, I've found that the RSI, SRSI, MACD cross, and Di cross indicators are crucial for my trading success.
Detailed explanation:
The RSI is a momentum indicator that measures the strength of price movements. It is calculated by comparing the average of gains and losses over a certain period of time. In this indicator, the RSI is calculated based on the close price with a length of 14 periods.
The Stochastic RSI is a combination of the Stochastic Oscillator and the RSI. It is used to identify overbought and oversold conditions of the market. In this indicator, the Stochastic RSI is calculated based on the RSI with a length of 14 periods.
The MACD is a trend-following momentum indicator that shows the relationship between two moving averages of prices. It consists of two lines, the MACD line and the signal line, which are used to generate buy and sell signals. In this indicator, the MACD is calculated based on the close price with fast and slow lengths of 12 and 26 periods, respectively, and a signal length of 9 periods.
The DMI is a trend-following indicator that measures the strength of directional movement in the market. It consists of three lines, the Positive Directional Indicator (+DI), the Negative Directional Indicator (-DI), and the Average Directional Index (ADX), which are used to generate buy and sell signals. In this indicator, the DMI is calculated with a length of 14 periods and an ADX smoothing of 14 periods.
The indicator generates buy signals when certain conditions are met for each of these indicators.
1) For the RSI, a buy signal is generated when the RSI is below or equal to 35 and the Stochastic RSI %K is below or equal to 15, or when the RSI is below or equal to 28 the Stochastic RSI %K is below or equal to 15 or when the RSI is below or equal to 25 and the Stochastic RSI %K is below or equal to 10 or when the RSI is below or equal to 28.
2) For the MACD, a buy signal is generated when the MACD line is below 0, there is a change in the histogram from negative to positive, the MACD line and histogram are negative in the previous period, and the current histogram value is greater than 0.
3) For the DMI, a buy signal is generated when the Positive Directional Indicator (+DI) crosses above the Negative Directional Indicator (-DI), and the -DI is less than the +DI.
The indicator generates sell signals when certain conditions are met for each of these indicators:
1) For the RSI, a sell signal is generated when the RSI is above or equal to 75 and the Stochastic RSI %K is above or equal to 85, or when the RSI is above or equal to 80 and the Stochastic RSI %K is above or equal to 85, or when the RSI is above or equal to 85 and the Stochastic RSI %K is above or equal to 90 or when the RSI is above or equal to 82.
2)For the MACD, a sell signal is generated when the MACD line is above 0, there is a change in the histogram from positive to negative, the MACD line and histogram are positive in the previous period, and the current histogram value is less than the previous histogram value. On the other hand, a buy signal is generated when the MACD line is below 0, there is a change in the histogram from negative to positive, the MACD line and histogram are negative in the previous period, and the current histogram value is greater than the previous histogram value.
3)For the DMI a bearish signal is generated when plusDI crosses above minusDI, indicating that bulls are losing strength and bears are taking control.
The indicator uses a combination of these four indicators to generate potential buy and sell signals. The buy signals are generated when RSI and SRSI values are in oversold conditions, while sell signals are generated when RSI and SRSI values are in overbought conditions. The indicator also uses MACD crossovers and DMI crossovers to generate additional buy and sell signals.
When a signal is strong?
The use of multiple signals within a specific timeframe can increase the accuracy and reliability of the signals generated by this indicator. It is recommended to look for at least two signals within a range of 5-8 candles in order to increase the probability of a successful trade.
Why it's original?
1) There is no indicator in the library that combine all of these indicators and give you a 360 view
2)The combination of the RSI, Stochastic RSI, MACD, and DMI indicators in a single script it's unique and not available in the libray.
3)The specific parameters and conditions used to calculate the signals may be unique and not found in other scripts or libraries.
4)The use of plotshape() to plot the signals as shapes on the chart may be unique compared to other scripts that simply plot lines or bars to indicate signals.
5)The use of alertcondition() to trigger alerts based on the signals may be unique compared to other scripts that do not have custom alert functionality.
Keep attention!
It is important to note that no trading indicator or strategy is foolproof, and there is always a risk of losses in trading. While this indicator may provide useful information for making conclusions, it should not be used as the sole basis for making trading decisions. Traders should always use proper risk management techniques and consider multiple factors when making trading decisions.
Support me:)
If you find this new indicator helpful in your trading analysis, I would greatly appreciate your support! Please consider giving it a like, leaving feedback, or sharing it with your trading network. Your engagement will not only help me improve this tool but will also help other traders discover it and benefit from its features. Thank you for your support!

Support & Resistance GridTitle: Comprehensive Breakdown of an Advanced Support/Resistance and Liquidity Indicator for Enhanced Trading Performance
Introduction:
In the ever-evolving world of trading, market participants are constantly seeking innovative tools and indicators to enhance their decision-making process and improve their overall trading performance. One such remarkable tool that has gained significant traction amongst traders is an advanced support and resistance (S/R) and liquidity indicator. This powerful indicator offers a plethora of customizable options and unique features, enabling traders to efficiently mark up their charts and identify crucial market levels without the need to spend countless hours on manual analysis.
In this comprehensive breakdown, we will delve into the key features and functionalities of this advanced indicator and demonstrate how traders can leverage it to optimize their trading strategies and achieve better results in the market. While we will not be revealing the source code, we will provide an in-depth explanation of how the indicator performs and the various ways in which it can be used by traders.
Section 1: Support and Resistance Zones - The Backbone of Your Technical Analysis
1.1 Automated Chart Marking:
The primary advantage of this advanced indicator is its ability to automatically identify and mark up key support and resistance levels on a chart. Gone are the days when traders had to painstakingly analyze charts and manually mark crucial levels. This indicator saves traders valuable time and ensures a more accurate depiction of S/R zones, ultimately facilitating better-informed trading decisions.
1.2 Round Number Detection:
Another notable feature of this indicator is its ability to detect and highlight psychological levels or round numbers. As these levels often act as significant areas of support or resistance, having them automatically marked on the chart allows traders to concentrate on developing and executing their trading strategies without getting bogged down in the minutiae of identifying these levels.
1.3 Customizable Timeframes:
Recognizing the diverse needs of traders, this advanced indicator offers the flexibility to adjust the user input options and adapt the S/R zones to any timeframe. This functionality allows traders to tailor the indicator to their preferred trading style, whether they are scalping on lower timeframes or taking longer-term positions on higher timeframes.
1.4 Adjustable Pip Difference:
The option to increase or decrease the pip difference between the levels is a game-changer, as it allows traders to easily fine-tune the S/R zones to match the specific behavior of the market across various timeframes. With just a few clicks, traders can increase the pip difference on higher timeframes for a broader perspective, or decrease it on lower timeframes for a more granular view of the market.
1.5 Comprehensive Customization Options:
The advanced S/R indicator boasts a complete range of customizable options, ensuring that traders can tailor it to their unique needs and preferences. With the ability to solely rely on this indicator for marking up their charts, traders can streamline their technical analysis and focus on developing robust trading strategies.
1.6 Anticipating Trades with Limit and Stop Orders:
One of the many ways traders can leverage the S/R zones identified by this indicator is by placing limit and stop orders at these levels. This proactive approach enables traders to be prepared for potential market moves and take advantage of opportunities as they arise, rather than scrambling to react to unexpected price action.
1.7 Identifying Swing Points and Market Trends:
The customizable S/R zones also facilitate the identification of swing points, allowing traders to easily determine the trend direction or recognize ranging markets. This enhanced understanding of market structure can inform trading decisions and improve the overall effectiveness of a trader's strategy.
1.8 Visualization of Swing Points:
The ability to customize the S/R zones not only simplifies the process of identifying swing points but also enhances their visualization. This allows traders to quickly grasp the market structure and make informed decisions based on the prevailing market conditions.
Section 2: Liquidity Wicks - Uncovering Hidden Opportunities in the Market
2.1 Complementing Support and Resistance Zones:
The advanced indicator's liquidity wicks feature serves as an excellent complement to the S/R zones, providing traders with a comprehensive understanding of the market dynamics. By highlighting potential liquidity areas, traders can easily identify high-probability trading opportunities that may have otherwise gone unnoticed.
2.2 Magnetism of Liquidity:
Liquidity in the market often acts as a magnet for price, drawing it towards areas with higher trading volume. By visualizing these liquidity areas through the use of liquidity wicks, traders can anticipate price movements and adjust their strategies accordingly, seizing opportunities as they arise.
2.3 Trading Towards or Bouncing from Liquidity Wicks:
The combination of liquidity wicks and S/R zones empowers traders to take advantage of the market's inherent attraction to liquidity. Traders can either trade towards these wicks, anticipating price to be drawn to the liquidity, or trade based on a bounce from the high or low of the wicks, expecting price to reverse after reaching these areas.
2.4 Synergy of Liquidity Wicks and Support/Resistance Zones:
The relationship between liquidity wicks and S/R zones creates an invaluable synergy for traders. By looking for large liquidity wick bounces from S/R zones, traders can anticipate that price is likely to bounce again, thereby increasing the probability of successful trade execution. This integrated approach enables traders to identify and capitalize on high-probability trading opportunities in a more systematic manner.
Section 3: Bringing It All Together - Maximizing the Potential of the Advanced Indicator
3.1 Customization for Enhanced Trading Performance:
The extensive customization options offered by the advanced indicator allow traders to fine-tune their chart analysis to suit their individual trading styles and preferences. By adjusting the S/R zones, timeframes, and pip differences, traders can achieve an unparalleled level of precision in their technical analysis, ultimately enhancing their overall trading performance.
3.2 Anticipating and Preparing for Market Moves:
The advanced indicator enables traders to anticipate market moves and be prepared for potential opportunities by placing limit and stop orders at crucial levels. This proactive approach minimizes the risk of missing out on profitable trades and allows traders to stay ahead of the market.
3.3 Identifying and Capitalizing on High-Probability Trading Opportunities:
The combination of S/R zones and liquidity wicks empowers traders to identify high-probability trading opportunities and capitalize on them effectively. By integrating these features into their trading strategies, traders can significantly improve their success rate and overall profitability.
Conclusion:
In summary, the advanced support and resistance and liquidity indicator offer traders a powerful tool that can greatly enhance their trading performance. By automatically marking up charts, identifying key levels, and providing customizable options, this indicator allows traders to focus on developing and executing effective trading strategies. The synergy of S/R zones and liquidity wicks further enables traders to uncover hidden opportunities and capitalize on high-probability trades.
By understanding and leveraging the full potential of this advanced indicator, traders can streamline their technical analysis, improve their decision-making process, and ultimately give them a great change to achieve better results in the market.
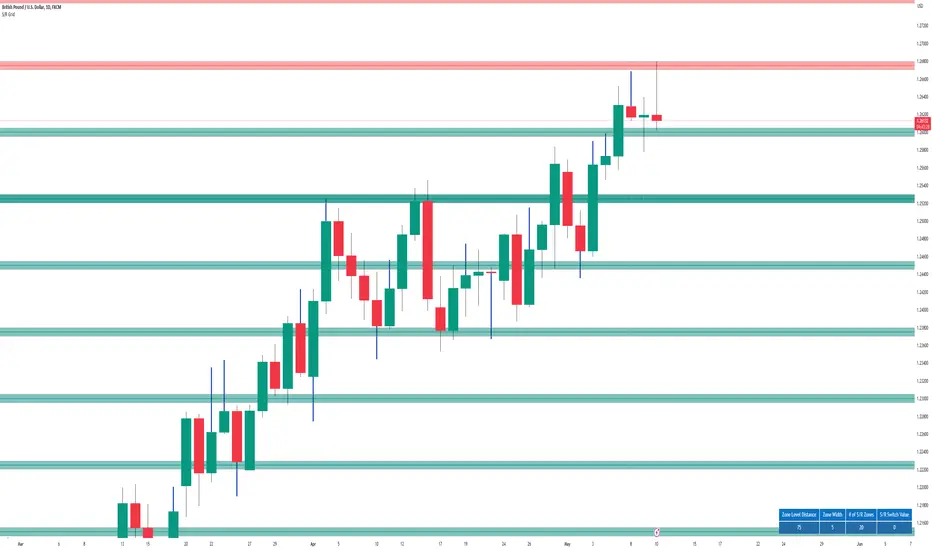
Jesse Livermore Strategy [Buy & Sell]Jesse Livermore was a famous trader who made a fortune in the early 20th century through his unique approach to trading.
While he did not leave behind a single, specific trading strategy that is attributed to him, I have tried to reproduce one.
His trading strategy was based on understanding market trends and sentiment, and he used several technical indicators to identify potential entry and exit points.
Some of the indicators he used include:
Price Action:
Jesse Livermore relied heavily on price action to make trading decisions.
He believed that the price itself was the best indicator of market sentiment, and that by analyzing the price movement, he could identify trends and market behavior.
Volume:
Livermore also used volume to confirm price movements.
He believed that a rise in volume along with a price increase indicated a strong bullish trend, while a decrease in volume with a price increase indicated a weak trend.
Pivot Points:
Another key component of Jesse Livermore's trading strategy was pivot points.
He used pivot points to identify potential support and resistance levels in the market, which he then used to identify potential entry and exit points.
Jesse Livermore outlined a simple trading system: wait for pivotal points before entering a trade.
When the points come into play, trade them using a buffer, trading in the direction of the overall market.
Let the price dictate your actions and stay with profitable trades until there is good reason to exit the trade.
The one I have tried to reproduce it's based on Pivot High and Low looking back 5 Days, and the average price oscillator.
When the price is bellow the support defined line it's time to Buy ( Long Position ), when the Price line is over the Resistance Line it's time to Sell ( Short Position )
This indicator has to be checked, and tried into a Real-Time context, so using the Replay functionality of TradingView is the best way to see and understand how Signals comes
(NB: look back into the chart without Replay should give you wrong Buy/Sell information)
The Indicator can be used on every TimeFrames, but the better ones are 5min - 15min.
I will add the possibility to choose the TimeFrames value for Pivot High and Low.
I will create a version with Alerts for Buy and Sell and the possibility to integrate it with "3commas Bot" where the best deal can be to set a TP to 1% for each Long or Short Entry.
Let's try it and comment for doubts or questions.
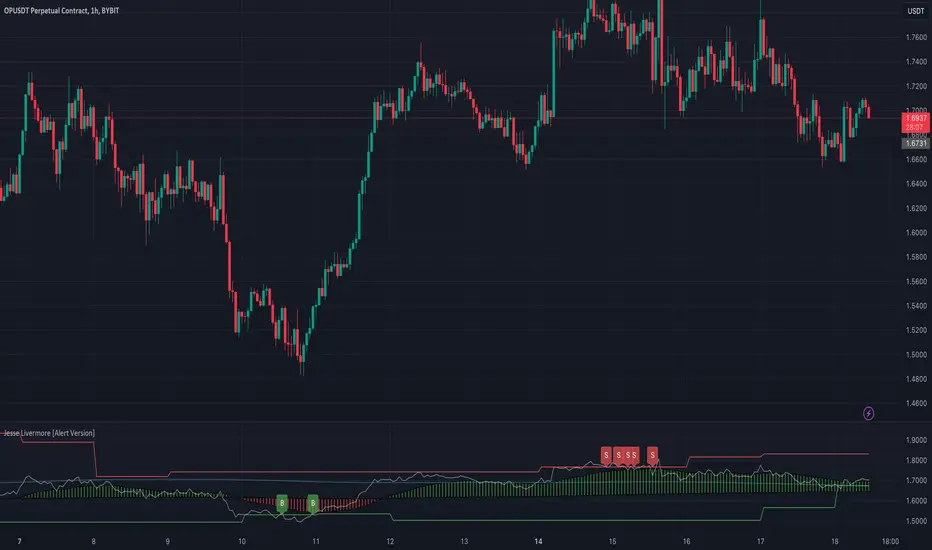
Probability Envelopes (PBE)Introduction
In the world of trading, technical analysis is vital for making informed decisions about the future direction of an asset's price. One such tool is the use of indicators, mathematical calculations that can help traders predict market trends. This article delves into an innovative indicator called the Probability Envelopes Indicator, which offers valuable insights into the potential price levels an asset may reach based on historical data. This in-depth look explores the statistical foundations of the indicator, highlighting its key components and benefits.
Section 1: Calculating Price Movements with Log Returns and Percentages
The Probability Envelopes Indicator provides the option to use either log returns or percentage changes when calculating price movements. Each method has its advantages:
Log Returns: These are calculated as the natural logarithm of the ratio of the current price to the previous price. Log returns are considered more stable and less sensitive to extreme price fluctuations.
Percentage Changes: These are calculated as the percentage difference between the current price and the previous price. They are simpler to interpret and easier to understand for most traders.
Section 2: Understanding Mean, Variance, and Standard Deviation
The Probability Envelopes Indicator utilizes various statistical measures to analyze historical price movements:
Mean: This is the average of a set of numbers. In the context of this indicator, it represents the average price movement for bullish (green) and bearish (red) scenarios.
Variance: This measure represents the dispersion of data points in a dataset. A higher variance indicates a greater spread of data points from the mean. Variance is calculated as the average of the squared differences from the mean.
Standard Deviation: This is the square root of the variance. It is a measure of the amount of variation or dispersion in a dataset. In the context of this indicator, standard deviations are used to calculate the width of the bands around the expected mean.
Section 3: Analyzing Historical Price Movements and Probabilities
The Probability Envelopes Indicator examines historical price movements and calculates probabilities based on their frequency:
The indicator first identifies and categorizes price movements into bullish (green) and bearish (red) scenarios.
It then calculates the probability of each price movement occurring by dividing the frequency of the movement by the total number of occurrences in each category (bullish or bearish).
The expected green and red movements are calculated by multiplying the probabilities by their respective price movements and summing the results.
The total expected movement, or weighted average, is calculated by combining the expected green and red movements and dividing by the total number of occurrences.
Section 4: Constructing the Probability Envelopes
The Probability Envelopes Indicator utilizes the calculated statistics to construct its bands:
The expected mean is calculated using the total expected movement and applied to the current open price.
An exponential moving average (EMA) is used to smooth the expected mean, with the smoothing length determining the degree of responsiveness.
The upper and lower bands are calculated by adding and subtracting the mean green and red movements, respectively, along with their standard deviations multiplied by a user-defined multiplier.
Section 5: Benefits of the Probability Envelopes Indicator
The Probability Envelopes Indicator offers numerous advantages to traders:
Enhanced Decision-Making: By providing probability-based estimations of future price levels, the indicator can help traders make more informed decisions and potentially improve their trading strategies.
Versatility: The indicator is applicable to various financial instruments, such as stocks, forex, commodities, and cryptocurrencies, making it a valuable tool for traders in different markets.
Customization: The indicator's parameters, including the use of log returns, multiplier values, and smoothing length, can be adjusted according to the user's preferences and trading style. This flexibility allows traders to fine-tune the Probability Envelopes Indicator to better suit their needs and goals.
Risk Management: The Probability Envelopes Indicator can be used as a component of a risk management strategy by providing insight into potential price movements. By identifying potential areas of support and resistance, traders can set stop-loss and take-profit levels more effectively.
Visualization: The graphical representation of the indicator, with its clear upper and lower bands, makes it easy for traders to quickly assess the market and potential price levels.
Section 6: Integrating the Probability Envelopes Indicator into Your Trading Strategy
When incorporating the Probability Envelopes Indicator into your trading strategy, consider the following tips:
Confirmation Signals: Use the indicator in conjunction with other technical analysis tools, such as trend lines, moving averages, or oscillators, to confirm the strength and direction of the market trend.
Timeframes: Experiment with different timeframes to find the optimal settings for your trading strategy. Keep in mind that shorter timeframes may generate more frequent signals but may also increase the likelihood of false signals.
Risk Management: Always establish a proper risk management strategy that includes setting stop-loss and take-profit levels, as well as managing your position sizes.
Backtesting: Test the Probability Envelopes Indicator on historical data to evaluate its effectiveness and fine-tune its parameters to optimize your trading strategy.
Section 7: Cons and Limitations of the Probability Envelopes Indicator
While the Probability Envelopes Indicator offers several advantages to traders, it is essential to be aware of its potential cons and limitations. Understanding these can help you make better-informed decisions when incorporating the indicator into your trading strategy.
Lagging Nature: The Probability Envelopes Indicator is primarily based on historical data and price movements. As a result, it may be less responsive to real-time changes in market conditions, and the predicted price levels may not always accurately reflect the market's current state. This lagging nature can lead to late entry and exit signals.
False Signals: As with any technical analysis tool, the Probability Envelopes Indicator can generate false signals. These occur when the indicator suggests a potential price movement, but the market does not follow through. It is crucial to use other technical analysis tools to confirm the signals and minimize the impact of false signals on your trading decisions.
Complex Statistical Concepts: The Probability Envelopes Indicator relies on complex statistical concepts and calculations, which may be challenging to grasp for some traders, particularly beginners. This complexity can lead to misunderstandings and misuse of the indicator if not adequately understood.
Overemphasis on Past Data: While historical data can be informative, relying too heavily on past performance to predict future movements can be limiting. Market conditions can change rapidly, and relying solely on past data may not provide an accurate representation of the current market environment.
No Guarantees: The Probability Envelopes Indicator, like all technical analysis tools, cannot guarantee success. It is essential to approach trading with realistic expectations and understand that no indicator or strategy can provide foolproof results.
To overcome these limitations, it is crucial to combine the Probability Envelopes Indicator with other technical analysis tools and utilize a comprehensive risk management strategy. By doing so, you can better understand the market and increase your chances of success in the ever-changing financial markets.
Section 8: Probability Envelopes Indicator vs. Bollinger Bands
Bollinger Bands and the Probability Envelopes Indicator are both technical analysis tools designed to identify potential support and resistance levels, as well as potential trend reversals. However, they differ in their underlying concepts, calculations, and applications. This section will provide a deep dive into the differences between these two indicators and how they can complement each other in a trading strategy.
Underlying Concepts and Calculations:
Bollinger Bands:
Bollinger Bands are based on a simple moving average (SMA) of the price data, with upper and lower bands plotted at a specified number of standard deviations away from the SMA.
The distance between the bands widens during periods of increased price volatility and narrows during periods of low volatility, indicating potential trend reversals or breakouts.
The standard settings for Bollinger Bands typically involve a 20-period SMA and a 2 standard deviation distance for the upper and lower bands.
Probability Envelopes Indicator:
The Probability Envelopes Indicator calculates the expected price movements based on historical data and probabilities, utilizing mean and standard deviation calculations for both upward and downward price movements.
It generates upper and lower bands based on the calculated expected mean movement and the standard deviation of historical price changes, multiplied by a user-defined multiplier.
The Probability Envelopes Indicator also allows users to choose between using log returns or percentage changes for the calculations, adding flexibility to the indicator.
Key Differences:
Calculation Method: Bollinger Bands are based on a simple moving average and standard deviations, while the Probability Envelopes Indicator uses statistical probability calculations derived from historical price changes.
Flexibility: The Probability Envelopes Indicator allows users to choose between log returns or percentage changes and adjust the multiplier, offering more customization options compared to Bollinger Bands.
Risk Management: Bollinger Bands primarily focus on volatility, while the Probability Envelopes Indicator incorporates probability calculations to provide additional insights into potential price movements, which can be helpful for risk management purposes.
Complementary Use:
Using both Bollinger Bands and the Probability Envelopes Indicator in your trading strategy can offer valuable insights into market conditions and potential price levels.
Bollinger Bands can provide insights into market volatility and potential breakouts or trend reversals based on the widening or narrowing of the bands.
The Probability Envelopes Indicator can offer additional information on the expected price movements based on historical data and probabilities, which can be helpful in anticipating potential support and resistance levels.
Combining these two indicators can help traders to better understand market dynamics and increase their chances of identifying profitable trading opportunities.
In conclusion, while both Bollinger Bands and the Probability Envelopes Indicator aim to identify potential support and resistance levels, they differ significantly in their underlying concepts, calculations, and applications. By understanding these differences and incorporating both tools into your trading strategy, you can gain a more comprehensive understanding of the market and make more informed trading decisions.
In conclusion, the Probability Envelopes Indicator is a powerful and versatile technical analysis tool that offers unique insights into expected price movements based on historical data and probability calculations. It provides traders with the ability to identify potential support and resistance levels, as well as potential trend reversals. When compared to Bollinger Bands, the Probability Envelopes Indicator offers more customization options and incorporates probability-based calculations for a different perspective on market dynamics.
Although the Probability Envelopes Indicator has its limitations and potential cons, such as the reliance on historical data and the assumption that past performance is indicative of future results, it remains a valuable addition to any trader's toolkit. By using the Probability Envelopes Indicator in conjunction with other technical analysis tools, such as Bollinger Bands, traders can gain a more comprehensive understanding of the market and make more informed trading decisions.
Ultimately, the success of any trading strategy relies on the ability to interpret and apply multiple indicators effectively. The Probability Envelopes Indicator serves as a unique and valuable tool in this regard, providing traders with a deeper understanding of the market and its potential price movements. By utilizing this indicator in combination with other tools and techniques, traders can increase their chances of success and optimize their trading strategies.
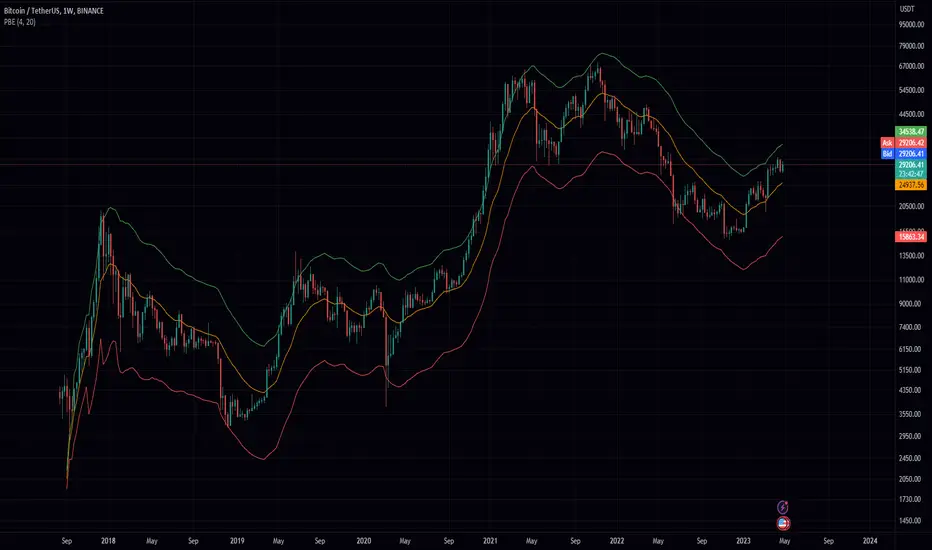
Goertzel Browser [Loxx]As the financial markets become increasingly complex and data-driven, traders and analysts must leverage powerful tools to gain insights and make informed decisions. One such tool is the Goertzel Browser indicator, a sophisticated technical analysis indicator that helps identify cyclical patterns in financial data. This powerful tool is capable of detecting cyclical patterns in financial data, helping traders to make better predictions and optimize their trading strategies. With its unique combination of mathematical algorithms and advanced charting capabilities, this indicator has the potential to revolutionize the way we approach financial modeling and trading.
█ Brief Overview of the Goertzel Browser
The Goertzel Browser is a sophisticated technical analysis tool that utilizes the Goertzel algorithm to analyze and visualize cyclical components within a financial time series. By identifying these cycles and their characteristics, the indicator aims to provide valuable insights into the market's underlying price movements, which could potentially be used for making informed trading decisions.
The primary purpose of this indicator is to:
1. Detect and analyze the dominant cycles present in the price data.
2. Reconstruct and visualize the composite wave based on the detected cycles.
3. Project the composite wave into the future, providing a potential roadmap for upcoming price movements.
To achieve this, the indicator performs several tasks:
1. Detrending the price data: The indicator preprocesses the price data using various detrending techniques, such as Hodrick-Prescott filters, zero-lag moving averages, and linear regression, to remove the underlying trend and focus on the cyclical components.
2. Applying the Goertzel algorithm: The indicator applies the Goertzel algorithm to the detrended price data, identifying the dominant cycles and their characteristics, such as amplitude, phase, and cycle strength.
3. Constructing the composite wave: The indicator reconstructs the composite wave by combining the detected cycles, either by using a user-defined list of cycles or by selecting the top N cycles based on their amplitude or cycle strength.
4. Visualizing the composite wave: The indicator plots the composite wave, using solid lines for the past and dotted lines for the future projections. The color of the lines indicates whether the wave is increasing or decreasing.
5. Displaying cycle information: The indicator provides a table that displays detailed information about the detected cycles, including their rank, period, Bartel's test results, amplitude, and phase.
This indicator is a powerful tool that employs the Goertzel algorithm to analyze and visualize the cyclical components within a financial time series. By providing insights into the underlying price movements and their potential future trajectory, the indicator aims to assist traders in making more informed decisions.
█ What is the Goertzel Algorithm?
The Goertzel algorithm, named after Gerald Goertzel, is a digital signal processing technique that is used to efficiently compute individual terms of the Discrete Fourier Transform (DFT). It was first introduced in 1958, and since then, it has found various applications in the fields of engineering, mathematics, and physics.
The Goertzel algorithm is primarily used to detect specific frequency components within a digital signal, making it particularly useful in applications where only a few frequency components are of interest. The algorithm is computationally efficient, as it requires fewer calculations than the Fast Fourier Transform (FFT) when detecting a small number of frequency components. This efficiency makes the Goertzel algorithm a popular choice in applications such as:
1. Telecommunications: The Goertzel algorithm is used for decoding Dual-Tone Multi-Frequency (DTMF) signals, which are the tones generated when pressing buttons on a telephone keypad. By identifying specific frequency components, the algorithm can accurately determine which button has been pressed.
2. Audio processing: The algorithm can be used to detect specific pitches or harmonics in an audio signal, making it useful in applications like pitch detection and tuning musical instruments.
3. Vibration analysis: In the field of mechanical engineering, the Goertzel algorithm can be applied to analyze vibrations in rotating machinery, helping to identify faulty components or signs of wear.
4. Power system analysis: The algorithm can be used to measure harmonic content in power systems, allowing engineers to assess power quality and detect potential issues.
The Goertzel algorithm is used in these applications because it offers several advantages over other methods, such as the FFT:
1. Computational efficiency: The Goertzel algorithm requires fewer calculations when detecting a small number of frequency components, making it more computationally efficient than the FFT in these cases.
2. Real-time analysis: The algorithm can be implemented in a streaming fashion, allowing for real-time analysis of signals, which is crucial in applications like telecommunications and audio processing.
3. Memory efficiency: The Goertzel algorithm requires less memory than the FFT, as it only computes the frequency components of interest.
4. Precision: The algorithm is less susceptible to numerical errors compared to the FFT, ensuring more accurate results in applications where precision is essential.
The Goertzel algorithm is an efficient digital signal processing technique that is primarily used to detect specific frequency components within a signal. Its computational efficiency, real-time capabilities, and precision make it an attractive choice for various applications, including telecommunications, audio processing, vibration analysis, and power system analysis. The algorithm has been widely adopted since its introduction in 1958 and continues to be an essential tool in the fields of engineering, mathematics, and physics.
█ Goertzel Algorithm in Quantitative Finance: In-Depth Analysis and Applications
The Goertzel algorithm, initially designed for signal processing in telecommunications, has gained significant traction in the financial industry due to its efficient frequency detection capabilities. In quantitative finance, the Goertzel algorithm has been utilized for uncovering hidden market cycles, developing data-driven trading strategies, and optimizing risk management. This section delves deeper into the applications of the Goertzel algorithm in finance, particularly within the context of quantitative trading and analysis.
Unveiling Hidden Market Cycles:
Market cycles are prevalent in financial markets and arise from various factors, such as economic conditions, investor psychology, and market participant behavior. The Goertzel algorithm's ability to detect and isolate specific frequencies in price data helps trader analysts identify hidden market cycles that may otherwise go unnoticed. By examining the amplitude, phase, and periodicity of each cycle, traders can better understand the underlying market structure and dynamics, enabling them to develop more informed and effective trading strategies.
Developing Quantitative Trading Strategies:
The Goertzel algorithm's versatility allows traders to incorporate its insights into a wide range of trading strategies. By identifying the dominant market cycles in a financial instrument's price data, traders can create data-driven strategies that capitalize on the cyclical nature of markets.
For instance, a trader may develop a mean-reversion strategy that takes advantage of the identified cycles. By establishing positions when the price deviates from the predicted cycle, the trader can profit from the subsequent reversion to the cycle's mean. Similarly, a momentum-based strategy could be designed to exploit the persistence of a dominant cycle by entering positions that align with the cycle's direction.
Enhancing Risk Management:
The Goertzel algorithm plays a vital role in risk management for quantitative strategies. By analyzing the cyclical components of a financial instrument's price data, traders can gain insights into the potential risks associated with their trading strategies.
By monitoring the amplitude and phase of dominant cycles, a trader can detect changes in market dynamics that may pose risks to their positions. For example, a sudden increase in amplitude may indicate heightened volatility, prompting the trader to adjust position sizing or employ hedging techniques to protect their portfolio. Additionally, changes in phase alignment could signal a potential shift in market sentiment, necessitating adjustments to the trading strategy.
Expanding Quantitative Toolkits:
Traders can augment the Goertzel algorithm's insights by combining it with other quantitative techniques, creating a more comprehensive and sophisticated analysis framework. For example, machine learning algorithms, such as neural networks or support vector machines, could be trained on features extracted from the Goertzel algorithm to predict future price movements more accurately.
Furthermore, the Goertzel algorithm can be integrated with other technical analysis tools, such as moving averages or oscillators, to enhance their effectiveness. By applying these tools to the identified cycles, traders can generate more robust and reliable trading signals.
The Goertzel algorithm offers invaluable benefits to quantitative finance practitioners by uncovering hidden market cycles, aiding in the development of data-driven trading strategies, and improving risk management. By leveraging the insights provided by the Goertzel algorithm and integrating it with other quantitative techniques, traders can gain a deeper understanding of market dynamics and devise more effective trading strategies.
█ Indicator Inputs
src: This is the source data for the analysis, typically the closing price of the financial instrument.
detrendornot: This input determines the method used for detrending the source data. Detrending is the process of removing the underlying trend from the data to focus on the cyclical components.
The available options are:
hpsmthdt: Detrend using Hodrick-Prescott filter centered moving average.
zlagsmthdt: Detrend using zero-lag moving average centered moving average.
logZlagRegression: Detrend using logarithmic zero-lag linear regression.
hpsmth: Detrend using Hodrick-Prescott filter.
zlagsmth: Detrend using zero-lag moving average.
DT_HPper1 and DT_HPper2: These inputs define the period range for the Hodrick-Prescott filter centered moving average when detrendornot is set to hpsmthdt.
DT_ZLper1 and DT_ZLper2: These inputs define the period range for the zero-lag moving average centered moving average when detrendornot is set to zlagsmthdt.
DT_RegZLsmoothPer: This input defines the period for the zero-lag moving average used in logarithmic zero-lag linear regression when detrendornot is set to logZlagRegression.
HPsmoothPer: This input defines the period for the Hodrick-Prescott filter when detrendornot is set to hpsmth.
ZLMAsmoothPer: This input defines the period for the zero-lag moving average when detrendornot is set to zlagsmth.
MaxPer: This input sets the maximum period for the Goertzel algorithm to search for cycles.
squaredAmp: This boolean input determines whether the amplitude should be squared in the Goertzel algorithm.
useAddition: This boolean input determines whether the Goertzel algorithm should use addition for combining the cycles.
useCosine: This boolean input determines whether the Goertzel algorithm should use cosine waves instead of sine waves.
UseCycleStrength: This boolean input determines whether the Goertzel algorithm should compute the cycle strength, which is a normalized measure of the cycle's amplitude.
WindowSizePast and WindowSizeFuture: These inputs define the window size for past and future projections of the composite wave.
FilterBartels: This boolean input determines whether Bartel's test should be applied to filter out non-significant cycles.
BartNoCycles: This input sets the number of cycles to be used in Bartel's test.
BartSmoothPer: This input sets the period for the moving average used in Bartel's test.
BartSigLimit: This input sets the significance limit for Bartel's test, below which cycles are considered insignificant.
SortBartels: This boolean input determines whether the cycles should be sorted by their Bartel's test results.
UseCycleList: This boolean input determines whether a user-defined list of cycles should be used for constructing the composite wave. If set to false, the top N cycles will be used.
Cycle1, Cycle2, Cycle3, Cycle4, and Cycle5: These inputs define the user-defined list of cycles when 'UseCycleList' is set to true. If using a user-defined list, each of these inputs represents the period of a specific cycle to include in the composite wave.
StartAtCycle: This input determines the starting index for selecting the top N cycles when UseCycleList is set to false. This allows you to skip a certain number of cycles from the top before selecting the desired number of cycles.
UseTopCycles: This input sets the number of top cycles to use for constructing the composite wave when UseCycleList is set to false. The cycles are ranked based on their amplitudes or cycle strengths, depending on the UseCycleStrength input.
SubtractNoise: This boolean input determines whether to subtract the noise (remaining cycles) from the composite wave. If set to true, the composite wave will only include the top N cycles specified by UseTopCycles.
█ Exploring Auxiliary Functions
The following functions demonstrate advanced techniques for analyzing financial markets, including zero-lag moving averages, Bartels probability, detrending, and Hodrick-Prescott filtering. This section examines each function in detail, explaining their purpose, methodology, and applications in finance. We will examine how each function contributes to the overall performance and effectiveness of the indicator and how they work together to create a powerful analytical tool.
Zero-Lag Moving Average:
The zero-lag moving average function is designed to minimize the lag typically associated with moving averages. This is achieved through a two-step weighted linear regression process that emphasizes more recent data points. The function calculates a linearly weighted moving average (LWMA) on the input data and then applies another LWMA on the result. By doing this, the function creates a moving average that closely follows the price action, reducing the lag and improving the responsiveness of the indicator.
The zero-lag moving average function is used in the indicator to provide a responsive, low-lag smoothing of the input data. This function helps reduce the noise and fluctuations in the data, making it easier to identify and analyze underlying trends and patterns. By minimizing the lag associated with traditional moving averages, this function allows the indicator to react more quickly to changes in market conditions, providing timely signals and improving the overall effectiveness of the indicator.
Bartels Probability:
The Bartels probability function calculates the probability of a given cycle being significant in a time series. It uses a mathematical test called the Bartels test to assess the significance of cycles detected in the data. The function calculates coefficients for each detected cycle and computes an average amplitude and an expected amplitude. By comparing these values, the Bartels probability is derived, indicating the likelihood of a cycle's significance. This information can help in identifying and analyzing dominant cycles in financial markets.
The Bartels probability function is incorporated into the indicator to assess the significance of detected cycles in the input data. By calculating the Bartels probability for each cycle, the indicator can prioritize the most significant cycles and focus on the market dynamics that are most relevant to the current trading environment. This function enhances the indicator's ability to identify dominant market cycles, improving its predictive power and aiding in the development of effective trading strategies.
Detrend Logarithmic Zero-Lag Regression:
The detrend logarithmic zero-lag regression function is used for detrending data while minimizing lag. It combines a zero-lag moving average with a linear regression detrending method. The function first calculates the zero-lag moving average of the logarithm of input data and then applies a linear regression to remove the trend. By detrending the data, the function isolates the cyclical components, making it easier to analyze and interpret the underlying market dynamics.
The detrend logarithmic zero-lag regression function is used in the indicator to isolate the cyclical components of the input data. By detrending the data, the function enables the indicator to focus on the cyclical movements in the market, making it easier to analyze and interpret market dynamics. This function is essential for identifying cyclical patterns and understanding the interactions between different market cycles, which can inform trading decisions and enhance overall market understanding.
Bartels Cycle Significance Test:
The Bartels cycle significance test is a function that combines the Bartels probability function and the detrend logarithmic zero-lag regression function to assess the significance of detected cycles. The function calculates the Bartels probability for each cycle and stores the results in an array. By analyzing the probability values, traders and analysts can identify the most significant cycles in the data, which can be used to develop trading strategies and improve market understanding.
The Bartels cycle significance test function is integrated into the indicator to provide a comprehensive analysis of the significance of detected cycles. By combining the Bartels probability function and the detrend logarithmic zero-lag regression function, this test evaluates the significance of each cycle and stores the results in an array. The indicator can then use this information to prioritize the most significant cycles and focus on the most relevant market dynamics. This function enhances the indicator's ability to identify and analyze dominant market cycles, providing valuable insights for trading and market analysis.
Hodrick-Prescott Filter:
The Hodrick-Prescott filter is a popular technique used to separate the trend and cyclical components of a time series. The function applies a smoothing parameter to the input data and calculates a smoothed series using a two-sided filter. This smoothed series represents the trend component, which can be subtracted from the original data to obtain the cyclical component. The Hodrick-Prescott filter is commonly used in economics and finance to analyze economic data and financial market trends.
The Hodrick-Prescott filter is incorporated into the indicator to separate the trend and cyclical components of the input data. By applying the filter to the data, the indicator can isolate the trend component, which can be used to analyze long-term market trends and inform trading decisions. Additionally, the cyclical component can be used to identify shorter-term market dynamics and provide insights into potential trading opportunities. The inclusion of the Hodrick-Prescott filter adds another layer of analysis to the indicator, making it more versatile and comprehensive.
Detrending Options: Detrend Centered Moving Average:
The detrend centered moving average function provides different detrending methods, including the Hodrick-Prescott filter and the zero-lag moving average, based on the selected detrending method. The function calculates two sets of smoothed values using the chosen method and subtracts one set from the other to obtain a detrended series. By offering multiple detrending options, this function allows traders and analysts to select the most appropriate method for their specific needs and preferences.
The detrend centered moving average function is integrated into the indicator to provide users with multiple detrending options, including the Hodrick-Prescott filter and the zero-lag moving average. By offering multiple detrending methods, the indicator allows users to customize the analysis to their specific needs and preferences, enhancing the indicator's overall utility and adaptability. This function ensures that the indicator can cater to a wide range of trading styles and objectives, making it a valuable tool for a diverse group of market participants.
The auxiliary functions functions discussed in this section demonstrate the power and versatility of mathematical techniques in analyzing financial markets. By understanding and implementing these functions, traders and analysts can gain valuable insights into market dynamics, improve their trading strategies, and make more informed decisions. The combination of zero-lag moving averages, Bartels probability, detrending methods, and the Hodrick-Prescott filter provides a comprehensive toolkit for analyzing and interpreting financial data. The integration of advanced functions in a financial indicator creates a powerful and versatile analytical tool that can provide valuable insights into financial markets. By combining the zero-lag moving average,
█ In-Depth Analysis of the Goertzel Browser Code
The Goertzel Browser code is an implementation of the Goertzel Algorithm, an efficient technique to perform spectral analysis on a signal. The code is designed to detect and analyze dominant cycles within a given financial market data set. This section will provide an extremely detailed explanation of the code, its structure, functions, and intended purpose.
Function signature and input parameters:
The Goertzel Browser function accepts numerous input parameters for customization, including source data (src), the current bar (forBar), sample size (samplesize), period (per), squared amplitude flag (squaredAmp), addition flag (useAddition), cosine flag (useCosine), cycle strength flag (UseCycleStrength), past and future window sizes (WindowSizePast, WindowSizeFuture), Bartels filter flag (FilterBartels), Bartels-related parameters (BartNoCycles, BartSmoothPer, BartSigLimit), sorting flag (SortBartels), and output buffers (goeWorkPast, goeWorkFuture, cyclebuffer, amplitudebuffer, phasebuffer, cycleBartelsBuffer).
Initializing variables and arrays:
The code initializes several float arrays (goeWork1, goeWork2, goeWork3, goeWork4) with the same length as twice the period (2 * per). These arrays store intermediate results during the execution of the algorithm.
Preprocessing input data:
The input data (src) undergoes preprocessing to remove linear trends. This step enhances the algorithm's ability to focus on cyclical components in the data. The linear trend is calculated by finding the slope between the first and last values of the input data within the sample.
Iterative calculation of Goertzel coefficients:
The core of the Goertzel Browser algorithm lies in the iterative calculation of Goertzel coefficients for each frequency bin. These coefficients represent the spectral content of the input data at different frequencies. The code iterates through the range of frequencies, calculating the Goertzel coefficients using a nested loop structure.
Cycle strength computation:
The code calculates the cycle strength based on the Goertzel coefficients. This is an optional step, controlled by the UseCycleStrength flag. The cycle strength provides information on the relative influence of each cycle on the data per bar, considering both amplitude and cycle length. The algorithm computes the cycle strength either by squaring the amplitude (controlled by squaredAmp flag) or using the actual amplitude values.
Phase calculation:
The Goertzel Browser code computes the phase of each cycle, which represents the position of the cycle within the input data. The phase is calculated using the arctangent function (math.atan) based on the ratio of the imaginary and real components of the Goertzel coefficients.
Peak detection and cycle extraction:
The algorithm performs peak detection on the computed amplitudes or cycle strengths to identify dominant cycles. It stores the detected cycles in the cyclebuffer array, along with their corresponding amplitudes and phases in the amplitudebuffer and phasebuffer arrays, respectively.
Sorting cycles by amplitude or cycle strength:
The code sorts the detected cycles based on their amplitude or cycle strength in descending order. This allows the algorithm to prioritize cycles with the most significant impact on the input data.
Bartels cycle significance test:
If the FilterBartels flag is set, the code performs a Bartels cycle significance test on the detected cycles. This test determines the statistical significance of each cycle and filters out the insignificant cycles. The significant cycles are stored in the cycleBartelsBuffer array. If the SortBartels flag is set, the code sorts the significant cycles based on their Bartels significance values.
Waveform calculation:
The Goertzel Browser code calculates the waveform of the significant cycles for both past and future time windows. The past and future windows are defined by the WindowSizePast and WindowSizeFuture parameters, respectively. The algorithm uses either cosine or sine functions (controlled by the useCosine flag) to calculate the waveforms for each cycle. The useAddition flag determines whether the waveforms should be added or subtracted.
Storing waveforms in matrices:
The calculated waveforms for each cycle are stored in two matrices - goeWorkPast and goeWorkFuture. These matrices hold the waveforms for the past and future time windows, respectively. Each row in the matrices represents a time window position, and each column corresponds to a cycle.
Returning the number of cycles:
The Goertzel Browser function returns the total number of detected cycles (number_of_cycles) after processing the input data. This information can be used to further analyze the results or to visualize the detected cycles.
The Goertzel Browser code is a comprehensive implementation of the Goertzel Algorithm, specifically designed for detecting and analyzing dominant cycles within financial market data. The code offers a high level of customization, allowing users to fine-tune the algorithm based on their specific needs. The Goertzel Browser's combination of preprocessing, iterative calculations, cycle extraction, sorting, significance testing, and waveform calculation makes it a powerful tool for understanding cyclical components in financial data.
█ Generating and Visualizing Composite Waveform
The indicator calculates and visualizes the composite waveform for both past and future time windows based on the detected cycles. Here's a detailed explanation of this process:
Updating WindowSizePast and WindowSizeFuture:
The WindowSizePast and WindowSizeFuture are updated to ensure they are at least twice the MaxPer (maximum period).
Initializing matrices and arrays:
Two matrices, goeWorkPast and goeWorkFuture, are initialized to store the Goertzel results for past and future time windows. Multiple arrays are also initialized to store cycle, amplitude, phase, and Bartels information.
Preparing the source data (srcVal) array:
The source data is copied into an array, srcVal, and detrended using one of the selected methods (hpsmthdt, zlagsmthdt, logZlagRegression, hpsmth, or zlagsmth).
Goertzel function call:
The Goertzel function is called to analyze the detrended source data and extract cycle information. The output, number_of_cycles, contains the number of detected cycles.
Initializing arrays for past and future waveforms:
Three arrays, epgoertzel, goertzel, and goertzelFuture, are initialized to store the endpoint Goertzel, non-endpoint Goertzel, and future Goertzel projections, respectively.
Calculating composite waveform for past bars (goertzel array):
The past composite waveform is calculated by summing the selected cycles (either from the user-defined cycle list or the top cycles) and optionally subtracting the noise component.
Calculating composite waveform for future bars (goertzelFuture array):
The future composite waveform is calculated in a similar way as the past composite waveform.
Drawing past composite waveform (pvlines):
The past composite waveform is drawn on the chart using solid lines. The color of the lines is determined by the direction of the waveform (green for upward, red for downward).
Drawing future composite waveform (fvlines):
The future composite waveform is drawn on the chart using dotted lines. The color of the lines is determined by the direction of the waveform (fuchsia for upward, yellow for downward).
Displaying cycle information in a table (table3):
A table is created to display the cycle information, including the rank, period, Bartel value, amplitude (or cycle strength), and phase of each detected cycle.
Filling the table with cycle information:
The indicator iterates through the detected cycles and retrieves the relevant information (period, amplitude, phase, and Bartel value) from the corresponding arrays. It then fills the table with this information, displaying the values up to six decimal places.
To summarize, this indicator generates a composite waveform based on the detected cycles in the financial data. It calculates the composite waveforms for both past and future time windows and visualizes them on the chart using colored lines. Additionally, it displays detailed cycle information in a table, including the rank, period, Bartel value, amplitude (or cycle strength), and phase of each detected cycle.
█ Enhancing the Goertzel Algorithm-Based Script for Financial Modeling and Trading
The Goertzel algorithm-based script for detecting dominant cycles in financial data is a powerful tool for financial modeling and trading. It provides valuable insights into the past behavior of these cycles and potential future impact. However, as with any algorithm, there is always room for improvement. This section discusses potential enhancements to the existing script to make it even more robust and versatile for financial modeling, general trading, advanced trading, and high-frequency finance trading.
Enhancements for Financial Modeling
Data preprocessing: One way to improve the script's performance for financial modeling is to introduce more advanced data preprocessing techniques. This could include removing outliers, handling missing data, and normalizing the data to ensure consistent and accurate results.
Additional detrending and smoothing methods: Incorporating more sophisticated detrending and smoothing techniques, such as wavelet transform or empirical mode decomposition, can help improve the script's ability to accurately identify cycles and trends in the data.
Machine learning integration: Integrating machine learning techniques, such as artificial neural networks or support vector machines, can help enhance the script's predictive capabilities, leading to more accurate financial models.
Enhancements for General and Advanced Trading
Customizable indicator integration: Allowing users to integrate their own technical indicators can help improve the script's effectiveness for both general and advanced trading. By enabling the combination of the dominant cycle information with other technical analysis tools, traders can develop more comprehensive trading strategies.
Risk management and position sizing: Incorporating risk management and position sizing functionality into the script can help traders better manage their trades and control potential losses. This can be achieved by calculating the optimal position size based on the user's risk tolerance and account size.
Multi-timeframe analysis: Enhancing the script to perform multi-timeframe analysis can provide traders with a more holistic view of market trends and cycles. By identifying dominant cycles on different timeframes, traders can gain insights into the potential confluence of cycles and make better-informed trading decisions.
Enhancements for High-Frequency Finance Trading
Algorithm optimization: To ensure the script's suitability for high-frequency finance trading, optimizing the algorithm for faster execution is crucial. This can be achieved by employing efficient data structures and refining the calculation methods to minimize computational complexity.
Real-time data streaming: Integrating real-time data streaming capabilities into the script can help high-frequency traders react to market changes more quickly. By continuously updating the cycle information based on real-time market data, traders can adapt their strategies accordingly and capitalize on short-term market fluctuations.
Order execution and trade management: To fully leverage the script's capabilities for high-frequency trading, implementing functionality for automated order execution and trade management is essential. This can include features such as stop-loss and take-profit orders, trailing stops, and automated trade exit strategies.
While the existing Goertzel algorithm-based script is a valuable tool for detecting dominant cycles in financial data, there are several potential enhancements that can make it even more powerful for financial modeling, general trading, advanced trading, and high-frequency finance trading. By incorporating these improvements, the script can become a more versatile and effective tool for traders and financial analysts alike.
█ Understanding the Limitations of the Goertzel Algorithm
While the Goertzel algorithm-based script for detecting dominant cycles in financial data provides valuable insights, it is important to be aware of its limitations and drawbacks. Some of the key drawbacks of this indicator are:
Lagging nature:
As with many other technical indicators, the Goertzel algorithm-based script can suffer from lagging effects, meaning that it may not immediately react to real-time market changes. This lag can lead to late entries and exits, potentially resulting in reduced profitability or increased losses.
Parameter sensitivity:
The performance of the script can be sensitive to the chosen parameters, such as the detrending methods, smoothing techniques, and cycle detection settings. Improper parameter selection may lead to inaccurate cycle detection or increased false signals, which can negatively impact trading performance.
Complexity:
The Goertzel algorithm itself is relatively complex, making it difficult for novice traders or those unfamiliar with the concept of cycle analysis to fully understand and effectively utilize the script. This complexity can also make it challenging to optimize the script for specific trading styles or market conditions.
Overfitting risk:
As with any data-driven approach, there is a risk of overfitting when using the Goertzel algorithm-based script. Overfitting occurs when a model becomes too specific to the historical data it was trained on, leading to poor performance on new, unseen data. This can result in misleading signals and reduced trading performance.
No guarantee of future performance: While the script can provide insights into past cycles and potential future trends, it is important to remember that past performance does not guarantee future results. Market conditions can change, and relying solely on the script's predictions without considering other factors may lead to poor trading decisions.
Limited applicability: The Goertzel algorithm-based script may not be suitable for all markets, trading styles, or timeframes. Its effectiveness in detecting cycles may be limited in certain market conditions, such as during periods of extreme volatility or low liquidity.
While the Goertzel algorithm-based script offers valuable insights into dominant cycles in financial data, it is essential to consider its drawbacks and limitations when incorporating it into a trading strategy. Traders should always use the script in conjunction with other technical and fundamental analysis tools, as well as proper risk management, to make well-informed trading decisions.
█ Interpreting Results
The Goertzel Browser indicator can be interpreted by analyzing the plotted lines and the table presented alongside them. The indicator plots two lines: past and future composite waves. The past composite wave represents the composite wave of the past price data, and the future composite wave represents the projected composite wave for the next period.
The past composite wave line displays a solid line, with green indicating a bullish trend and red indicating a bearish trend. On the other hand, the future composite wave line is a dotted line with fuchsia indicating a bullish trend and yellow indicating a bearish trend.
The table presented alongside the indicator shows the top cycles with their corresponding rank, period, Bartels, amplitude or cycle strength, and phase. The amplitude is a measure of the strength of the cycle, while the phase is the position of the cycle within the data series.
Interpreting the Goertzel Browser indicator involves identifying the trend of the past and future composite wave lines and matching them with the corresponding bullish or bearish color. Additionally, traders can identify the top cycles with the highest amplitude or cycle strength and utilize them in conjunction with other technical indicators and fundamental analysis for trading decisions.
This indicator is considered a repainting indicator because the value of the indicator is calculated based on the past price data. As new price data becomes available, the indicator's value is recalculated, potentially causing the indicator's past values to change. This can create a false impression of the indicator's performance, as it may appear to have provided a profitable trading signal in the past when, in fact, that signal did not exist at the time.
The Goertzel indicator is also non-endpointed, meaning that it is not calculated up to the current bar or candle. Instead, it uses a fixed amount of historical data to calculate its values, which can make it difficult to use for real-time trading decisions. For example, if the indicator uses 100 bars of historical data to make its calculations, it cannot provide a signal until the current bar has closed and become part of the historical data. This can result in missed trading opportunities or delayed signals.
█ Conclusion
The Goertzel Browser indicator is a powerful tool for identifying and analyzing cyclical patterns in financial markets. Its ability to detect multiple cycles of varying frequencies and strengths make it a valuable addition to any trader's technical analysis toolkit. However, it is important to keep in mind that the Goertzel Browser indicator should be used in conjunction with other technical analysis tools and fundamental analysis to achieve the best results. With continued refinement and development, the Goertzel Browser indicator has the potential to become a highly effective tool for financial modeling, general trading, advanced trading, and high-frequency finance trading. Its accuracy and versatility make it a promising candidate for further research and development.
█ Footnotes
What is the Bartels Test for Cycle Significance?
The Bartels Cycle Significance Test is a statistical method that determines whether the peaks and troughs of a time series are statistically significant. The test is named after its inventor, George Bartels, who developed it in the mid-20th century.
The Bartels test is designed to analyze the cyclical components of a time series, which can help traders and analysts identify trends and cycles in financial markets. The test calculates a Bartels statistic, which measures the degree of non-randomness or autocorrelation in the time series.
The Bartels statistic is calculated by first splitting the time series into two halves and calculating the range of the peaks and troughs in each half. The test then compares these ranges using a t-test, which measures the significance of the difference between the two ranges.
If the Bartels statistic is greater than a critical value, it indicates that the peaks and troughs in the time series are non-random and that there is a significant cyclical component to the data. Conversely, if the Bartels statistic is less than the critical value, it suggests that the peaks and troughs are random and that there is no significant cyclical component.
The Bartels Cycle Significance Test is particularly useful in financial analysis because it can help traders and analysts identify significant cycles in asset prices, which can in turn inform investment decisions. However, it is important to note that the test is not perfect and can produce false signals in certain situations, particularly in noisy or volatile markets. Therefore, it is always recommended to use the test in conjunction with other technical and fundamental indicators to confirm trends and cycles.
Deep-dive into the Hodrick-Prescott Fitler
The Hodrick-Prescott (HP) filter is a statistical tool used in economics and finance to separate a time series into two components: a trend component and a cyclical component. It is a powerful tool for identifying long-term trends in economic and financial data and is widely used by economists, central banks, and financial institutions around the world.
The HP filter was first introduced in the 1990s by economists Robert Hodrick and Edward Prescott. It is a simple, two-parameter filter that separates a time series into a trend component and a cyclical component. The trend component represents the long-term behavior of the data, while the cyclical component captures the shorter-term fluctuations around the trend.
The HP filter works by minimizing the following objective function:
Minimize: (Sum of Squared Deviations) + λ (Sum of Squared Second Differences)
Where:
The first term represents the deviation of the data from the trend.
The second term represents the smoothness of the trend.
λ is a smoothing parameter that determines the degree of smoothness of the trend.
The smoothing parameter λ is typically set to a value between 100 and 1600, depending on the frequency of the data. Higher values of λ lead to a smoother trend, while lower values lead to a more volatile trend.
The HP filter has several advantages over other smoothing techniques. It is a non-parametric method, meaning that it does not make any assumptions about the underlying distribution of the data. It also allows for easy comparison of trends across different time series and can be used with data of any frequency.
However, the HP filter also has some limitations. It assumes that the trend is a smooth function, which may not be the case in some situations. It can also be sensitive to changes in the smoothing parameter λ, which may result in different trends for the same data. Additionally, the filter may produce unrealistic trends for very short time series.
Despite these limitations, the HP filter remains a valuable tool for analyzing economic and financial data. It is widely used by central banks and financial institutions to monitor long-term trends in the economy, and it can be used to identify turning points in the business cycle. The filter can also be used to analyze asset prices, exchange rates, and other financial variables.
The Hodrick-Prescott filter is a powerful tool for analyzing economic and financial data. It separates a time series into a trend component and a cyclical component, allowing for easy identification of long-term trends and turning points in the business cycle. While it has some limitations, it remains a valuable tool for economists, central banks, and financial institutions around the world.

Height of Candle BodyUnderstanding the Height of Candlestick Body
Candlestick charts are a popular method of displaying price data in financial markets. They provide a visual representation of price movements and are used by traders to make informed decisions about buying and selling assets. Understanding the height of a candlestick body is an important aspect of technical analysis and can help traders identify trends and make profitable trades.
The height of a candlestick body is the distance between the opening and closing price of an asset over a given time period. When the closing price is higher than the opening price, the candlestick body is typically colored green or white and is considered bullish. Conversely, when the closing price is lower than the opening price, the candlestick body is typically colored red or black and is considered bearish.
The height of the candlestick body is important because it can provide valuable information about market sentiment. If the candlestick body is relatively small, it suggests that there is indecision in the market and that buyers and sellers are evenly matched. Conversely, if the candlestick body is relatively large, it suggests that there is a significant amount of buying or selling pressure in the market.
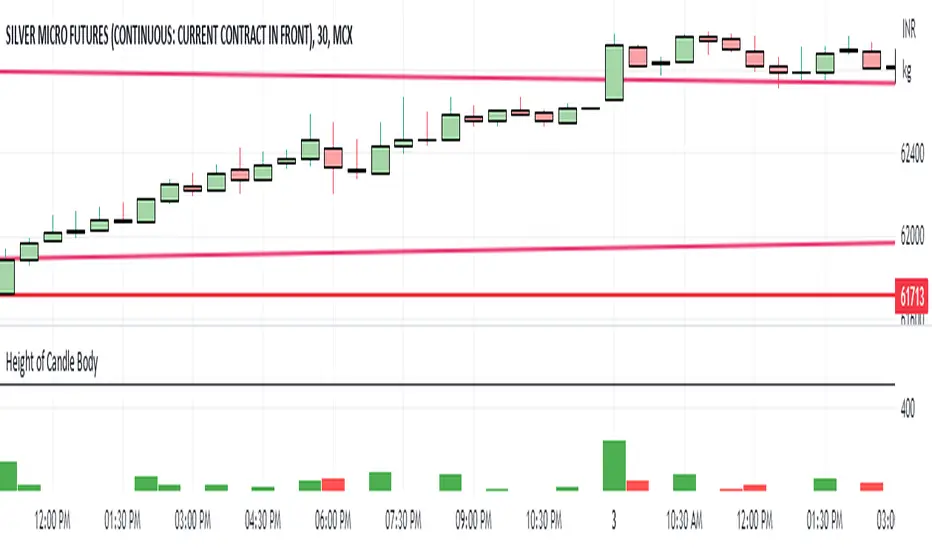
GKD-V Cercos Chaos vs Movement [Loxx]Giga Kaleidoscope GKD-V Cercos Chaos vs Movement is a Volatility/Volume module included in Loxx's "Giga Kaleidoscope Modularized Trading System".
█ GKD-V Cercos Chaos vs Movement
The following aims to provide a detailed explanation of Cercos Chaos vs Movement that helps traders determine market volatility by comparing two different measures: Buffer Move and Buffer Chaos. This indicator is non-directional and should be paired with a directional indicator to provide trading signals.
The first step in the process is defining a custom function that implements a variant of the sigmoid function. This function has a parameter that allows the output to be limited to the range of if desired. The sigmoid function will later be used to normalize the Buffer Chaos value.
Next, several input parameters are introduced, which can be adjusted by the user. These parameters include the period, chaos strength, chaos width, and movement strength. These values are essential to customizing the behavior of the indicator and adapting it to different market conditions and trading styles.
The wicks of the candles in the given time series are then calculated by subtracting the absolute difference between the open and close prices from the difference between the high and low prices. This step is crucial in determining the level of volatility in the market.
Subsequently, the highest high and lowest low over the defined period are identified by examining the maximum and minimum values of the open and close prices. This information is essential for calculating the total movement in the market over the period being analyzed.
Once the highest high and lowest low are found, the Buffer Move and Buffer Chaos values are calculated. The Buffer Move is the sum of the differences between the high and low prices for each candle in the period. This measure helps to identify the overall price movement in the market during the period.
On the other hand, the Buffer Chaos represents the sum of the wicks' lengths for each candle in the period. This measure is used to identify the level of uncertainty and disorder in the market during the period.
In the next step, the total movement in the market is calculated by subtracting the lowest low from the highest high. This value is then used to normalize the Buffer Move and Buffer Chaos values, ensuring they are on a comparable scale.
A comparison is made between the normalized Buffer Move and Buffer Chaos values. If the Buffer Move value is greater than the Buffer Chaos value, it indicates that there is enough volatility in the market to trade long or short. In such a case, the indicator suggests that the market conditions are favorable for trading. However, as this indicator is non-directional, a directional indicator should be used in conjunction with it to provide trading signals.
In conclusion, this custom trading indicator provides valuable insights into market volatility by comparing the Buffer Move and Buffer Chaos values. By offering a non-directional perspective, traders can use this indicator to gauge the potential for profitable trades and make informed decisions by pairing it with a directional indicator.
Additional Features
This indicator allows you to select from 33 source types. They are as follows:
Close
Open
High
Low
Median
Typical
Weighted
Average
Average Median Body
Trend Biased
Trend Biased (Extreme)
HA Close
HA Open
HA High
HA Low
HA Median
HA Typical
HA Weighted
HA Average
HA Average Median Body
HA Trend Biased
HA Trend Biased (Extreme)
HAB Close
HAB Open
HAB High
HAB Low
HAB Median
HAB Typical
HAB Weighted
HAB Average
HAB Average Median Body
HAB Trend Biased
HAB Trend Biased (Extreme)
What are Heiken Ashi "better" candles?
Heiken Ashi "better" candles are a modified version of the standard Heiken Ashi candles, which are a popular charting technique used in technical analysis. Heiken Ashi candles help traders identify trends and potential reversal points by smoothing out price data and reducing market noise. The "better formula" was proposed by Sebastian Schmidt in an article published by BNP Paribas in Warrants & Zertifikate, a German magazine, in August 2004. The aim of this formula is to further improve the smoothing of the Heiken Ashi chart and enhance its effectiveness in identifying trends and reversals.
Standard Heiken Ashi candles are calculated using the following formulas:
Heiken Ashi Close = (Open + High + Low + Close) / 4
Heiken Ashi Open = (Previous Heiken Ashi Open + Previous Heiken Ashi Close) / 2
Heiken Ashi High = Max (High, Heiken Ashi Open, Heiken Ashi Close)
Heiken Ashi Low = Min (Low, Heiken Ashi Open, Heiken Ashi Close)
The "better formula" modifies the standard Heiken Ashi calculation by incorporating additional smoothing, which can help reduce noise and make it easier to identify trends and reversals. The modified formulas for Heiken Ashi "better" candles are as follows:
Better Heiken Ashi Close = (Open + High + Low + Close) / 4
Better Heiken Ashi Open = (Previous Better Heiken Ashi Open + Previous Better Heiken Ashi Close) / 2
Better Heiken Ashi High = Max (High, Better Heiken Ashi Open, Better Heiken Ashi Close)
Better Heiken Ashi Low = Min (Low, Better Heiken Ashi Open, Better Heiken Ashi Close)
Smoothing Factor = 2 / (N + 1), where N is the chosen period for smoothing
Smoothed Better Heiken Ashi Open = (Better Heiken Ashi Open * Smoothing Factor) + (Previous Smoothed Better Heiken Ashi Open * (1 - Smoothing Factor))
Smoothed Better Heiken Ashi Close = (Better Heiken Ashi Close * Smoothing Factor) + (Previous Smoothed Better Heiken Ashi Close * (1 - Smoothing Factor))
The smoothed Better Heiken Ashi Open and Close values are then used to calculate the smoothed Better Heiken Ashi High and Low values, resulting in "better" candles that provide a clearer representation of the market trend and potential reversal points.
It's important to note that, like any other technical analysis tool, Heiken Ashi "better" candles are not foolproof and should be used in conjunction with other indicators and analysis techniques to make well-informed trading decisions.
Heiken Ashi "better" candles, as mentioned previously, provide a clearer representation of market trends and potential reversal points by reducing noise and smoothing out price data. When using these candles in conjunction with other technical analysis tools and indicators, traders can gain valuable insights into market behavior and make more informed decisions.
To effectively use Heiken Ashi "better" candles in your trading strategy, consider the following tips:
Trend Identification: Heiken Ashi "better" candles can help you identify the prevailing trend in the market. When the majority of the candles are green (or another color, depending on your chart settings) and there are no or few lower wicks, it may indicate a strong uptrend. Conversely, when the majority of the candles are red (or another color) and there are no or few upper wicks, it may signal a strong downtrend.
Trend Reversals: Look for potential trend reversals when a change in the color of the candles occurs, especially when accompanied by longer wicks. For example, if a green candle with a long lower wick is followed by a red candle, it could indicate a bearish reversal. Similarly, a red candle with a long upper wick followed by a green candle may suggest a bullish reversal.
Support and Resistance: You can use Heiken Ashi "better" candles to identify potential support and resistance levels. When the candles are consistently moving in one direction and then suddenly change color with longer wicks, it could indicate the presence of a support or resistance level.
Stop-Loss and Take-Profit: Using Heiken Ashi "better" candles can help you manage risk by determining optimal stop-loss and take-profit levels. For instance, you can place your stop-loss below the low of the most recent green candle in an uptrend or above the high of the most recent red candle in a downtrend.
Confirming Signals: Heiken Ashi "better" candles should be used in conjunction with other technical indicators, such as moving averages, oscillators, or chart patterns, to confirm signals and improve the accuracy of your analysis.
In this implementation, you have the choice of AMA, KAMA, or T3 smoothing. These are as follows:
Kaufman Adaptive Moving Average (KAMA)
The Kaufman Adaptive Moving Average (KAMA) is a type of adaptive moving average used in technical analysis to smooth out price fluctuations and identify trends. The KAMA adjusts its smoothing factor based on the market's volatility, making it more responsive in volatile markets and smoother in calm markets. The KAMA is calculated using three different efficiency ratios that determine the appropriate smoothing factor for the current market conditions. These ratios are based on the noise level of the market, the speed at which the market is moving, and the length of the moving average. The KAMA is a popular choice among traders who prefer to use adaptive indicators to identify trends and potential reversals.
Adaptive Moving Average
The Adaptive Moving Average (AMA) is a type of moving average that adjusts its sensitivity to price movements based on market conditions. It uses a ratio between the current price and the highest and lowest prices over a certain lookback period to determine its level of smoothing. The AMA can help reduce lag and increase responsiveness to changes in trend direction, making it useful for traders who want to follow trends while avoiding false signals. The AMA is calculated by multiplying a smoothing constant with the difference between the current price and the previous AMA value, then adding the result to the previous AMA value.
T3
The T3 moving average is a type of technical indicator used in financial analysis to identify trends in price movements. It is similar to the Exponential Moving Average (EMA) and the Double Exponential Moving Average (DEMA), but uses a different smoothing algorithm.
The T3 moving average is calculated using a series of exponential moving averages that are designed to filter out noise and smooth the data. The resulting smoothed data is then weighted with a non-linear function to produce a final output that is more responsive to changes in trend direction.
The T3 moving average can be customized by adjusting the length of the moving average, as well as the weighting function used to smooth the data. It is commonly used in conjunction with other technical indicators as part of a larger trading strategy.
█ Giga Kaleidoscope Modularized Trading System
Core components of an NNFX algorithmic trading strategy
The NNFX algorithm is built on the principles of trend, momentum, and volatility. There are six core components in the NNFX trading algorithm:
1. Volatility - price volatility; e.g., Average True Range, True Range Double, Close-to-Close, etc.
2. Baseline - a moving average to identify price trend
3. Confirmation 1 - a technical indicator used to identify trends
4. Confirmation 2 - a technical indicator used to identify trends
5. Continuation - a technical indicator used to identify trends
6. Volatility/Volume - a technical indicator used to identify volatility/volume breakouts/breakdown
7. Exit - a technical indicator used to determine when a trend is exhausted
What is Volatility in the NNFX trading system?
In the NNFX (No Nonsense Forex) trading system, ATR (Average True Range) is typically used to measure the volatility of an asset. It is used as a part of the system to help determine the appropriate stop loss and take profit levels for a trade. ATR is calculated by taking the average of the true range values over a specified period.
True range is calculated as the maximum of the following values:
-Current high minus the current low
-Absolute value of the current high minus the previous close
-Absolute value of the current low minus the previous close
ATR is a dynamic indicator that changes with changes in volatility. As volatility increases, the value of ATR increases, and as volatility decreases, the value of ATR decreases. By using ATR in NNFX system, traders can adjust their stop loss and take profit levels according to the volatility of the asset being traded. This helps to ensure that the trade is given enough room to move, while also minimizing potential losses.
Other types of volatility include True Range Double (TRD), Close-to-Close, and Garman-Klass
What is a Baseline indicator?
The baseline is essentially a moving average, and is used to determine the overall direction of the market.
The baseline in the NNFX system is used to filter out trades that are not in line with the long-term trend of the market. The baseline is plotted on the chart along with other indicators, such as the Moving Average (MA), the Relative Strength Index (RSI), and the Average True Range (ATR).
Trades are only taken when the price is in the same direction as the baseline. For example, if the baseline is sloping upwards, only long trades are taken, and if the baseline is sloping downwards, only short trades are taken. This approach helps to ensure that trades are in line with the overall trend of the market, and reduces the risk of entering trades that are likely to fail.
By using a baseline in the NNFX system, traders can have a clear reference point for determining the overall trend of the market, and can make more informed trading decisions. The baseline helps to filter out noise and false signals, and ensures that trades are taken in the direction of the long-term trend.
What is a Confirmation indicator?
Confirmation indicators are technical indicators that are used to confirm the signals generated by primary indicators. Primary indicators are the core indicators used in the NNFX system, such as the Average True Range (ATR), the Moving Average (MA), and the Relative Strength Index (RSI).
The purpose of the confirmation indicators is to reduce false signals and improve the accuracy of the trading system. They are designed to confirm the signals generated by the primary indicators by providing additional information about the strength and direction of the trend.
Some examples of confirmation indicators that may be used in the NNFX system include the Bollinger Bands, the MACD (Moving Average Convergence Divergence), and the MACD Oscillator. These indicators can provide information about the volatility, momentum, and trend strength of the market, and can be used to confirm the signals generated by the primary indicators.
In the NNFX system, confirmation indicators are used in combination with primary indicators and other filters to create a trading system that is robust and reliable. By using multiple indicators to confirm trading signals, the system aims to reduce the risk of false signals and improve the overall profitability of the trades.
What is a Continuation indicator?
In the NNFX (No Nonsense Forex) trading system, a continuation indicator is a technical indicator that is used to confirm a current trend and predict that the trend is likely to continue in the same direction. A continuation indicator is typically used in conjunction with other indicators in the system, such as a baseline indicator, to provide a comprehensive trading strategy.
What is a Volatility/Volume indicator?
Volume indicators, such as the On Balance Volume (OBV), the Chaikin Money Flow (CMF), or the Volume Price Trend (VPT), are used to measure the amount of buying and selling activity in a market. They are based on the trading volume of the market, and can provide information about the strength of the trend. In the NNFX system, volume indicators are used to confirm trading signals generated by the Moving Average and the Relative Strength Index. Volatility indicators include Average Direction Index, Waddah Attar, and Volatility Ratio. In the NNFX trading system, volatility is a proxy for volume and vice versa.
By using volume indicators as confirmation tools, the NNFX trading system aims to reduce the risk of false signals and improve the overall profitability of trades. These indicators can provide additional information about the market that is not captured by the primary indicators, and can help traders to make more informed trading decisions. In addition, volume indicators can be used to identify potential changes in market trends and to confirm the strength of price movements.
What is an Exit indicator?
The exit indicator is used in conjunction with other indicators in the system, such as the Moving Average (MA), the Relative Strength Index (RSI), and the Average True Range (ATR), to provide a comprehensive trading strategy.
The exit indicator in the NNFX system can be any technical indicator that is deemed effective at identifying optimal exit points. Examples of exit indicators that are commonly used include the Parabolic SAR, the Average Directional Index (ADX), and the Chandelier Exit.
The purpose of the exit indicator is to identify when a trend is likely to reverse or when the market conditions have changed, signaling the need to exit a trade. By using an exit indicator, traders can manage their risk and prevent significant losses.
In the NNFX system, the exit indicator is used in conjunction with a stop loss and a take profit order to maximize profits and minimize losses. The stop loss order is used to limit the amount of loss that can be incurred if the trade goes against the trader, while the take profit order is used to lock in profits when the trade is moving in the trader's favor.
Overall, the use of an exit indicator in the NNFX trading system is an important component of a comprehensive trading strategy. It allows traders to manage their risk effectively and improve the profitability of their trades by exiting at the right time.
How does Loxx's GKD (Giga Kaleidoscope Modularized Trading System) implement the NNFX algorithm outlined above?
Loxx's GKD v1.0 system has five types of modules (indicators/strategies). These modules are:
1. GKD-BT - Backtesting module (Volatility, Number 1 in the NNFX algorithm)
2. GKD-B - Baseline module (Baseline and Volatility/Volume, Numbers 1 and 2 in the NNFX algorithm)
3. GKD-C - Confirmation 1/2 and Continuation module (Confirmation 1/2 and Continuation, Numbers 3, 4, and 5 in the NNFX algorithm)
4. GKD-V - Volatility/Volume module (Confirmation 1/2, Number 6 in the NNFX algorithm)
5. GKD-E - Exit module (Exit, Number 7 in the NNFX algorithm)
(additional module types will added in future releases)
Each module interacts with every module by passing data between modules. Data is passed between each module as described below:
GKD-B => GKD-V => GKD-C(1) => GKD-C(2) => GKD-C(Continuation) => GKD-E => GKD-BT
That is, the Baseline indicator passes its data to Volatility/Volume. The Volatility/Volume indicator passes its values to the Confirmation 1 indicator. The Confirmation 1 indicator passes its values to the Confirmation 2 indicator. The Confirmation 2 indicator passes its values to the Continuation indicator. The Continuation indicator passes its values to the Exit indicator, and finally, the Exit indicator passes its values to the Backtest strategy.
This chaining of indicators requires that each module conform to Loxx's GKD protocol, therefore allowing for the testing of every possible combination of technical indicators that make up the six components of the NNFX algorithm.
What does the application of the GKD trading system look like?
Example trading system:
Backtest: Strategy with 1-3 take profits, trailing stop loss, multiple types of PnL volatility, and 2 backtesting styles
Baseline: Hull Moving Average
Volatility/Volume: Cercos Chaos vs Movement as shown on the chart above
Confirmation 1: Fisher Transform
Confirmation 2: Williams Percent Range
Continuation: Cercos Chaos vs Movement
Exit: Rex Oscillator
Each GKD indicator is denoted with a module identifier of either: GKD-BT, GKD-B, GKD-C, GKD-V, or GKD-E. This allows traders to understand to which module each indicator belongs and where each indicator fits into the GKD protocol chain.
Giga Kaleidoscope Modularized Trading System Signals (based on the NNFX algorithm)
Standard Entry
1. GKD-C Confirmation 1 Signal
2. GKD-B Baseline agrees
3. Price is within a range of 0.2x Volatility and 1.0x Volatility of the Goldie Locks Mean
4. GKD-C Confirmation 2 agrees
5. GKD-V Volatility/Volume agrees
Baseline Entry
1. GKD-B Baseline signal
2. GKD-C Confirmation 1 agrees
3. Price is within a range of 0.2x Volatility and 1.0x Volatility of the Goldie Locks Mean
4. GKD-C Confirmation 2 agrees
5. GKD-V Volatility/Volume agrees
6. GKD-C Confirmation 1 signal was less than 7 candles prior
Volatility/Volume Entry
1. GKD-V Volatility/Volume signal
2. GKD-C Confirmation 1 agrees
3. Price is within a range of 0.2x Volatility and 1.0x Volatility of the Goldie Locks Mean
4. GKD-C Confirmation 2 agrees
5. GKD-B Baseline agrees
6. GKD-C Confirmation 1 signal was less than 7 candles prior
Continuation Entry
1. Standard Entry, Baseline Entry, or Pullback; entry triggered previously
2. GKD-B Baseline hasn't crossed since entry signal trigger
3. GKD-C Confirmation Continuation Indicator signals
4. GKD-C Confirmation 1 agrees
5. GKD-B Baseline agrees
6. GKD-C Confirmation 2 agrees
1-Candle Rule Standard Entry
1. GKD-C Confirmation 1 signal
2. GKD-B Baseline agrees
3. Price is within a range of 0.2x Volatility and 1.0x Volatility of the Goldie Locks Mean
Next Candle:
1. Price retraced (Long: close < close or Short: close > close )
2. GKD-B Baseline agrees
3. GKD-C Confirmation 1 agrees
4. GKD-C Confirmation 2 agrees
5. GKD-V Volatility/Volume agrees
1-Candle Rule Baseline Entry
1. GKD-B Baseline signal
2. GKD-C Confirmation 1 agrees
3. Price is within a range of 0.2x Volatility and 1.0x Volatility of the Goldie Locks Mean
4. GKD-C Confirmation 1 signal was less than 7 candles prior
Next Candle:
1. Price retraced (Long: close < close or Short: close > close )
2. GKD-B Baseline agrees
3. GKD-C Confirmation 1 agrees
4. GKD-C Confirmation 2 agrees
5. GKD-V Volatility/Volume Agrees
1-Candle Rule Volatility/Volume Entry
1. GKD-V Volatility/Volume signal
2. GKD-C Confirmation 1 agrees
3. Price is within a range of 0.2x Volatility and 1.0x Volatility of the Goldie Locks Mean
4. GKD-C Confirmation 1 signal was less than 7 candles prior
Next Candle:
1. Price retraced (Long: close < close or Short: close > close)
2. GKD-B Volatility/Volume agrees
3. GKD-C Confirmation 1 agrees
4. GKD-C Confirmation 2 agrees
5. GKD-B Baseline agrees
PullBack Entry
1. GKD-B Baseline signal
2. GKD-C Confirmation 1 agrees
3. Price is beyond 1.0x Volatility of Baseline
Next Candle:
1. Price is within a range of 0.2x Volatility and 1.0x Volatility of the Goldie Locks Mean
2. GKD-C Confirmation 1 agrees
3. GKD-C Confirmation 2 agrees
4. GKD-V Volatility/Volume Agrees
]█ Setting up the GKD
The GKD system involves chaining indicators together. These are the steps to set this up.
Use a GKD-C indicator alone on a chart
1. Inside the GKD-C indicator, change the "Confirmation Type" setting to "Solo Confirmation Simple"
Use a GKD-V indicator alone on a chart
**nothing, it's already useable on the chart without any settings changes
Use a GKD-B indicator alone on a chart
**nothing, it's already useable on the chart without any settings changes
Baseline (Baseline, Backtest)
1. Import the GKD-B Baseline into the GKD-BT Backtest: "Input into Volatility/Volume or Backtest (Baseline testing)"
2. Inside the GKD-BT Backtest, change the setting "Backtest Special" to "Baseline"
Volatility/Volume (Volatility/Volume, Backte st)
1. Inside the GKD-V indicator, change the "Testing Type" setting to "Solo"
2. Inside the GKD-V indicator, change the "Signal Type" setting to "Crossing" (neither traditional nor both can be backtested)
3. Import the GKD-V indicator into the GKD-BT Backtest: "Input into C1 or Backtest"
4. Inside the GKD-BT Backtest, change the setting "Backtest Special" to "Volatility/Volume"
5. Inside the GKD-BT Backtest, a) change the setting "Backtest Type" to "Trading" if using a directional GKD-V indicator; or, b) change the setting "Backtest Type" to "Full" if using a directional or non-directional GKD-V indicator (non-directional GKD-V can only test Longs and Shorts separately)
6. If "Backtest Type" is set to "Full": Inside the GKD-BT Backtest, change the setting "Backtest Side" to "Long" or "Short
7. If "Backtest Type" is set to "Full": To allow the system to open multiple orders at one time so you test all Longs or Shorts, open the GKD-BT Backtest, click the tab "Properties" and then insert a value of something like 10 orders into the "Pyramiding" settings. This will allow 10 orders to be opened at one time which should be enough to catch all possible Longs or Shorts.
Solo Confirmation Simple (Confirmation, Backtest)
1. Inside the GKD-C indicator, change the "Confirmation Type" setting to "Solo Confirmation Simple"
1. Import the GKD-C indicator into the GKD-BT Backtest: "Input into Backtest"
2. Inside the GKD-BT Backtest, change the setting "Backtest Special" to "Solo Confirmation Simple"
Solo Confirmation Complex without Exits (Baseline, Volatility/Volume, Confirmation, Backtest)
1. Inside the GKD-V indicator, change the "Testing Type" setting to "Chained"
2. Import the GKD-B Baseline into the GKD-V indicator: "Input into Volatility/Volume or Backtest (Baseline testing)"
3. Inside the GKD-C indicator, change the "Confirmation Type" setting to "Solo Confirmation Complex"
4. Import the GKD-V indicator into the GKD-C indicator: "Input into C1 or Backtest"
5. Inside the GKD-BT Backtest, change the setting "Backtest Special" to "GKD Full wo/ Exits"
6. Import the GKD-C into the GKD-BT Backtest: "Input into Exit or Backtest"
Solo Confirmation Complex with Exits (Baseline, Volatility/Volume, Confirmation, Exit, Backtest)
1. Inside the GKD-V indicator, change the "Testing Type" setting to "Chained"
2. Import the GKD-B Baseline into the GKD-V indicator: "Input into Volatility/Volume or Backtest (Baseline testing)"
3. Inside the GKD-C indicator, change the "Confirmation Type" setting to "Solo Confirmation Complex"
4. Import the GKD-V indicator into the GKD-C indicator: "Input into C1 or Backtest"
5. Import the GKD-C indicator into the GKD-E indicator: "Input into Exit"
6. Inside the GKD-BT Backtest, change the setting "Backtest Special" to "GKD Full w/ Exits"
7. Import the GKD-E into the GKD-BT Backtest: "Input into Backtest"
Full GKD without Exits (Baseline, Volatility/Volume, Confirmation 1, Confirmation 2, Continuation, Backtest)
1. Inside the GKD-V indicator, change the "Testing Type" setting to "Chained"
2. Import the GKD-B Baseline into the GKD-V indicator: "Input into Volatility/Volume or Backtest (Baseline testing)"
3. Inside the GKD-C 1 indicator, change the "Confirmation Type" setting to "Confirmation 1"
4. Import the GKD-V indicator into the GKD-C 1 indicator: "Input into C1 or Backtest"
5. Inside the GKD-C 2 indicator, change the "Confirmation Type" setting to "Confirmation 2"
6. Import the GKD-C 1 indicator into the GKD-C 2 indicator: "Input into C2"
7. Inside the GKD-C Continuation indicator, change the "Confirmation Type" setting to "Continuation"
8. Inside the GKD-BT Backtest, change the setting "Backtest Special" to "GKD Full wo/ Exits"
9. Import the GKD-E into the GKD-BT Backtest: "Input into Exit or Backtest"
Full GKD with Exits (Baseline, Volatility/Volume, Confirmation 1, Confirmation 2, Continuation, Exit, Backtest)
1. Inside the GKD-V indicator, change the "Testing Type" setting to "Chained"
2. Import the GKD-B Baseline into the GKD-V indicator: "Input into Volatility/Volume or Backtest (Baseline testing)"
3. Inside the GKD-C 1 indicator, change the "Confirmation Type" setting to "Confirmation 1"
4. Import the GKD-V indicator into the GKD-C 1 indicator: "Input into C1 or Backtest"
5. Inside the GKD-C 2 indicator, change the "Confirmation Type" setting to "Confirmation 2"
6. Import the GKD-C 1 indicator into the GKD-C 2 indicator: "Input into C2"
7. Inside the GKD-C Continuation indicator, change the "Confirmation Type" setting to "Continuation"
8. Import the GKD-C Continuation indicator into the GKD-E indicator: "Input into Exit"
9. Inside the GKD-BT Backtest, change the setting "Backtest Special" to "GKD Full w/ Exits"
10. Import the GKD-E into the GKD-BT Backtest: "Input into Backtest"
Baseline + Volatility/Volume (Baseline, Volatility/Volume, Backtest)
1. Inside the GKD-V indicator, change the "Testing Type" setting to "Baseline + Volatility/Volume"
2. Inside the GKD-V indicator, make sure the "Signal Type" setting is set to "Traditional"
3. Import the GKD-B Baseline into the GKD-V indicator: "Input into Volatility/Volume or Backtest (Baseline testing)"
4. Inside the GKD-BT Backtest, change the setting "Backtest Special" to "Baseline + Volatility/Volume"
5. Import the GKD-V into the GKD-BT Backtest: "Input into C1 or Backtest"
6. Inside the GKD-BT Backtest, change the setting "Backtest Type" to "Full". For this backtest, you must test Longs and Shorts separately
7. To allow the system to open multiple orders at one time so you can test all Longs or Shorts, open the GKD-BT Backtest, click the tab "Properties" and then insert a value of something like 10 orders into the "Pyramiding" settings. This will allow 10 orders to be opened at one time which should be enough to catch all possible Longs or Shorts.
Requirements
Inputs
Chained: GKD-B Baseline
Solo: NA, no inputs
Baseline + Volatility/Volume: GKD-B Baseline
Outputs
Chained: GKD-C indicators Confirmation 1 or Solo Confirmation Complex
Solo: GKD-BT Backtest
Baseline + Volatility/Volume: GKD-BT Backtest
Additional features will be added in future releases.

Refracted EMA for trendThis script is an evolution of "Refracted EMA" by fract, that you can find here:
The differences are in the design and intended uses of its early and pretty reliable signals.
This is a trend indicator, with signals and alerts, usable on any timeframe.
Note: 3 color themes are included: Light, dark, and my personal dark one. Feel free to change them in the code, and to remove the ones you don't need.
HOW TO USE IT?
When it gives a signal (arrow), a horizontal line starts, and expands until there's a signal in the opposite direction.
As long as the price moves away from this line, then the move should logically be profitable
If the price ranges, or turns back in direction of the line, then it might be time to reconsider.
The background colors offer a complement of information:
- When the price moves away from the line, the bgcolor is normal.
- When there has been 2 candles in the opposite direction, then the bgcolor turns a little darker. It might be an early sign of range or reversal.
- When the current price breaks through the signal's closing price, the bgcolor turns gray or black (depending on the theme and colors you chose), signaling a significative divergence with the signal, and a possible reversal. It is common though, for the first candle after the signal to go in the opposite direction. It might be a good idea to wait at least 2 candles after the signal.
You can switch the alerts on, by right clicking the chart and clicking "add alert". Alerts happen only after the close of the candle. They display the timeframe they were added on.
TRICKS
- If up and down arrows alternate quickly, then the market is undecided, and it might not be a good idea to trade. Or maybe on other timeframes.
- Trading against the indicator's direction is probably not a good idea, unless there is a very VERY good reason for this (like buying the dip of an up trend, for ex).
- Looking at different timeframes quickly reveals the bigger picture of the price movements. For ex, if the 4h, 1h, 30 min are bullish, but the 5 min bearish, then there might be a long opportunity. But if the 5 min is bearish, and the 10 min turns bearish, and the 30 min turns bearish too, then there might be a reversal on its way.
- The line can be used as a reference to decide where to place your stop loss. It is rare that the price crosses this line, but it can absolutely happen. So use this idea with caution, manage and protect your positions wisely.
- You can, and probably should, use the alerts on different timeframes at the same time, to constantly update your understanding of the trend.
DO NOT BASE YOUR TRADING DECISIONS ON 1 SINGLE INDICATOR'S SIGNALS.
Always confirm your ideas by other means, like price action and indicators of a different nature.

Double Supertrend Entry with ADX Filter and ATR Exits/EntriesThe Double Supertrend Entry with ADX Filter and ATR Exits/Entries indicator is a custom trading strategy designed to help traders identify potential buy and sell signals in trending markets. This indicator combines the strengths of multiple technical analysis tools, enhancing the effectiveness of the overall strategy.
Key features:
Two Supertrend Indicators - The indicator includes two Supertrend indicators with customizable parameters. These trend-following indicators calculate upper and lower trendlines based on the ATR and price. Buy signals are generated when the price crosses above both trendlines, and sell signals are generated when the price crosses below both trendlines.
ADX Filter - The Average Directional Index (ADX) is used to filter out weak trends and only generate buy/sell signals when the market exhibits a strong trend. The ADX measures the strength of the trend, and a customizable threshold level ensures that trades are only entered during strong trends.
ATR-based Exits and Entries - The indicator uses the Average True Range (ATR) to set profit target and stop-loss levels. ATR is a measure of market volatility, and these levels help traders determine when to exit a trade to secure profit or minimize loss.
Performance Statistics Table - A table is displayed on the chart, recording and showing the total number of winning trades, losing trades, percentage of profitable trades, average profit, and average loss. This information helps traders evaluate the performance of the strategy over time.
The Double Supertrend Entry with ADX Filter and ATR Exits/Entries indicator is a powerful trend-following strategy that can assist traders in making more informed decisions in the financial markets. By combining multiple technical analysis tools and providing performance statistics, this indicator helps traders improve their trading strategy and evaluate its success.

Pivot Breaches by nnamdertWhat does this Indicator do?
This Pivot Point Line Breach Indicator is a simple yet powerful tool that automatically plots lines at the high and low pivot point levels and extends the lines forward to the most recent real-time bar. When the price breaches a line, the line stops at that breach point. The unbreached lines, however, continue on until they are eventually breached or the indictor reaches the maximum number of lines set by the user.
How is this Indicator helpful?
The pivot point lines plotted on the chart show areas where the price may eventually revert to. By knowing whether or not these lines have been breached, traders can easily identify potential entry points or support lines that are likely to be breached, especially when used with other indicators.
As shown in the screenshot below, some lines have been breached, while several others remain. Once the lines were breached, we could clearly see that the price moved quickly to the next level.
The indicator user inputs enable the plotting of up to 500 lines on the chart, if the user chooses to set the limit to 500. However, the default setting is currently set to a lower number, allowing traders to easily view the most recent unbreached pivot points.
The plotted lines are located at the close and high or low of the bar that generated the line. When there is a long wick, the two lines are plotted far from each other. A breach of both lines, particularly in the case of a long wick, indicates strong movement in the direction of the breach.
Thank you for using my indicator, and I hope it helps you make profitable trading decisions.

Spaghetti by RainbowLabsWhen I started trading, very few people gave me a hand or even a small piece of advice. One of them was @btc_charlie. From Charlie, I first saw the spaghetti chart, and he explained to me how it was useful in identifying which coin made the most sense to trade at a specific time.
In practice, it worked like this: in the "add" section, you add all the pairs you want and overlap them on the chart, creating the spaghetti chart. Although it worked, and still works, this way, I wondered if it would be better to write an indicator that does the same thing, maybe less invasive on the chart, that you can call as many times as you want and in different versions. In short, I tried to recreate the same thing but potentially better, let's see if I succeeded.
Introducing Spaghetti chart by RainbowLabs:
This indicator takes 20 different pairs as user input and works with any pair on any exchange provided the name is spelled correctly. In the settings, there are four columns: the first for the exchange, the second for the ticker, the third for the base pair, and lastly, the color. Again, it works with any pair on any exchange, but if you put something that does not exist or is misspelled, it will cause the script to error.
The second thing to do is to set when our spaghetti will be reset. By default, it resets every hour, but you can change it to any preferred timeframe in the menu, keeping in mind that we will write the timeframe in minutes, not alphanumeric. For example, 4h will not be four hours, but you will have to write 240.
In the settings, we can also change the position and size of the table.
How it works:
All pairs are reset when the timeframe defined by the user in the settings changes. The script then calculates the percentage difference from that moment onwards for each pair at the closing of the candle of the timeframe we are in. For example: by default, the timeframe resets every hour, so we will use it on one minute. It does not make sense on larger timeframes, and you will have to increase the reset timeframe.
How to use it:
Risk on\off BTC vs alts
As Charlie says in his tweet: "should I be risk on or off?" for SIX:ALTS rule might be ">70% of Alts recovering after a dip."
Identify a dip on bitcoin and compare what happens immediately after. If more than 70% of alts gain more than BTC, it may be better to remain positioned in alts. When the opposite happens, it is better to stay on BTC or stable.
Sell-off, Rally
During a significant sell-off or rally, it is important to analyze which coins were performing better or worse in the immediate past. It is statistically more profitable to trade those pairs that were over-performing, positively or negatively, just before the event.
Arbitrage and Triangular Arbitrage.
While it may be difficult to find large arbitrage opportunities in current market conditions, we can use tools to identify the best price of the same pair on multiple exchanges and compare it with one or multiple pairs on other exchanges. Having a comprehensive view of the market can be useful for anyone who is not using advanced trading bots to find arbitrage opportunities.
Quick Screener
You can add multiple spaghetti indicators to a single chart, and with the paid version of TradingView, you can use multiple layouts to plot as many coins on as many exchanges as you want. In the picture, you can see 240 pairs on four different exchanges all together. This feature allows you to quickly screen for potential trading opportunities and identify trends across multiple pairs and exchanges.
Known issues:
When the currency exchange rate is equal to 0.0000, the plotted line may not be visible.
