ema cross by himanshu and sunilCombined EMA & SuperTrend Indicator
The "Combined EMA & SuperTrend Indicator" is a powerful technical analysis tool designed to assist traders in identifying trends and potential entry/exit points in the markets. This indicator combines two popular indicators: Exponential Moving Averages (EMAs) and the SuperTrend indicator, providing a comprehensive view of market conditions.
Key Features:
EMA Visualization: The indicator plots both short-term and long-term Exponential Moving Averages (EMAs) on the chart. The EMAs help traders identify the underlying trend and potential reversals.
SuperTrend Indicator: The SuperTrend indicator is used to identify trends and potential stop-loss levels. The indicator adapts to changing market conditions by factoring in the Average True Range (ATR) and a user-defined factor.
Alerts: The indicator generates alerts for specific conditions, such as crossovers of the EMAs and SuperTrend direction changes. This helps traders stay informed about potential trading opportunities.
How to Use:
EMA Crossovers: Pay attention to the crossovers of the short-term and long-term EMAs. When the short-term EMA crosses above the long-term EMA, it may indicate a potential bullish trend. Conversely, when the short-term EMA crosses below the long-term EMA, it may suggest a bearish trend.
SuperTrend Direction: Watch the color of the SuperTrend line. A green line indicates an uptrend, while a red line suggests a downtrend. This can help you confirm the overall trend direction.
Alerts: Take advantage of the built-in alerts to receive notifications when significant events occur, such as EMA crossovers or SuperTrend direction changes. This can help you stay informed even when you're not actively monitoring the chart.
Usage:
Apply the "Combined EMA & SuperTrend Indicator" to any chart on TradingView to visualize the EMAs and SuperTrend lines.
Configure the EMA periods, ATR length, and SuperTrend factor according to your trading style and preferences.
Utilize the generated alerts to promptly react to potential trading opportunities.
Note: This indicator is intended for educational and informational purposes. Always perform thorough analysis and consider risk management practices before making trading decisions.
Disclaimer: This indicator does not guarantee profitable trades. Past performance is not indicative of future results. Trading involves risk, and you should only trade with funds you can afford to lose.
Pesquisar nos scripts por "profitable"

RVol LabelThis Code is update version of Code Provided by @ssbukam, Here is Link to his original Code and review the Description
Below is Original Description
1. When chart resolution is Daily or Intraday (D, 4H, 1H, 5min, etc), Relative Volume shows value based on DAILY. RVol is measured on daily basis to compare past N number of days.
2. When resolution is changed to Weekly or Monthly, then Relative Volume shows corresponding value. i.e. Weekly shows weekly relative volume of this week compared to past 'N' weeks. Likewise for Monthly. You would see change in label name. Like, Weekly chart shows W_RVol (Weekly Relative Volume). Likewise, Daily & Intraday shows D_RVol. Monthly shows M_RVol (Monthly Relative Volume).
3. Added a plot (by default hidden) for this specific reason: When you move the cursor to focus specific candle, then Indicator Value displays relative volume of that specific candle. This applies to Intraday as well. So if you're in 1HR chart and move the cursor to a specific candle, Indicator Value shows relative volume for that specific candlestick bar.
4. Updating the script so that text size and location can be customized.
Changes to Updated Label by me
1. Added Today's Volume to the Label
2. Added Total Average Volume to the Label
3. Comparison vs Both in Single Line and showing how much volume has traded vs the average volume for that time of the day
4. Aesthetic Look of the Label
How to Use Relative Volume for Trading
Using Relative Volume (RVol) in trading can be a valuable tool to help you identify potential trading opportunities and gain insight into market behavior. Here are some ways to use RVol in your trading strategy:
Identifying High-Volume Breakouts: RVol can help you spot potential breakouts when the volume surges significantly above its average. High RVol during a breakout suggests strong market interest, increasing the probability of a sustained move in the direction of the breakout.
Confirming Trends and Reversals: RVol can act as a confirmation tool for trends and reversals. A trend accompanied by rising RVol indicates a strong and sustainable move. Conversely, a trend with declining RVol might suggest a weakening trend or potential reversal.
Spotting Volume Divergence: When the price is moving in one direction, but RVol is declining or not confirming the move, it may indicate a divergence. This discrepancy could suggest a potential reversal or trend change.
Support and Resistance Confirmation: High RVol near key support or resistance levels can indicate potential price reactions at those levels. This confirmation can be valuable in determining whether a level is likely to hold or break.
Filtering Trade Signals: Incorporate RVol into your existing trading strategy as a filter. For example, you might consider taking trades only if RVol is above a certain threshold, ensuring that you focus on high-impact trading opportunities.
Avoiding Low-Volume Traps: Low RVol can indicate a lack of interest or participation in the market. In such situations, price movements may be erratic and less reliable, so it's often wise to avoid trading during low RVol periods.
Monitoring News Events: Around significant news events or earnings releases, RVol can help you gauge the market's reaction to the information. High RVol during such events can present trading opportunities but be cautious of increased volatility and potential gaps.
Adjusting Trade Size: During periods of extremely high RVol, it might be prudent to adjust your position size to account for higher risk.
Using Relative Volume in Morning Session
If the Volume traded in first 15 minute to 30 Minutes is already at 50% or 100% depending upon the ticker, it means that it is going to have very high Volume vs average by end of the day.
This gives me conviction for Long or Short Trades
Remember that RVol is not a standalone indicator; it works best when used in conjunction with other technical and fundamental analysis tools. Additionally, RVol's effectiveness may vary across different markets and trading strategies. Therefore, backtesting and validating the use of RVol in your trading approach is essential.
Lastly, risk management is crucial in trading. While RVol can provide valuable insights, it cannot guarantee profitable trades. Always use appropriate risk management strategies, such as setting stop-loss levels, and avoid overexposing yourself to the market based solely on RVol readings.

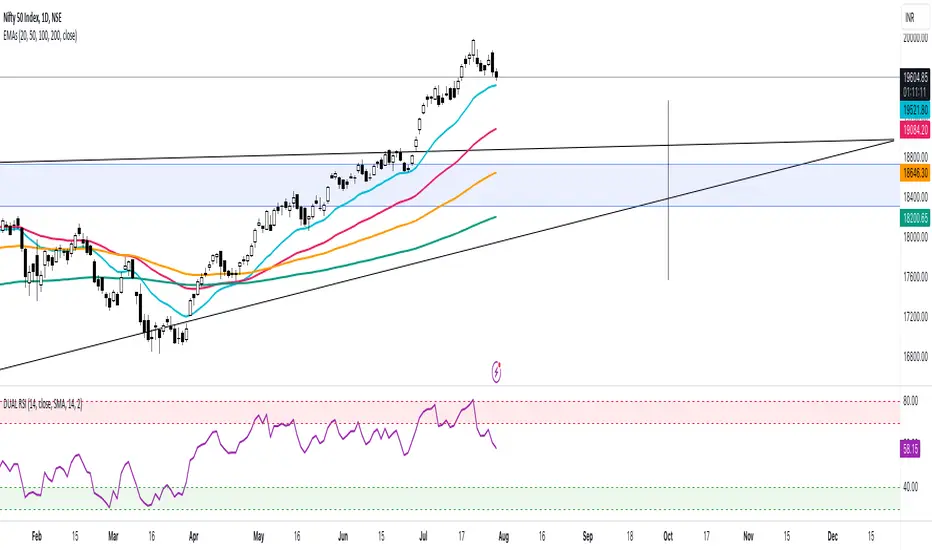
DUAL RSI MOHIT SHARMAWe are seeking a highly skilled and motivated DUAL RSI Analyst to join our dynamic team. As a DUAL RSI Analyst, you will be responsible for implementing and optimizing Relative Strength Index (RSI) strategies on a dual timeframe basis, combining both short-term and long-term perspectives to identify potential market trends and signals accurately. Your expertise in technical analysis, data analysis, and programming will be instrumental in generating actionable insights and driving profitable trading decisions. This position offers an exciting opportunity to work in the fast-paced world of financial markets and contribute to the success of our trading operations.
Responsibilities:
Strategy Development: Develop and implement innovative DUAL RSI trading strategies using historical data and backtesting methodologies to ensure robustness and profitability.
Market Analysis: Conduct in-depth analysis of financial markets, interpreting price patterns, momentum, and other technical indicators to identify potential trading opportunities.
Dual Timeframe Approach: Analyze markets using both short-term and long-term RSI indicators, integrating signals to generate comprehensive trading strategies.
Data Analysis: Collect, clean, and process market data from various sources, ensuring accuracy and completeness for thorough analysis.
Performance Monitoring: Continuously monitor and evaluate the performance of DUAL RSI strategies, making necessary adjustments to enhance their effectiveness.
Risk Management: Implement risk management protocols to control exposure and minimize potential losses in volatile market conditions.
Collaborative Approach: Work closely with the trading team, sharing insights and collaborating on the implementation of trading strategies.
Automation: Utilize programming languages (e.g., Python, R) to automate data analysis, strategy testing, and trade execution processes.
Stay Informed: Stay up-to-date with the latest developments in financial markets, trading technologies, and technical analysis tools.
Documentation: Maintain detailed documentation of trading strategies, backtesting results, and research findings.
Compliance: Ensure adherence to all relevant regulatory requirements and company policies.
Qualifications:
Education: Bachelor's degree in Finance, Economics, Mathematics, Computer Science, or a related field.
Experience: Proven experience in developing and implementing successful trading strategies using RSI indicators or similar technical analysis tools.
Analytical Skills: Strong analytical skills with the ability to process complex data sets and draw meaningful conclusions.
Programming Proficiency: Proficiency in programming languages such as Python, R, or MATLAB for data analysis and automation.
Financial Markets Knowledge: In-depth understanding of financial markets, trading principles, and risk management strategies.
Adaptability: Ability to adapt to changing market conditions and refine strategies accordingly.
Problem-Solving: A creative problem solver with a keen eye for detail.
Team Player: Strong team player with excellent communication and interpersonal skills.
Results-Driven: A self-motivated individual with a focus on achieving results.
Time Management: Effective time management skills to handle multiple tasks and meet deadlines.
Join our team and take your DUAL RSI expertise to new heights while contributing to our company's growth and success in the financial markets.
Supply And DemandThis supply and demand indicator uses sessions, volume spikes, higher timeframe price action and other volume calculations to spot areas on the chart where price will likely react. From the 1 minute and below charts to the daily and up charts, you can get excellent levels for any timeframe.
Why Use Supply And Demand?
One of the safest ways to trade is to wait for price to enter an area of interest where price should react. When we play reversals off of these areas, you increase the likelihood that your trade will be profitable because there was previous price action that told you that the current level is one where price will react. So we look for reversals at or very near these levels to enter into scalp or swing trade positions and look to exit that position when price is at or near the next major supply and demand level.
How To Use
The strategy with this indicator is to wait for price action to reach the levels shown by this supply and demand indicator and then enter trades at these levels, looking for a reversal. The thicker lines and the lines that are from the highest timeframes will be the most important levels on the chart. There is a table on the chart that will help you identify what timeframe the levels are using, with the color of that line next to it for easy identification.
The default settings are designed for scalping the 1-5 minute charts, so there are more levels turned on than necessary if you are using higher timeframes than 5 minutes. If you are using higher timeframes, make sure to turn off some of the lower timeframe levels so that it doesn’t clog up your charts. On the daily timeframe and above, many of the levels are coded to not turn on so that you don’t have to turn them off manually, but be aware that you will need to adjust your charts to suit your preferences, especially if you are on anything above the 5 minute chart.
For scalping, wait for price to react from the supply and demand levels by showing wicks, struggling to break through or getting reversal candles at those levels. Ride those moves to the next major supply and demand area before taking profit. You may want to turn on sessions and some of the lower timeframe levels as well if there are big gaps on the chart that are not suitable for scalping.
For swing trading, you will want to turn some of the lower timeframe and session levels off. Leave it to only higher timeframe OHLC lines and volume spike levels. Then you can swing moves that reverse off of the supply and demand lines.
Customization
This indicator is fully customizable. You can turn on or off any of the levels as well as increase the number specific levels so your charts suit your preferences.
All of the levels used are color coded individually so you can easily tell which type of level it is and these colors can be changed within the settings to suit your preferences. These colors are also reflected in the line identification table that show you exactly which color each type of level is.
There are toggles for the line identification table and session identification table as well if you don’t want them on your chart.
Types Of Levels Used
This indicator uses 4 different types of levels that I have found to be extremely influential on the price action. They are: volume spikes, higher timeframe price action, country based trading sessions and the VWAP. All of these levels have proven to be very important levels in my testing and are very helpful in spotting reversal areas.
Volume Spikes
This indicator is looking for the largest volume spikes and plotting the levels where that volume came in. It checks for the highest volume spikes across multiple different lengths of candles so that you get recent levels as well as the most important levels in the past. There are volume spike calculations for your current chart timeframe, 1 hour charts, 4 hour charts, daily charts, weekly charts, and monthly charts. Each of these looks for volume spikes across various lengths of candles for each timeframe and is color coded so you can identify which levels are which easily. The weekly and monthly volume spike levels are fatter than the normal volume spike levels with a line width of 2 to signify their importance.
OHLC Higher Timeframe Candles
This script plots levels of higher timeframe candles since price usually reacts very strongly to these levels. The levels it will produce are the high, low, open and close of the most recent closed candle of each higher timeframe. You can adjust these to show as many or as few previous HTF candles as you would like. The higher timeframe candles available to use are as follows: 1 hour, 4 hour, daily, 3 day, weekly, monthly, quarterly and yearly. The monthly, quarterly and yearly levels are fatter than the normal levels with a line width of 2 to signify their importance.
Trading Sessions
Trading sessions are very important levels because the market makers of different parts of the world are typically positioning themselves at these specific times. The number of each trading session line can be adjusted to show more or less levels depending on your preference. When you adjust the number, it will affect all lines that are enabled for that specific session. The levels available for each Tokyo, London & New York session are as follows: session premarket open, regular session open, session close, and session high & low. The session close boxes are fatter than the others with a line width of 2 to signify its importance.
VWAP & Previous Close
We all know that the VWAP aka Volume Weighted Average Price is a very important level on any chart, so we included this level as a default. However, we decided to take this a step further and include the previous daily session’s VWAP closing price and plot those levels. These are extremely important levels that you should pay very close attention to, along with the other levels mentioned above. The market makers are hedging their positions based on these levels and you will typically see very strong reactions to these levels, especially in the first hour when the markets open up. The VWAP and previous session VWAP close levels can be turned on or off and the default for the number of previous VWAP session close prices is set to 5. These levels are fatter lines because they are extremely important, so make sure to pay attention to them!
Line & Session Identification Tables
There are two tables to help you identify what is on the chart. The first is a large table in the top right that shows you the color and type of each line that is turned on so you can easily identify which lines are which. The second table is a small one at the bottom center of the chart that tells you which trading session we are currently in and what color that session is on the chart. These tables can be turned on or off and you can also change where they are on the chart by adjusting them at the bottom of the settings page.
Markets
This Supply And Demand indicator can be used on any market with price data such as stocks, crypto, forex and futures.
Timeframes
This Supply And Demand indicator can be used on any timeframe, from the second charts all the way up to the yearly charts.

TradeMaster SignalsTrading effectively requires a range of techniques, experience, and expertise. From technical analysis to market fundamentals, traders must navigate multiple factors, including market sentiment and economic conditions. However, traders often find themselves overwhelmed by market noise, making it challenging to filter out distractions and make informed decisions. To address this, we present a powerful indicator package designed to assist traders on their journey to success.
The TradeMaster indicator package encompasses a variety of trading strategies, including the SMC (Supply, Demand, and Price Action) approach, along with many other techniques. By leveraging concepts such as price action trading, support and resistance analysis, supply and demand dynamics, these indicators can empower traders to analyze entry and exit positions with precision. Unlike other forms of technical analysis that produce values or plots based on historical price data, Price Action brings you the facts straight from the source - the current price movements.
The indicator package consists of three powerful indicators that can be used individually or together to maximize trading effectiveness.
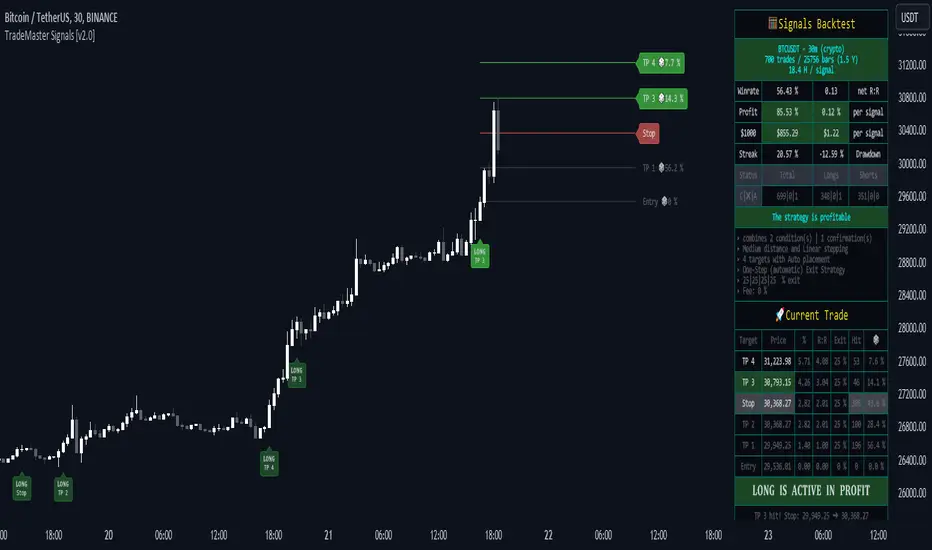
⭐ About the Signals Indicator
This indicator offers a unique opportunity for traders to design their own personalized trading strategy. It has a built-in backtesting system, which allows you to thoroughly analyze the performance of your strategy before implementing it in live trading. With the ability to customize and test your strategy using historical data, the Signals indicator empowers you to make data-driven decisions and refine your trading approach.
👉 How does it work?
The Signals indicator provides users with the ability to select trigger conditions and further narrow them down using confirmations.
Conditions are quantitative factors that influence the generation of signals on the chart and in the backtest table. You can enable multiple conditions to create a comprehensive set of criteria for signal generation.
Confirmations, on the other hand, are qualitative factors that selectively filter out conditions based on their alignment with the chosen confirmations. This helps refine the signals and provide more targeted trading opportunities. Multiple confirmations can be enabled to further enhance the precision of the signals.
A well-balanced strategy in the Signals indicator involves carefully selecting a combination of conditions and confirmations to generate accurate trading signals. Finding the right balance between them is crucial for consistent and profitable trading.
To offer even more flexibility, the Signals indicator includes two powerful main functions:
Target Placement System: This feature allows you to set up to 6 targets with a stop loss level and partial exit percentages. You can choose between automatic target creation or manual customization, giving you control over your profit targets.
Exit Strategy: With this feature, you can define your preferred trailing stop strategy, allowing you to implement a systematic approach to exiting trades. By setting appropriate trailing stop levels, you can limit potential losses, while the system secures profits by automatically closing positions partially when certain price targets are reached. This may help you to maintain discipline in your trading and optimize your risk-reward ratio.
With over 30 unique conditions, 10 confirmations, and the deep Target Placement and Exit Strategy systems, the Signals indicator offers a vast array of possibilities. In fact, there are potentially millions of different strategy outputs available for each ticker. Despite its complexity, the script remains lightweight and fast, ensuring smooth performance.
The Signals Backtest table provides a comprehensive overview of your strategy's performance. You can track your current position with all the necessary details, allowing you to monitor your trades effectively and make informed decisions based on the backtest results.
⚠️ WARNING!
Backtest results do not guarantee future performance. Strategies tested on synthetic data may not accurately represent real-world results. Testing should be conducted on charts that reflect actual closing prices.
The indicator displays buy/sell signals intended to support traders' analysis. There are numerous possibilities and combinations available to create your own unique strategies, whether trading with or against the trend or capturing oversold bounces. These are just a few of the many options! Our indicator can easily be tailored to fit your trading strategy.
The settings that influence the signal-generating algorithm play a crucial role in effectively utilizing the signals. We provide users with the flexibility to modify the settings to align with their trading style, while also offering simple adjustment methods using various techniques.
Each method for modifying the signal settings has been designed to meet specific user needs. It is important to understand that one method is not necessarily more accurate than another.
It is essential to understand that signal indications generally serve as trend confirmations, rather than direct entry and exit points. Focusing on the easy use of signal settings and utilizing other functionalities in our toolkit will likely be a better decision than attempting to find the "holy grail" of optimized signal settings and solely relying on following the signals.
⭐ Conclusion
We hold the view that the true path to success is the synergy between the trader and the tool, contrary to the common belief that the tool itself is the sole determinant of profitability. The actual scenario is more nuanced than such an oversimplification. Our aim is to offer useful features that meet the needs of the 21st century and that we actually use.
🛑 Risk Notice:
Everything provided by trademasterindicator – from scripts, tools, and articles to educational materials – is intended solely for educational and informational purposes. Past performance does not assure future returns.
Stocashi + CaffeineCrush Momentum Indicator by CoffeeShopCryptoThis is just a fun script to give a different representation to the ever popular Stochastic RSI
Even for me over the years the stochastic has been a difficult one to use in trading merely because of its choppy look.
Since Heikin-Ashi Candles do such a powerful job in smoothing out the look of choppy markets,
I decided to test it out on the look of the Stochastic RSI.
From an initial visual standpoint it worked out WAY better than I thought but it seemed to need something more.
I decided to use the PineScript "Color.From_Gradient" feature to give the Stochastic a more 3 dimensional look, which really brought the "old-school" indicator to life.
Description:
The CaffeineCrush Momentum Indicator is your ultimate trading companion, blending the invigorating world of coffee with the excitement of market momentum. Just like a finely brewed cup of joe,
This indicator provides you with a powerful insight into market dynamics, helping you stay in the trading groove.
As you sip on this caffeinated delight, CaffeineCrush monitors the velocity and strength of price movements,
measuring the momentum of the market. But here's where it gets even more enticing – it goes a step further by incorporating a pressure indication, adding a stimulating twist to your trading experience.
Imagine yourself in a bustling coffee shop, surrounded by the aroma of freshly roasted beans and the energetic buzz of conversations.
CaffeineCrush mimics that atmosphere, keeping you on your toes, always aware of market forces at play.
With CaffeineCrush, you'll never miss a beat. It identifies and highlights moments of heightened momentum and increased pressure,
giving you an edge in capturing profitable opportunities. Just like a perfectly extracted espresso shot, this indicator helps you maintain your trading momentum and navigate the market with confidence.
So, grab your favorite cup of joe, fire up your trading charts, and let CaffeineCrush awaken your trading prowess.
Stay in the groove, embrace the buzz, and master the momentum with this flavorful indicator by your side.
Divergence -
Regular Divergence shows when there is a conflict between the strength of the trend and the swing of the price movement.
Hidden Divergence -
Are to be traded using the same methods as hidden divergences of the MACD or the RSI. A hidden divergence is commonly a trend CONTINUATION move.
Pink Pause -
This shows a ranging area where price is taking a pause. It can be a single candle or a string of candles. But histogram with continue with its RED / GREEN colors once the pause is over.
Stocashi + CaffeineCrush is not an entry / exit indicator. It's designed to help you understand:
1. Weather your trend is continuing
2. When it pauses
3. Has your pullback started / ended
Its best used near area of conflict. For example:
1. If you have a breakout to the low side of support zone, and you get a BULLISH divergence, this can be viewed as a false breakout.
2. If you trading towards the opposite area of a range or key level and you get conflicting movement in the Stocashi + CaffeineCrush, then you should take ur profits and wait for the next move.
3. If you are following through with example 2 above, but get NO conflicts, you can immediately look for a secondary take profit area and split / hedge your take profits.

Bullish and Bearish Candlestick Patterns StrategyThe strategy is a combination of candlestick pattern analysis and Fibonacci retracement levels to identify potential buy and sell signals in the market. Here's how the strategy works and how you can trade accordingly:
Candlestick Pattern Analysis:
The strategy looks for specific bullish and bearish candlestick patterns to identify potential trend reversals or continuations. The bullish patterns include:
Bullish Engulfing: This pattern occurs when a bullish candle fully engulfs the previous bearish candle.
Hammer: It is a single candlestick pattern with a small body and a long lower wick, indicating a potential bullish reversal.
Morning Star: This pattern consists of three candles, with the middle one being a small-bodied candle that gaps down and the other two being bullish candles.
The bearish patterns include:
Bearish Engulfing: Similar to the bullish engulfing, but this time, a bearish candle fully engulfs the previous bullish candle.
Shooting Star: A single candlestick pattern with a small body and a long upper wick, suggesting a potential bearish reversal.
Evening Star: This pattern is the opposite of the morning star, with a small-bodied candle that gaps up between two bearish candles.
Fibonacci Retracement Levels:
The strategy uses Fibonacci retracement levels to determine potential support and resistance levels in the market. The main level considered in this strategy is the Fibonacci 0.5 level, which is the midpoint of the previous swing move.
Trading Accordingly:
To trade using this strategy, follow these steps:
a. Observe the Chart: Apply the indicator to your preferred chart, and observe the candlestick patterns and the plotted support, resistance, and Fibonacci 0.5 levels.
b. Buy Signal: A buy signal is generated when any of the bullish candlestick patterns (Bullish Engulfing, Hammer, Morning Star) occur, and the low price of the current candle is above or equal to the Fibonacci 0.5 level. This suggests a potential bullish reversal or continuation of an existing uptrend.
c. Sell Signal: A sell signal is generated when any of the bearish candlestick patterns (Bearish Engulfing, Shooting Star, Evening Star) occur, and the high price of the current candle is below or equal to the Fibonacci 0.5 level. This indicates a potential bearish reversal or continuation of an existing downtrend.
d. Risk Management: Place stop-loss orders to protect your position in case the market moves against your trade. Consider setting the stop-loss below the recent swing low for buy trades and above the recent swing high for sell trades.
e. Take Profit: Set a target for taking profits based on your risk-reward ratio. You can use the recent swing high for buy trades as a potential target and the recent swing low for sell trades.
f. Filter Signals: Keep in mind that not all signals will result in profitable trades. It's essential to filter signals with other technical analysis tools and consider the overall market context.
Remember that no trading strategy guarantees profits, and trading always carries inherent risks. It's crucial to practice proper risk management, use appropriate position sizing, and test the strategy thoroughly in a demo environment before applying it to live trading. Additionally, consider combining this strategy with other indicators or analysis methods to make more informed .

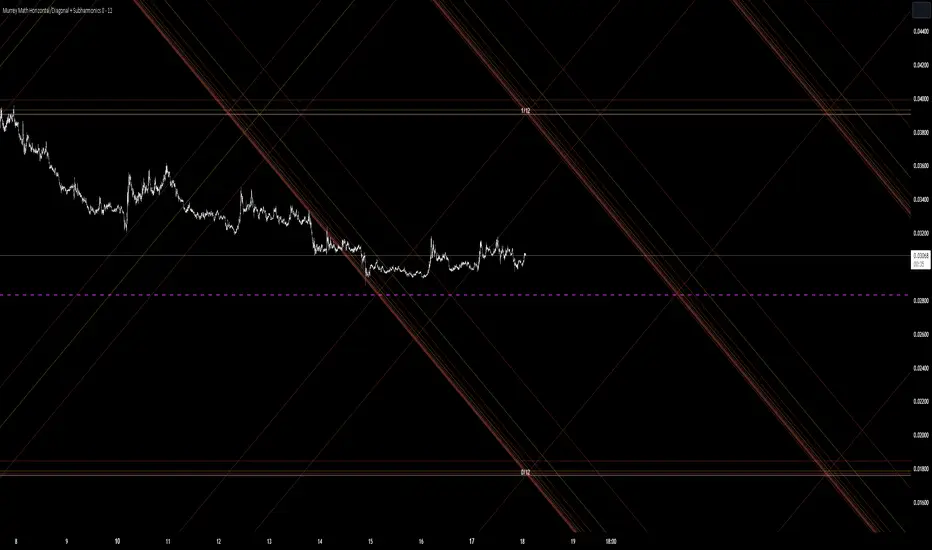
Murrey Math Horizontal/Diagonal + Subharmonics 0 - 12 [All-Time]The Murrey Math lines are created by dividing the range between the high and low of the monthly timeframe prices into equal parts based on the division factor from 2 to 12.
No matter which timeframe you will use, because the calculations based on the most high and low price values.
Better to use > monthly timeframe for faster calculations.
These lines serve as potential support and resistance levels.
The midlines are dashed lines representing the midpoint between two consecutive Murrey Math lines.
The diagonal lines can be enabled to show two different types or both types. These lines connect the highs or lows of the price bars in a diagonal manner.
The subharmonic lines represent smaller divisions within each Murrey Math range. They can be customized to show only strong subharmonics or all subharmonics. Subharmonics are calculated based on the division factor and can provide additional support and resistance levels within the Murrey Math framework.
This script helps visualize the Murrey Math levels and their associated lines on a trading chart, aiding traders in identifying potential price levels for decision-making.
The most strong levels which I tested were: 2, 4, 6, 8, 12.
I was inspired by Gann's work and i tried to implement this indicator.
It's the most accurate version of Murrey Math calculations, you can set the value of 8 which Gann was used but I did up to 12 because of my experiments and I would recommend you to use the value of 12.
This indicator can be used for all types of markets.
Also note, that the strong levels described above is tested on division by 12 setting.
Anyway, you can use the divison of 8 and use the standart strong s/r levels.
(for more information search for Gann 2.0 support resistance on the internet).
Also note: this information is not a financial advice, just my opinion to the indicator I implemented. Please use this indicator wisely and focus to save your money, not earn.
I wish you profitable trades, stick to your risk/money management and the key entry points!
Variety Step RSI w/ Dynamic Zones [Loxx]Variety Step RSI w/ Dynamic Zones is a stepped RSI calculation with Discontinued Signal Lines. This indicator includes 7 types of RSI to choose from. The addition of the Discontinued Signal Lines allows this indicator to better identify momentum shifts in price so traders have better defined long/short signals.
Enhanced Moving Average Calculation with Stepped Moving Average and the Advantages over Regular RSI
Technical analysis plays a crucial role in understanding and predicting market trends. One popular indicator used by traders and analysts is the Relative Strength Index (RSI). However, an enhanced approach called Stepped Moving Average, in combination with the Slow RSI function, offers several advantages over regular RSI calculations.
█ Stepped Moving Average and Moving Averages:
The Stepped Moving Average function serves as a crucial component in the calculation of moving averages. Moving averages smooth out price data over a specific period to identify trends and potential trading signals. By employing the Stepped Moving Average function, traders can enhance the accuracy of moving averages and make more informed decisions.
Stepped Moving Average takes two parameters:
The current RSI value and a size parameter. It computes the next step in the moving average calculation by determining the upper and lower bounds of the moving average range. It accomplishes this by adjusting the values of smax and smin based on the given RSI and size.
Furthermore, Stepped Moving Average introduces the concept of a trend variable. By comparing the previous trend value with the current RSI and the previous upper and lower bounds, it updates the trend accordingly. This feature enables traders to identify potential shifts in market sentiment and make timely adjustments to their trading strategies.
█ Advantages over Regular RSI:
Enhanced Range Boundaries:
The inclusion of size parameters in Stepped Moving Average allows for more precise determination of the upper and lower bounds of the moving average range. This feature provides traders with a clearer understanding of the potential price levels that can influence market behavior. Consequently, it aids in setting more effective entry and exit points for trades.
Improved Trend Identification:
The trend variable in Stepped Moving Average helps traders identify changes in market trends more accurately. By considering the previous trend value and comparing it to the current RSI and previous bounds, Stepped Moving Average captures trend reversals with greater precision. This capability empowers traders to respond swiftly to market shifts and potentially capture more profitable trading opportunities.
Smoother Moving Averages:
Stepped Moving Average's ability to adjust the moving average range bounds based on trend changes and size parameters results in smoother moving averages. Regular RSI calculations may produce jagged or erratic results due to abrupt market movements. Stepped Moving Average mitigates this issue by dynamically adapting the range boundaries, thereby providing traders with more reliable and consistent moving average signals.
Complementary Functionality with Slow RSI:
Stepped Moving Average and Slow RSI function in harmony to provide a comprehensive trading analysis toolkit. While Stepped Moving Average refines the moving average calculation process, Slow RSI offers a more accurate representation of market strength. The combination of these two functions facilitates a deeper understanding of market dynamics and assists traders in making better-informed decisions.
What is a Discontinued Signal Line (DSL)?
Many indicators employ signal lines to more easily identify trends or desired states of the indicator. The concept of a signal line is straightforward: by comparing a value to its smoothed, slightly lagging state, one can determine the current momentum or state.
The Discontinued Signal Line builds on this fundamental idea by extending it: rather than having a single signal line, multiple lines are used based on the indicator's current value.
The "signal" line is calculated as follows:
When a specific level is crossed in the desired direction, the EMA of that value is calculated for the intended signal line.
When that level is crossed in the opposite direction, the previous "signal" line value is "inherited," becoming a sort of level.
This approach combines signal lines and levels, aiming to integrate the advantages of both methods.
In essence, DSL enhances the signal line concept by inheriting the previous signal line's value and converting it into a level.
Extras
-Alerts
-Signals
Related indicators:
Step RSI

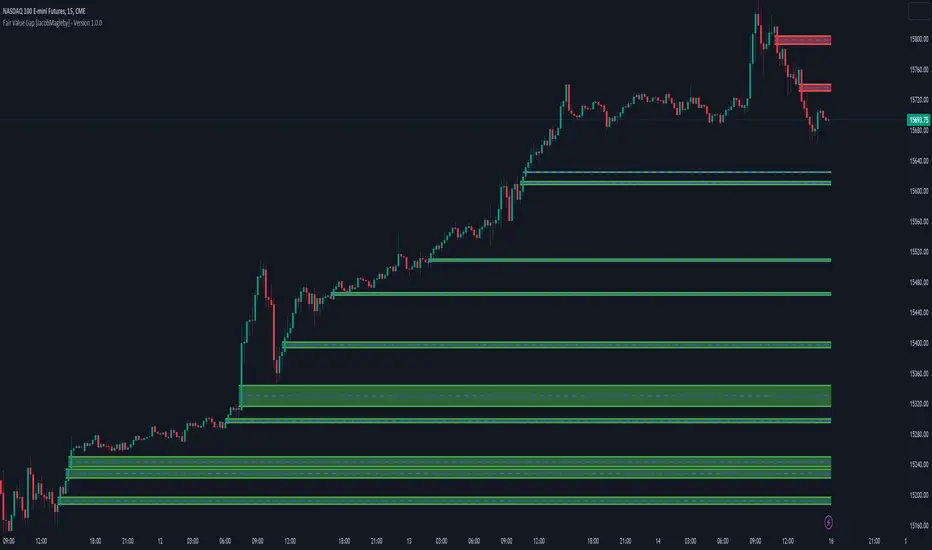
Fair Value Gap [MyTradingCoder]Introducing the "Fair Value Gap" indicator, a powerful tool designed to identify and visualize areas of potential market gaps where leftover orders may reside. This indicator utilizes price action analysis, specifically focusing on fair value gaps that occur between the current candle and the candle two bars prior.
The Fair Value Gap indicator draws customizable zones on the chart, representing bullish or bearish areas with distinct green or red colors. These zones highlight market gaps where price action has left a void, indicating the possibility of significant order activity in that region.
Key Features:
Liquidity Zone: Utilize the Fair Value Gap zones as areas of liquidity, offering potential entry points for trades.
Support/Resistance Indicator: Configure the indicator to extend beyond the initial breakout or gap fill, allowing it to act as a support/resistance zone indicator.
The Fair Value Gap indicator has several adjustable settings to customize its behavior according to your trading preferences. These settings include:
Invalidation Outcome: Choose how the fair value gap zone is treated when it becomes invalidated. Options include:
-Stop Updating: Maintain the gap zone in its current state without further updates.
-Delete: Completely remove the fair value gap from the screen.
Invalidation Method: Determine the logic that invalidates the fair value gap. Options include:
-Gap Fill: Visually shrink the zone as price action closes the gap until it is completely filled, at which point it gets deleted entirely.
-Number Of Breakouts: Invalidate the gap after a certain number of breaks or flips over the zone's border. Configure the allowed number of breakouts with the "Breakouts Until Invalidation" input.
-Age Of Gap: Invalidate the gap after a specified number of bars have passed since its creation. Set the threshold with the "Bars Until Invalidation" input.
Color Customization: Customize the appearance of the fair value gap zones with various color inputs, including bullish and bearish border colors, middle line color (shared for both bullish and bearish gaps), bullish and bearish background colors.
Line Width: Adjust the width of the border lines and the center line within the fair value gap zone for better visual clarity.
Please note that the Fair Value Gap indicator is a valuable tool but should be used alongside other technical analysis methods to make well-informed trading decisions. It does not guarantee profitable trades but aims to provide insights into potential areas of interest.
Discover opportunities within market gaps and leverage the power of leftover orders with the Fair Value Gap indicator—an indispensable asset in your trading toolkit.
Multi-Band Breakout IndicatorThe Multi-Band Breakout Indicator was created to help identify potential breakout opportunities in the market. It combines multiple bands (ATR-Based and Donchian) and moving averages to provide valuable insights into the underlying trend and potential breakouts. By understanding the calculations, interpretation, parameter adjustments, potential applications, and limitations of the indicator, traders can effectively incorporate it into their trading strategy.
Calculation:
The indicator utilizes several calculations to plot the bands and moving averages. The length parameter determines the period used for the Average True Range (ATR), which measures volatility. A higher length captures a longer-term view of price movement, while a lower length focuses on shorter-term volatility. The multiplier parameter adjusts the distance of the upper and lower bands from the ATR. A higher multiplier expands the bands, accommodating greater price volatility, while a lower multiplier tightens the bands, reflecting lower volatility. The MA Length parameter determines the period for the moving averages used to calculate the trend and trend moving average. A higher MA Length creates a smoother trend line, filtering out shorter-term fluctuations, while a lower MA Length provides a more sensitive trend line.
The Donchian calculations in the Multi-Band Breakout Indicator play a significant role in identifying potential breakout opportunities and providing additional confirmation for trading signals. In this indicator, the Donchian calculations are applied to the trend line, which represents the average of the upper and lower bands. To calculate the Donchian levels, the indicator uses the Donchian Length parameter, which determines the period over which the highest high and lowest low are calculated. A longer Donchian Length captures a broader price range, while a shorter length focuses on more recent price action. By incorporating the Donchian calculations into the Multi-Band Breakout Indicator, traders gain an additional layer of confirmation for breakout signals.
Interpretation:
The Multi-Band Breakout Indicator offers valuable interpretation for traders. The upper and lower bands represent dynamic levels of resistance and support, respectively. These bands reflect the potential price range within which the asset is expected to trade. The trend line is the average of these bands and provides a central reference point for the overall trend. When the price moves above the upper band, it suggests a potential overbought condition and a higher probability of a pullback. Conversely, when the price falls below the lower band, it indicates a potential oversold condition and an increased likelihood of a bounce. The trend moving average further smooths the trend line, making it easier to identify the prevailing direction.
The crossover of the trend line (representing the average of the upper and lower bands) and the trend moving average holds a significant benefit for traders. This crossover serves as a powerful signal for potential trend changes and breakout opportunities in the market. When the trend line crosses above the trend moving average, it suggests a shift in momentum towards the upside, indicating a potential bullish trend. This provides traders with an early indication of a possible upward movement in prices. Conversely, when the trend line crosses below the trend moving average, it indicates a shift in momentum towards the downside, signaling a potential bearish trend. This crossover acts as an early warning for potential downward price movement. By identifying these crossovers, traders can capture the initial stages of a new trend, enabling them to enter trades at favorable entry points and potentially maximize their profit potential.
Breakout Signals:
For bullish breakouts, the indicator looks for a bullish crossover between the trend line and the trend moving average. This crossover suggests a shift in momentum towards the upside. Additionally, it checks if the current price has broken above the upper band and the previous Donchian high. This confirms that the price is surpassing a previous resistance level, indicating further upward movement.
For bearish breakouts, the indicator looks for a bearish crossunder between the trend line and the trend moving average. This crossunder indicates a shift in momentum towards the downside. It also checks if the current price has broken below the lower band and the previous Donchian low. This confirms that the price is breaking through a previous support level, signaling potential downward movement.
When a bullish or bearish breakout is detected, it suggests a potential trading opportunity. Traders may consider initiating positions in the direction of the breakout, anticipating further price movement in that direction. However, it's important to remember that breakouts alone do not guarantee a successful trade. Other factors, such as market conditions, volume, and confirmation from additional indicators, should be taken into account. Risk management techniques should also be implemented to manage potential losses.
Coloration:
The coloration in the Multi-Band Breakout Indicator is used to visually represent different aspects of the indicator and provide valuable insights to traders. Let's break down the coloration components:
-- Trend/Basis Color : The tColor variable determines the color of the bars based on the relationship between the trend line (trend) and the closing price (close), as well as the relationship between the trend line and the trend moving average (trendMA). If the trend line is above the closing price and the trend moving average is also above the closing price, the bars are colored fuchsia, indicating a potential bullish trend. If the trend line is below the closing price and the trend moving average is also below the closing price, the bars are colored lime, indicating a potential bearish trend. If neither of these conditions is met, the bars are colored yellow, representing a neutral or indecisive market condition.
-- Moving Average Color : The maColor variable determines the color of the filled area between the trend line and the trend moving average. If the trend line is above the trend moving average, the area is filled with a lime color with 70% opacity, indicating a potential bullish trend. Conversely, if the trend line is below the trend moving average, the area is filled with a fuchsia color with 70% opacity, indicating a potential bearish trend. This coloration helps traders visually identify the relationship between the trend line and the trend moving average.
-- highColor and lowColor : The highColor and lowColor variables determine the colors of the high Donchian band (hhigh) and the low Donchian band (llow), respectively. These bands represent dynamic levels of resistance and support. If the highest point in the previous Donchian period (hhigh) is above the upper band, the highColor is set to olive with 90% opacity, indicating a potential resistance level. On the other hand, if the lowest point in the previous Donchian period (llow) is below the lower band, the lowColor is set to red with 90% opacity, suggesting a potential support level. These colorations help traders quickly identify important price levels and assess their significance in relation to the bands.
By incorporating coloration, the Multi-Band Breakout Indicator provides visual cues to traders, making it easier to interpret the relationships between various components and assisting in identifying potential trend changes and breakout opportunities. Traders can use these color cues to quickly assess the prevailing market conditions and make informed trading decisions.
Adjusting Parameters:
The Multi-Band Breakout Indicator offers flexibility through parameter adjustments. Traders can customize the indicator based on their preferences and trading style. The length parameter controls the sensitivity to price changes, with higher values capturing longer-term trends, while lower values focus on shorter-term price movements. By adjusting the parameters, such as the ATR length, multiplier, Donchian length, and MA length, traders can customize the indicator to suit different timeframes and trading strategies. For shorter timeframes, smaller values for these parameters may be more suitable, while longer timeframes may require larger values.
Potential Applications:
The Multi-Band Breakout Indicator can be applied in various trading strategies. It helps identify potential breakout opportunities, allowing traders to enter trades in the direction of the breakout. Traders can use the indicator to initiate trades when the price moves above the upper band or below the lower band, confirming a potential breakout and providing a signal to enter a trade. Additionally, the indicator can be combined with other technical analysis tools, such as support and resistance levels, candlestick patterns, or trend indicators, to increase the probability of successful trades. By incorporating the Multi-Band Breakout Indicator into their trading approach, traders can gain a better understanding of market trends and capture potential profit opportunities.
Limitations:
While the Multi-Band Breakout Indicator is a useful tool, it has some limitations that traders should consider. The indicator performs best in trending markets where price movements are relatively strong and sustained. During ranging or choppy market conditions, the indicator may generate false signals, leading to potential losses. It is crucial to use the indicator in conjunction with other analysis techniques and risk management strategies to enhance its effectiveness. Additionally, traders should consider external factors such as market news, economic events, and overall market sentiment when interpreting the signals generated by the indicator.
By combining multiple bands and moving averages, this indicator offers valuable insights into the underlying trend and helps traders make informed trading decisions. With customization options and careful interpretation, this indicator can be a valuable addition to any trader's toolkit, assisting in identifying potential breakouts, capturing profitable trades, and enhancing overall trading performance.

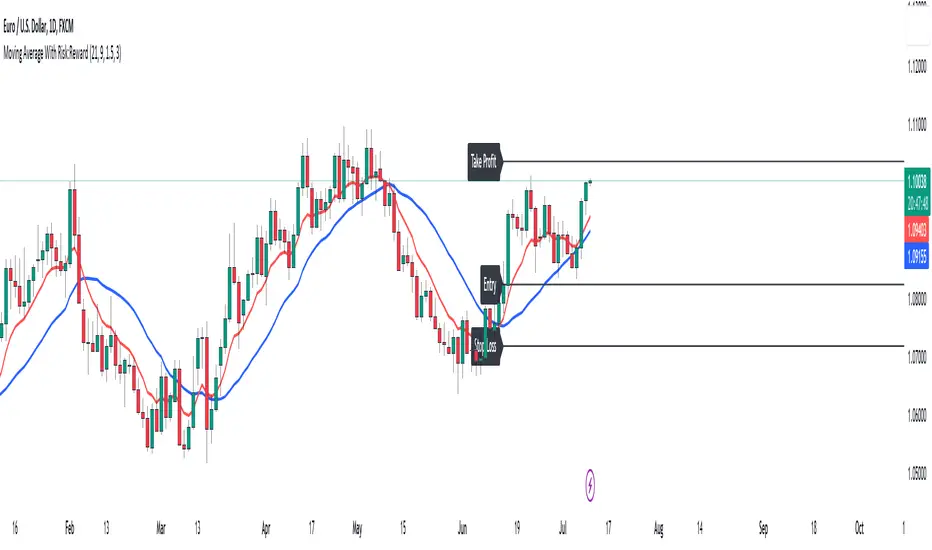
Moving Average With Risk:Reward**Title: A Detailed Guide to Using the Moving Average With Risk:Reward Indicator**
The dynamic world of financial markets offers a myriad of opportunities for market participants to make profitable trades. However, to unlock these opportunities, traders require reliable tools to guide their decisions, tools such as technical indicators. One such indicator is the 'Moving Average With Risk:Reward' Indicator, a versatile tool that combines the simple moving average (SMA), exponential moving average (EMA), Average True Range (ATR) indicator, and automated entry, stop-loss, and take-profit markers to provide a comprehensive analysis of market trends. This article aims to detail the use and interpretation of this indicator.
**Understanding the Building Blocks**
1. **Moving Averages (SMA & EMA):**
Moving averages are arguably some of the most common tools used by traders worldwide. They help smooth out price data to form a trend following indicator. Our custom indicator utilizes both a 21-period SMA, which averages the closing prices of the past 21 periods, and a 9-period EMA, which gives more weight to recent prices. The difference in sensitivity between these two moving averages forms the basis of our trade signals.
2. **Average True Range (ATR):**
The ATR is an essential component of our indicator. It measures market volatility by decomposing the entire range of an asset price for that period. It plays a critical role in determining the stop loss and take profit levels in our indicator, as detailed later.
**How the Indicator Works**
Our custom indicator works by generating buy or sell signals based on crossover and crossunder events between the SMA and EMA. A crossover occurs when the EMA (more sensitive to recent prices) crosses above the SMA, indicating upward momentum and hence triggering a buy signal. Conversely, a crossunder, where the EMA moves below the SMA, indicates increasing downward momentum and generates a sell signal.
Upon the generation of a signal, the indicator draws lines on the chart to represent the entry point, stop loss, and take profit levels. The user has the freedom to adjust the color of these lines for visual clarity. The script will also delete previous lines whenever a new signal is generated to avoid clutter and confusion.
**Determining the Stop Loss and Take Profit Levels**
Our custom indicator uses the ATR and a predetermined multiplier to calculate stop loss and take profit levels, thus incorporating market volatility into these critical decisions. The user can input their preferred multiplier for both stop loss and take profit.
Stop Loss (SL): SL is set at a level that is the ATR value multiplied by the stop-loss multiplier subtracted from (for a long position) or added to (for a short position) the closing price.
Take Profit (TP): Conversely, TP is set at a level that is the ATR value multiplied by the take-profit multiplier added to (for a long position) or subtracted from (for a short position) the closing price.
These SL and TP levels get plotted as horizontal lines on the chart, extending to the right. Labels are also placed to easily identify these levels.
**Making the Most of the Indicator**
A significant advantage of this indicator lies in its simplicity and clarity. Traders can clearly see the entry point, stop loss, and take profit levels on the chart. They can modify these levels based on their risk tolerance or trading strategy.
The combination of SMA and EMA offers the best of both worlds, with SMA providing a lagging, stable trend indication and EMA offering a more responsive indication to recent price changes. The indicator's use of ATR for SL and TP settings also ensures that these levels adapt to changing market volatility.
It is essential to remember that while this indicator can be an invaluable tool in a trader's arsenal, it is not infallible. Markets can often behave unpredictably, and even the most robust and reliable indicators can occasionally generate false signals. Therefore, traders should always employ sound money management strategies and use this indicator in conjunction with other technical analysis tools and fundamental analysis to confirm signals and make informed trading decisions.
In conclusion, the Moving Average With Risk:Reward indicator provides a comprehensive and versatile tool that can significantly enhance trading strategies. Its integration of trend-following moving averages, volatility-adjusted stop loss and take profit levels, and clear chart visualizations make it a potent tool in the financial markets. By fully understanding how to interpret and utilize this indicator, traders can navigate the markets with increased confidence and precision.
Apeiron Fair Value BandsThe Apeiron Fair Value Bands take into account a given MA and determine a Fair Value Area (FVA) for the price of a certain asset. The script plots a MA and a tolerance ribbon for it, as well as 2 bands (preset to 1 Standard deviations and 2 Standard deviations respectively, which can be manually changed) with a tolerance ribbon as well.
This creates 3 areas of interest:
The MA ribbon
The inside of the first upper and lower band (1 standard deviation) where price should stay within around 68% percent of the time according to the normal distribution
The inside of the second upper and lower band (2 standard deviations) where price should stay within around 95% percent of the time according to the normal distribution
Taking this into account, Fair Value analysis can be done:
Premium and Discount Prices: From a very simplistic point of view, when price is below a MA it can be considered to be at a discount and when it is above at a premium. Combining that idea with the levels given by the bands, we can determine if we are buying at premium or at a discount, specially on HTF and when considering investing, thus allowing to enter or exit the market with a higher probability of being on the right side of the trend and at a good level. As seen on the example, buying or selling at the highlighted levels would have been profitable with little drawdown.
VAH & VAL: (1 Standard Deviation Bands) Same as a Market Profile, price will stay in here "most" of the time. And particularly during ranging periods, they will provide potential revesal levels. As well, once prices breaks out of it, depending of the reaction to the second band, we can consider it a deviation or the beggining of a new trend. During strong trends, the bands can also serve as a correction support as the MA would do
New Fair Vaue Range: Once a new trend has begun, it will often slide on or break through Band 2, which can be interpreted as price creating a new Fair Value Range low or high. As seen on the chart, once price breaks out, those levels tend to be respected and relevant during corrections. I must make it very clear that this is just an analytical feature meant to be used in confluence with S/R, Supply & Demand, FVGs, Fibs or others. While it can be accurate sometimes, it might not be other times and be only "close".
Exhaustions: I call exhaustions to the scenarios when price keeps going up/down but it fails to keep pushing the fair value area with it. This indicates weakness in the trend and a potential reversal or correction. These appear on all Timeframes and symbols and are very good indications of tops and bottoms, specially after strong rallies or crashes. In the latter cases, waiting for price to re-enter it's FVA, provides great entries at the Bands levels.
Other features / Suggested Uses:
Middle levels: On the setup menu you can select different Standard deviation settings for each band including: 0.5, 1, 1.5, 2, 2.5 and 3. While the most relevant settings are 1 & 2, having their middle levels on the chart can provide extra levels for very tight ranges or just in general potential reversal levels.
Multi Timeframe & Multi symbol: The bands work on very low TF as well as High TF, though on HTF it might be limited by the MA length settings and the historical data of the symbol. It is important to note that each symbol and market type will have its own ideal MA and Bands settings.
Multi Bands Confluence: Same as you would use a short and long MA in a single setup, you can do the same with the bands and the confluence of levels can be very accurate.
Multi Timeframe Confluence: One of the best ways to use the bands so far is by using it in confluence with itself in other TFs, when price moves sharply into a confluent level given by multiple TFs, it is more likely for price to reverse there.
Most of the examples show a 200 SMA, but depending on what and how you are trading a shorter or longer MA might be a better fit for you. As well, if you are trading ranges, a VWMA might be much better, and if you are following a trend the EMA could be the better option.
I also want to make it clear that the bands can but are NOT meant to be a standalone indicator. They are meant to be used for confluence with other strategies, systems or indicators.
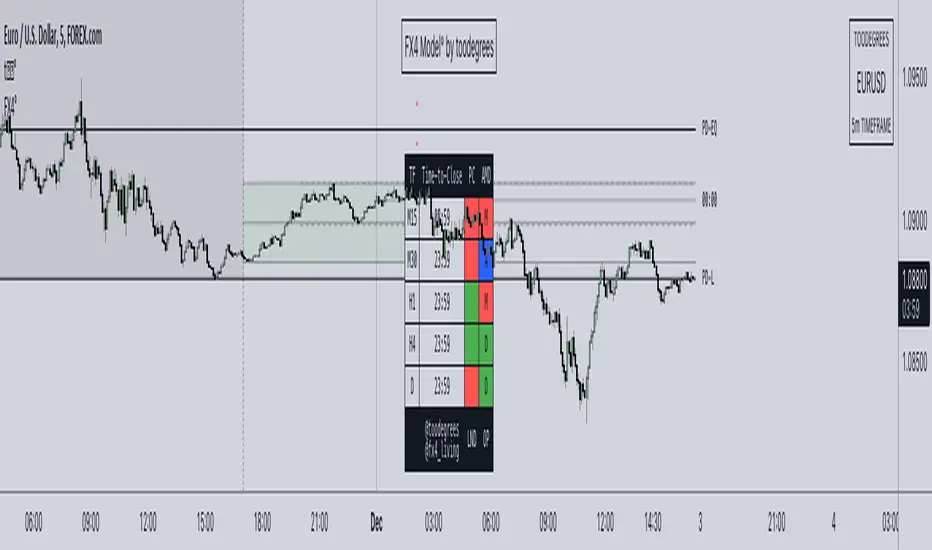
FX4Model° [fx4_living x toodegrees]Introducing the FX4 Model, an advanced automated trading framework designed to optimize your trading positions made by the trader fx4_living. This model integrates the previous day's high and low, and half of that range, to identify premium and discount zones.
The FX4 Model incorporates the ICT Asian range, spanning from 20:00 (New York time) to the midnight open. This period constitutes part of the day's accumulation range, during which a large volume of orders is processed. This implies that the high and low of this range are perceived as crucial liquidity pool zones.
The FX4 Model features a time-based dashboard. This dashboard presents key information such as the close of the previous candle. It also indicates the remaining time before certain significant candle closes (price and time).
With this tool, you gain a robust trading framework that empowers you to capitalize on profitable trading opportunities.
The FX4 accumulation range spans from the previous day's close to 2 AM New York local time. This range is part of the day's accumulation period, during which a lot of orders are triggered. Therefore, the high and the low of this range are seen as vital liquidity pool zones.
The ICT midnight open is marked with a vertical line at 00:00. This refers to the opening price of a financial instrument at midnight New York time. This opening price is significant as it serves as a reference point for trading strategies.
Time-To-Close Dashboard
This outstanding Dashboard displays the Time Frame and its "Time-To-Close".
It shows the Previous Candle Close (Bullish or Bearish).
The Time will appear in Red when there's 5 minutes left before the candle closes.
Previous Day Range (High-Low + 50%)
The previous day's high and low (PD) ranges can be leveraged in your trading strategy for the current day, using them as reference points for potential trading opportunities. The 50% division creates premium and discount zones within the previous day's range. If the price is in the discount zone, you should look for a buy opportunity, whereas if the price is in the premium zone, a sell opportunity should be considered.
FX4 Accumulation Range (High-Low + 50%)
The accumulation range's high and low points provide the most recent liquidity zone for the current day. These points can be used as reference points for potential trading opportunities. The 50% division here also creates premium and discount zones within the accumulation range. If the price is in the discount zone, a buy opportunity should be considered, and if the price is in the premium zone, a sell opportunity should be considered.
Other features:
Automatic Time Zone: As the title suggests, the automatic time zone feature means that you'll never need to adjust any GMT or hour settings. Everything updates automatically, even if you don't live on the East Coast of the United States.
Automatic Dark/Light Mode All graphics will automatically adapt their color based on your background. There's no need to tweak any settings; they're designed to provide consistent visuals.
Developing Market Profile / TPO [Honestcowboy]The Developing Market Profile Indicator aims to broaden the horizon of Market Profile / TPO research and trading. While standard Market Profiles aim is to show where PRICE is in relation to TIME on a previous session (usually a day). Developing Market Profile will change bar by bar and display PRICE in relation to TIME for a user specified number of past bars.
What is a market profile?
"Market Profile is an intra-day charting technique (price vertical, time/activity horizontal) devised by J. Peter Steidlmayer. Steidlmayer was seeking a way to determine and to evaluate market value as it developed in the day time frame. The concept was to display price on a vertical axis against time on the horizontal, and the ensuing graphic generally is a bell shape--fatter at the middle prices, with activity trailing off and volume diminished at the extreme higher and lower prices."
For education on market profiles I recommend you search the net and study some profitable traders who use it.
Key Differences
Does not have a value area but distinguishes each column in relation to the biggest column in percentage terms.
Updates bar by bar
Does not take sessions into account
Shows historical values for each bar
While there is an entire education system build around Market Profiles they usually focus on a daily profile and in some cases how the value area develops during the day (there are indicators showing the developing value area).
The idea of trading based on a developing value area is what inspired me to build the Developing Market Profile.
🟦 CALCULATION
Think of this Developing Market Profile the same way as you would think of a moving average. On each bar it will lookback 200 bars (or as user specified) and calculate a Market Profile from those bars (range).
🔹Market Profile gets calculated using these steps:
Get the highest high and lowest low of the price range.
Separate that range into user specified amount of price zones (all spaced evenly)
Loop through the ranges bars and on each bar check in which price zones price was, then add +1 to the zones price was in (we do this using the OccurenceArray)
After it looped through all bars in the range it will draw columns for each price zone (using boxes) and make them as wide as the OccurenceArray dictates in number of bars
🔹Coloring each column:
The script will find the biggest column in the Profile and use that as a reference for all other columns. It will then decide for each column individually how big it is in % compared to the biggest column. It will use that percentage to decide which color to give it, top 20% will be red, top 40% purple, top 60% blue, top 80% green and all the rest yellow. The user is able to adjust these numbers for further customisation.
The historical display of the profiles uses plotchar() and will not only use the color of the column at that time but the % rating will also decide transparancy for further detail when analysing how the profiles developed over time. Each of those historical profiles is calculated using its own 200 past bars. This makes the script very heavy and that is why it includes optimisation settings, more info below.
🟦 USAGE
My general idea of the markets is that they are ever changing and that in studying that changing behaviour a good trader is able to distinguish new behaviour from old behaviour and adapt his approach before losing traders "weak hands" do.
A Market Profile can visually show a trader what kind of market environment we currently are in. In training this visual feedback helps traders remember past market environments and how the market behaved during these times.
Use the history shown using plotchars in colors to get an idea of how the Market Profile looked at each bar of the chart.
This history will help in studying how price moves at different stages of the Market Profile development.
I'm in no way an expert in trading Market Profiles so take this information with a grain of salt. Below an idea of how I would trade using this indicator:
🟦 SETTINGS
🔹MARKET PROFILING
Lookback: The amount of bars the Market Profile will look in the past to calculate where price has been the most in that range
Resolution: This is the amount of columns the Market Profile will have. These columns are calculated using the highest and lowest point price has been for the lookback period
Resolution is limited to a maximum of 32 because of pinescript plotting limits (64). Each plotchar() because of using variable colors takes up 2 of these slots
🔹VISUAL SETTINGS
Profile Distance From Chart: The amount of bars the market profile will be offset from the current bar
Border width (MP): The line thickness of the Market Profile column borders
Character: This is the character the history will use to show past profiles, default is a square.
Color theme: You can pick 5 colors from biggest column of the Profile to smallest column of the profile.
Numbers: these are for % to decide column color. So on default top 20% will be red, top 40% purple... Always use these in descending order
Show Market Profile: This setting will enable/disable the current Market Profile (columns on right side of current bar)
Show Profile History: This setting will enable/disable the Profile History which are the colored characters you see on each bar
🔹OPTIMISATION AND DEBUGGING
Calculate from here: The Market Profile will only start to calculate bar by bar from this point. Setting is needed to optimise loading time and quite frankly without it the script would probably exceed tradingview loading time limits.
Min Size: This setting is there to avoid visual bugs in the script. Scaling the chart there can be issues where the Market Profile extends all the way to 0. To avoid this use a minimum size bigger than the bugged bottom box

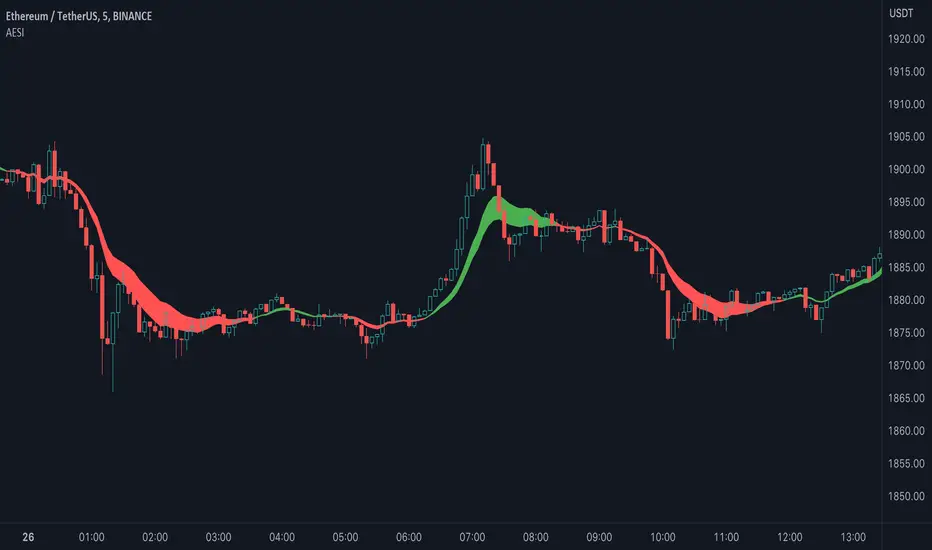
Advanced Exponential Smoothing Indicator (AESI) [AstrideUnicorn]The Advanced Exponential Smoothing Indicator (AESI) provides a smoothed representation of price data using the exponential smoothing technique. It helps traders identify the overall trend and potential reversal points in the market.
SETTINGS
Length: The number of periods used for the calculation of the exponential moving average (EMA). Higher values provide a smoother result but may lag behind price movements.
Alpha: The smoothing factor that determines the weight of the recent price data in the smoothing calculation. Higher values give more weight to recent data, resulting in a more responsive indicator.
Cloud Mode: Determines whether to display a cloud between the AESI line and the EMA line. When enabled, the cloud represents bullish (green) and bearish (red) market conditions.
HOW TO USE
The AESI indicator consists of a single line that represents the advanced exponential smoothing of the price data. It aims to provide a smoother version of the price series, reducing noise and revealing the underlying trend.
Bullish Condition: When the AESI line is above the EMA line, it indicates a bullish market condition. Traders may consider looking for buying opportunities or holding onto existing long positions.
Bearish Condition: When the AESI line is below the EMA line, it suggests a bearish market condition. Traders may consider looking for selling opportunities or holding onto existing short positions.
Optional Cloud Mode:
Enabling the cloud mode allows you to visualize bullish and bearish market conditions more clearly. The cloud appears between the AESI line and the EMA line, providing a visual representation of the prevailing market sentiment.
Bullish Cloud: When the AESI line is above the EMA line, the cloud is green, indicating a potential bullish market condition.
Bearish Cloud: When the AESI line is below the EMA line, the cloud is red, indicating a potential bearish market condition.
Note: The AESI indicator is most effective when used in conjunction with other technical analysis tools and indicators to confirm trading signals and make informed trading decisions.
Adjusting the Parameters:
You can adjust the Length and Alpha parameters to find the best ones for different timeframes and market conditions. Experimenting with different parameter values can help you find the optimal settings for your trading strategy.
It is recommended to backtest the AESI indicator on historical price data and evaluate its performance before using it in live trading. Remember that no indicator can guarantee profitable trades, and it is important to use risk management techniques and exercise caution when making trading decisions.
FalconRed 5 EMA Indicator (Powerofstocks)Improved version:
This indicator is based on Subhashish Pani's "Power of Stocks" 5 EMA Strategy, which aims to identify potential buying and selling opportunities in the market. The indicator plots the 5 EMA (Exponential Moving Average) and generates Buy/Sell signals with corresponding Target and Stoploss levels.
Subhashish Pani's 5 EMA Strategy is a straightforward approach. For intraday trading, a 5-minute timeframe is recommended for selling. In this strategy, you can choose to sell futures, sell calls, or buy puts as part of your selling strategy. The goal is to capture market tops by selling at the peak, anticipating a reversal for profitable trades. Although this strategy may result in frequent stop losses, they are typically small, while the minimum target should be at least three times the risk taken. By staying aligned with the trend, significant profits can be achieved. Subhashish Pani claims that this strategy has a 60% success rate.
Strategy for Selling (Short Future/Call/Stock or Buy Put):
1. When a candle completely closes above the 5 EMA (with no part of the candle touching the 5 EMA), it is considered an Alert Candle.
2. If the next candle is also entirely above the 5 EMA and does not break the low of the previous Alert Candle, ignore the previous Alert Candle and consider the new candle as the new Alert Candle.
3. Continue shifting the Alert Candle in this manner. However, when the next candle breaks the low of the Alert Candle, take a short trade (e.g., short futures, calls, stocks, or buy puts).
4. Set the stop loss above the high of the Alert Candle, and the minimum target should be 1:3 (at least three times the stop loss).
Strategy for Buying (Buy Future/Call/Stock or Sell Put):
1. When a candle completely closes below the 5 EMA (with no part of the candle touching the 5 EMA), it is considered an Alert Candle.
2. If the next candle is also entirely below the 5 EMA and does not break the high of the previous Alert Candle, ignore the previous Alert Candle and consider the new candle as the new Alert Candle.
3. Continue shifting the Alert Candle in this manner. However, when the next candle breaks the high of the Alert Candle, take a long trade (e.g., buy futures, calls, stocks, or sell puts).
4. Set the stop loss below the low of the Alert Candle, and the minimum target should be 1:3 (at least three times the stop loss).
Buy/Sell with Additional Conditions:
An additional condition is added to the buying/selling strategy:
1. Check if the closing price of the current candle is lower than the closing price of the Alert Candle for selling, or higher than the closing price of the Alert Candle for buying.
- This condition aims to filter out false moves, potentially preventing entering trades based on temporary fluctuations. However, it may cause you to miss out on significant moves, as you will enter trades after the candle closes, rather than at the breakout point.
Note: According to Subhashish Pani, the recommended timeframe for intraday buying is 15 minutes. However, this strategy can also be applied to positional/swing trading. If used on a monthly timeframe, it can be beneficial for long-term investing as well. The rules remain the same for all types of trades and timeframes.
If you need a deeper understanding of this strategy, you can search for "Subhashish Pani's (Power of Stocks) 5 EMA Strategy" on YouTube for further explanations.
Note: This strategy is not limited to intraday trading and can be applied to positional/swing
QFL Screener [ ZCrypto ]The QFL Screener is a robust tool inspired by Quickfingersluc's trading strategy.
Known as the Base Strategy or Mean Reversals, QFL focuses on identifying moments of panic selling and buying , presenting opportunities to enter trades at deeply discounted prices.
The QFL Screener is designed to enhance your trading efficiency by simultaneously scanning 40 symbols.
You have the flexibility to enable or disable specific symbols from the screening process, allowing you to tailor the screener to your preferred markets and instruments.
The Screener has a built-in alerts system . As soon as the QFL conditions align for any of the scanned symbols, you'll receive instant notifications, empowering you to take prompt action and seize potential trading opportunities.
In addition, I've incorporated a visual element to complement the alerts. Once the conditions are true, a green arrow shape will appear directly on the chart, providing a clear and intuitive signal of the QFL opportunity.
To provide a clear overview, our screener presents a comprehensive table that highlights when the QFL condition becomes true for each symbol. This table acts as a visual guide, enabling you to monitor the status of multiple symbols at a glance, streamlining your trading decision-making process.
With the QFL Screener, you gain an edge in identifying profitable trade setups based on Quickfingersluc's renowned approach. Experience the convenience of simultaneous screening, real-time alerts, and an intuitive table display, all in one user-friendly tool.

Dodge Trend [MyTradingCoder]Introducing the "Dodge Trend" indicator, an innovative variant of the Supertrend indicator designed to help traders better avoid fakeouts and maintain positions in established trends.
Like the Supertrend, the Dodge Trend uses Average True Range (ATR) but incorporates a unique adaptive adjustment feature that differentiates it from its counterparts. While the conventional Supertrend rises with the trend and only descends when the price crosses it, the Dodge Trend is designed to 'dodge' potential fakeouts.
This 'dodging' mechanism works by allowing the Dodge Trend to fall slightly during pullbacks, reducing the risk of a premature exit due to a temporary price drop. The recovery rate after the pullback is quicker but is slightly lower than the rate at which a new Dodge Trend high would be established in an uptrend. This unique adjustment feature allows the Dodge Trend to chase price action in an exponential fashion, potentially enabling a quicker exit when the trend shifts.
Key Settings:
Length: Adjust how much price action is taken into consideration for the ATR average. Lower values yield higher responsiveness to recent price action.
Size: Determines the initial deviation of the Dodge Trend when it resets after every flip/break.
Source: Specifies the data point (close, high, open, low, hl2, etc.) used for the Dodge Trend.
Dodge Intensity: Adjusts the intensity of the pullback effect. Higher values result in more intense pullbacks. Range is limited between 0 and 99, with 95 as the recommended default.
Bullish Color Setting: Sets the color for the uptrend Dodge Trend.
Bearish Color Setting: Sets the color for the downtrend Dodge Trend.
Dodge Trend is a powerful tool for traders looking to ride trends and avoid unnecessary exits due to short-term price fluctuations. While it offers a unique feature that may potentially improve trading outcomes, it should be used in conjunction with other indicators and analysis methods for a comprehensive trading strategy. As with all tools, it does not guarantee profitable trades but aims to give traders more actionable and precise information to base their decisions on.
Experience trend-following in a more adaptive and efficient manner with the Dodge Trend indicator, a tool designed to help you 'dodge' false exits and stay in line with the overall trend.

ASG Delta %This utility script provides a convenient way to calculate the percentage gain or drop of a token's price within a user-defined date range. It eliminates the need for manual measurement on individual charts, saving time and effort.
The script is particularly valuable when integrated into a daily token scanning routine for watchlists. By comparing the significant gains or drops among different tokens, traders can identify potential trading opportunities.
Simply select the desired date range, and the script will identify the highest and lowest price points achieved during that period. It then shows a visual representation in the form of a bullish or bearish box, displaying the percentage change (delta %). If the current price falls within the box's upper and lower bounds, additional percentage information can be shown in either the 'normal' or 'reverse' mode.
For instance, if a token experiences a -52.35% drop, enabling the 'Reverse' setting will reveal a potential 109.86% gain (from the low), or a 76.02% gain (from current price) or a potential drop of -16.5% (from current price) etc.. Having these basic statistics available, without having to manually chart them, especially during prolonged bear or bull markets, enables traders to make informed decisions and position themselves for more profitable trades.
I hope you find this script valuable. Your comments and recommendations are welcome as they will help improve the script's functionality further.
*ATR Levels*This script is an enhanced version of "Saty's ATR Levels". With the help of SimpleCryptoLife, he reimagined the script to include these differences:
-view the ATR levels easily with labels and know where the price action is in relation to a specific level
-the included "price follow line" extends across the screen and through the ATR levels label to allow you to easily identify which level you're in or about to enter either on an upswing or downswing
- a +/- 4 and 5 ATR level created that can be turned on for those crazy runners, occasionally a stock will run >5 ATR if you're lucky
Select levels are standard when firing up the indicator but you can click on the appropriate levels to suit your needs and save it from there.
There are several modes to choose from >> Day, Multiday, Swing, Position and Long-Term - Try them out and see what works best for your trading style. For instance:
-Day mode is great for, you guessed it, day trades whether long or shot and ideally paired with 1h or less timeframes
-Multiday is similar to Swing mode and is great for trades less than a week and generally paired with 30m to 1 day timeframe
-Swing mode is great for 1-3 week trades and can be used on higher timeframe such as 30m to 1 day
-Position & long term are of course for longer term trades and ideally paired with 4 hour to 1 month timeframes
ATR length of 14 is standard (look up "Wilder's 14")
Trend indicator based off of the 9-21-34 EMAs // - Range against ATR for each period // - Put and call trigger levels table was created by Saty, located in upper right
Generally, once a candle hits the 23.6% level, look to "go long" but be sure to wait for confluences that support your strategy. Maybe you can wait till the 38.2 level or even higher, dependent on your risk tolerance (stop loss recommended). A candle could come back and retest a certain level that you're eyeing and then continue upwards. As each level is hit, the greater the chance to hit 1 ATR (or higher!). You can start to scale out of a trade at any level but any of the main ATR levels like +1, +2 and so on would be ideal places to take some profit. Keep in mind that a stock can make a run in the pre-market and once the opening bell hits the stock might already be above the +1 ATR level or higher. Conversely the aforementioned is true for stocks to short. The -23.6% level would a "trigger" level but you can use -38.2 etc
Regarding the "use current close" check box: if you're in after or pre-market hours, the ATR levels will remain from the previous day so you'll want to check this box to see what the new levels will be for the current day. But you'll want to uncheck it and leave it unchecked throughout the trading day.
If you find this indicator invaluable and it helps you become a more consistent and profitable trader, feel free to give it a boost and leave a comment if you so desire. As always, trade at your own risk and never use more money than you afford to lose.

ATR Test (hakimnadir)TrendMaster Pro is a powerful trend-following indicator designed to assist traders in identifying and capitalizing on market trends. By combining two key components, Short-Term Trend 2 (ST2) and Short-Term Trend 3 (ST3), this indicator provides reliable entry signals and helps traders stay aligned with the prevailing market trend. With its user-friendly interface and customizable settings, TrendMaster Pro offers a comprehensive solution for traders seeking to enhance their trend trading strategies.
Key Features:
Short-Term Trend 2 (ST2):
Short-Term Trend 2 (ST2) serves as the primary entry signal for TrendMaster Pro. It is designed to identify short-term reversals within the market, providing traders with opportunities to enter trades at favorable prices. ST2 utilizes a combination of price action analysis, moving averages, and volatility indicators to generate accurate entry signals. When a bullish ST2 signal is generated, it indicates a potential buying opportunity, while a bearish signal suggests a potential selling opportunity.
Short-Term Trend 3 (ST3):
Short-Term Trend 3 (ST3) is the backbone of TrendMaster Pro, helping traders stay in alignment with the prevailing trend. ST3 focuses on the longer-term trend and acts as a confirmation filter for trades initiated based on ST2 signals. By considering the relationship between price, moving averages, and other trend indicators, ST3 helps traders filter out false signals and avoid trades against the dominant market trend. When ST3 confirms an ST2 signal, it strengthens the validity of the trade setup, increasing the probability of a successful trade.
Customizable Parameters:
TrendMaster Pro offers a range of customizable parameters, allowing traders to adapt the indicator to suit their trading preferences and timeframes. Users can adjust the sensitivity of ST2 and ST3 signals, enabling them to fine-tune the indicator based on their desired level of aggressiveness or conservatism. Additionally, traders can customize the color scheme and visual appearance of the indicator to enhance its visibility and integration with their charting setup.
Alert System:
To ensure traders never miss a potential trading opportunity, TrendMaster Pro includes a comprehensive alert system. Traders can set up audio or visual alerts to be notified when an ST2 signal is generated or when ST3 confirms an ST2 signal. This feature allows traders to stay informed even when they are not actively monitoring the charts, enabling them to capitalize on timely trade setups.
Multi-Timeframe Analysis:
TrendMaster Pro supports multi-timeframe analysis, enabling traders to incorporate higher timeframes for additional confirmation. By aligning the signals across multiple timeframes, traders can enhance the accuracy and reliability of their trades. This feature is particularly useful for swing traders and position traders who rely on higher timeframe analysis to capture significant trends.
Conclusion:
TrendMaster Pro is a comprehensive trend-following indicator that combines the power of Short-Term Trend 2 (ST2) and Short-Term Trend 3 (ST3) to generate reliable entry signals and help traders stay aligned with the prevailing market trend. With its customizable parameters, alert system, and support for multi-timeframe analysis, TrendMaster Pro offers traders a versatile tool to enhance their trend trading strategies. Whether you are a beginner or an experienced trader, TrendMaster Pro can serve as a valuable addition to your trading toolkit, helping you identify profitable trading opportunities in trending markets.

*Zig Zag Price, % Change w/RSI*With immense help from ©SimpleCryptoLife who reimagined this script for me, and to ©mmoiwgg and ©ocaptain who's ideas led to this updated version 5.
This indicator is fairly straight-forward and visually appealing because you get a running zig zag price, price % change with an added bonus - RSI. However you won't find zig zag lines but the script reacts the same by changing the inputs. The higher the value the less data points you'll see on the screen.
The main objective of this indicator is to be able to spot high and low prices easily with the price % change between the same 2 data sets. Additionally and arguably more importantly, with the RSI values associated with the high and low prices, you can spot divergences easily - meaning the price is making a higher high while conversely the RSI value at the next pop (around the same price as previous high) is lower which can mean that momentum has exhausted for the time being and a reversal could be imminent.
This script is meant only as a tool to try to enrich your trading journey and I hope it helps you become a more consistent and profitable trader. If you find it invaluable drop a like and comment. Good luck!
