ComboTrade V.2.1 (BuySell Signals,Take profit,4MA,Fibo,Ichi+QL)A WORD WITH ESTEEMED TRADERS:
The type of indicator that a trader uses to create a strategy depends on the type of strategy he intends to employ; this is related to the trading style and the trader's loss tolerance.
A trader looking for a long-term trade with high profits may adopt a follow-up strategy, and on the other hand, a trader who decides to make short-term trades with frequent but low profits may be eager to use a strategy based on price fluctuations. Different types of indicators can be used to confirm the results.
Indicators alone should not be used as a tool to make trading decisions. Instead, every trader should use indicators to receive trading signals and formulate trading strategies and determine his or her exact method.
Brief and essential description:
With the above description, traders are advised to use the ComboTrade indicator as a trading assistant. Using the tools embedded in this trading assistant makes it easy for traders and depending on the trading strategy, you can get the best result for positioning.
Note 1: The trading time frame for ComboTrade with over one hour (1H) will achieve best result. Checking out the lower time frame to buy or sell as a confirmation is recommended.
Note 2: At Trading View home screen choose “ Candles or ...” as “Bar’s Style”.
Once you added ComboTrade into to your chart, go to the setting gear of the ComboTrade indicator, which includes two sections: “Input” and “Style”.
The “Input” section is for the input values of the indicators and the “Style” section is for activating and deactivating the tools.
Activate Moving Average 7, 21, 50 and 200 with close (Default)
Activate Combo Cloud by tick the “Show ichimoku” if you use it (Default)
By activating ichimoku, three components will be added to the Como Cloud with below details:
1- The “Quality Line” shows the quality line (26 Kijun-sen future candlesticks) which helps the trader to understand the direction of the trend and will help the trader to make a decision.
2. The “Period Line” shows the 103-day period and can act as a support and resistance tool. In addition, this number can be changed.
3- The intersection of various Como cloud lines has also been installed.
The TP (Take Profit) signal indicates a similar buy or sell area using the RSI and Stochastic oscillators, and be sure to pay special attention to it. Be sure to tick the related box (TP) at “Style” section.
The “Trailing Stop” at “Style” section acts as a support and resistance line. It acts as a support when the price candle is placed above the Trailing Stop line and as a resistance if the price candle is placed below the Trailing Stop line.
At “Bot Key Value” in “Input” section, the number is adjustable from 0.25 to any number. According to the trader's strategy, the number of input and output signals in this section can be adjusted. The best number for BTC is 0.78 and for Altcoins is 0.78 to 1.
At “Bot ATR Period” in “Input” section, the best default number is 8. The best values for Altcoins is 8 to 10, which has a significant effect on the regulation of signaling and support and authority lines.
The “Bot Buy” and “Bot Sell” at “Style” section are the main and most important parts of the indicator that you must tick in order to active them both.
“Plot Background” can activate the Como Cloud and set it to green (ascending) and red (descending).
The “Labels” and “Lines” are related to the important Fibonacci tool, which by displaying the lines of the Fibonacci lines and by activating the label, the numbers related to the price and the Fibonacci numbers are displayed. It helps traders to extract data from the last few days.
DISCLAIMER:
ALL DECISIONS AND RISK MANAGEMENT, ETC. ARE THE FULL RESPONSIBILITY OF THE TRADER AND THE AUTHOR IS NOT RESPONSIBLE FOR THE POSITIONS AND THE RESULTS OF THE TRADES (POSSIBLE LOSSES) IN ANY WAYS. DO YOUR OWN RESEARCH (DYOR) BEFORE ENTERING/ EXISTING IN TO/ FROM ANY POSITIONS.
Please like and use your comments after using the indicator.
Always be Profitable!
JebraTrade
14 April 2021
Pesquisar nos scripts por "profit"

OH2B Take Profit IndicatorOH2B Trading Indicator
The Take-Profit Indicator gives you exit points for taking profits based on the Average Directional Index and Relative Strength Index.
It also gives you possible swing-high and swing-low in a trend .
The OH2B Trading Indicator is an indicator that gives you entry points for BUY and SELL based on Trend Channel and Ema-Crossover.
Both indicators work better in tandem with the best result.
Trading with Both Indicators
Orange Zone : Wait for the next signal from OH2B Trading Indicator.
The OH2B Trading Indicator gives you entry points for BUY or SELL .
When the ema1 crosses above ema2, the trend channel will be painted GREEN in color, and a BUY signal will appear. = BUY
When the ema1 crosses below ema2, the trend channel will be painted RED in color, and a SELL signal will appear. = SELL
When a BUY or SELL signal appears on the chart, don't rush into any trade.
Please allow a few hours for confirmation of signals .
To take profit, please follow the Take-Profit Indicator at the bottom.
RED dots are the Take-Profit targets for the BUY (long) signal
GREEN dots are the Take-Profit targets for the SELL (short) signal
*After taking profit, please set a Stoploss to at least break-even level to protect your profits.
When the price enters the Orange Zone again, you may close your trade and wait for the next signal.
If you like to keep your positions at Orange Zone, please remember to set a stop-loss alert when an opposite signal pops up on the chart.
Often the price goes to the Trendline after the signal, so keep some funds to increase the position or even open all position near the Trendline , or use it for re-enter with SL after you closed position on TPs.

Open Close Profit - [Alerts]This script comes with the following indicators and features:
Moving Average trend filter (Hull, ZLEMA, McGinley)
Pin Bar Filter
MACD indicator
Pump and Dump filter
Entry, Take Profit, and Stop Loss Alerts
And a few more indicators in the back-end to increase accuracy, optimize entries and filter out sideways PA
This script works really well as a scalper on lower Time Frames as well as on higher Time Frames. Besides that you can also use it on pretty much any coin or asset.
This script is not repainting. We advise to use alerts on “Once Per Bar Close”.
If you’d like to automate this script you can do that by using AutoView, ProfitView, ProfitTrailer, CryptoHopper etc.
Leave a message if you’d like to try it out.

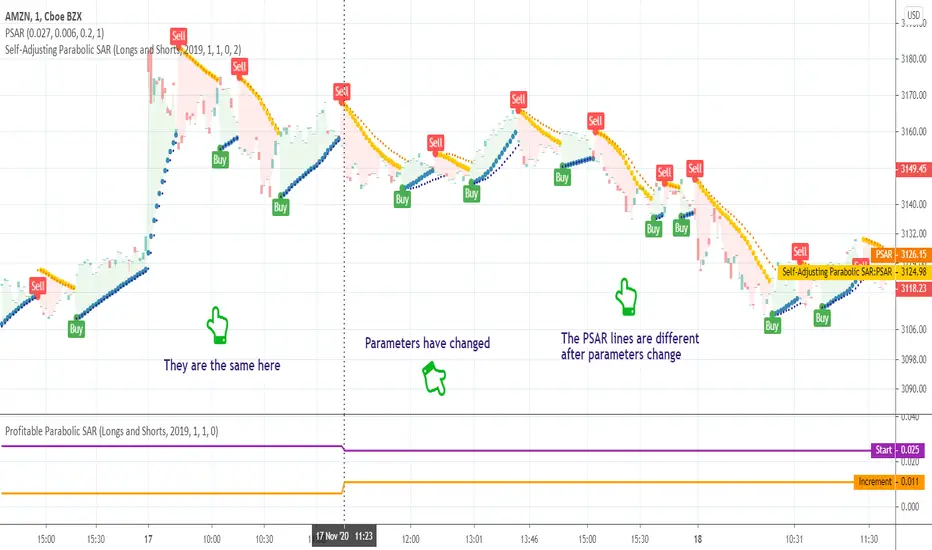
Self-Adjusting Parabolic SARWhat is this tool?
This is an implementation of the well-known Parabolic SAR indicator that can adjust parameters on the fly to achieve a better profitability.
The algorithm was borrowed from Profitable Parabolic SAR and connected to the basic Parabolic SAR implementation. So, now it will switch parameters automatically without any manual work required.
Profitable Parabolic SAR indicator can be found here:
Parabolic SAR indicator can be found here:
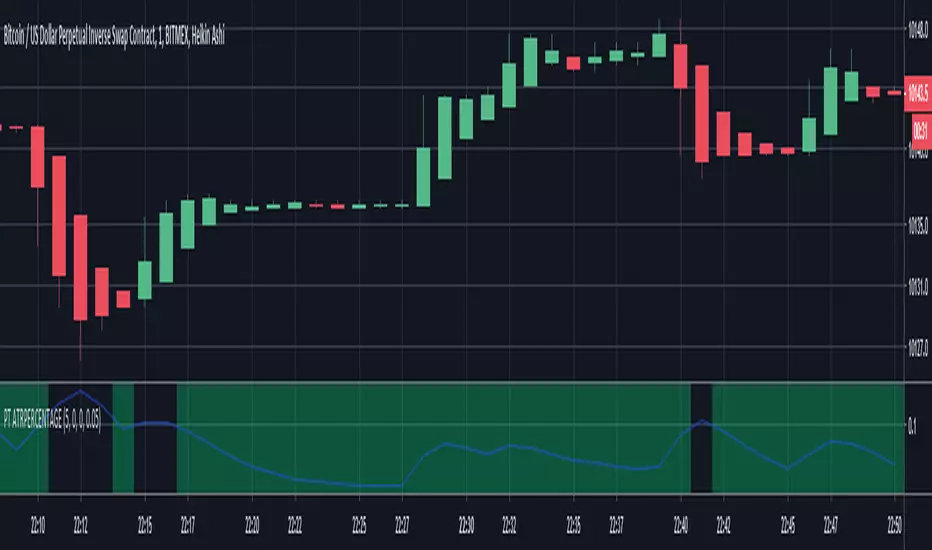
PT ATRPERCENTAGEI'M JUST AN AMATEUR SO USE AT YOUR OWN RISK.
Couldn't find a script for the ATRPERCENTAGE indicator for ProfitTrailer, so I made one.
I believe it is working correctly from what the wiki says, but again, use at your own risk.
Ichimoku Cloud Trend Long AlertsFantastic trading system allowing for high probability trading.
I prefer to use lesser timeframes, like in this example, for lower probability per trade but higher % profits over time. On some timeframes probability can be between 70-100%.
Settings for cryptocurrency:
Conversion: 20
Base: 60
Span B: 120
Displacement: 30
Enjoy!
TIP: I've noticed that when a new coin launches after IEO this script can work on small timeframes (15m) and with the Base and Span settings halved. This usually gives good results if ran for approx. five days from launch. Particularly with Huobi and Binance launches.

CryptoScalper: NightMODE by BiO-618Hey guys!
It's me with a new version of the script.
Since a lot of people wanted to use it for scalping, I adjusted it for that.
More buy signals, more sell signals, 90% accuracy (at least ;) )
Remember to use the pivots to set Take Profits and Stop Losses, no software is 100% accurate, otherwise the market would trash it.
SELL SIGNALS
Red "S": Sell signal
Yellow "Sell": Strong+ sell signal
Orange "SELL": Strong++ sell signal. Shortable signal.
Red triangledown "SELL!": Strongest+++ sell signal, bearish divergences from MACD . Shortable signal.
BUY SIGNALS
Yellow triangleup "Weakening": Bear trend is getting weak, as the asset is getting oversold.
Green "BUY!": Strong buy, bullish divergence from MACD . Strongest buy signal.
Remember, again, to ALWAYS set your TP and SL beforehand. The key to be profitable is to act before the market acts.
It's better 3% in hand than 1% below your initial balance.
From a manual backtesting, I got a 53% profit on 2 weeks, trust my advice to manage the risk and you will be profitable aswell ;)
Check my other scripts to get more options :)
I also made a 4Hours and 12Hours optimized scripts, you might found that which one works better for your strategy, asset, and timeframe.

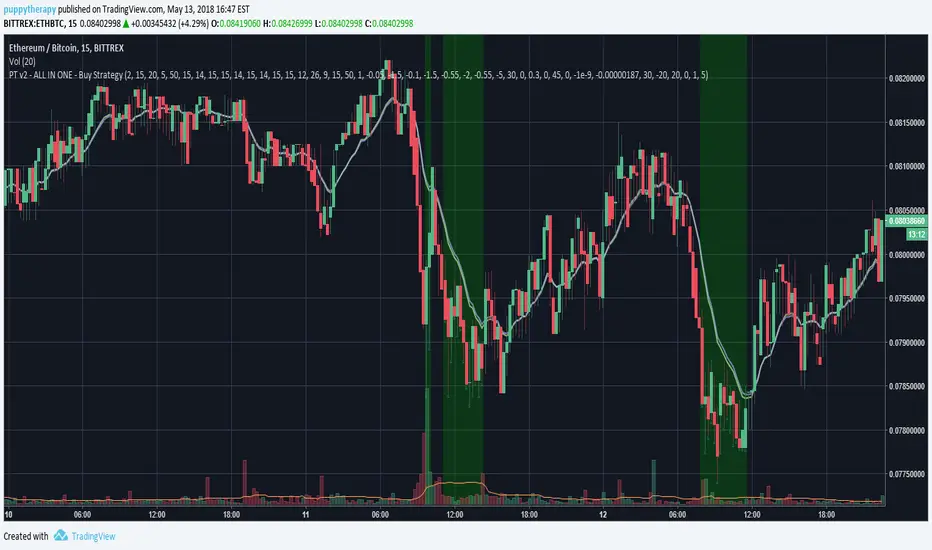
PT v2 - ALL IN ONE - Buy StrategiesBacktesting script for Profit Trailer.
It will mark with green color the area when all the strategies you select are gonna be true.
Strategy Description:
wiki.profittrailer.com
In Progress:
- OBV is still missing
- better visualisation
Bottoms Up w/ Buy and Sell AlertsBITMEX:XBTUSD
This indicator is best used on 4hr candles. It produces a buy/long and sell/short alert with pre-coded syntax for Autoview. There are four alerts total, 2 for BitMEX testnet and 2 for BitMEX (each has a buy/sell alert). The alerts are pre-coded for BitMEX
****be sure to edit the message script to your desired contract amount and leverage****
This script will also work on Profit Trailer, but you will need to change the alert message syntax to match your exchange. You will also want to adjust your bot's selling strategy to hold the coin longer. This is not a quick scalp of a coin, this is intended to buy a coin and ride its trend longer. This is more of an automated swing trader rather than a scalping opportunity like most bots use.

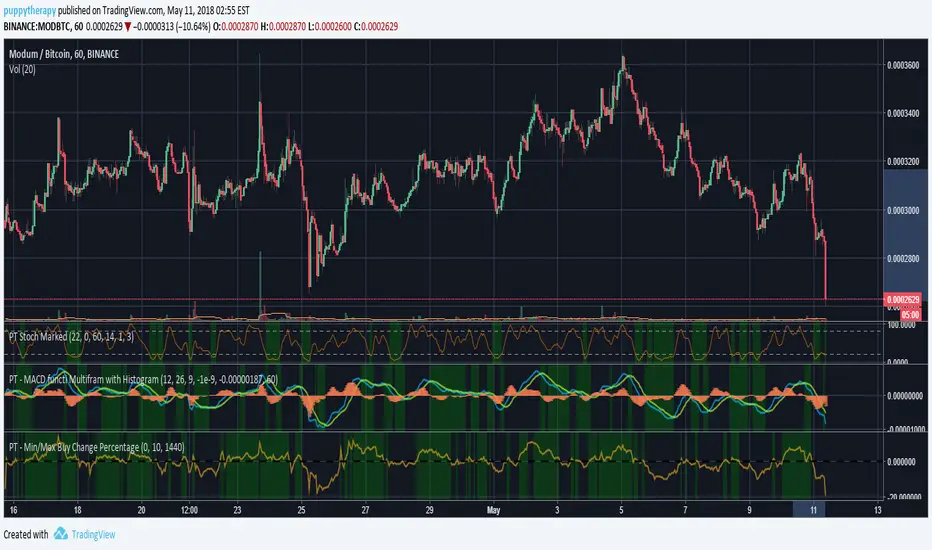
PT - Min/Max Buy Change PercentageDEFAULT_buy_min_change_percentage
Only purchase a coin if the 24 hour percentage change is above the set value.
Example:
DEFAULT_buy_min_change_percentage = 3.5 –> Only buy a coin if the 24 hour change is above 3.5%
DEFAULT_buy_min_change_percentage = -2 –> Only buy a coin if the 24 hour change is above -2%
DEFAULT_buy_max_change_percentage
Only purchase a coin if the 24 hour percentage change is below the set value.
Example:
DEFAULT_buy_max_change_percentage = 8 –> Only buy a coin if the 24 hour change is below 8%
DEFAULT_buy_max_change_percentage = -1 –> Only buy a coin if the 24 hour change is below -1%
Source Profit Trailer Wiki ( wiki.profittrailer.com )
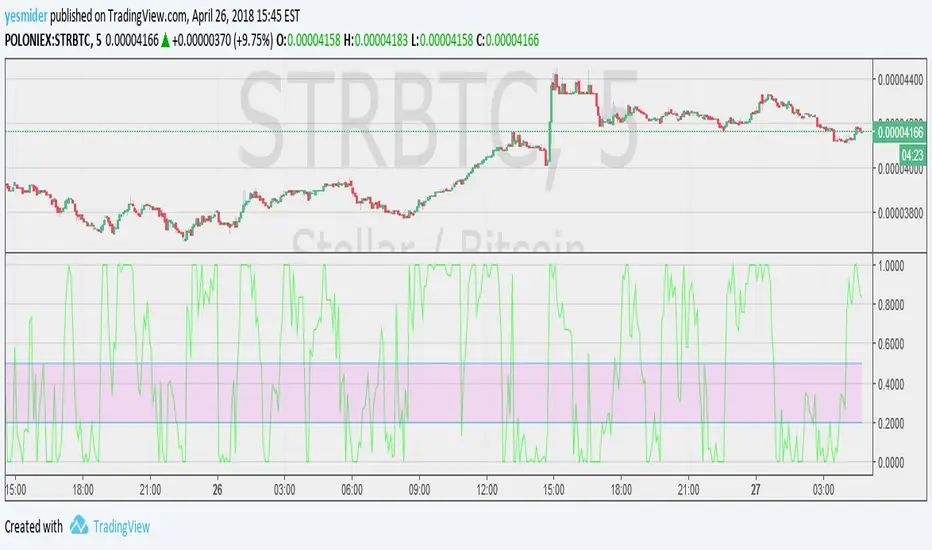
PT2_Stochastic RSI / MACDThis indicator is designed for use with Profit Trailer version 2 and plots the values of RSI, Stochastic, StochasticRSI and MACD.
Due to the decimal values that they all produce, There are some important things to understand before using this indicator.
In PT2, RSI and Stochastic require values between 0 and 100, but StochasticRSI requires values between 0.00 and 1.00. Because of this the following needs to be understood.
RSI:
----
The buy and sell values and limits are inputted as values between 0 and 100, but they get divided by 100 so to map alongside StochasticRSI on the indicator scale.
In other words an RSI buy value inputted as 30 will display as 0.3, but in your PT2 settings you would still input 30.
Stochastic:
-------------
Stochastic and StochasticRSI share common buy and sell value input fields for this indicator (so you can't use BOTH Stochastic and StochasticRSI at the same time, in the same indicator).
The buy and sell values and limits, need to be written as decimal values between 0.00 and 1.00 even though within the PT2 settings, Stochastic is inputted as values between 0 and 100.
So when translating values from this indicator to your PT2 settings, a Stochastic Buy Value of 0.3 in this indicator will be written in your PT2 settings as 30. Just like RSI.
StochasticRSI:
-----------------
PT2 uses StochasticRSI values between 0.00 and 1.00 (as mentioned above). It is because of this, to enable RSI and Stochastic to display together, everything is displayed using the decimal notation of between 0.00 and 1.00.
MACD:
--------
The MACD is completely different and produces a decimal value down to 9 decimal places as used in PT2, making it not compatible with the RSI and Stochastic values.
So at the top of the settings of this indicator, you need to choose which indicator you wish to view at a time (Stochastic-RSI or MACD, not both).
Also, Trading view doesn't handle negative decimals down to 9 places very well, so the Buy/Sell Value/Limit numbers you enter here will be divided by 100,000,000.
This means that if you enter a MACD Sell Value of -250 in this indicator, it gets translated to -0.000000250. This would be the decimal value you would put in your PT2 settings.
======================================================================================================================================================
I hope this indicator helps you all out, feel free to show any appreciation you have in what ever way you feel you can.
// Created 2018 - by @Squiggles#8806
// LTC Tip Jar: LX4bUBdjiRPsagUbZoAczSGgDC4YqTJL7w
======================================================================================================================================================

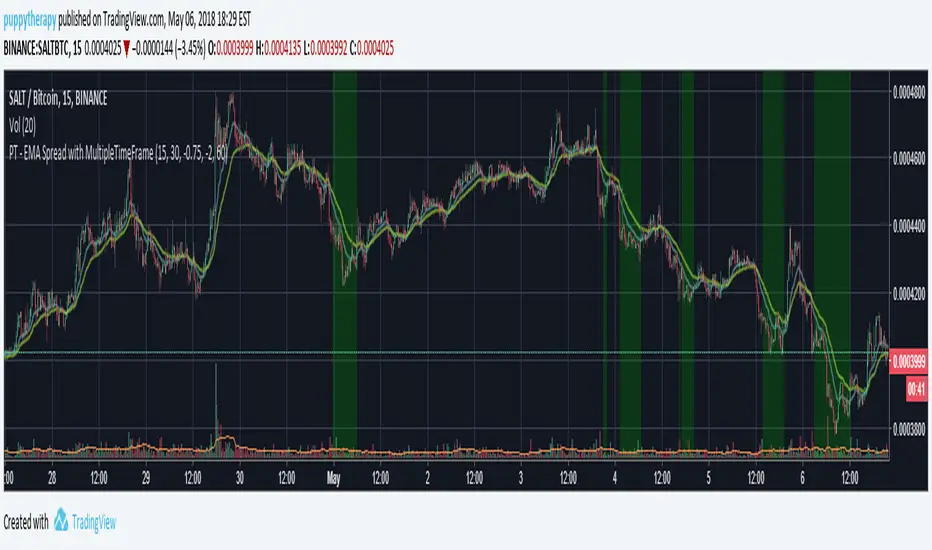
PT - EMA/SMA Spread AND Combination with MultipleTimeFrameYou can now combine multiple timeframe EMA/SMA as in profit trailer and see which areas will be then used for PT if you for example use a 15 minute EMASpread and 60 minute Spread.
- From what i can see the lowes the timeframe the faster it reacts but a lot of times you will get stuck with a bag due to a coin having 2 drops. Thiw might help you find a sweetspot so that you can picky only the high reward low risk trades.

PT - SMA Spread with MultipleTimeFrameSMA Spread for profit Trailer with multiple time frame support.

PT - EMA Spread with MultipleTimeFrameEMA Spread for profit Trailer with multiple time frame support.
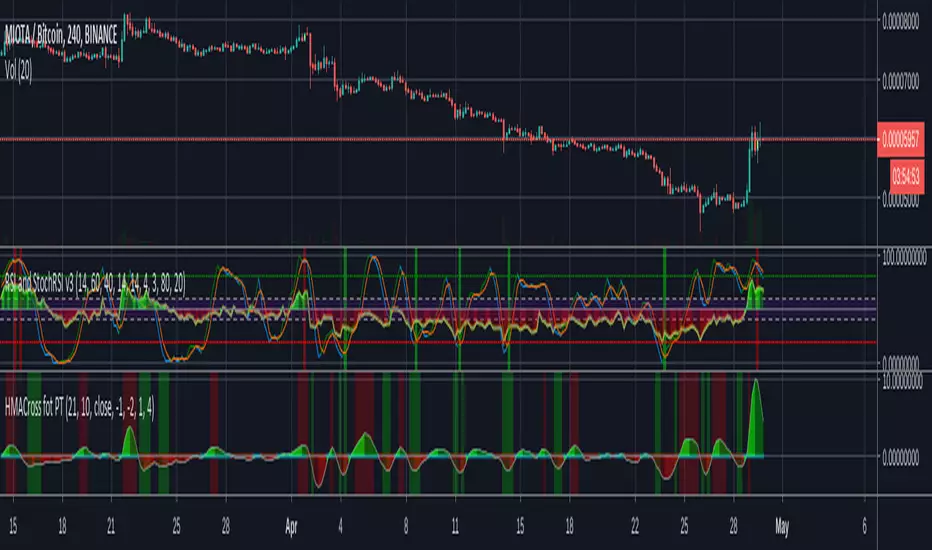
indicator for v3it's a simple indicator for my script there are some indicators can't be shown clearly when overlay.
Support MACD,RSI,STOCH,STOCHRSI
this script will only show the value profit trailer is using if you need the full function indicator you can use the built-in.
you need to set the SAME value of setting you are using in my script V3 except for buy_value and limit.
Feel free to donate if you think my scripts are useful.
BTC:17eguEeVVnLmYK9iDKQNxBQmKWNENH4bGj
ETH:0xb172BBc4CDAB7F334243A312A46FB8492674A914
BCH:qpy0zulq9s4pcqu3hd2m8h8h7tfm83jz7qle0690c4
PTM Triggers AND/OR with OffTriggers 2.0This script is for Profit trailer addon PT Magic . If you are familiar it will help you.
So i decided to consolidate it a bit and made one script for all possible conditions that there are.
You have to add the script and set the trigger as you want them you then have a selection of AND / OR condition between the triggers and a number fo Triggers you want to apply. Casue you still can use 8 triggers but you dont have to 8 is the maximum i will not be adding more since that would be overoptimizing the strategy.
YOU will the get a nice indicator on the bottom showing the price change momentu for each trigger you defined. If you added the Minchange / Maxchange percentages right the are the trigger will apply on will be marked aqua. if you are using just one of those MinChange / Maxchange please add a masive number so that all will be taken into considerations. The basic rule is script always expects a number.
After that i added the the possibility of Offtriggers. It is very useful in scenarios as you have a coin in a long term downtrend but the moment you see the coin finding a bottom you will use the offtrigger. You have option to turn it OFF as defaul or again AND / OR conditions with the number of triggers you are using again max 8.
- do not foget the candlesize when changing the timeframe
- not all conditions you can create make sense think about them a before saying it does not work
- if you are happy follow / comment

CryptoProTools AutoTrader v1This version combines and improves on ideas from both of our previous BUY/SELL Signals indicators as well as adding an EMA based channel and extra equations as filters.
You can use this for manual trading or along with your favorite bot like Autoview and Gunbot, or even in combination with ProfitTrailer.
With this indicator you have the ability to tweak the heck out of every option in order to fit your trading style.
Going for quick small profits, or playing the big swings for bigger gains? You can set this up for either!
There are people paying hefty monthly fees for access to scripts like this, but every CryptoProTools member will be given access to this script as well as all of the other indicators and tools we have created.
Visit CryptoProTools.com for more info and to join us today!
Any questions? Just send us a PM and we'll get back to you as soon as possible.


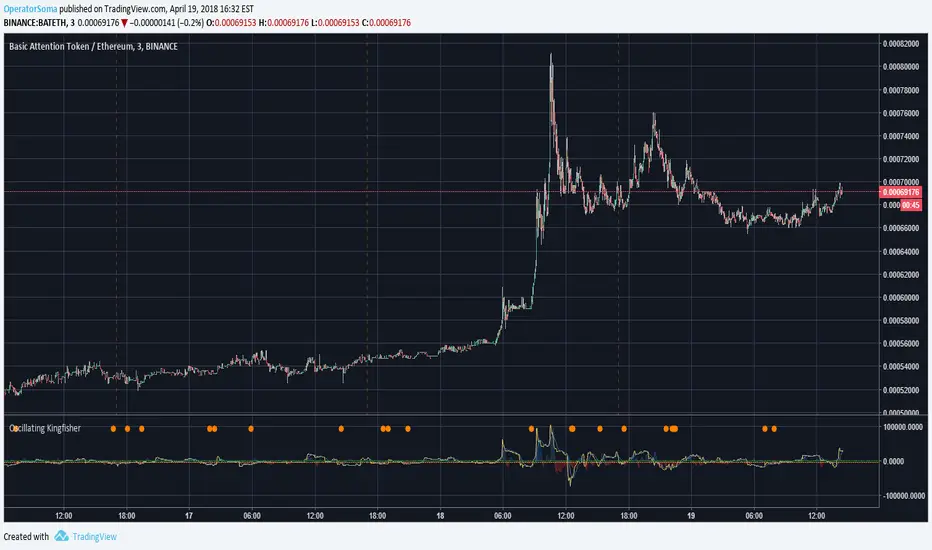
Oscillating KingfisherA more adaptable script. Quite good at buying dips. Designed to be used in conjunction with ProfitTrailer and Autoview.
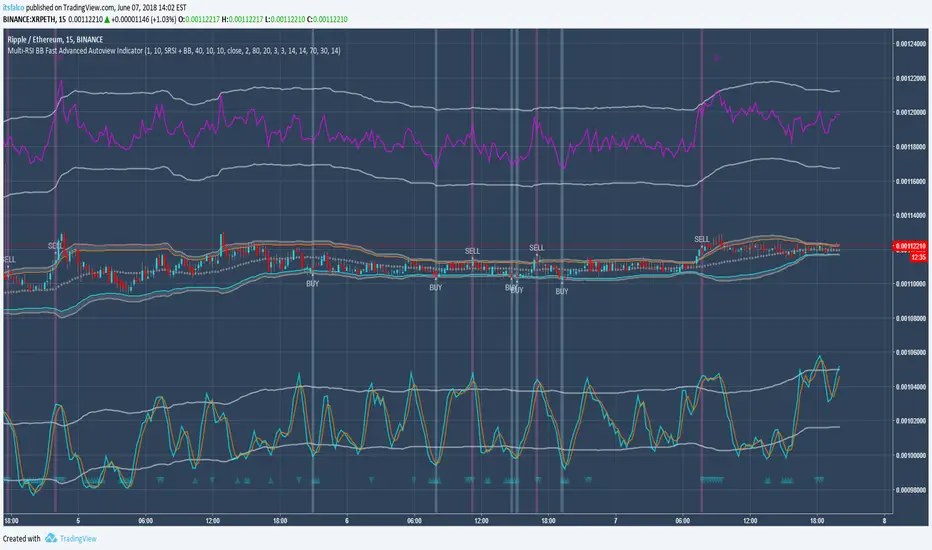
Multi-RSI BB Fast Trader Autoview & Alerts Indicator
Overview
This is a fully featured StochRSI, RSI & Bollinger Band customisable indicator with custom conditions and alerts that can be taken
advantage of using automated solutions such as Autoview , or using it alongside/testing BUY/SELL conditions against your favourite markets
to maximise gains in ProfitTrailer 2.0 and finally you can use this a standalone manual general purpose signals indicator to scalp or accumulate your chosen market.
Features:
3 different core strategies with fully customisable buy / sell conditions to suit your needs: StochRSI + RSI + BB, StochRSI + BB, BB
Toggleable conditional logic to further tweak your buy / sell conditions: Conservative Conditions, Aggressive Conditions
New intuitive chart layout to make the tweaking process visually easy and appealing. With this layout its incredibly easy to see why conditions might not be met and helps guide you on what settings need to be tweaked.
2 custom alerts that be used to either signal a manual trade or for use with automated solutions such as Autoview.
Planned Updates:
Version 1.1: Toggleable
Version 1.2: Toggleabe
Version 1.3: Toggleable
More currently being planned!
Trial Access:
48 hour no obligation trial access just leave a message on the script and PM me.
Permanent Access:
Flat Fee: 0.10 ETH (0.05 for any previous purchaser of my work)
As with all my TradingView indicators, there are no monthly fees or subscriptions. I don't make these for the money but I do add a fee to avoid over-saturation so I can give
those that see value in it and want to use it the best experience:
Lifetime full access to the indicator and any subsequent updates/improvements for it.
Full support over TV or Discord to help you create a suitable strategy for your needs.
50% discount off any future/previous work I have created on TradingView.