DMI MTF Color Table v5DMI Multi-Timeframe Color Table v5
A comprehensive DMI (Directional Movement Index) table that displays trend direction and strength across multiple timeframes simultaneously. This indicator helps traders quickly assess market conditions and identify confluence across different time horizons.
Features:
Multi-timeframe analysis (7 configurable timeframes)
Color-coded cells based on trend strength and direction
Real-time current market condition display
Customizable strength thresholds and color schemes
Multiple display modes (All, DI+ Only, DI- Only, ADX Only)
Text-based strength classifications (STRONG/MEDIUM/WEAK)
Directional bias indicators (BULL/BEAR)
How It Works:
The table shows DI+, DI-, and ADX values across your chosen timeframes with intelligent color coding:
Green shades indicate bullish momentum (DI+ > DI-)
Red shades indicate bearish momentum (DI- > DI+)
Color intensity reflects trend strength based on ADX values
Current market condition appears in top-right corner
Display Options:
Toggle numerical values, strength text, and timeframe labels
Adjustable table size and transparency
Customizable color schemes for all conditions
Optional current timeframe DMI plot overlay
Educational Use:
This tool is designed for educational purposes to help understand multi-timeframe analysis and DMI interpretation. All trading decisions should be based on your own analysis and risk management.
Credits:
Original concept and development by Profitgang. If you use or modify this script, please provide appropriate credit to the original author.
Note: This indicator is for analysis purposes only. Past performance does not guarantee future results. Always conduct your own research and consider your risk tolerance before making trading decisions.
Pesquisar nos scripts por "profit"

Enhanced 4H Candle Countdown & High/Low IndicatorBy profitgang
This Pine Script indicator provides real-time tracking of 4-hour timeframe levels with an integrated countdown timer, designed to help traders monitor key support and resistance zones.
Key Features
📊 Visual Elements
4H High/Low Lines: Clear visualization of previous 4-hour candle high and low levels
Range Fill: Subtle background fill between high and low for better context
Mid-Level Line: Shows the middle point of the 4H range
Position Indicator: Visual cue showing current price position within the range
⏰ Countdown Timer
Real-time countdown to next 4H candle close
Customizable table position (9 different locations)
Adjustable text size (6 size options from Tiny to Huge)
Distance calculations showing percentage distance from key levels
🎯 Signal Generation
Long signals when price crosses above 4H low
Short signals when price crosses below 4H high
RSI confluence filter to reduce false signals
Background highlighting for active signals
TradingView alerts compatible
⚙️ Customization Options
Toggle all features on/off independently
Custom colors for all elements
Table positioning (top/middle/bottom + left/center/right)
Text size selection for optimal readability
Alert notifications for level breaks and updates
How It Works
The indicator fetches the previous 4-hour candle's high and low values and displays them as horizontal lines on your current timeframe chart. It continuously calculates the time remaining until the current 4H candle closes and presents this information in a clean, customizable table.
Use Cases
Swing Trading: Identify key 4H support and resistance levels
Intraday Trading: Monitor when new 4H levels will be established
Risk Management: Calculate distance from key levels for position sizing
Multi-timeframe Analysis: Combine with lower timeframe setups
Educational Purpose
This indicator is designed for educational and analytical purposes to help traders understand price action relative to higher timeframe levels. It provides clear visual feedback about market structure and timing.
Settings Groups
Display Settings: Toggle features, positioning, and sizing
Colors: Customize all visual elements
Signal Settings: Configure alert conditions and confluence filters
Compatibility
Works on all timeframes (recommended for 1m to 1H charts)
Compatible with all instruments
Includes proper alert functionality for automated notifications
Optimized for both light and dark themes
This indicator does not provide financial advice. Always conduct your own research and risk management before making trading decisions.

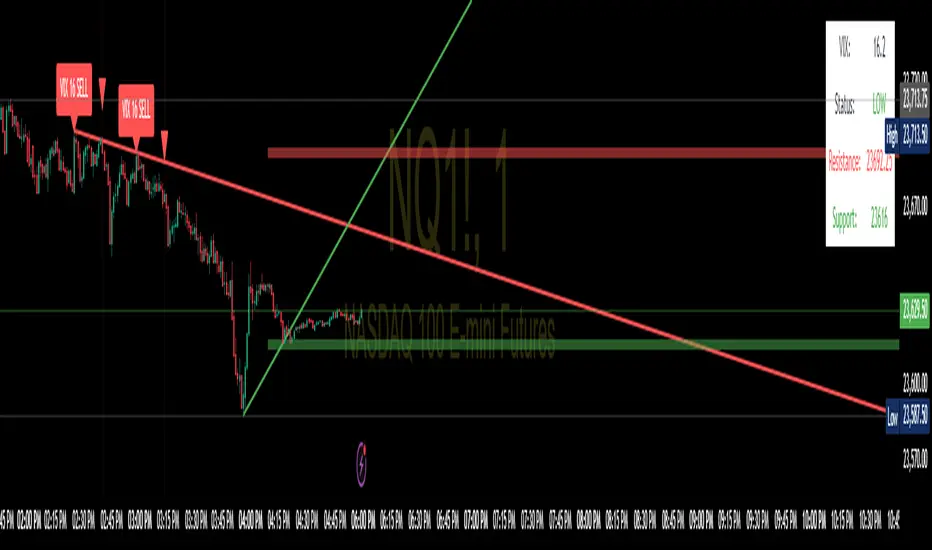
SPX Trendlines with VIX Levels By- Profit gang
This comprehensive technical analysis tool combines SPX trendline analysis with VIX volatility levels to help identify potential market turning points. The indicator is specifically designed with non-repainting logic to ensure reliability for both backtesting and live trading.
🔧 KEY FEATURES:
Non-Repainting Design: All signals and lines are drawn only on confirmed bars using barstate.isconfirmed
Dynamic Trendlines: Automatically draws support and resistance lines connecting recent pivot points
VIX Integration: Displays current VIX levels with customizable thresholds for market sentiment analysis
Multiple Visual Elements: Includes diagonal trendlines, horizontal level lines, and an information table
Comprehensive Alerts: Configurable alert system for both buy and sell signals
Clean Interface: Organized inputs and customizable colors for all elements
📊 TRADING CONCEPT:
The indicator utilizes the inverse relationship between VIX and SPX:
High VIX at pivot lows may indicate oversold conditions (potential buying opportunities)
Low VIX at pivot highs may signal complacency at market tops (potential caution zones)
🎛️ CUSTOMIZATION OPTIONS:
Toggle trendlines, VIX labels, and level lines independently
Adjust VIX thresholds (default: 25 high, 18 low)
Customize pivot length for sensitivity (default: 15)
Choose line styles (solid, dashed, dotted) and widths
Personalize all colors and alert preferences
📈 VISUAL COMPONENTS:
Red Lines: Resistance levels and trendlines
Green Lines: Support levels and trendlines
Information Table: Real-time VIX status and current levels
Signal Shapes: Triangle markers for confirmed buy/sell signals
Background Highlighting: Optional signal emphasis
⚠️ EDUCATIONAL PURPOSE:
This indicator is designed for educational and informational purposes. Past performance does not guarantee future results. Always conduct your own research and consider risk management before making trading decisions.
🔔 ALERT SYSTEM:
Separate alerts for buy and sell signals
All alerts trigger only on confirmed bars
Customizable alert messages with price and VIX data
Multiple alert condition options for flexible setup
Perfect for traders who want to combine technical analysis with volatility sentiment in a reliable, non-repainting format.
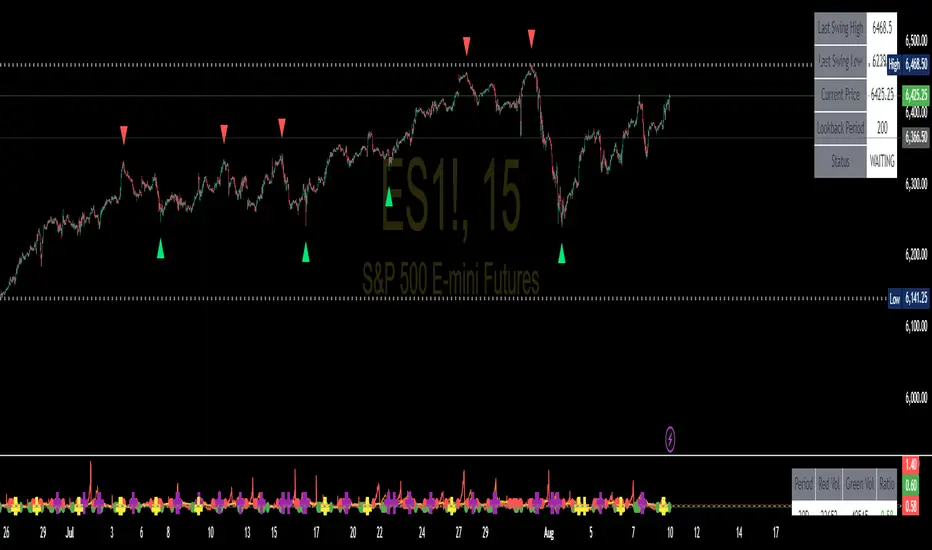
Swing High/Low SignalsSwing High/Low Signals – profit gang
Quickly spot recent market turning points with this clean swing high/low indicator.
Marks swing highs & lows with labels or triangles
Optional connecting lines & background highlights
Alerts when new swings form
Info table showing last swing levels & current price
Fully adjustable lookback period for any timeframe.
Disclaimer: For educational use only. Not financial advice.
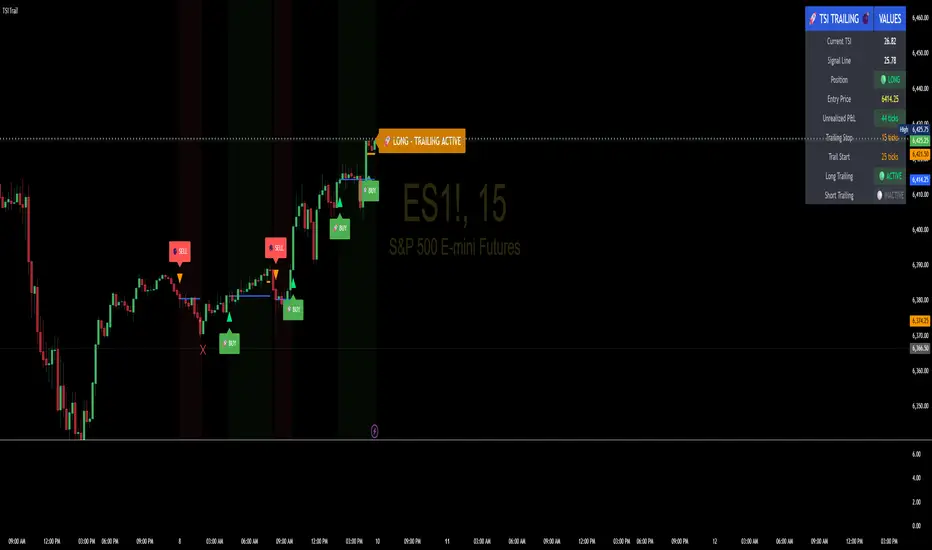
TSI Indicator with Trailing StopAuthor: ProfitGang
Type: Indicator (visual + alerts). No orders are executed.
What it does
This tool combines the True Strength Index (TSI) with a simple tick-based trailing stop visualizer.
It plots buy/sell markers from a TSI cross with momentum confirmation and, if enabled, draws a trailing stop line that “ratchets” in your favor. It also shows a compact info table (position state, entry price, trailing status, and unrealized ticks).
Signal logic (summary)
TSI is computed with double EMA smoothing (user lengths).
Signals:
Buy when TSI crosses above its signal line and momentum (TSI–Signal histogram) improves, with TSI above your Buy Threshold.
Sell when TSI crosses below its signal line and momentum weakens, with TSI below your Sell Threshold.
Confirmation: Optional “Confirm on bar close” setting evaluates signals on closed bars to reduce repaint risk.
Trailing stop (visual only)
Units are ticks (uses the symbol’s min tick).
Start Trailing After (ticks): activates the trail only once price has moved in your favor by the set amount.
Trailing Stop (ticks): distance from price once active.
For longs: stop = close - trail; it never moves down.
For shorts: stop = close + trail; it never moves up.
Exits shown on chart when the trailing line is touched or an opposite signal occurs.
Note: This is a simulation for visualization and does not place, manage, or guarantee broker orders.
Inputs you can tune
TSI Settings: Long Length, Short Length, Signal Length, Buy/Sell thresholds, Confirm on Close.
Trailing Stop: Start Trailing After (ticks), Trailing Stop (ticks), Show/Hide trailing lines.
Display: Toggle chart signals, info table, and (optionally) TSI plots on the price chart.
Alerts included
TSI Buy / TSI Sell
Long/Short Trailing Activated
Long/Short Trail Exit
Tips for use
Timeframes/markets: Works on any symbol/timeframe that reports a valid min tick. If your market has large ticks, adjust the tick inputs accordingly.
TSI view: By default, TSI lines are hidden to avoid rescaling the price chart. Enable “Show TSI plots on price chart” if you want to see the oscillator inline.
Non-repainting note: With Confirm on bar close enabled, signals are evaluated on closed bars. Intrabar previews can change until the bar closes—this is expected behavior in TradingView.
Limitations
This is an indicator for education/research. It does not execute trades, and visuals may differ from actual broker fills.
Performance varies by market conditions; thresholds and trail settings should be tested by the user.
Disclaimer
Nothing here is financial advice. Markets involve risk, including possible loss of capital. Always do your own research and test on a demo before using any tool in live trading.
— ProfitGang
NQ Volume Analysis - Predictive SignalsOverview
This professional-grade indicator analyzes red and green candle volume patterns across multiple timeframes (30, 60, 90 days) to identify potential market reversals and momentum shifts in NQ1! (Nasdaq 100 E-mini futures). Perfect for day traders and swing traders looking to gain an edge through volume analysis.
Key Features
📈 Multi-Timeframe Volume Analysis
30/60/90 Day Lookbacks: Compare short, medium, and long-term volume patterns
Red/Green Volume Ratios: Identify when selling or buying pressure is dominating
Dynamic Calculations: Real-time updates as new volume data comes in
🎯 Trading Signals
Long Signals: High volume green candles during bullish conditions
Short Signals: High volume red candles during bearish conditions
Climax Signals: Extreme volume events that often precede reversals
Fixed Signal Positioning: Signals remain stable regardless of chart scaling
📊 Visual Analytics
Volume Ratio Lines: Clear trend visualization with color-coded timeframes
Reference Thresholds: 0.8 (bullish), 1.0 (neutral), 1.2 (bearish) zones
Information Table: Real-time statistics display with color-coded ratios
Clean Oscillator Format: Dedicated panel below price chart
How to Use
Ratio Interpretation
Ratio > 1.2: Bears dominating - look for short opportunities
Ratio < 0.8: Bulls dominating - look for long opportunities
Rising Ratio: Increasing selling pressure (potential breakdown)
Falling Ratio: Increasing buying pressure (potential breakout)
Signal Types
🟢 Green Triangles: Bullish volume surge - potential long entry
🔴 Red Triangles: Bearish volume surge - potential short entry
🟣 Purple Diamonds: Selling climax - potential reversal up
🔵 Blue Diamonds: Buying climax - potential reversal down
Best Practices
Use on 5-minute charts for optimal NQ futures analysis
Combine with price action and support/resistance levels
Wait for volume confirmation before entering trades
Pay special attention to climax signals at key levels
Technical Specifications
Timeframes: Optimized for 1m to 1D charts
Lookback Periods: Configurable 30-250 day ranges
Volume Multipliers: Adjustable sensitivity settings
Alert System: Built-in notifications for all signal types
Educational Value
This indicator teaches traders to:
Understand volume's role in price movement
Identify institutional buying/selling patterns
Recognize market exhaustion points
Develop systematic trading approaches
Disclaimer
This indicator is for educational and informational purposes only. Past performance does not guarantee future results. Always conduct your own analysis and risk management. Trading futures involves substantial risk of loss.
💡 Developed by ProfitGang Trading Community
Empowering traders through advanced technical analysis and education
🔔 Enable alerts to never miss a signal!
⭐ If this indicator helps your trading, please leave a review!
Installation Notes
Add the main oscillator indicator to a separate panel below your chart
Optionally add the companion "NQ Climax Signals" overlay for price chart signals
Adjust volume multipliers based on your risk tolerance
Enable alerts for automatic signal notifications
Version History
v1.0: Initial release with multi-timeframe volume analysis
Features: Fixed signal positioning, customizable thresholds, comprehensive alerts
#NQFutures #VolumeAnalysis #TradingSignals #FuturesTrading #TechnicalAnalysis #ProfitGang

Quantum Breakout System**Quantum Breakout System (QBS) by @profitgang**
**Description:**
The Quantum Breakout System combines multi-dimensional fractal analysis with a novel “quantum energy” momentum indicator to identify high-probability support and resistance breakout zones. It plots colored boxes around the latest primary fractals—red/orange/yellow for resistance and lime/green/blue for support—each labeled “Strong”, “Medium” or “Weak” to convey relative breakout strength. Optional background fills highlight pre-breakout staging areas.
**Key Features:**
* **Multi-Timeframe Fractals:** Detects primary fractals on the current chart, with adjustable lookback lengths.
* **Quantum Energy Momentum:** Computes an energy score by blending short, medium, and long RSI-based momentum; scaled by ATR-normalized volatility.
* **Dynamic Breakout Zones:** Plots color-coded boxes around fractals, with embedded labels indicating “Resistance — Strong/Medium/Weak” and “Support — Strong/Medium/Weak.”
* **Pre-Breakout Staging:** Semi-transparent background fills show upcoming breakout windows to help you prepare.
* **Fully Customizable:** User inputs for fractal lengths, energy smoothing, prediction bars, confidence thresholds, and label sizing.
* **Non-Repainting Logic:** All signals are evaluated on bar close to ensure historical consistency.
**Inputs & Controls:**
• Primary/secondary/tertiary fractal lengths
• Quantum energy smoothing and time-weight ratios
• Prediction bars ahead & confidence threshold
• Toggle fractal boxes, staging zones, and labels
• Label text size and color transparency
Resistance boxes (res_col):
Red = Strong breakdown potential (quantum_energy > 0.7)
Orange = Medium potential (0.5 < quantum_energy ≤ 0.7)
Yellow = Weak potential (quantum_energy ≤ 0.5)
Support boxes (sup_col):
Lime = Strong breakout potential (quantum_energy > 0.7)
Green = Medium potential (0.5 < quantum_energy ≤ 0.7)
Blue = Weak potential (quantum_energy ≤ 0.5)
**Usage & Disclaimer:**
This indicator is designed to help spot potential breakout areas—it does **not** guarantee future performance. Always backtest and use proper risk management. By using QBS, you acknowledge that @profitgang and TradingView are not responsible for any trading outcomes.
Happy trading!

Quantum Tick Flow# Quantum Tick Flow (QTF) - Advanced Momentum Oscillator
**Author: profitgang**
## Overview
The Quantum Tick Flow indicator is a sophisticated momentum oscillator that analyzes tick-by-tick price movements using proprietary algorithms. Unlike traditional oscillators, QTF combines multiple innovative approaches to identify high-probability entry and exit points while filtering out market noise.
## Key Features
### 🔬 **Tick Velocity Analysis**
- Uses fractional power scaling (0.7 exponent) combined with volume weighting
- Creates non-linear response to price changes for enhanced sensitivity to meaningful moves
- Differentiates between genuine momentum and random price fluctuations
### ⚡ **Adaptive Threshold System**
- Dynamic thresholds that automatically adjust to current market volatility
- Uses ATR-based scaling to maintain consistent signal quality across different market conditions
- Prevents over-trading in low volatility and under-trading in high volatility environments
### 🌊 **Flow Pressure Index**
- Proprietary calculation measuring upward vs downward market pressure
- Analyzes cumulative tick velocity to gauge underlying market sentiment
- Provides early warning signals for potential trend reversals
### 🎯 **Anti-Noise Filtering**
- Multi-condition verification system reduces false signals
- Incorporates momentum convergence analysis
- Filters out choppy market conditions automatically
## How It Works
The indicator operates on several layers:
1. **Fast and Slow Flow Analysis**: Calculates exponential moving averages of tick velocity at different timeframes
2. **Flow Differential**: Measures the difference between fast and slow flows to identify momentum shifts
3. **Pressure Calculation**: Evaluates the ratio of bullish vs bearish pressure over specified periods
4. **Convergence Oscillator**: Uses mathematical approximation functions to create bounded, smooth signals
## Signal Generation
- **BUY Signals**: Generated when flow momentum is positive, pressure ratio exceeds 1.2, and oscillator is rising above adaptive thresholds
- **SELL Signals**: Triggered when flow momentum turns negative, pressure drops below 0.8, and oscillator falls below negative thresholds
## Visual Elements
- **Main Oscillator Line**: Primary signal line with color-coded momentum
- **Dynamic Threshold Lines**: Automatically adjusting support/resistance levels
- **Flow Zones**: Background coloring indicating bullish/bearish market conditions
- **Information Table**: Real-time statistics including current signal, flow value, momentum direction, and volatility metrics
## Settings
- **Fast Tick Period** (3-50): Controls sensitivity of short-term analysis
- **Slow Tick Period** (10-100): Sets baseline for longer-term trend detection
- **Momentum Convergence Period** (5-50): Defines momentum calculation timeframe
- **Flow Sensitivity** (0.5-5.0): Adjusts overall indicator responsiveness
- **Noise Filter** (0.1-1.0): Controls signal filtering strength
## Best Practices
1. Use in conjunction with trend analysis tools for confirmation
2. Higher timeframes generally produce more reliable signals
3. Adjust sensitivity based on asset volatility and trading style
4. Monitor the pressure index for early trend change warnings
5. Consider market context when interpreting signals
## Unique Advantages
- **No Repainting**: All calculations are based on confirmed price data
- **Multi-Dimensional Analysis**: Combines price, volume, and momentum in novel ways
- **Adaptive Nature**: Automatically adjusts to changing market conditions
- **Low Latency**: Responds quickly to genuine market moves while filtering noise
## Disclaimer
This indicator is for educational and informational purposes only. Past performance does not guarantee future results. Always conduct your own analysis and consider risk management before making trading decisions.
---
*Developed by profitgang - For questions and updates, follow on TradingView*
**License**: This script is open source under Mozilla Public License 2.0. Feel free to use and modify for personal trading, but please credit the original author.

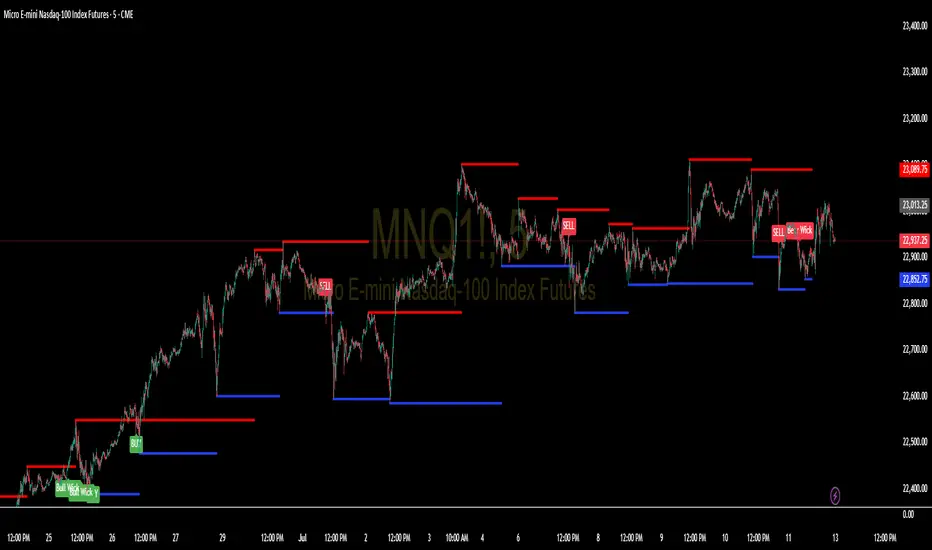
Support and Resistance Levels with BreaksThis indicator identifies dynamic support and resistance levels using pivot point analysis and provides clear trading signals when these levels are broken with volume confirmation. Enhanced version with improved signal clarity for better trading decisions.
## 🔧 Key Features
### Support & Resistance Detection
- Automatically identifies key pivot high and low levels
- Draws clear visual lines (red for resistance, blue for support)
- Configurable sensitivity with left/right bar settings
### Enhanced Trading Signals
- **BUY** signals when resistance is broken with volume confirmation
- **SELL** signals when support is broken with volume confirmation
- **Bull Wick** alerts for potential reversals at resistance
- **Bear Wick** alerts for potential reversals at support
### Volume Confirmation
- Built-in volume oscillator using 5 and 10-period EMAs
- Filters out low-volume false breakouts
- Adjustable volume threshold (default: 20%)
### Complete Alert System
- Support Broken alerts
- Resistance Broken alerts
- Bull Wick reversal alerts
- Bear Wick reversal alerts
## ⚙️ Settings
- **Show Breaks**: Toggle signal display
- **Left Bars**: Pivot detection lookback (default: 15)
- **Right Bars**: Pivot detection lookforward (default: 15)
- **Volume Threshold**: Minimum volume increase for valid signals (default: 20%)
## 📈 Best For
- Swing trading strategies
- Breakout confirmation
- Support/resistance trading
- Volume-based entry signals
## 🔍 How It Works
1. Identifies pivot highs/lows using configurable periods
2. Calculates volume oscillator for confirmation
3. Generates BUY signals on resistance breaks with volume
4. Generates SELL signals on support breaks with volume
5. Detects wick patterns for potential reversals
## 📋 Updates in This Version
- Enhanced BUY/SELL signal clarity (replaced generic "B" labels)
- Added Bull Wick and Bear Wick alert conditions
- Updated to Pine Script v6 compatibility
- Improved signal filtering and accuracy
## ⚠️ Disclaimer
This indicator is for educational and informational purposes only. Always conduct your own analysis and risk management before making trading decisions. Past performance does not guarantee future results.
---
**Original Script**: "Support and Resistance Levels with Breaks" by LuxAlgo
**License**: CC BY-NC-SA 4.0
**Enhanced by**: profitgang
**Version**: Pine Script v6
Futures Support & Resistance LevelsMulti-Timeframe Support & Resistance Levels for Futures Trading
Description:
This indicator automatically identifies and displays key support and resistance levels using multiple technical analysis methods. Designed specifically for futures traders (ES, NQ, etc.), it provides a clean, organized view of important price levels.
Key Features:
Multiple Detection Methods: Combines pivot points, daily ranges, and psychological levels
Smart Ranking System: Levels are numbered by strength (1 = strongest)
Clean Visualization: Extended lines across the chart with clear price labels
Confluence Detection: Highlights areas where multiple levels converge
Customizable Display: Adjust colors, line styles, and label sizes
Level Types Identified:
Daily High/Low (current session)
Previous Daily High/Low
Pivot-based Support/Resistance
Psychological Round Numbers
Confluence Zones (multiple levels clustering)
Technical Approach:
The indicator uses a strength-scoring algorithm to rank levels by importance. Daily levels receive the highest weighting (2.0), followed by previous daily levels (1.5), pivot points (1.0), and psychological levels (0.5). This helps traders focus on the most significant levels.
Visual Elements:
Solid lines = Strong levels
Dashed lines = Medium levels
Dotted lines = Weak levels
Optional technical condition markers for educational analysis
Best Used For:
Identifying key intraday levels for futures trading
Finding high-probability reversal zones
Setting logical stop-loss and take-profit levels
Recognizing confluence areas for stronger setups
Note:
This is a technical analysis tool for educational purposes. No indicator can predict future price movements. Always use proper risk management and combine with other forms of analysis.

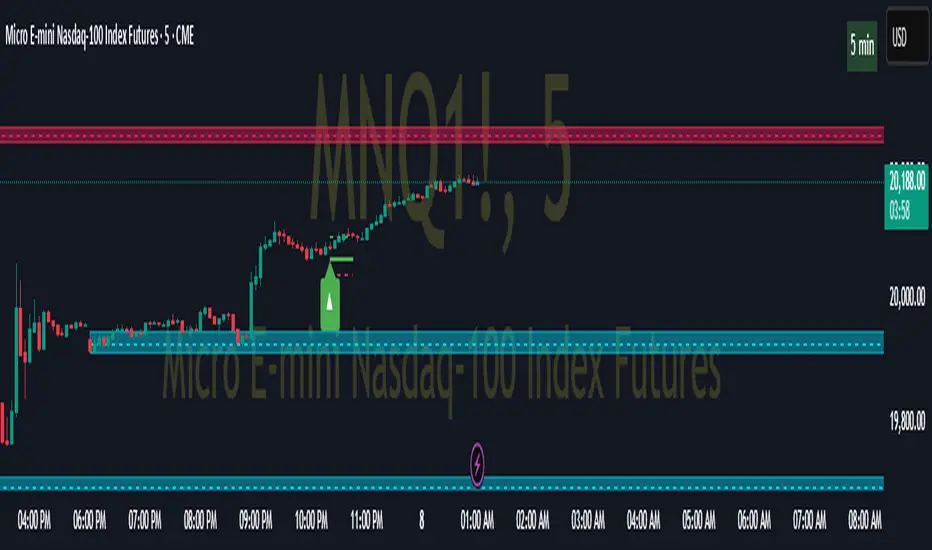
Pivot ATR Zones [v6]🟩 Pivot ATR Zones
Overview:
The Pivot ATR Zones indicator plots dynamic support and resistance zones based on pivot highs and lows, combined with ATR (Average True Range) volatility levels. It helps traders visually identify potential long and short trade areas, along with realistic target and stop loss zones based on market conditions.
Features:
Automatically detects pivot highs and lows
Draws ATR-based entry zones on the chart
Plots dynamic take-profit and stop-loss levels using ATR multipliers
Color-coded long (green) and short (red) zones
Entry arrow markers for clearer trade visualization
Real-time alerts when new zones form
Best For:
Scalpers, intraday traders, and swing traders who want a visual, volatility-aware way to mark potential trade areas based on key pivot structures.
How to Use:
Look for newly formed green zones for long opportunities and red zones for short setups.
Use the dashed lines as dynamic take-profit and stop levels, tuned to the current ATR value.
Combine with other confirmation tools or indicators for optimal results.
Profit Guard ProProfitGuard Pro
ProfitGuard Pro is a risk management and profit calculation tool that helps traders optimize their trades by handling position sizing, risk management, leverage, and take profit calculations. With support for both cumulative and non-cumulative take profit strategies, this versatile indicator provides the insights you need to maximize your trading strategy.
How to Use ProfitGuard Pro:
Load the Indicator: Add ProfitGuard Pro to your chart in TradingView.
Set Your Entry Position: Input your desired entry price.
Define Your Stop Loss: Enter the price at which your trade will exit to minimize losses.
Add Take Profit Levels: Input your TP1, TP2, TP3, and TP4 levels, as needed.
If you want fewer take profit levels, adjust the number of TPs in the settings menu. You can choose between 1 to 4 take profit levels based on your strategy.
Adjust Risk Settings: Specify your account size and risk percentage to calculate position size and leverage.
Choose Cumulative or Non-Cumulative Mode: Toggle cumulative profit mode to either recalculate position sizes as each take profit is hit or keep position sizes static for each TP.
Once set up, ProfitGuard Pro will automatically calculate your position size, leverage, and potential profits for each take profit level, providing a clear visual on your chart to guide your trading decisions.
Key Features:
Risk Management:
Calculate your risk percentage based on account size and stop loss.
Visualize risk in dollar terms and percentage of your account.
Position Size & Leverage:
Automatically calculate the ideal position size and leverage for your trade based on your entry, stop loss, and risk settings.
Ensure you are trading with the appropriate leverage for your account size.
Cumulative vs Non-Cumulative Profit Mode:
Cumulative Mode: Adjusts position size after each take profit is reached, recalculating for remaining contracts.
Non-Cumulative Mode: Treats each take profit as a separate calculation using the full position size.
Take Profit Levels:
Set up to 4 customizable take profit levels.
Adjust percentage values for each TP target, and visualize them on your chart with easy-to-read lines.
Profit Calculation:
Displays potential profits for each take profit level based on whether cumulative or non-cumulative mode is selected.
Calculate your risk-reward ratio dynamically at each TP.
Customizable Visuals:
Easily customize the table's size, position, and color scheme to fit your chart.
Visualize key trade details like leverage, contracts, margin, and profits directly on your chart.
Short and Long Position Support:
Automatically adjusts calculations based on whether you're trading long or short.

Profit-sync script for TrexenThere are various scripts and indicators on Tradingview, but not many of them combine theories to improve the profitability of an indicator using settings from multiple time frames.
This script takes the Average True Range trailing exit idea to enter trades. Many other ideas have been tested to filter entry signals which may be weak or not profitable such as a second ATR with Higher TF, MFI/VFI, RSI, Momentum wavetrend, Weis Wave, MACD, Stochastic etc, but I felt the following works best:
- Over the ATR entries there is a directional filter very similar to Renko candles which can be set to a higher time frame, I use 4 hour with 15 min candles for example, this will only allow 15 min buy signals to execute if the 4 hour is also on the buy side.
- There is also a Trend directional filter which can be set to a higher/lower time frame, currently I am using this on allow setting to allow more trades
The higher both filter are, the more accurate the trades will be, but less frequent. The filters convert entry signals into exit signal which can be used as take profit point with alerts if there is a position open.
The overall theory is to follow trend and to exit with profit. I have tested different take profit alerts but think it’s better to either catch a whole price move or sell with a set trailing limit order at like 0.4/0.5%.
As I am trading BTC with a bot and not with TA I think it is good to get in on a trend reversal, follow the trend up and get out quick with profit. There is a lot of manipulation with crypto so things like Momentum indicators and money-flow may not represent what is actually happening in the market.

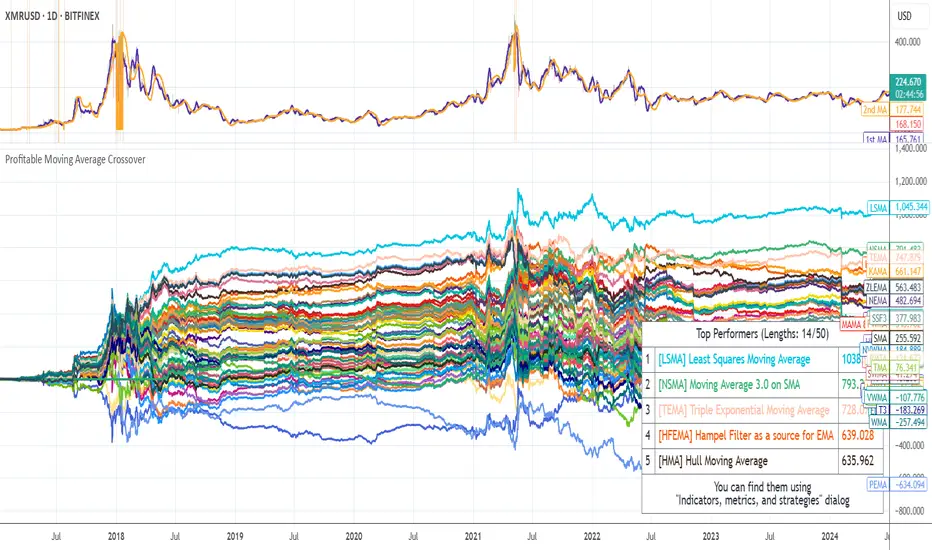
Profitable Moving Average CrossoverHello friends,
I'm glad to introduce a powerful research and optimization tool that takes the classic moving average crossover concept to a new level. Instead of relying on guesswork or fixed MA types, it lets you objectively discover the most profitable moving average pair for any instrument and timeframe.
🛠 How It Works
Moving average crossovers are among the most popular trading systems. A buy signal occurs when a shorter (faster) moving average crosses above a longer (slower) one, and a sell signal when it crosses below. The system's responsiveness — and the number of generated signals — depend on the chosen MA lengths and types.
This script evaluates 61 moving average types (including Jurik, Kaufman, Ehlers, Apirine, and others) and backtests all possible crossover combinations either across the entire chart history or within a custom backtest window . It then plots continuous profit metric lines for each crossover type and displays the top 5 performers in a results table. Each MA type is color-coded, allowing quick visual identification of which systems have historically delivered the strongest results.
🔥 Key Features
Pine Script V6 — optimized for performance and stability
Tests 61 moving average types , from classic to adaptive designs
Custom Backtest Window — analyze the entire history or a specific date range
Continuous profit curves for every crossover type plotted on chart
Top 5 crossover systems displayed in a compact summary table
Color-coded MA identifiers for fast visual comparison
Supports custom parameters for advanced MAs (JMA, ALMA, McGinley Dynamic, Adaptive Laguerre Filter, etc.)
Works seamlessly across all assets and timeframes
NOTE: Results will vary across different tickers and timeframes. Seeing strong performance in one preview does not imply similar profitability elsewhere — this variability is normal due to differing market structures.
NOTE 2: You can experiment with the tool independently or request a full study, in which case I'll share a spreadsheet of all backtest results with you.
👋 Good luck and happy trading!
Script pago
PROFIT ZONE PRO Profit Zone Pro:
ProfitZone Pro is a risk-reward indicator that helps traders identify trade setups, manage risk, and set profit targets. Designed for simplicity, this free tool generates entry, stop-loss, and take-profit levels based on support and resistance, Trailing Stoploss and built in automated alerts, with additional features to enhance trade planning, Along with a learning mode based on successful trades made
Features
Trade Setup Identification: Detects potential buy (long) or sell (short) entries using support and resistance levels, with an optional trend filter based on a 50-period SMA.
Risk-Reward Zones: Displays entry (yellow), stop-loss (red), and take-profit (green) levels, with shaded risk (red) and reward (green) zones.
Position Sizing: Calculates position size based on user-defined risk percentage and account balance.
Breakeven and Trailing Stop: Includes a breakeven feature to move the stop-loss to the entry price at a user-defined percentage of the take-profit distance, and an optional trailing stop to lock in profits.
Confidence Score: Provides a volatility-based confidence score (0-100%) to assess setup reliability.
Learning Adjustment: Adjusts stop-loss distances based on the number of successful trades entered by the user.
Info Label: Shows position size, risk, reward, direction, confidence score, ATR, trend direction (if enabled), and trailing stop status.
Alerts: Sends notifications for entry, stop-loss, take-profit, breakeven, trailing stop, and theme changes.
Customizable Display: Offers options for zone opacity, line styles (solid, circles, dotted), zone labels, and color themes (Light, Dark, Custom).
Long Mode Feature:
Short Mode Feature:
Trend Filter Feature:
Auto Trading Mode:
Usage Instructions
Add the indicator to your chart.
Adjust settings in the indicator’s properties:
Set Risk % of Account and Account Balance to define your risk and position size.
Choose Trade Direction (Auto, Long, or Short) to filter setups.
Enable Trend Filter to align trades with the market trend.
Turn on Trailing Stop and set Trailing Stop % of Reward to lock in profits.
Customize visuals (zone opacity, line style, colors) as needed.
Monitor the chart for entry (yellow), stop-loss (red), and take-profit (green) levels.
Use the info label to view position size, risk, reward, confidence score, and other details.
Set alerts for entry, stop-loss, take-profit, breakeven, and trailing stop events.
After a successful trade, increment Number of Successful Trades to adjust future stop-loss distances.
This Script is to help you have a better idea on those famous questions we ask ourselves:
Entry
Take Profit
Stoploss
The confidence score, R:R calculator, Trend Filter, Learning Mode further helps to zone in on accuracy
Happy Trading
- EZ ALGO


[ProfitTrailer:Feeder] Up Down VolatilityUpside & DownSide Volatility is commonly used in the ProfitTrailer:Feeder community scene, so I decided to create a script for it.
Please 'follow & like' if you like this script! Thanks

[ProfitTrailer:Feeder] Stochastics Just like RSI the Stochastics Indicator is very often used in ProfitTrailer:Feeder and therefore I decides to create this script so people can easily test/tryout there specific inputs.
Note: Because there's a difference (in outcome) between the calculation function from TV and the traditional calculation (used by ProfitTrailer) I created an option to select the kind of calculation you prefer.
Enjoy!

[ProfitTrailer:Feeder] RSIBecause RSI is so commonly used in creating strategies for ProfitTrailer:Feeder is decided to translate this indicator to PineCode so you can test your settings based on the variables PTF offers.
Please let me know what you think and if you consider this kind of content valuable please 'like & follow' me.
Enjoy and thanks in advance!

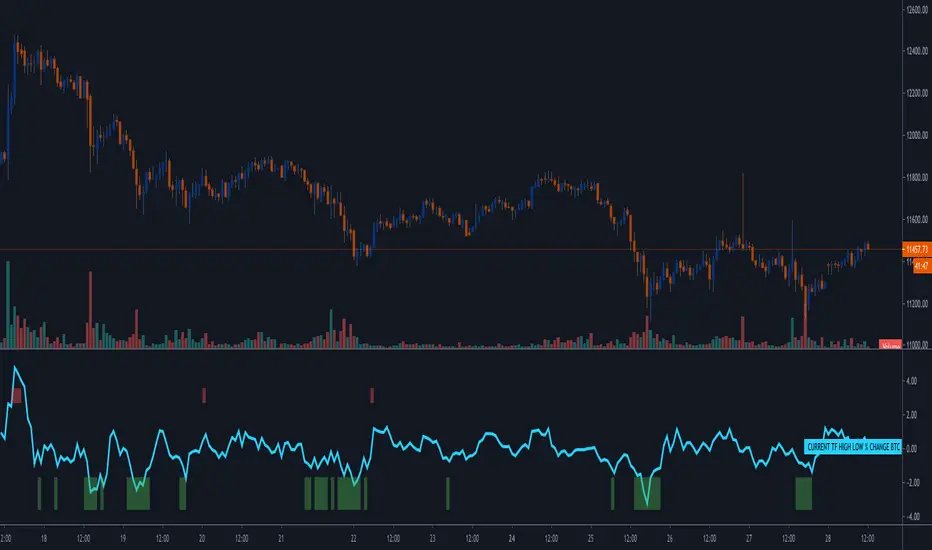
[ProfitTrailer:Feeder] High/Low % ChangeThis script was created to help people determine which HighLowPercentageChange settings work for them in the ProfitTrailer bot as well as set specific groupings in PTFeeder. For more in-depth knowledge on how it's calculated/works I would advice you to visit the ProfitTrailer and/or PtFeeder wiki pages. Massive thanks to NigglesSquiggles for creating the first version!
If you have any questions, please just let me know! Enjoy
[ProfitTrailer:Feeder] ATRThis script was created to help people determine which ATR settings work for them in the ProfitTrailer bot as well as set specific groupings in PTFeeder. For more in-depth knowledge on how it's calculated/works I would advice you to visit the ProfitTrailer and/or PtFeeder wiki pages.
If you have any questions, please just let me know! Enjoy

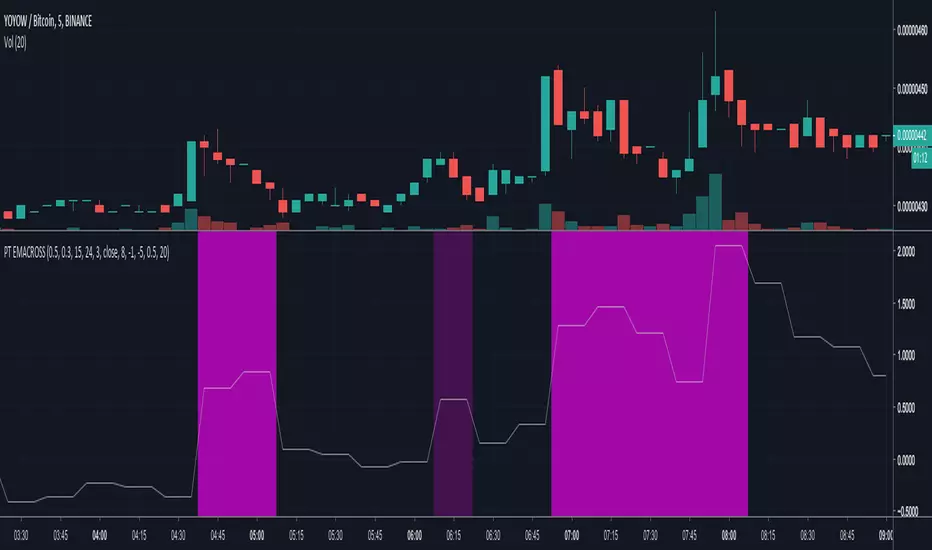
[PT] SMA Cross Buy/Sell studyProfitTrailer study for SMA Cross buy/sell strategies.
The script highlights the regions where trailing is most likely to succeed.

[ProfitTrailer] EMA Cross StudySupport buy/sell parameters for EMACROSS strategy.
The script highlights the regions where trailing is most likely to be successful.