MA trading tool v1.0Background to the tool
The tool was built out of frustration. Having traded for many years with a reasonable level of success I was always frustrated that my trading never went up a level. The world of trading is filled with people having so much more success than me and this level of FOMO really bothered me and resulted in inconsistency and countless hours sitting in front of a screen, hoping for the best. I also became a little bit of an indicator junkie - was there a holy grail indicator out there for me? I always felt that as a retail trader I was behind the curve. I started to investigate how the major market participants trade and make money and I was astounded at the level of success that they get from creating strategies and sticking to it. The market is driven largely by a "black boxes" which, for us retail traders are outside of our ability to access. I wanted to build a tool that could give me a traders edge.
Another factor that has always bothered me was when reading investing books there is a general assumption that a standard entry, say 8/13 cross over, works on all stocks. However, it is not the case and it can be frustrating for a trader using a set up and not realizing that the set up was/is the problem, not the trader. This realization alone has made a huge impact on my trading. The big boxes that control the market know this already.
Also, a lot of indicators that are available don’t take advantage of the backtesting capability provided in Tradingview. It is fairly simple to find 8-9 trades where a set up worked and then fall into the trade of assuming that it cannot fail. Knowing which set ups work and how frequently it will print will change the way that you trade.
The goal with the tool is to identify setups that have worked in the past with a high degree of profitability, high profit factor and low drawdown and using the planning tool allows you to customize the setup to find exactly what you are looking for across any tradeable asset on TradingView.
Over the past 20 years I have realized the following:
1) Not all entries and signals work the same on all stocks and knowing the historical performance of a strategy is critical
2) Not having a plan in advance lowers your probability of success
3) Developing consistency in analysis is critical
4) Developing confidence in your own plan is more important than whose trades you try to copy
5) Having 30 indicators does not help you trade better - it leads to more frustration
So here is the product of these realisations:
1) The tool looks across the most common entry strategies (RMA / EMA/ SMA/ HMA/WMA cross on 5 dimensions of type and 5 common crossovers) and can be used on 19 different time frames giving you guidance on what the best set up is for the stock you are analysing
2) It incorporates volatility into the strategy – when stocks are trading outside of a predetermined volatility band, a trade will not be entered. This accommodates traders who tend to get shaken out of trades too early.
3) It looks at the impact of “buying the dip” – often a common strategy employed by many traders which now can be backtested and reviewed to see if it actually helped or hindered the trade.
4) It measures your trade plan against your R – what you are willing to risk – and calculates your target profit based on your R multiple
5) It provides a non repaint signal on your base strategy and provides you with signals to trade smaller or shorter signals within the bigger strategy.
There are some additional visual tools:
• Squeeze signals - I am a big fan of the TTM squeeze however the Squeeze by itself can be hard to trade. Seeing a squeeze fire long on a chart can add to trade confidence.
• Seeing zones of support and resistance rather than single lines can also give you some leeway in terms of not getting pushed out of a trade too soon.
The backtester is always reviewed on a 2 to 3 year period to get an understanding of win rate %, profit ratio and average duration of trade. As an option trader knowing that a high probability move is playing out allows me to make sure that I don’t undercut the time frame for the expiration of the option relative to the historical average duration of a trade. Backtesting on shorter times is unrealistic.
Key benefits
1) It will save you a ton of time. I don’t have to sit in front of a screen watching ticks each day. I can plan for an entry, set an alert for a trade and when the conditions are met the TradingView system sends me a message and I will go and confirm a trade, execute it, set my alerts for control and move on with my life.
2) It allows me to review trade ideas in a consistent manner using the best trade plan and set up for a stock.
3) It forces me to be patient and not panic (always a good thing). With an adjustable volatility feature I can modify the volatility band in the trade plan to accommodate choppy market conditions.
4) It looks at both sides of the market (long and short) and you can calculate the impact of being market neutral or having a directional bias.
I hope this tool helps you to achieve some degree of peace in your trading.
To get access to the tool, please contact the author.
Pesquisar nos scripts por "profit"

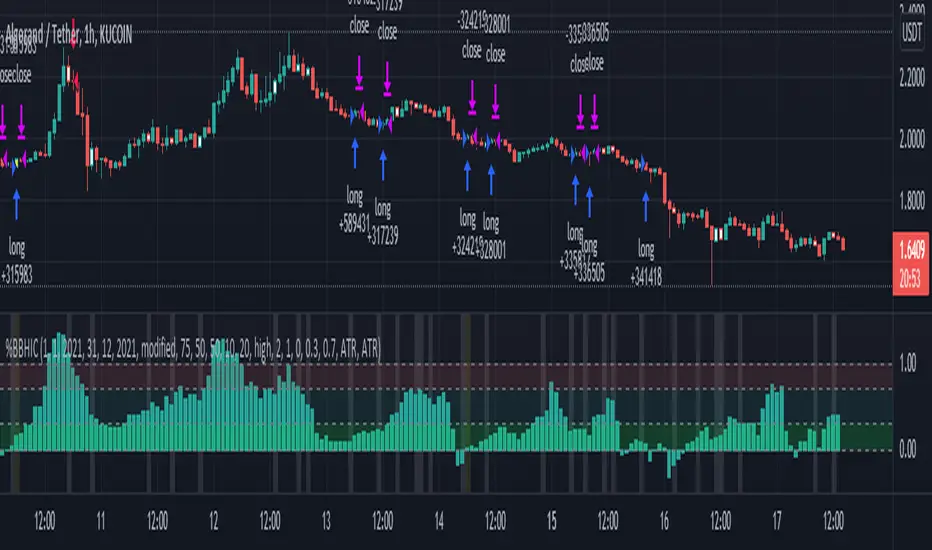
Bollinger Bands %B - Belt Holds & Inner CandlesThis is a simple strategy that uses Bollinger Bands %B represented as a histogram combined with Candle Beltholds and Inside candles for entry signals, and combines this with "buy" and "sell" zones of the %B indicator, to buy and sell based on the zones you set.
How to use:
Long when in the green zone and an inside candle (which is highlighted in white) or a bullish belt hold (which is highlighted in yellow), and sell when inside a red zone and has an inside candle or a bearish belt hold (which is highlighted in purple) or the stop loss or take profit is hit.
Short when in the red zone and an inside candle (which is highlighted in white) or a bearish belt hold (which is highlighted in purple), and sell when inside a green zone and has an inside candle or a bullish belt hold (which is highlighted in yellow) or the stop loss or take profit is hit.
Stop loss / take profit selection:
Choose which performs best for you, ATR based uses the average true range, and % based is based on a set percent of loss or profit.
WaveTecs StrategyWelcome to the Backtesting version of "WaveTecs Strategy", the indicator itself is an invite-only script called "WaveTecs Indicator" on TradingView.
WaveTecs Strategy
WaveTecs is a Strategy that combines Wave Trend Oscillator and verifies wave momentum by using RSI and Stochastic Oscillator Values.
What is Wave Trend?
One of the most effective indicators in identifying swings is the Wave Trend indicator. Wave Trend plots waves using highs and lows between an upper band and a lower band. It looks for the opening and closing of a new wave trend movement as well as overbought and oversold areas.
How does this modified strategy work?
By using RSI and Stochastic values we are able to verify Wave inflection points to determine if there is a suitable amount of momentum to ride the swing and make profitable trades. Positions are taken or closed based on the rising or falling momentum.
Each value input can be adjusted to best suit the type of market you are trading in. By using the strategy we can optimize these value inputs to yield greater net profits. I have found the RSI and Stochastic values hugely impact entries and exits regarding trades.
For Long conditions:
- RSI & Stochastic needs to be increasing and moving out of oversold conditions to show positive momentum.
- Falling momentum results in a sell signal. I have found RSI less than 65 to be sufficient in most markets however this can be adjusted at any time to yield different results depending on your comfort level.
For Short conditions:
- RSI & Stochastic needs to be decreasing and moving out of overbought conditions to show negative momentum.
Generally, Wave Trend Strategies only take trades that are outside of the bands. This strategy allows trades inside and outside of the bands, which can be selected under the input section title "Aggressive Trading". Trading in this mode is more frequent as signals are often. Due to volatility in crypto markets, I have defaulted the source for Wave Trend waves to be Open/High/Low/Close Average which yielded great results. High/Low/Close average works very well for all other securities, and can easily be adjusted through the drop-down menu inside the inputs.
Works for all types of markets. Parameters can be adjusted but not required as indicator values are standard in the industry.
The default parameters are set to those typically used in the markets currently. However, I have found that if you adjust you to adjust the parameters based on your asset and time frame desired you will yield different results.
----------------
For example:
----------------
ETHUSDT - 4 HR, results are shown below
Wave Trend Parameters:
Aggressive Trading: Yes
Channel Length: 12
Average Length: 24
Overbought Top: 90
Overbought Bottom: 75
Oversold Bottom: -90
Oversold Top: -55
Source: hlc3
Strategy Type:
Trade Direction: Long Only
Stochastic Inputs:
Stoch Length: 18
Smoother %K: 5
Moving Average %K: 4
%K Lower Limit: 21
%K Upper Limit: 80
%K Crossunder Sell: 80
Relative Strength Index Inputs:
RSI Lower Limit: 30
RSI Upper Limit: 70
RSI Sell Value: 68
==================
WaveTecs Features
==================
Profitable Trading Strategy;
Aggressive Trading feature for more trades, with earlier entries and exits;
Customizable inputs to fine-tune your trades;
Buy & Sell Alerts (Indicator Only);
Overlay indicator only to show alerts, WaveTecs Strategy needed to see Wave Trend;
Bot Integration through webhooks;
Two different strategy modes: Long Trades Only or Long & Short Trades
Adding new features & updates whenever possible.
Add both WaveTecs Indicator and WaveTecs Strategy to your chart. WaveTecs Indicator only plots Buy & Sell Alerts, whereas WaveTecs Strategy lets you see what the strategy is doing.

DI Crossing Daily Straregy HulkTradingSimple strategy based on crossing DI+ and DI- and Average True Range.
Long entry when DI+ crossover DI-
Short entry when DI+ crossunder DI-
Stop Loss and Take Profits based on Average True Range.
Default values are 1*ATR(14) for stop loss and 2*ATR(14) for Take Profit.
Risk reward 1 to 2 ratio.
Recommended default values, but you can change it if you want.
Recommended timeframe - 1D.
Script was tested on BTCUSDT pair and have a 2.4 profit factor.

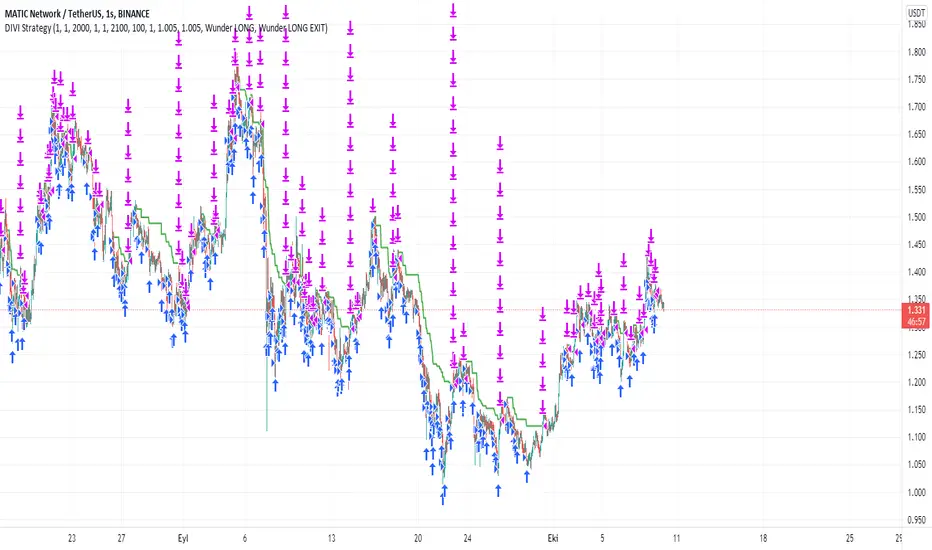
DIVI Wunder StrategyAs it is known, divergence is a situation we encounter very often on graphs. Various divergencies may occur according to many indicators. MACD divergence, RSI divergence... In the strategy I use only positive divergence. What is positive divergence I will explain on MACD positive divergence A MACD positive divergence is a situation in which the MACD does not reach a new low, despite the fact that the price of the stock reached a new low. This is seen as a bullish trading signal—hence, the term “positive divergence.” So I thought of these divergencies and came up with a new strategy. Combining the divergencies with the VOLPIN strategy I wrote earlier, a great strategy has emerged. When the divergence signals are came from MACD,RSI,CCI,OBV,Chaikin Money Flow, VWmacd and Money Flow Index all these indicators I sent a buy signal until the 40 times completed. ThenI sent to sell signal when the price come to take profit level. In this strategy, you divide your principal into as many parts as you want. For example, let's say that you have 1000 dollars of money and you make purchases by dividing this money into 40 equal parts in the default settings of the indicator. $25 per purchase. After each purchase is made as 25 dollars, you can adjust your profit rate from the profit taking settings. When you look at the results of the strategy, your profit rate will be very high. I usually use this strategy in one hour periods. Of course you change it whatever you want. Also change all settings from panel to get more profit. Have fun :)
Smart Entry BETAA Custom Unique indicator by NRTH_
Comes included with the Premium Package.
Indicator features
Built-In Alerts
Visual Risk Management
Customizable Entry Rules
Usage Tips
Smart Entry is currently a BETA algo. we are still in the process of tweaking and programming it only give entry signals when they are confirmed, and work of very strict parameters to allow for trading all the way down to the 5m timeframe. It is currently at a stage where it can produce profitable trades or even just act as a confirmation signal in use with another strategy, but this project will be ongoing until we can obtain high profitability levels on very low timeframes.
The algo uses both momentum and trend calculation to find an entry, highly recommended use with the built-in MA Filter for best results.
Works for all markets with the ability to customize to your liking.
Backtesting Results Info
Period 1/1/2021-1/10/2021
Entry value at $1000 with 10x leverage
Binance standard taker fee rate (0.04%)
ATR Exits : 1:2.9 RR
-------------------------------------------
Disclaimer
Copyright NRTH_ Indicators 2021.
NRTH_ and all affiliated parties are not registered as financial advisors. The products & services NRTH_ offers are for educational purposes only and should not be construed as financial advice. You must be aware of the risks and be willing to bear any level of risk to invest in financial markets. Past performance is not necessarily indicative of future results. NRTH_ and all individuals associated assume no responsibility for your trading results or investments.
All investments involve risk, and the past performance of a security, industry, sector, market, financial product, trading strategy, or individual’s trading does not guarantee future results or returns. Investors are fully responsible for any investment decisions they make. Such decisions should be based solely on an evaluation of their financial circumstances, investment objectives, risk tolerance, and liquidity needs.

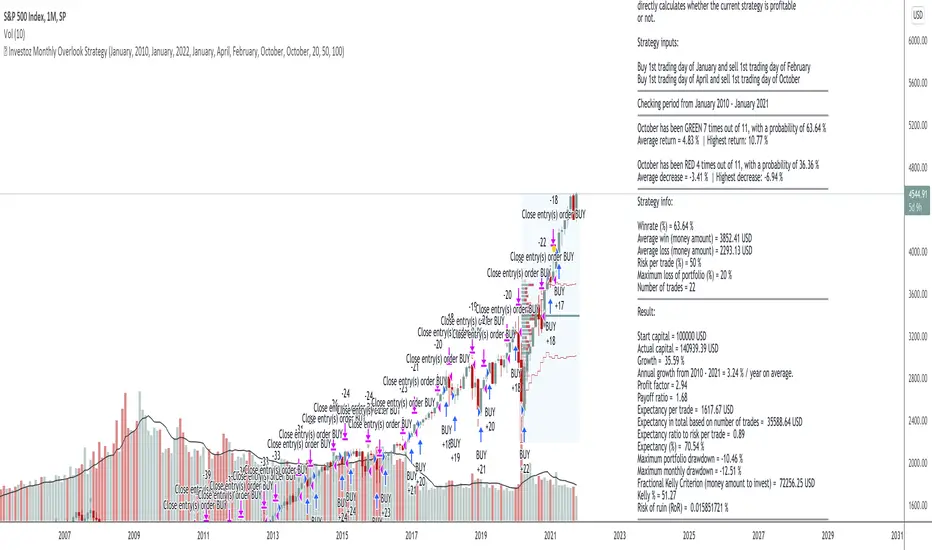
© Investoz Monthly Overlook Strategy“The best time to get involved with cyclicals is when the economy is at its weakest, earnings are at their lowest, and public sentiment is at its bleakest.”
Peter Lynch
Before I begin, read the following.
Important! The script for this strategy is only intended to work correctly for the monthly time period and does not work for other time periods, as it is based on monthly data.
The strategy
This strategy is simple and based on monthly buy and sell. However, the strategy is only intended to go long and no short positions are therefore possible.
This strategy is perfectly suited for all indices, but also for cyclical companies and cyclical markets.
Monthly analysis
You do not need to use this strategy for a buying signal only. You can use this for a more comprehensive analysis of how return per month has looked historically. It's easy to analyze, by flipping through all the months of the year. You will see average return per month, but also the largest return and decrease for each individual month.
It is also possible to choose between which time periods you want to analyze. You can go all the way back to the year 1900.
This is necessary if you are going to analyze markets that have a long historical data to analyze.
How it works
1. Start by choosing which time period the analysis or strategy should apply between.
2. Choose which month the first and second buy will be valid from. Here it is important to know that depending on which month you choose, is meant a buy after the current month's closing.
Example: 1 = January. Buy will therefore be after January closes, ie the first trading day in February. It will be displayed as 1st trading day in February. If you only want one buy option, then choose the same month for both first and second buy.
3. Choose which month the first and second sell will be valid from. The same applies here as above.
4. Choose money management according to the criteria that suit you and press "OK".
Result
Based on the choices you have made, you will now get a result of how the strategy has performed over the given period. You will be able to read following data.
Data
Start Capital -the trading capital you have from the beginning.
Actual Capital -the current trading capital you have at the moment.
Growth -percentage growth over the total trading period.
Annual growth -average return for the chosen period.
Profit factor -the profit factor looks at the total gains and losses.
Payoff ratio -looks at the average profit and loss.
Expectancy per trade -the expected profit or loss of a single trade.
Expectancy in total based on number of trades -the expected profit or loss for all the trades made.
Expectancy ratio -the power of an edge. With this, you are always looking for a positive expectancy to show you that the trade is profitable.
Expectancy % -the expected return in percentage based on all the trades
Maximun drawdown -drawdown for a single trade based on current trading capital
Fractional Kelly Criterion -the optimal amount to invest based on the strategy and multiplying it by a certain fraction (%). This results in less volatile returns and a lower chance of the account balance hitting zero.
Kelly % -percentage of capital to be put into a single trade.
Risk of ruin -the chance that you will lose all the amount you typed in for "Maximum loss of portfolio".
Conclusion
It is important to know if you have an edge in your strategy and above all to understand risk. With the help of all this information, it will therefore be easier to adapt the risk to the strategy, not the other way around. This approach applies to all types of strategies. Be aware of the risk, first!
=============================================================================================================================================================
DISCLAIMER
Any data and information is provided 'as is' solely for informational purposes, and is not intended for trading purposes or advice. Past performance is not indicative of future results.
Educate yourself on the risks associated with trading, and seek advice from an independent financial or tax advisor if you have any questions.
=============================================================================================================================================================
SQZ Multiframe StrategyThis is a first attempt to automate what my current strategy when trading is.
It uses 2 timeframes: the one you are currently using to see the chart and an "anchor trend" which is a higher order frame.
Supported timeframes are: 1m, 5m, 15m, 30m, 1H, 4H, 1D, 1W
The Strategy relies on two indicators:
Squeeze Momentum Indicator
CMF
How does it works?
It looks for a moment when the following conditions are met.
For Long:
Positive directionality in SQZM monitor in anchor timeframe
Positive directionality in SQZM monitor in current timeframe
Recent minimum in CMF
For Short:
Negative directionality in SQZM monitor in anchor timeframe
Negative directionality in SQZM monitor in current timeframe
Recent maximum in CMF
After a BUY or SELL order is executed the plot will start showing two lines: A TP line, and a SL line.
The TP and SL move dynamically based on a greedy algorithm based on 3 input parameters.
Min Profit to Start Moving SL (%): Sets an initial target for the trade.
Maximum Possible of SL (%): This is the maximum amount possible for SL. If volatility is not too high, a shorter SL will be chosen based on Kaufman's Stops method
Take profit factor: Is how much portion of the target I am taking as profit once the target is reached
Example for 5% Min profit:
When the first target is reached (+5%), the SL will be updated to 2.5% over the enter price.
When the second target is reached (+10%), the SL will be updated to 5% over the enter price.
Note: The strategy might abandon the position prematurely if a contrary signal is received while the trade is opened, and will change direction.
The Strategy has been backtested mostly for crypto. It might be good for stocks too, but the parameters mentioned might need some adjustments since price moves at a different rate.
Recommended timeframe is 4H for BTC , and 30min/1H for alts.
Comments and ideas are more than welcome!

Qullamaggie Breakout V2After publishing the Qullamaggie Breakout script and seeing that it had some decent results, I wanted to explore it a bit further. There were a few things I didn't like about that methodology that didn't really jive with the way I like to trade. So what I did was combined the Breakout Trend Follower strategy I had been using for entries with the Qullamaggie strategy for trailing stops once in profit. The results seem pretty good to me and an approach that fits my personality and something I can actually trade. Typically better profit than the Breakout Trend Follower by giving more room for your winners to run, while still protecting your entries by moving up the trailing stop until you are in profit, all while taking less trades, so that's great.
Everything is done with stop orders. So you set your buy stop at the recent swing high point and wait for a breakout. Once in a position you set your sell stop at the recent swing low point. The most recent swing high and low are shown on the chart for easy reference with the blue and orange horizontal lines. Once in a trade, trail your sell stop after a new swing low is registered (shown by the thicker orange stop line). Once you are in profit, leave that hard stop level there (the orange line will stay there helping you). Now, you wait for price to cross a Moving Average of your choosing (default is Daily 10 MA). Once the bar crosses that moving average, you move your stop to the low of that candle (shown by the blue stop line) and trail your stop along every crossing of the moving average until the trend changes and takes out your stop. So managing this trade is pretty easy...just wait for the stop lines to move and move your stop with them. It's a great way to trade when you can't be at your computer all the time because the stop orders take care of execution on both buy and sell side. If you use a daily timeframe for your moving averages (the default), you really only need to move stops around about once a day, so is a good part time trader's strategy in my opinion.
The best opportunities will come by scanning for stocks in the longer term timeframe of your moving averages. Wait for a consolidation on that timeframe so the anticipated breakout has some room to run. Once you've identified a good candidate, zoom in to your lower timeframe where the swing highs/lows will act as your entry and exit points, all while keeping the moving averages consistent between timeframes.
Hope you guys find it useful.
A few options available:
- Choose any timeframe for your moving averages, while using swing high/low points on intraday charts.
- Choose one of two moving averages shown for your trailing stops (default 10 and 20 MA).
- Choose to use the third moving average as a filter for keeping you out of trades that are below it (trading with the trend).
- Use the charts resolution candle or the moving average resolution candle for the moving average trailing stop.
- Only take trades where your buy level minus stop level is below a % of the Average Daily Range (ADR). This allows you to potentially have better risk/reward. I added a little table that shows the ADR of the stock/ticker as well as the range between the recent buy and sell levels (shown by the orange and blue horizontal lines) for easy reference.

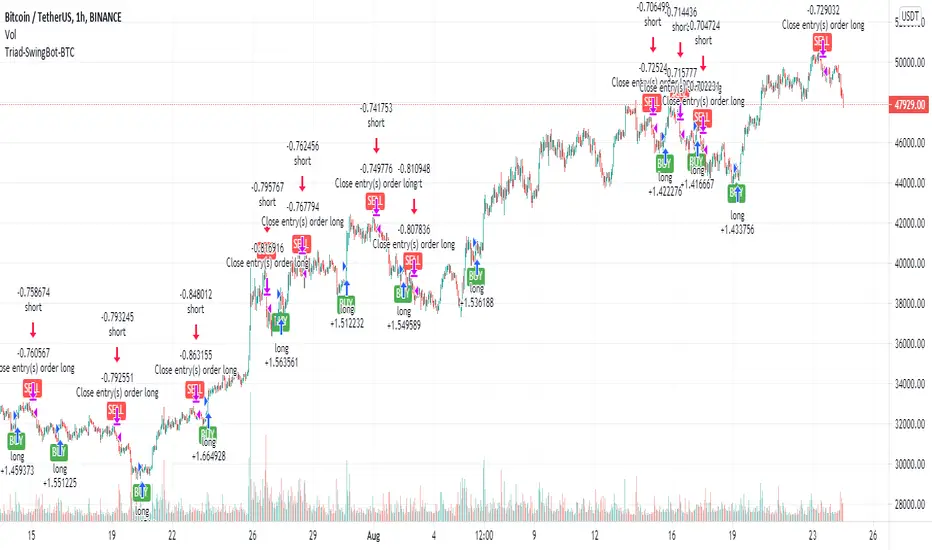
Triad-SwingBot-BTCStrategy tuned for BitCoin . The indicator version of this uses alerts to start a long or short DCA 3comma bot. Preferably running on futures exchange so I can go long or short and use 5x margin. Alerts also take profit/close position when trend changes.
KYC crackdown is leaving me limited places I can run these now.
Use this on Binance BTC /USDT 1HR chart. Binance seems to give the best data even when trading from other exchanges.
There are various versions of these I might release tuned to each cryptocurrency. I have about 20 different coins that were profitable. Each work best with different settings.
This strategy uses a variety of factors to determine long and short entry including:
-Price is starting to trend up (long) or down (short)
-Price closing above/beneath specified EMA or SMA
-Price within RSI bounds for valid entry
-MACD histogram is positive(long) or negative (short)
-Volume surge indicating viable entry
If there's decent interest in the indicator version of this with alerts to send long/short signals to bots, I'll work out an invite-only system.
8 Whittle DownThe system is designed to short on directionally negative instruments like VXX & SQQQ
The system only shorts, no longs
It enters a pilot position if the system has no trades open at the time is in the late afternoon
It uses a 200-day moving average as a filter and will only short if the price is below the 200 day moving average
The pilot position will only enter with 1/3 ( one third ) of the total expected position size
StopLossPerc sets the stop loss, (1.15) means it is set to a 15% stop loss. -- The Red Line
The system will buy additional shares for a full position if the pilot piston profit target was not reached
The full shares position is set to purchase at a higher price. T2EntTrgPerc sets the buy percentage target for the additional shares. -- The Yellow Line
Each entry has different settable profit targets. T1ProfTrgPerc sets the profit target for the first trade (0.95) is basically set to a 5% profit.
T2ProfTrgPerc sets the profit target for the second trade (0.90) is basically set to a 10% profit. -- The White Line
RED LINE == STOP LOSS LINE
GREENLINE == PROFIT TARGET FOR THE 1ST TRADE
YELLOW LINE == ADD ON SHARES TO THE TRADE
WHITE LINE == PROFIT TARGET FOR THE 1st & 2nd TRADE COMBINED
Let me know if you have any questions and I'll try to clarify

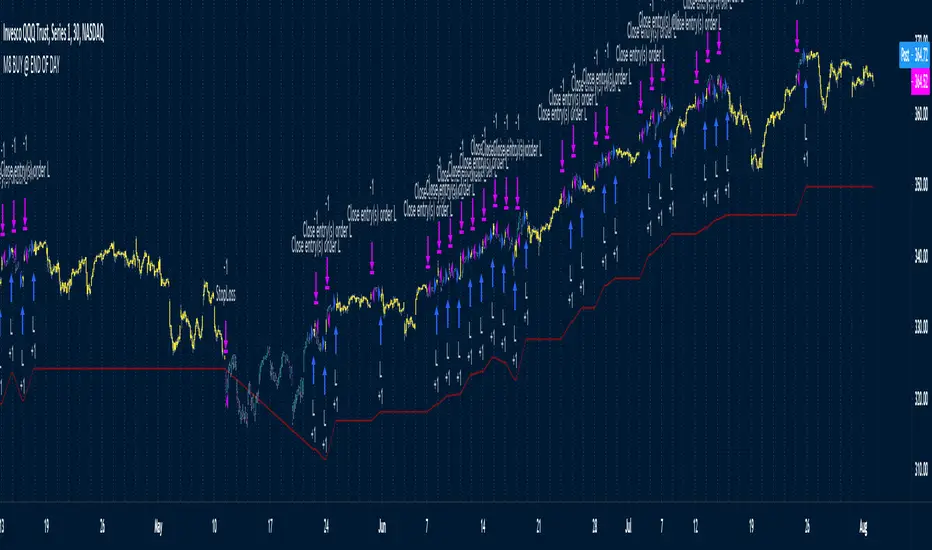
M8 BUY @ END OF DAYI've read a couple of times at a couple of different places that most of the move in the market happens after hours, meaning during non-standard trading hours.
After-market and pre-market hours and have seen data presented showing that systems which bought just before end normal market hours and sold the next morning had really amazing resutls.
But when testing those I found the results to be quite poor compared to the pretty graphs I saw, and after much tweaking and trying different ideas I gave up on the idea until I recently decided to try a new position management system.
The System
Buys at the end of the trading day before the close
Sells the next morning at the open IF THE CLOSE OF THE CURRENT BAR IS HIGHER THAN THE ENTRY PRICE
When the current price is not higher, the system will keep the position open until it EITHER gets stops out or closes on profit <<< this is WHY it has the high win %
The system has a high win ratio because it will keep that one position open until it either reaches profit or stops out
This "system" of waiting, and keeping the trade open, actually turned out to be a fantastic way to kind of put the complete trading strategy in a kind of limbo mode. It either waits for market failure or for a profit.
I don't really care about win % at all, almost always high win % ratio systems are just nonsense. What I look for is a PF -- profit factor of 1.5 or above, and a relatively smooth equity curve. -- This has both.
The Stop Loss setting is set @ .95, meaning a 5% stop loss. The Red Line on the chart is the stop loss line.
There is no set profit target -- it simply takes what the market gives.
Non-Repainting System
This does use a 200D Simple Moving Average as a filter. Like a Green Light / Red Light traffic light, the system will only trade long when the price is above its 200 Moving average.
Here is the code: "F1 = close > sma(security(syminfo.tickerid, "D", close ), MarketFilterLen) // HIGH OF OLD DATA -- SO NO REPAINTING"
I use "close ", so that's data from two days ago, it's fixed, confirmed, non-repainting data from the higher timeframe.
-- I would only suggest using this on direction tickers like SPY, QQQ, SSO, TQQQ, market sectors with additional filters in place.
RSI Hidden Divergence + Stochastic + 200 EMA @DaviddTechHey Traders,
This is my first strategy of many I hope. Inspired by a strategy I found on YouTube I wanted to see if it would work with a BOT strategy.
The idea is :
## LONG ##
* When the price is above 200 EMA take only LONG positions.
* Look for Bullish hidden divergence.
* Stochastic crossover to find our entry.
## SHORTS ##
* When the price is below 200 EMA take only SHORTpositions.
* Look for Bearish hidden divergence.
* Stochastic crossunder to find our entry.
You can used a fixed percentage, ATR, HH/LL or a FIB level to take profit.
Everything is very visual and can be connected easily to a bot.
I will be doing a video on HOW-TO setup in a couple of days.
## MUTLI LEVEL PROFITS ##
This will show you on backtest is you take profits at 3 levels however I have not tested on a BOT strategy.
NOTE : This is for educational purposes and please test on a paper account, as I said this is my first strategy.
I will be working and back testing new strategies every week.
- Made with ♥ @DaviddTech

Scalper Helper System===========================================================================
===========================================================================
Description
===========================================================================
===========================================================================
Scalper Helper System combines a series of trade strategies which have been learned and honed in the Jim of All Trades channel.
Paixy has contributed candlestick combination rules, Jonas has shared his deep understanding of Stochastic.
Jim himself has taught clearly on the merits of RSI.
This system attempts to formulate all the notes and rules I have made over the past months.
The system searches for 10 - 15 rules which are divided into bullets and bombs. Bombs relate to momentum, so these signals may not be pinpoint accurate, but they are more often leading to bigger moves.
This initial version is released mainly only to the JOAT community to help continue the development of the idea and to help find
continued improvements.
Special thanks to FiendishFeather for his strategy work, (check out his work to learn how to apply any trading strategy to his back testing harness), and the date filtering snippet and the tip to show this option at the top.
===========================================================================
===========================================================================
The strategy decisions are based on the following general rules:
===========================================================================
===========================================================================
BULLETs are hint to the idea of firing a small sized position into the market, BOMBs are hints to go all in - however this does not mean proper risk management should be forgotten.
Without risk management this and any strategy will lead to failure.
Without risk management this and any strategy will lead to failure.
Without risk management this and any strategy will lead to failure.
Without risk management this and any strategy will lead to failure.
===========================================================================
Bullet1 uses the value of the stochastic and checks for buy/sell cross over on 5m, 8m and 13m chart.
These values should be calculated on a ratio basis ideally.
Bullet2 measures divergence between the printed Stochastic signals.
Bullet3 has been decommissioned.
Bullet4 is an RSI divergence and value indicator.
Bullet5 has been decommissioned.
Bullet6 uses the history of the stochastic buy and sell signals
Bullet7 uses the Scalper Helper Trends for entries by attempting to see how the overall trend is changing. More refinement is needed here.
Bullet8 uses the Scalper Helper Trends on multiple timeframes for entries.
Bullet9 strict buy/sell signals from Stochastic RSI
Bomb1 relies on the Fast, Medium and Slow MA's being correctly lined up as well as the Stochastic, this hints at a more imminent move and so the strategy suggests a quicker entry.
Bomb2 relies on the Fast, Medium and Slow MA's NOT being correctly lined up as well as the Stochastic, and therefore has the luxury of suggesting Limit orders near the local high/low.
Bomb3 looks for two or more Stochastics signals in the same direction and then performs a divergence calculation.
Bomb4 looks a change in the Stochastics signals direction and then performs a divergence calculation.
===========================================================================
===========================================================================
Configuration settings:
===========================================================================
===========================================================================
Users can chose to show mainly buy and/or sell signals and can select a level of strictness. Enabling strict rules will force a multi timeframe comparison of Stochastic analysis.
Users can try different levels for long and short targets for profit and stop loss. This is important because the market does not behave the same going up as it does going down.
The RSI conditional check makes the strategy more selective. This discernment can be applied to bullets or bombs in order to validate entry and exits.
During the bull run and perhaps even in ranging markets, the RSI overbought levels is usually 70-80, but in the bear market we are seeing in Crypto now, a value of 60 is more useful. Try for yourself to see what works for you and feedback in the comments.
An additional indicator, Scalper Helper Trends is recommended to get a quick view on the trend condition (rally, base, down) by viewing the MACD from multiple time frames. Further research is required to know which larger timeframes work best here.
For the 15min chart, 15m, 30m, 45m, 60m, 120m, 240m, 360m, 960m would work well. Note it is not possible to go higher than 1000 at this time.
Whether you use the Scalper Helper trends or not for your own visual confirmation, it is possible to allow this indicator to attempt to read it for you. More research is required to best model the reading of this. For now, it will simply measure the gradient of the number of up versus down colors.
The system can also find entries off the Scalper Helper Trends - but really this, by design is not the best use of Scalper Helper Trends. Although you may prove me wrong so the option is given for you to find buy/sells with your own testing.
Users can chose to use some engulfing candle arrangements to trigger exits and define the length of the 200MA and decide if this should play a part in the filtering of the signals. Similarly, a check can be made to ensure that the first two candles after a signal are behaving as we would expect with the "Wait for 2 closing in the direction of the signal" option. This has a lot of value on the 1min chart.
When Revenge trade is set to true you may re-enter a trade in the same direction as the last one when the last one was stopped out, otherwise you would only be looking for trades in the other direction. We all should not revenge trade, and indeed I have only seen a few cases when it has increased the profitability, however this option remains for now.
The flip opens a new trade in the reverse direction when a signal is given to close a trade, but does not apply to scenarios where stop losses or take profit closed the trade.

AZ V.3 Test ++Position Size Fix+Float
Core Concept
This Strategy is Base on EMA Cross
But thing what make this strategy be different from original CDC Action Zone V.3 is "Position Size"
Compound Profit & Not Compound Profit Strategy
Position Sizing Concept
Be real.Everyone know the key of survive in the Market is "Risk & Money Management"
So, How can we manage our Risk and Money?
Yes, The key is " Make the Risk celling "
////////////////////////////////////
//// (Risk% * 100) / Stoploss % ////
////////////////////////////////////
How can we make the Risk celling?
1. Define your Risk Per Trade for you. (How much % money of your portfolio are you willing to pay for this trade?)
- Example -
- I Have 3,000$ in my portfolio.
- I think i can take the risk per trade for my trade 2.5% of my portfolio. (75$)
- I calculate the Position Size of my trade to pay 2.5% of my portfolio when i need to stoploss. (75$)
- And then, I have 97.5% of my fund (2,925$) for fight in next trade.
- ***** So, I'll never lose a big money of my fund. And "SURVIVE" in long term. *****
2. Mark the "Entry Point" and "Stop Loss Point"
- Example -
- I have a Entry Point at price 30,000 $
- I Make the "Hard Stop" at previous low 11 Bar. (Hard Stop = When the price went lower from this point, We Sell this position without any pity)
- For example. I assume the previous low is 20,000$
- I Clac. the different % from Entry to Stoploss. (33%)
- ***** So, If the price went low from Entry Point -33%. I'll stop this position. *****
3. Calculate my position size.
////////////////////////////////////
//// (Risk% * 100) / Stoploss % ////
////////////////////////////////////
- In the past 2 Example.
- We have Risk% = 2.5%
- We have Stoploss% = 33%
- So, We clac. >>
- 7.575757 >> 7.5 % of my Portfolio
- 7.5 % of my Portfolio = 225 $
- ***** When my position Dropdown I'll lose for this trade and survive to fight in next trade. *****
Compound Profit Concept
We calculate the base equity from
Normal People use this.
Not Compound Profit Concept
We calculate the base equity from
If we have some profit. We use this profit for "Reserve" the loss in next trade.

Maximized Scalping On Trend (by Coinrule)" The trend is your friend. " This is one of the most famous and valuable teachings that experienced traders can give to newbies. There is a reason for that.
No matter your views about where the price moves, what matters is where the price heads to . The market is always right, and ultimately it decides who gets the profit and who has to take a loss.
The purpose of this strategy is to spot when it's the most suitable time to buy an asset profiting from a potential short-term price increase. The strategy tends to open trades frequently, closing them on average in one and a half days.
ENTRY
The buy order is placed on assets that present strong momentum when it's more likely that it is about to increase further in the short term.
To capture momentum on the asset, the rule strategy requires:
the MA50 greater than the MA100
the RSI greater than 50
The rule, then, places the order when
The price crosses above the MA9.
EXIT
This strategy comes with a stop loss and a take profit which adapt dynamically to market conditions.
The trade is closed in profit when the RSI is greater than 70 , as the trend could experience a pull-back.
Alternatively, the trade is closed when the RSI is lower than 30 , being this a sign of weakening of the trend.
Pro tip : The 1-hour time frame has proven to return the best results on average. The strategy can also work well in the 15-min time frame if you want to increase the trades' frequency.
The strategy assumes each order to trade 30% of the available capital and opens a trade at a time. A trading fee of 0.1% is taken into account.
