Low volatility Buy w/ TP & SL (Coinrule)The compression of volatility usually leads to expansion. When the breakout comes, it can ignite strong trends. One way to catch a coin trading in an accumulation area is to spot three moving averages with values close to each other. The strategy uses a combination of Moving Averages to spot the best time to buy a coin before its breakout.
Buy Condition
The MA200 is greater than the MA100
The MA50 is greater than the MA100
According to backtesting results, the 1-hour time frame is the best to run this strategy.
Sell Condition
Take Profit: the price increases 8% from the entry price
Stop Loss: the price drops 4% from the entry price
The strategy has a profitability of 40-60% (depending on the market conditions). Having a ratio of two between Take profit and Stop Loss helps keeping the strategy profitable in the long term.
Pesquisar nos scripts por "profit"

BlueFX Strategy GOLD M15We are releasing this separate script file for trading Gold on the M15 time frame using our strategy. This can now run independently from the main file instead of changing parameters and saving as a template - thus making the use of these specific settings even easier for our traders.
You can see the back testing profitability shown below, although you can not use back testing to predict the future, both the volume of trades, net profit, win rate and draw down demonstrate a solid foundation and data to move forward from.
The strategy itself is explained in the 'Blue FX Strategy' but see below too for more info.
Our strategy will help you identify the current trend in the markets and highlight when this is changing. The strategy itself is based upon 4 indicators lining up in total confluence to increase the probability of the trade being a success.
Absolutely no technical analysis is needed to trade this - this is a trading tool and has solid back testing results trading in isolation - although you may also use to support your own trading - the choice is yours.
When a trade is valid - a Buy or Sell label will appear with the Entry price, SL and multiple TP's shown on the chart.
IMPORTANT note, the test results show and confirm that the most profitable exit strategy with these Gold settings is 'FT&SL' this means we enter the trade with a Stop Loss (SL) and simply hold and follow the trend (Follow Trend = FT) until a reverse signal is printed.
In our supporting video (see related ideas) you can see the impact of changing this target between multiple TP's and the net effect on both win rate and overall net profitability.
The Lot size will also be displayed and this is based on the risk parameters you have set personally in the calculation section.
What is a Trading View Script?
A script is like an indicator but better, we can verify the success of our strategy by using Trading Views strategy tester function. As shown below and on the chart - you can see the 'Buy' and 'Close Buy' on the chart, supported by a live trading log showing you the entry, entry price date, volume and closing price.
This is a great function for numerous reasons; firstly, you know you are using a strategy that has provided a positive expectancy in back testing, secondly you can use this as a trading journal to support your trading too. This in itself can help you with your trading psychology - letting winning trades run is a prime example of this. Take confidence in the statistics and performance over time.
Ultimately, we believe we have saved YOU the need to firstly, find an edge and a strategy - and all of the time it takes to BACKTEST a strategy - to then find it may or may not work - and then you start again!
Disclaimer alert; Please remember past performance is exactly that - how our strategy performed over those dates tested, it is not obviously a guarantee of future performance.
Interested in access or more information?
No problem, simply drop us a DM via trading view for access information.
Thank you for reading.
Darren

Kairos [Backtester]Kairos bot looks for the opportune time to buy low and sell high at targets
It provides signals to open and close trades, and indicates favorable positions for a stop loss and profit taking
The Kairos bot can be used on any chart and on any time frame
---BACKTESTER---
Using the backtester script the user can look at a chart's history between selected dates to find optimal bot settings and optimal time frames
The backtester is based on general percentages for profit taking as indicated below:
-------------T1 T2 T3 T4 T5 T6 CLOSE
1 Target: 50% 50%
2 Targets: 50% 25% 25%
3 Targets: 40% 30% 20% 10%
4 Targets: 40% 25% 20% 10% 5%
5 Targets: 35% 25% 20% 10% 5% 5%
6 Targets: 30% 25% 20% 10% 5% 5% 5%
ie: If 2 targets are selected:
- 50% of investment will be taken at target 1
- 25% of investment will be taken at target 2
- and the remainder 25% will be taken when the trade is closed on a close signal
However, it is up to the user's own risk appetite to determine where and how much profit to take
Note that the backtester does not have any on screen indicators other than OPEN and CLOSE, however profit taking can be indicated by ticking the Style -> Trades on Chart tick box on the settings userform
---SIGNALS---
The signals script can be used for automation and can indicate up to 6 potential Profit Targets, as well as a Stop Loss based on how many bars back needs to be taken into consideration
The signals (Open/Close) can be automated using TradingView alerts, however the Stop Loss and Profit Taking are only indicators and are for the users own interpretation
The user does not have to place a Stop Loss or take profit at the Targets if so wished, the bot can be used to simply buy on an OPEN signal and sell on a CLOSE signal, however, the backtester will indicate that it is far more profitable to take profits.
It is advised to take profits just below indicated Targets as these are potentially high selling zones and price action can sometimes turn down just short of these targets.
---INVITE-ONLY SCRIPT---
This is an invite-only script, so if you would like to try out Kairos Bot, send me a message

kiska clouds backtest editionkiska clouds: crypto twitter's next cloud meme
Crypto is a fast-paced, highly-volatile asset, therefore, many traditional strategies are thrown out of the window when applied to cryptocurrency markets. In trading, there are only two things known for sure: price and volume . Price and volume data is then manipulated using various math equations in an effort to discover patterns and/or make predictions. kiska clouds are no different.
The kiska clouds are a simple crossover strategy. The clouds are different because of the unique averages being used and the embedded momentum indicator .
To use the clouds is simple:
When the green line crosses above the pink line, you buy/long.
When the green line crosses below the pink line, you sell/short.
The clouds are indicative of the trend's momentum. Using the power of math, the larger the cloud indicates a higher amount of buying/selling pressure. As the cloud thins, momentum is slowing, and the trend may be reversing.
At the time of testing, the strategy had a profitability of 54.55% accuracy with 1133.41% net profit. While I think this could be automated into a bot, adding a human element with stop losses and further analysis will significantly improve the accuracy/profitability.
This indicator is the backtest version of the kiska clouds (). For a trial or to purchase this indicator, send me a message on Twitter @moonkiska or here on TradingView. You will be granted a 2-3 day trial period to the backtesting strategy.

Renkomonster, v. 5.0RenkoMonster Elite
A radical redesign of our other approaches, RenkoMonster uses deep algorithmic and pattern tracking against standard systems to produce trade logic with the quietest, most actionable, signal-to-noise certainty. Designing around the right parameters brings the best results, and for investment instruments, that means focusing on market-mirroring mathematics that produce profits. Note, however, that focus on profits also means building an engine that maximizes for return, not some abstract percentage of right guesses. RenkoMonster is therefore built to enter every high-probability trade, then evaluate ongoing metrics to stay with a winner as long as possible, but also recognizing the need to exit quickly as soon as high-probability failure signals arise. The result: consistent winning trades, but, more importantly, immense profit-to-loss ratios that bring a superior payoff. RenkoMonster keeps you in the game to catch the huge runs that bring the big returns. (see Results Chart below) A premium trading system for the discerning investor seeking robust, effortless results across a range of asset classes, contact us for a free trial to test RenkoMonster on your favorite charts.
Results Chart
The backtests below show 1-year returns against a Buy and Hold (B+H) approach for 40 of the world’s top traded instruments (as measured by price volume or similar indicator). The RenkoMonster system was run on the top 10 instruments in four major markets: Equities, ETFs, Cryptocurrencies, and Forex. All tests were on a 30min chart, set to Renko “Traditional” blocks (because TradingView does not support realtime alerts from ATR-based charts). Block size was set proportionately to price to give the instrument positive results, but there was no “cherry-picking”. (In fact, changing time frames would have produced even better returns in some cases, but it seemed best to use a consistent measure.) Subscribers to the system receive a full, step-by-step breakdown on how to customize the parameters to get the best from their favorite markets.
(For each instrument, you see listed its Symbol (name), Profit % (annual return using RenkoMonster), Winning Trade % (being “right”), ProfitFactor (Ratio of money won to money lost), Max Draw Down % (point of worst % loss during the year), and B+H (how much the asset would have returned with no trades, via "buy-and-hold" )...)
RenkoMonste
Settings: 30 min, Traditional Renko box, over 1 year (June 1, 2018 - June 1, 2019)
EQUITIES
Symbol._.Profit Profit %._.Trade %._.Pf Max DrDn._.B + H
AMZN._.._.9,935._.._.._.._.66._.._..9.4._.._.._.1._.._.._.7
AAPL._.._.._318._.._.._.._.54._.._.._7.4._.._.._.2._.._.._.5
TSLA._.._32,777._.._.._.._.60._.._.._7.8._.._.._.2._.._.(-38)
FB._.._.._.._371._.._.._.._.46._.._.._5.4._.._.._.3._.._..(-7)
BABA._.._.._671._.._.._.._.55._.._.._6.3._.._.._.2._.._.(-23)
BYND._.._.._499._.._.._.._.67._.._..24._.._.._.._1._.._.140
MSFT._.._.._.271._.._.._.._.52._.._.._6.5._.._.._.2._.._..28
AMD._.._.._..539._.._.._.._.48._.._.._4.1._.._...13._.._.._0
NFLX._.._..8,695._.._.._.._.57._.._.._.7.4._.._.._2._.._.(-5)
BA._.._.._.1,448._.._.._.._..57._.._.._7.9._.._.._1._.._..97
ETFs
Symbol._.Profit %._.Trade %._.Pf._.Max DrDn._.B + H
SPY._.._.._.775._.._..66._.._..9.7._.._.1._.._.._.4
QQQ._.._.2,918._.._..66._.._.11._.._..1._.._.._.5
EEM._.._.._.463._.._..60._.._..7.1._.._.1._.._.._0
IWM._.._..2,060._.._..62._.._..9.1._.._.1._.._.(-3)
HYG._.._.._..18._.._..45._.._..2.2._.._.1._.._.._0.5
EWZ._.._.10,426._.._..62._...11._.._.._1._.._..26
LQD._.._.._..12._.._.._45._.._.2.3._.._.1._.._.._6
EFA._.._.._.236._.._.._52._.._.6.2._.._.1._.._..(-7)
FXI._.._.._..900._.._.._62._.._.8.3._.._.1._.._.(-15)
XLF._.._.._..393._.._...60._.._.6.8._.._.1._.._..(-3)
CRYPTOCURRENCIES
Symbol._.._.Profit %._.._.Trade %._.Pf._.Max DrDn._.B + H
BTC/USD._.100 million._.._.58._.._.12._.._.2._.._.._.(-8)
ETH/USD._.232 million._.._.54._.._..6.2._..4._.._.._(-54)
XRP/USD._.840 million._.._.52._.._..7._.._.4._.._.._(-21)
LTC/USD._.14 million._.._..51._.._..6.5._..5._.._.._..13
BCH/USD._.17 million._.._.51._.._..6._.._15._.._.._.(-5)
EOS/USD._.5 million._.._..49._.._..5.3._.._7._.._.._..13
BNB/USDT._.4 billion._.._..56._...15._.._..4.._.._.._128
BSV/USD._.299,000._.._.._.67._..109._.._..2._.._.._.(-8)
XLM/USD._.94 billion._.._..64._.._11._.._..3._.._.._..34
ADA/USD._.647,000._.._.._75._.._34._.._..1._.._.._.._3
FOREX PAIRS
Symbol._.._.Profit %._.Trade %._.Pf._.Max DrDn._.B + H
EUR/USD._.._.17._.._.._.37._.._.1.5._.._.2._.._.._.(-4)
USD/JPY._.._..9._.._.._..34._.._.1.2._.._.3._.._.._.(-1)
AUD/USD._.._.35._.._.._.45._.._.2.1._.._.2._.._.._.10
USD/CAD._.._.13._.._.._.35._.._.1.4._.._.3._.._.._..3
GBP/USD._.._.46._.._.._.38._.._.1.8._.._.3._.._.._.(-5)
NZD/USD._.._.39._.._.._.50._.._.2.6._.._.1._.._.._.(-6)
GBP/JPY._.._.66._.._.._.39._.._.1.9._.._.2._.._.._.(-6)
EUR/JPY._.._.25._.._.._.45._.._.2.1._.._.3._.._.._.(-5)
AUD/JPY._.._.65._.._.._.36._.._.1.9._.._.2._.._.._(-10)
EUR/GBP._.._.25._.._.._.45._.._.2.1._.._.3._.._.._..0.1

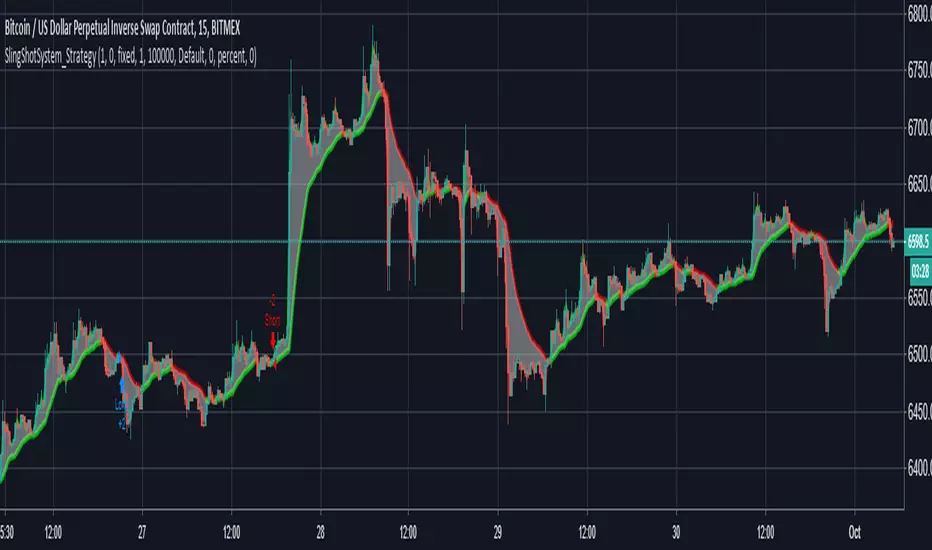
The 15 Minutes SlingShot System StrategyUse this strategy on the 15 Minutes timeframe for maximum profit. Even if the profitability is less than 60%, the profit factor is still above 5 for minimum losses which make it very profitable. The strategy is based on the SlingShot System Study.
Cyatophilum Trend Indicator [BACKTEST][STRATEGY]HOW IT WORKS
Based on my Cyatophilum Trend Indicator, this Strategy performs simple Buy and Sell orders when an alert from the Indicator triggers. The goal is to find the best Time Frame and Trend Parameter in order to make the most profit. The indicator turns the candles green for a Long trade/Buy and red for a Short trade/Sell.
ABOUT THE STRATEGY
The Net Profit (Gross profit - Gross loss) is calculated with a commission of 0.05% on each order.
Each trade is made with 1 BTC : The backtest buys 1 BTC and sells 1 BTC.
It clearly outperforms the Buy & Hold line, meaning it is more profitable to use this strategy than to just hold Bitcoin.
If you decided to Short or Long, profits can be higher, but trade at your own risk.
To use this strategy on a BTC market (for trading altcoins), change the default Order Size from 1 Contract to 100% of Equity.
MY PERSONNAL ADVICE
This is a Trend Indicator, meaning the least profitable trades are made during flat markets. Keep an eye on News and Volume to indentify a possible breakout and avoid trades during those flat periods. Do not trade during a Triangle since the commissions will rekt you.
Get This Indicator Today!
Purchase at blockchainfiesta.com
NOTE
If you purchase the Indicator you will get both the Alert Setup and the Backtest Strategy.
Find, discuss and request more backtesting on my discord!
discord.gg

CryptoMatt MT GainTrading StratThis project is focusing on the percent of profitability. Being consistently profitable is much easier on the mind when using a service to trade for you. Gains are still solid, but will continue this project to keep tweaking to be consistently profitable.
[NG] Strategy: CryptoMine - v1 - Low Drawdown - Beats Buy&Hold!So, I created this strategy that works on BTCUSD 0.28% pair along with almost all ALT-BTC pairs, and ALT-USD pairs (i.e. the cryptosphere). Here are some of the considerations I had when creating this script:
- Should work on BTCUSD 0.28% , along with most ALT-BTC and ALT-USD pairs without modifying strategy parameters for individual pairs.
- Should work with several timeframes, esp -0.67% . 15m-4hr timeframes. Better if the parameters are adjusted for these timeframes, automatically.
- Should have a small MaxDrawdown. Arguably <50% for cryptos.
- Should beat buy and hold profits for the pair.
- Should have multiple modes for switching between: Higher Returns vs Lower Drawdowns, multiple Long/Short versions - one which allows me to do margin trading by using the short calls (so, LONG, SHORT and FLAT), and another one where I can use the short calls by exiting out of the market and entering when the short call ends (so, LONG and SHORT only).
- Should have proper risk management built-in. Moreover, TakeProfit and StopLoss will be defined at a fixed 20% each, which is reasonable for crypto markets. Most strategies I see on tradingview fail on this count.
After several weeks of building such a script, and testing it successfully on multiple pairs - here are the results. :)
ETHBTC
=======================================================================================
Mode 1 (LONG and SHORT only)
--------------------------------------
First Trade: 2015-08-10 09:30, Final Profit: 1474649.65%, Drawdown: 66.21%, PF: 2.149, Trades: 1059
--------------------------------------
Mode 2 (LONG, SHORT and FLAT positions)
First Trade: 2015-08-14 05:30, Final Profit: 715274.55%, Drawdown: 36.34%, PF: 2.806, Trades: 589
BTCUSD 0.28%
=======================================================================================
Mode 1 (LONG and SHORT only)
--------------------------------------
First Trade: 2015-01-03 21:30, Final Profit: 28944.04%, Drawdown: 44.87%, PF: 1.353, Trades: 1222
--------------------------------------
Mode 2 (LONG, SHORT and FLAT positions)
First Trade: 2015-01-11 13:30, Final Profit: 22522.28%, Drawdown: 27.77%, PF: 1.877, Trades: 669
NANOBNB
=======================================================================================
Mode 1 (LONG and SHORT only)
--------------------------------------
First Trade: 2018-02-04 23:30, Final Profit: 365.5%, Drawdown: 39.4%, PF: 1.967, Trades: 51
--------------------------------------
Mode 2 (LONG, SHORT and FLAT positions)
First Trade: 2015-01-11 13:30, Final Profit: 236.91%, Drawdown: 25.62%, PF: 3.692, Trades: 25
NOTE: I will not be sharing access to this script, since market saturation is a real thing. Send me an email at menikhguptacom - if you are really interested in this script.

Logic Flow Signals & Backtest [bercutiatia]To understand the advanced logic of the tool, it is essential that you carefully read each topic and check the visual examples in this presentation.
--
Who is the Logic Flow Signals & Backtest tool recommended for?
Ideal for traders looking to increase the reliability and level of their operations. Recommended for those who want to create rigorous confluences, validate strategies with backtesting, and transform emotional management into systematic and measurable processes.
How can the Logic Flow Signals & Backtest tool help me?
High-confidence signals! You combine TradingView indicators and create a single robust signal, eliminating the frustration of having to spend hours in front of the chart and still clicking at the wrong time. This ensures that your entry is validated by logic, not emotional impulse.
--
Logic Flow Signals & Backtest is a versatile and powerful tool designed to test and validate your trading ideas with indicators from the TradingView community.
Extreme flexibility: Allows you to combine indicators available on TradingView (EMAs, RSI, MACD, SMC, etc.) to create custom entry and exit logics.
Sequential Logic: Goes far beyond simple crossovers. You can define rules where signal A must occur before signal B — and, if desired, before signal C or D — to validate an entry. Add time, order, and context filters, creating truly intelligent sequential logic that generates a single final alert only when all conditions align.
With Stages (Stage 1, Stage 2, etc.), your entries follow the exact sequence you define. And the best part: you no longer need to spend hours in front of the chart waiting for confluences. Simply set up your stages once, create an alert in TradingView, and the system will automatically notify you when the ideal combination of signals occurs.
Sequence Invalidation: Offers the option to define conditions that, if they occur, immediately cancel an ongoing entry sequence, helping to avoid entries in unfavorable scenarios.
Explaining the first image example (chart below):
LONG INDICATOR 1 (Stage 1): The market confirms a change in character (CHoCH Bullish). The system enters an alert state awaiting the confluence of the next indicators.
LONG INDICATOR 2 and 3 (Stage 2): Entry is only released when the SMA17 crosses above the SMA72 (indicator 2), but with one condition: The SMA72 must be ABOVE the SMA305 (indicator 3); Without this alignment of indicator 3, the signal of indicator 2 does not occur.
LONG INDICATOR 4 (Invalidation Rule): If at any point in the sequence the SMA72 crosses below the SMA305, the setup is immediately canceled and no entry signal is generated. The sequence restarts with indicator 1.
EXIT LONG (Hybrid Exit TP + SIGNAL): The trade seeks a TP target of 1000 ticks, but has a technical "Trailing Stop": if the trend reverses (Exit Long Indicator 1 = SMA72 crosses below the SMA305) before the target, the position is closed to protect capital.
SHORT INDICATOR 1 (Stage 1): Identification of weakness in the market with a Bearish CHoCH.
SHORT INDICATOR 2 and 3 (Stage 2): Entry is only released when the SMA17 crosses below the SMA72 (indicator 2), but with a strict condition: The SMA72 must be BELOW the SMA305 (indicator 3); Without this STATE of indicator 3, the signal from indicator 2 does not occur.
SHORT INDICATOR 4 (Invalidation Rule): If at any point in the sequence the SMA72 crosses above the SMA305, the setup is immediately canceled and no entry signal is generated. The sequence starts again with indicator 1.
EXIT SHORT (Hybrid Exit TP + SIGNAL): The trade seeks a target of 1000 ticks, but has a technical "Trailing Stop": if the downtrend reverses (Exit Short Indicator 1 = SMA72 crosses above the SMA305) before the target, the position is closed to protect capital.
In this strategy, we use the external indicators: Multiple MTF MA and Smart Money Concepts (Advanced)
--
Stage Duration: In STAGE DURATION , you control the maximum time (in candles) allowed for each transition between stages to occur. If the time limit expires before the next stage is reached, the sequence is reset. Keep it at 0 to disable the time limit.
The "Stage Duration" function is available in four separate blocks on the settings panel:
- LONG - STAGE DURATION: Controls the time limit (in candles) between Long entry stages (for example from Stage 1 to Stage 2).
- LONG EXIT - STAGE DURATION: Controls the time limit between Long exit stages.
- SHORT - STAGE DURATION: Controls the time limit between Short entry stages.
- SHORT EXIT - STAGE DURATION: Controls the time limit between Short exit stages.
Explaining the second image example (chart below):
Stage 1 (INDICATOR 1): New Fair Value Gap (FVG) Bullish Confirmed.
- Meaning: The move starts with a bullish FVG (Fair Value Gap), indicating a confirmed imbalance where buyers were much more aggressive than sellers.
Stage 2 (INDICATOR 2): EMA10 crossing above the EMA50.
- Meaning: Immediately after the FVG trigger, the fast moving average (10 periods) crosses the intermediate moving average (50 periods). This confirms that the initial FVG impulse was not an isolated event but the beginning of a short-term trend.
Stage 3: In this final stage, we require two simultaneous confirmations to validate the entry:
- INDICATOR 3: The EMA10 crosses above the EMA100, indicating that the movement has enough strength to break through larger barriers.
- INDICATOR 4: The RSI must be above its own moving average (SMA14). This ensures the asset is gaining momentum at the exact moment the averages are broken, avoiding entries in "tired" markets.
Stage Duration: The most important feature of this setup is the restricted time window.
- Rule: From Stage 1 to 2, and from Stage 2 to 3, the maximum interval to accept confluences is only 3 candles.
- Why this is vital? If the market took 20 candles to align these conditions, it would indicate weakness or indecision. By demanding that everything happens within a maximum of 3 candles per step, the setup filters only the moves where buying pressure is urgent and aggressive, increasing the probability of an explosive move in favor of the trade.
Asymmetric Risk Management: To complement a high-probability and high-pressure setup, we use aggressive risk management:
- Stop Loss (Technical/Short): 200 Ticks. If the buying pressure fails quickly, we exit early with a small loss.
- Take Profit (Long Target): 1000 Ticks. We aim to ride the impulse "leg" that the setup identified.
- Risk/Reward: 5:1. This means a single winning trade covers five losing trades, making the strategy mathematically viable in the long term.
In this strategy, we use the external indicators: Multiple MTF MA , Smart Money Concepts (Advanced) and Relative Strength Index (RSI) .
--
Multiple Operating Modes
It is not limited to sequences. It can operate by confluence (where all signals must be valid at the same time), by single trigger (only one signal is required), or by "OR" logic (any one of the defined signals).
- If you use only Stage 1 in more than one indicator session, the entry will only occur if all enabled conditions are true simultaneously.
- Any condition defined as OR can trigger the entry by itself.
- If only one condition block is enabled, the single indicator will function as a simple signal.
Multiple and Simultaneous Exits
It allows for the configuration of exits by both indicators and TP/SL targets. The strategy will close the trade as soon as any of these conditions are met first (indicator signal, profit target, or loss limit
Integrated Risk Management
It includes Stop Loss and Take Profit exits by percentage and ticks, which are easy to configure and essential for risk management. The strategy calculates the exact TP and SL prices based on your entry price and monitors the market on every tick.
Explaining the Third Image Example (Chart Below)
The move was validated by a 4-step logical sequence (Stage 1) and managed by a hybrid exit system.
Short Indicator 1, 2, and 3: The price (Close) crossed below the SMA200, SMA72, and SMA17 averages simultaneously.
- What this means: When a single candle has the strength to break below the short-term (17), mid-term (72), and long-term (200) averages, it indicates a high probability for the price to seek lower levels.
To reinforce Indicators 1 through 3, we added an extra layer of confirmation.
Short Indicator 4: The Positive Volume Index (PVI) needed to be below its own long-term average (EMA300).
- Why this is important: PVI below the average confirms that selling volume is dominant, validating that the break of the averages was not just noise.
Triple Exit Management (Maximum Security)
The great advantage of this tool is the ability to manage risk dynamically. In this trade, we configured three simultaneous exit conditions, where the first one to be met closes the position:
1. Financial Target (TP): A fixed Take Profit of 15%.
2. Exit Short Indicator 1 (Technical Exit 1): If the average (SMA72) crosses above the average (SMA200), the trade is closed.
3. Exit Short Indicator 2 (Technical Exit 2): If the PVI crosses above the EMA300, indicating an entry of buying strength, the trade is closed.
"OR" Logic: The tool monitors these conditions in real-time. Whichever occurs first triggers the exit, ensuring you lock in profit (TP) or protect your capital at the first sign from the indicators.
In this strategy, we use the external indicators: Multiple MTF MA and Positive Volume Index .
--
Reversal Mode (Stop and Reverse)
The Reversal Mode (Stop and Reverse) allows a new signal in the opposite direction (e.g., a SELL signal) to automatically close an existing position (e.g., BUY) and open a new one (sell). This "stop and reverse" function can be enabled or disabled in the settings, giving you full control over whether the strategy should only exit (awaiting a new signal) or immediately reverse the position.
Explaining the Fourth Image Example (Chart Below)
In this example, we demonstrate a setup focused on capturing every market "flip," keeping the trader positioned 100% of the time ("Always-in"), a technique widely used in automation.
- Long Entry: Occurs immediately upon confirming a bullish change of character (New CHoCH Bullish).
- Short Entry: Occurs immediately upon confirming a bearish change of character (New CHoCH Bearish).
- Exit (The Differentiator): We are not using fixed TP or SL here. The exit is triggered by Automatic Reversal.
The Power of "Exit by Opposite Signal"
Notice the labels on the chart: "Close Short" followed immediately by a "Long." This happens because the Allow Reversal function is enabled in the tool's settings.
When the market generates a buy signal, the tool understands that the sell thesis has been invalidated. It simultaneously sends an order to close the Short position and open a new Long position.
When to use this exit rule?
- Capturing Long Trends / Directional Movements: Ideal for volatile assets where you want to ride the trend until the market structure effectively changes.
- Operational Simplification: Eliminates the need to guess profit targets and acts as a loss limiter when the price moves against your position. The market dictates when to enter and when to exit.
Hybrid Flexibility:
The strongest point of Logic Flow is that you don't have to choose just one method. Reversal can be used in two ways:
1. Individually (as in the image): Reversal is the only form of exit. You stay in the move until the opposite signal.
2. Combined (Hybrid): You can enable Reversal and configure a safety Stop Loss + technical Take Profit (Exit Long/Short Indicator).
- Example: If the price hits your TP/SL first, you exit. If the market turns before the TP, the Reversal takes you out of the trade and generates a new trend alert.
In this strategy, we use the external indicators: Smart Money Concepts .
--
Backtesting: Far beyond creating logic and generating signals, Logic Flow Signals stands out due to its Integrated Backtest.
Backtesting serves as a reality check for the trader. It takes the strategy out of the realm of "imagination" and puts it to the test against historical data.
Here are the 4 main practical uses:
1. Verifying Feasibility (Proof of Concept): The most obvious use is to answer: "Does this idea make money?". Many strategies look visually perfect on the chart, but when you run the backtest, you discover that brokerage fees or frequent "stops" consume all the profit.
2. Knowing the "Worst-Case Scenario" (Drawdown): Maximum Drawdown: It shows you what the largest accumulated drop the strategy has ever experienced was. By identifying a Drawdown that exceeds the desired risk tolerance, the backtest allows for parameter optimization in search of a more efficient balance between risk and return.
3. Fine-Tuning (Optimization): It allows you to make changes such as: Increasing the profit target, changing the stop, removing an indicator, changing the chart timeframe, among other actions. You can test various variations instantly to find the most efficient configuration.
4. Expectation Management and Discipline: Backtesting does not eliminate fear nor guarantee that the future will repeat the past, but it serves as a reference map.
The Real Role: Aligning expectation with reality.
In the image below, you can check out how a backtest result is generated:
To understand the backtest results shown above, check the chart and the detailed operational logic below:
This operational example seeks to identify altcoins that are demonstrating an explosive decorrelation relative to Bitcoin. The logic is: we want to buy only the assets that are outperforming the market leader, precisely at the moment when speculative money (Open Interest) heavily enters the market.
For the buy signal (Long) to be triggered, three conditions must be simultaneously true (Stage 1):
Long Indicator 1 (Altcoin Strength): The asset's RSI must be above the 70 level (Overbought), indicating extremely strong bullish momentum.
Long Indicator 2 (Bitcoin Weakness): Bitcoin's RSI must be below the 50 level. This confirms that the Altcoin's rally is genuine and independent.
Long Indicator 3 (Money Flow): The Open Interest (open contracts) must be above the Extreme level of the OI DELTA indicator. This validates that new money is aggressively entering the asset to sustain the rally.
Risk Management: In this example, we configured an aggressive target to capture the altcoin volatility:
- Take Profit: 100%
- Stop Loss: 20%
- Risk/Reward: 5:1
In this strategy, we use the external indicators: RSI Crypto Strength (Asset vs BTC) and Open Interest Delta .
--
Configuring an Indicator Block
Each block (BUY INDICATOR 1, BUY INDICATOR 2, ...) allows you to define a complete condition.
- Enable (Activate): Simply turns this indicator block on or off.
- Source A: The first value you want to analyze.
example: The Closing Price (Close), Opening Price (Open), or another TradingView indicator.
- Condition: How 'Source A' will be compared.
example: Crossover/Crossunder, Greater Than, Less Than, Cross Up.
- Comparison Type: The option that defines whether you will compare 'Source A' with a fixed number or with another indicator.
- Fixed Value: Used if you selected "Fixed Value".
example: For an RSI greater than 70 condition, Source A would be the RSI, the Condition would be Greater Than, and the Fixed Value would be 70.
- Source B: Used if you selected "Source B".
example: For a condition where the EMA10 crosses above the EMA200, Source A would be the EMA10, the Condition would be 'Cross Up', and Source B would be the EMA200.
--
Configurable Alert Signals
Configurable Alert Signals: The tool allows for the creation of fully customized alerts for different types of events, such as entries, signal-based exits, take profit, and stop loss. These alerts can be used for both strategy automation and manual, real-time notifications.
The message field is highly flexible: it accepts dynamic placeholders, JSON structure, UUID identifiers, or any custom text, allowing integration with other external tools and systems via webhook.
Configuring Your Messages:
- LONG/SHORT - ALERTS: Defines the message for new entries.
- LONG/SHORT INDICATOR EXIT - ALERTS: Defines the message for signal-based exits (e.g., moving average cross).
- REVERSAL - ALERTS: Defines the message for when a position is closed by an opposite signal (stop-and-reverse).
- LONG/SHORT TP/SL EXIT - ALERTS: Defines the message for exits triggered by take profit (TP) or stop loss (SL), via percentage or ticks.
A Single Alert to Control Everything
You don't need to create separate alerts for "Buy," "Sell," or "Exits." On a single screen, you can create strategies by defining entries, signal-based exits, profit targets, or stop limits.
Alert Times (Operating Window)
In the Alert Times section, you can define a specific time (and time zone) for the strategy to generate entry or exit signals.
--
To create your alert, simply follow these steps:
- Condition: Select the script name: "Logic Flow Signals & Backtest".
- Message: Insert only the placeholder: {{strategy.order.alert_message}}
Once this single alert is active, it will "listen" to all orders executed by the strategy.
This means you can have your Long-Term, Short-Term, Signal-Based Exits, and TP/SL strategies active simultaneously. When any of these events are plotted on the chart, the script will send the customized message (which you wrote in the fields) to your single alert.
--
Advanced period filters: Allow you to test the strategy in specific date ranges, over the last X days, or over the last X bars, facilitating performance analysis in different market environments.
--
Status Panel: Displays a clear summary of all active rules and settings directly on the chart, facilitating the visualization and confirmation of the running logic.
Additionally, it has a settings box where you can activate or deactivate the panel, choose its position (such as at the bottom or side), and adjust its size.
--
The Thumbnail strategy uses the following external indicators: Multiple MTF MA and Breakout Finder .
--
Final Considerations:
The Logic Flow Signals & Backtest tool is a versatile and powerful system, designed to test and apply trading ideas based on multiple indicators from TradingView.
Its differential is being a customization environment: the script does not have integrated graphical indicators, as the objective is precisely to allow the user to combine and integrate multiple existing indicators in the TradingView community to build unique entry and exit logics.
It offers flexibility and precision, but the true value emerges when the trader integrates the tool into a consistent trading plan, with efficient risk management (Stop Loss and Take Profit), leverage control, and a professional mindset.
Important: Risk of Repainting (Unstable Data): Avoid indicators that 'repaint' (those that change their values in past bars after the closing of new candles). The backtest will be invalidated, and the actual performance of the strategy will fail.
Legal Warning and Didactic Purpose:
It is fundamental to understand that all visual examples, charts, and texts contained in this description do not constitute financial advice, buy or sell recommendations, nor a promise of easy or guaranteed gains.
This is an advanced support tool, not an automatic profit system. Use the integrated backtesting to evaluate the historical behavior of strategies before real execution and understand how different market conditions impact your results. The sole purpose of this material is to demonstrate the logical and execution capacity of the script, serving as a didactic guide for you to test and validate your own ideas.
Conclusion and Risk Warning:
Success in financial markets comes not only from a set of charting indicators, but from the trader's understanding, practice, and discipline. Our objective is to provide a robust, customizable, and intuitive solution, created to enhance your technical analysis and broaden your strategic vision, without replacing critical thinking and conscious decision-making.
Finally, remember: past results do not guarantee future performance. The real differentiator lies in continuous learning, testing, and evolution.

Classic Wave: The Easy WayClassic Wave is a simple strategy with few rules and no over-optimization. Despite its simplicity, it is backed by a nearly century-long historical track record, delivering excellent returns on the weekly chart of the SPX (TVC).
I also recommend observing its strong performance on the SPY (weekly), which is the perfect instrument for executing this strategy with futures in the future.
Strategy Rules and Parameters
When a bullish candle closes above the 20-period EMA, we place the stop-loss below the low of that candle and target a risk-reward ratio of 1:1.
A second, more profitable variant is to change the risk-reward ratio in the code to 2:1.
-Total capital: $10,000
-We use 10% of the total capital per trade.
-Commissions: 0.1% per trade.
The code construction is simple and very well detailed within the script itself.
Risk-Reward Ratio 2:1
Using a 2:1 risk-reward ratio reduces the win rate but significantly increases profitability.
Across the full historical data of the SPX index (weekly), the system would have generated 236 trades, with a win rate of 51.27% and a profit factor of 2.53.
From January 1, 2023, to November 28, 2025, the system would have generated 5 trades, with an 80% win rate and a profit factor of 9.244.
What makes this system so good?
-It takes advantage of the long-term bullish bias of U.S. stock indices and traditional markets.
-It filters out a lot of noise thanks to the weekly timeframe.
-It uses simple parameters with no over-optimization.
Final Notes:
This strategy has consistently outperformed the returns offered by most traditional funds over time, with fewer drawdowns and significantly less stress. I hope you like it.

STRATEGY 1 │ Red Dragon │ Model 1 │ Pro │ [Titans_Invest]The Red Dragon Model 1 is a fully automated trading strategy designed to operate BTC/USDT.P on the 4-hour chart with precision, stability, and consistency. It was built to deliver reliable behavior even during strong market movements, maintaining operational discipline and avoiding abrupt variations that could interfere with the trader’s decision-making.
Its core is based on a professionally engineered logical structure that combines trend filters, confirmation criteria, and balanced risk management. Every component was designed to work in an integrated way, eliminating noise, avoiding unnecessary trades, and protecting capital in critical moments. There are no secret mechanisms or hidden logic: everything is built to be objective, clean, and efficient.
Even though it is based on professional quantitative engineering, Red Dragon Model 1 remains extremely simple to operate. All logic is clearly displayed and fully accessible within TradingView itself, making it easy to understand for both beginners and experienced traders. The structure is organized so that any user can quickly view entry conditions, exit criteria, additional filters, adjustable parameters, and the full mechanics behind the strategy’s behavior.
In addition, the architecture was built to minimize unnecessary complexity. Parameters are straightforward, intuitive, and operate in a balanced way without requiring deep adjustments or advanced knowledge. Traders have full freedom to analyze the strategy, understand the logic, and make personal adaptations if desired—always with total transparency inside TradingView.
The strategy was also designed to deliver consistent operational behavior over the long term. Its confirmation criteria reduce impulsive trades; its filters isolate noise; and its overall logic prioritizes high-quality entries in structured market movements. The goal is to provide a stable, clear, and repeatable flow—essential characteristics for any medium-term quantitative approach.
Combining clarity, professional structure, and ease of use, Red Dragon Model 1 offers a solid foundation both for users who want a ready-to-use automated strategy and for those looking to study quantitative models in greater depth.
This entire project was built with extreme dedication, backed by more than 14,000 hours of hands-on experience in Pine Script, continuously refining patterns, techniques, and structures until reaching its current level of maturity. Every line of code reflects this long process of improvement, resulting in a strategy that unites professional engineering, transparency, accessibility, and reliable execution.
🔶 MAIN FEATURES
• Fully automated and robust: Operates without manual intervention, ideal for traders seeking consistency and stability. It delivers reliable performance even in volatile markets thanks to the solid quantitative engineering behind the system.
• Multiple layers of confirmation: Combines 10 key technical indicators with 15 adaptive filters to avoid false signals. It only triggers entries when all trend, market strength, and contextual criteria align.
• Configurable and adaptable filters: Each of the 15 filters can be enabled, disabled, or adjusted by the user, allowing the creation of personalized statistical models for different assets and timeframes. This flexibility gives full freedom to optimize the strategy according to individual preferences.
• Clear and accessible logic: All entry and exit conditions are explicitly shown within the TradingView parameters. The strategy has no hidden components—any user can quickly analyze and understand each part of the system.
• Integrated exclusive tools: Includes complete backtest tables (desktop and mobile versions) with annualized statistics, along with real-time entry conditions displayed directly on the chart. These tools help monitor the strategy across devices and track performance and risk metrics.
• No repaint: All signals are static and do not change after being plotted. This ensures the trader can trust every entry shown without worrying about indicators rewriting past values.
🔷 ENTRY CONDITIONS & RISK MANAGEMENT
Red Dragon Model 1 triggers buy (long) or sell (short) signals only when all configured conditions are satisfied. For example:
• Volume:
• The system only trades when current volume exceeds the volume moving average multiplied by a user-defined factor, indicating meaningful market participation.
• RSI:
• Confirms bullish bias when RSI crosses above its moving average, and bearish bias when crossing below.
• ADX:
• Enters long when +DI is above –DI with ADX above a defined threshold, indicating directional strength to the upside (and the opposite conditions for shorts).
• Other indicators (MACD, SAR, Ichimoku, Support/Resistance, etc.)
Each one must confirm the expected direction before a final signal is allowed.
When all bullish criteria are met simultaneously, the system enters Long; when all criteria indicate a bearish environment, the system enters Short.
In addition, the strategy uses fixed Take Profit and Stop Loss targets for risk control:
Currently: TP around 1.5% and SL around 2.0% per trade, ensuring consistent and transparent risk management on every position.
⚙️ INDICATORS
__________________________________________________________
1) 🔊 Volume: Avoids trading on flat charts.
2) 🍟 MACD: Tracks momentum through moving averages.
3) 🧲 RSI: Indicates overbought or oversold conditions.
4) 🅰️ ADX: Measures trend strength and potential entry points.
5) 🥊 SAR: Identifies changes in price direction.
6) ☁️ Cloud: Accurately detects changes in market trends.
7) 🌡️ R/F: Improves trend visualization and helps avoid pitfalls.
8) 📐 S/R: Fixed support and resistance levels.
9)╭╯MA: Moving Averages.
10) 🔮 LR: Forecasting using Linear Regression.
__________________________________________________________
🟢 ENTRY CONDITIONS 🔴
__________________________________________________________
IF all conditions are 🟢 = 📈 Long
IF all conditions are 🔴 = 📉 Short
__________________________________________________________
🚨 CURRENT TRIGGER SIGNAL 🚨
__________________________________________________________
🔊 Volume
🟢 LONG = (volume) > (MA_volume) * (Volume Mult)
🔴 SHORT = (volume) > (MA_volume) * (Volume Mult)
🧲 RSI
🟢 LONG = (RSI) > (RSI_MA)
🔴 SHORT = (RSI) < (RSI_MA)
🟢 ALL ENTRY CONDITIONS AVAILABLE 🔴
__________________________________________________________
🔊 Volume
🟢 LONG = (volume) > (MA_volume) * (Volume Mult)
🔴 SHORT = (volume) > (MA_volume) * (Volume Mult)
🔊 Volume
🟢 LONG = (volume) > (MA_volume) * (Volume Mult) and (close) > (open)
🔴 SHORT = (volume) > (MA_volume) * (Volume Mult) and (close) < (open)
🍟 MACD
🟢 LONG = (MACD) > (Signal Smoothing)
🔴 SHORT = (MACD) < (Signal Smoothing)
🧲 RSI
🟢 LONG = (RSI) < (Upper)
🔴 SHORT = (RSI) > (Lower)
🧲 RSI
🟢 LONG = (RSI) > (RSI_MA)
🔴 SHORT = (RSI) < (RSI_MA)
🅰️ ADX
🟢 LONG = (+DI) > (-DI) and (ADX) > (Treshold)
🔴 SHORT = (+DI) < (-DI) and (ADX) > (Treshold)
🥊 SAR
🟢 LONG = (close) > (SAR)
🔴 SHORT = (close) < (SAR)
☁️ Cloud
🟢 LONG = (Cloud A) > (Cloud B)
🔴 SHORT = (Cloud A) < (Cloud B)
☁️ Cloud
🟢 LONG = (Kama) > (Kama )
🔴 SHORT = (Kama) < (Kama )
🌡️ R/F
🟢 LONG = (high) > (UP Range) and (upward) > (0)
🔴 SHORT = (low) < (DOWN Range) and (downward) > (0)
🌡️ R/F
🟢 LONG = (high) > (UP Range)
🔴 SHORT = (low) < (DOWN Range)
📐 S/R
🟢 LONG = (close) > (Resistance)
🔴 SHORT = (close) < (Support)
╭╯MA2️⃣
🟢 LONG = (Cyan Bar MA2️⃣)
🔴 SHORT = (Red Bar MA2️⃣)
╭╯MA2️⃣
🟢 LONG = (close) > (MA2️⃣)
🔴 SHORT = (close) < (MA2️⃣)
╭╯MA2️⃣
🟢 LONG = (Positive MA2️⃣)
🔴 SHORT = (Negative MA2️⃣)
__________________________________________________________
🎯 TP / SL 🛑
__________________________________________________________
🎯 TP: 1.5 %
🛑 SL: 2.0 %
__________________________________________________________
🪄 UNIQUE FEATURES OF THIS STRATEGY
____________________________________
1) 𝄜 Table Backtest for Mobile.
2) 𝄜 Table Backtest for Computer.
3) 𝄜 Table Backtest for Computer & Annual Performance.
4) 𝄜 Live Entry Conditions.
1) 𝄜 Table Backtest for Mobile.
2) 𝄜 Table Backtest for Computer.
3) 𝄜 Table Backtest for Computer & Annual Performance.
4) 𝄜 Live Entry Conditions.
_____________________________
𝄜 BACKTEST / PERFORMANCE 𝄜
_____________________________
• Net Profit: +634.47%, Maximum Drawdown: -18.44%.
🪙 PAIR / TIMEFRAME ⏳
🪙 PAIR: BINANCE:BTCUSDT.P
⏳ TIME: 4 hours (240m)
✅ ON ☑️ OFF
✅ LONG
✅ SHORT
🎯 TP / SL 🛑
🎯 TP: 1.5 (%)
🛑 SL: 2.0 (%)
⚙️ CAPITAL MANAGEMENT
💸 Initial Capital: 10000 $ (TradingView)
💲 Order Size: 10 % (Of Equity)
🚀 Leverage: 10 x (Exchange)
💩 Commission: 0.03 % (Exchange)
📆 BACKTEST
🗓️ Start: Setember 24, 2019
🗓️ End: November 21, 2025
🗓️ Days: 2250
🗓️ Yers: 6.17
🗓️ Bars: 13502
📊 PERFORMANCE
💲 Net Profit: + 63446.89 $
🟢 Net Profit: + 634.47 %
💲 DrawDown Maximum: - 10727.48 $
🔴 DrawDown Maximum: - 18.44 %
🟢 Total Closed Trades: 1042
🟡 Percent Profitable: 63.92 %
🟡 Profit Factor: 1.247
💲 Avg Trade: + 60.89 $
⏱️ Avg # Bars in Trades
🕯️ Avg # Bars: 4
⏳ Avg # Hrs: 15
✔️ Trades Winning: 666
❌ Trades Losing: 376
✔️ Maximum Consecutive Wins: 11
❌ Maximum Consecutive Losses: 7
📺 Live Performance : br.tradingview.com
• Use this strategy on the recommended pair and timeframe above to replicate the tested results.
• Feel free to experiment and explore other settings, assets, and timeframes.

Stochastic Hash Strat [Hash Capital Research]# Stochastic Hash Strategy by Hash Capital Research
## 🎯 What Is This Strategy?
The **Stochastic Slow Strategy** is a momentum-based trading system that identifies oversold and overbought market conditions to capture mean-reversion opportunities. Think of it as a "buy low, sell high" approach with smart mathematical filters that remove emotion from your trading decisions.
Unlike fast-moving indicators that generate excessive noise, this strategy uses **smoothed stochastic oscillators** to identify only the highest-probability setups when momentum truly shifts.
---
## 💡 Why This Strategy Works
Most traders fail because they:
- **Chase prices** after big moves (buying high, selling low)
- **Overtrade** in choppy, directionless markets
- **Exit too early** or hold losses too long
This strategy solves all three problems:
1. **Entry Discipline**: Only trades when the stochastic oscillator crosses in extreme zones (oversold for longs, overbought for shorts)
2. **Cooldown Filter**: Prevents revenge trading by forcing a waiting period after each trade
3. **Fixed Risk/Reward**: Pre-defined stop-loss and take-profit levels ensure consistent risk management
**The Math Behind It**: The stochastic oscillator measures where the current price sits relative to its recent high-low range. When it's below 25, the market is oversold (time to buy). When above 70, it's overbought (time to sell). The crossover with its moving average confirms momentum is shifting.
---
## 📊 Best Markets & Timeframes
### ⭐ OPTIMAL PERFORMANCE:
**Crude Oil (WTI) - 12H Timeframe**
- **Why it works**: Oil markets have predictable volatility patterns and respect technical levels
**AAVE/USD - 4H to 12H Timeframe**
- **Why it works**: DeFi tokens exhibit strong momentum cycles with clear extremes
### ✅ Also Works Well On:
- **BTC/USD** (12H, Daily) - Lower frequency but high win rate
- **ETH/USD** (8H, 12H) - Balanced volatility and liquidity
- **Gold (XAU/USD)** (Daily) - Classic mean-reversion asset
- **EUR/USD** (4H, 8H) - Lower volatility, requires patience
### ❌ Avoid Using On:
- Timeframes below 4H (too much noise)
- Low-liquidity altcoins (wide spreads kill performance)
- Strongly trending markets without pullbacks (Bitcoin in 2021)
- News-driven instruments during major events
---
## 🎛️ Understanding The Settings
### Core Stochastic Parameters
**Stochastic Length (Default: 16)**
- Controls the lookback period for price comparison
- Lower = faster reactions, more signals (10-14 for volatile markets)
- Higher = smoother signals, fewer trades (16-21 for stable markets)
- **Pro tip**: Use 10 for crypto 4H, 16 for commodities 12H
**Overbought Level (Default: 70)**
- Threshold for short entries
- Lower values (65-70) = more trades, earlier entries
- Higher values (75-80) = fewer but higher-conviction trades
- **Sweet spot**: 70 works for most assets
**Oversold Level (Default: 25)**
- Threshold for long entries
- Higher values (25-30) = more trades, earlier entries
- Lower values (15-20) = fewer but stronger bounce setups
- **Sweet spot**: 20-25 depending on market conditions
**Smooth K & Smooth D (Default: 7 & 3)**
- Additional smoothing to filter out whipsaws
- K=7 makes the indicator slower and more reliable
- D=3 is the signal line that confirms the trend
- **Don't change these unless you know what you're doing**
---
### Risk Management
**Stop Loss % (Default: 2.2%)**
- Automatically exits losing trades
- Should be 1.5x to 2x your average market volatility
- Too tight = death by a thousand cuts
- Too wide = uncontrolled losses
- **Calibration**: Check ATR indicator and set SL slightly above it
**Take Profit % (Default: 7%)**
- Automatically exits winning trades
- Should be 2.5x to 3x your stop loss (reward-to-risk ratio)
- This default gives 7% / 2.2% = 3.18:1 R:R
- **The golden rule**: Never have R:R below 2:1
---
### Trade Filters
**Bar Cooldown Filter (Default: ON, 3 bars)**
- **What it does**: Forces you to wait X bars after closing a trade before entering a new one
- **Why it matters**: Prevents emotional revenge trading and overtrading in choppy markets
- **Settings guide**:
- 3 bars = Standard (good for most cases)
- 5-7 bars = Conservative (oil, slow-moving assets)
- 1-2 bars = Aggressive (only for experienced traders)
**Exit on Opposite Extreme (Default: ON)**
- Closes your long when stochastic hits overbought (and vice versa)
- Acts as an early profit-taking mechanism
- **Leave this ON** unless you're testing other exit strategies
**Divergence Filter (Default: OFF)**
- Looks for price/momentum divergences for additional confirmation
- **When to enable**: Trending markets where you want fewer but higher-quality trades
- **Keep OFF for**: Mean-reverting markets (oil, forex, most of the time)
---
## 🚀 Quick Start Guide
### Step 1: Set Up in TradingView
1. Open TradingView and navigate to your chart
2. Click "Pine Editor" at the bottom
3. Copy and paste the strategy code
4. Click "Add to Chart"
5. The strategy will appear in a separate pane below your price chart
### Step 2: Choose Your Market
**If you're trading Crude Oil:**
- Timeframe: 12H
- Keep all default settings
- Watch for signals during London/NY overlap (8am-11am EST)
**If you're trading AAVE or crypto:**
- Timeframe: 4H or 12H
- Consider these adjustments:
- Stochastic Length: 10-14 (faster)
- Oversold: 20 (more aggressive)
- Take Profit: 8-10% (higher targets)
### Step 3: Wait for Your First Signal
**LONG Entry** (Green circle appears):
- Stochastic crosses up below oversold level (25)
- Price likely near recent lows
- System places limit order at take profit and stop loss
**SHORT Entry** (Red circle appears):
- Stochastic crosses down above overbought level (70)
- Price likely near recent highs
- System places limit order at take profit and stop loss
**EXIT** (Orange circle):
- Position closes either at stop, target, or opposite extreme
- Cooldown period begins
### Step 4: Let It Run
The biggest mistake? **Interfering with the system.**
- Don't close trades early because you're scared
- Don't skip signals because you "have a feeling"
- Don't increase position size after a big win
- Don't revenge trade after a loss
**Follow the system or don't use it at all.**
---
### Important Risks:
1. **Drawdown Pain**: You WILL experience losing streaks of 5-7 trades. This is mathematically normal.
2. **Whipsaw Markets**: Choppy, range-bound conditions can trigger multiple small losses.
3. **Gap Risk**: Overnight gaps can cause your actual fill to be worse than the stop loss.
4. **Slippage**: Real execution prices differ from backtested prices (factor in 0.1-0.2% slippage).
---
## 🔧 Optimization Guide
### When to Adjust Settings:
**Market Volatility Increased?**
- Widen stop loss by 0.5-1%
- Increase take profit proportionally
- Consider increasing cooldown to 5-7 bars
**Getting Too Few Signals?**
- Decrease stochastic length to 10-12
- Increase oversold to 30, decrease overbought to 65
- Reduce cooldown to 2 bars
**Getting Too Many Losses?**
- Increase stochastic length to 18-21 (slower, smoother)
- Enable divergence filter
- Increase cooldown to 5+ bars
- Verify you're on the right timeframe
### A/B Testing Method:
1. **Run default settings for 50 trades** on your chosen market
2. Document: Win rate, profit factor, max drawdown, emotional tolerance
3. **Change ONE variable** (e.g., oversold from 25 to 20)
4. Run another 50 trades
5. Compare results
6. Keep the better version
**Never change multiple settings at once** or you won't know what worked.
---
## 📚 Educational Resources
### Key Concepts to Learn:
**Stochastic Oscillator**
- Developed by George Lane in the 1950s
- Measures momentum by comparing closing price to price range
- Formula: %K = (Close - Low) / (High - Low) × 100
- Similar to RSI but more sensitive to price movements
**Mean Reversion vs. Trend Following**
- This is a **mean reversion** strategy (price returns to average)
- Works best in ranging markets with defined support/resistance
- Fails in strong trending markets (2017 Bitcoin, 2020 Tech stocks)
- Complement with trend filters for better results
**Risk:Reward Ratio**
- The cornerstone of profitable trading
- Winning 40% of trades with 3:1 R:R = profitable
- Winning 60% of trades with 1:1 R:R = breakeven (after fees)
- **This strategy aims for 45% win rate with 2.5-3:1 R:R**
### Recommended Reading:
- *"Trading Systems and Methods"* by Perry Kaufman (Chapter on Oscillators)
- *"Mean Reversion Trading Systems"* by Howard Bandy
- *"The New Trading for a Living"* by Dr. Alexander Elder
---
## 🛠️ Troubleshooting
### "I'm not seeing any signals!"
**Check:**
- Is your timeframe 4H or higher?
- Is the stochastic actually reaching extreme levels (check if your asset is stuck in middle range)?
- Is cooldown still active from a previous trade?
- Are you on a low-liquidity pair?
**Solution**: Switch to a more volatile asset or lower the overbought/oversold thresholds.
---
### "The strategy keeps losing money!"
**Check:**
- What's your win rate? (Below 35% is concerning)
- What's your profit factor? (Below 0.8 means serious issues)
- Are you trading during major news events?
- Is the market in a strong trend?
**Solution**:
1. Verify you're using recommended markets/timeframes
2. Increase cooldown period to avoid choppy markets
3. Reduce position size to 5% while you diagnose
4. Consider switching to daily timeframe for less noise
---
### "My stop losses keep getting hit!"
**Check:**
- Is your stop loss tighter than the average ATR?
- Are you trading during high-volatility sessions?
- Is slippage eating into your buffer?
**Solution**:
1. Calculate the 14-period ATR
2. Set stop loss to 1.5x the ATR value
3. Avoid trading right after market open or major news
4. Factor in 0.2% slippage for crypto, 0.1% for oil
---
## 💪 Pro Tips from the Trenches
### Psychological Discipline
**The Three Deadly Sins:**
1. **Skipping signals** - "This one doesn't feel right"
2. **Early exits** - "I'll just take profit here to be safe"
3. **Revenge trading** - "I need to make back that loss NOW"
**The Solution:** Treat your strategy like a business system. Would McDonald's skip making fries because the cashier "doesn't feel like it today"? No. Systems work because of consistency.
---
### Position Management
**Scaling In/Out** (Advanced)
- Enter 50% position at signal
- Add 50% if stochastic reaches 10 (oversold) or 90 (overbought)
- Exit 50% at 1.5x take profit, let the rest run
**This is NOT for beginners.** Master the basic system first.
---
### Market Awareness
**Oil Traders:**
- OPEC meetings = volatility spikes (avoid or widen stops)
- US inventory reports (Wed 10:30am EST) = avoid trading 2 hours before/after
- Summer driving season = different patterns than winter
**Crypto Traders:**
- Monday-Tuesday = typically lower volatility (fewer signals)
- Thursday-Sunday = higher volatility (more signals)
- Avoid trading during exchange maintenance windows
---
## ⚖️ Legal Disclaimer
This trading strategy is provided for **educational purposes only**.
- Past performance does not guarantee future results
- Trading involves substantial risk of loss
- Only trade with capital you can afford to lose
- No one associated with this strategy is a licensed financial advisor
- You are solely responsible for your trading decisions
**By using this strategy, you acknowledge that you understand and accept these risks.**
---
## 🙏 Acknowledgments
Strategy development inspired by:
- George Lane's original Stochastic Oscillator work
- Modern quantitative trading research
- Community feedback from hundreds of backtests
Built with ❤️ for retail traders who want systematic, disciplined approaches to the markets.
---
**Good luck, stay disciplined, and trade the system, not your emotions.**

Pressure Pivots - MPI (Strategy)⇋ PRESSURE PIVOTS — MARKET PRESSURE INDEX STRATEGY
A comprehensive reversal trading system that combines order flow pressure analysis, multi-factor confluence detection, and adaptive machine learning to identify high-probability turning points in liquid markets.
━━━━━━━━━━━━━━━━━━━━━━━━━━━━━━━━━━━━━
CORE INNOVATION: MARKET PRESSURE INDEX (MPI)
Traditional indicators measure price movement. The Market Pressure Index measures the force behind the movement.
How MPI Works:
Every bar tells two stories through volume distribution:
• Buy Pressure: Volume × (Close - Low) / (High - Low)
• Sell Pressure: Volume × (High - Close) / (High - Low)
• Net Pressure: Buy Pressure - Sell Pressure
This raw pressure is then normalized against baseline activity to create the bounded MPI (-1.0 to +1.0):
• Smooth Pressure: EMA(Net Pressure, period)
• Baseline Activity: SMA(|Net Pressure|, period × 2)
• MPI: (Smooth Pressure / Baseline) × Sensitivity
What MPI Reveals:
MPI > +0.7: Extreme buy pressure → Exhaustion potential
MPI = +0.2 to +0.7: Healthy bullish momentum
MPI = -0.2 to +0.2: Neutral/balanced pressure
MPI = -0.7 to -0.2: Healthy bearish momentum
MPI < -0.7: Extreme sell pressure → Exhaustion potential
Why It Works:
Two bars can both move 10 points, but if one closes at the high on high volume (aggressive buying) and the other closes mid-range on average volume (weak buying), only MPI distinguishes between sustainable momentum and exhaustion. This volume-weighted pressure analysis reveals conviction behind price moves—the key to timing reversals.
━━━━━━━━━━━━━━━━━━━━━━━━━━━━━━━━━━━━━
SEVEN-FACTOR CONFLUENCE SYSTEM
MPI extremes alone aren't enough. The system requires multiple independent confirmations through weighted scoring:
1. DIVERGENCE (Weight: 3.0) — Premium Signal Type: DIV
Price makes new high but MPI makes lower high (or inverse for bullish)
• Detection: Tracks pivots with 5-bar lookback, compares price vs MPI at pivot points
• Signal: Purple triangles, highest weight (pressure weakening while price extends)
2. LIQUIDITY SWEEP (Weight: 2.5) — Premium Signal Type: LIQ
Price breaks swing high/low within 0.3 ATR then reverses
• Detection: Break within tolerance + close back through level
• Signal: Orange triangles, second-highest weight (stop hunt reversal)
3. ORDER FLOW IMBALANCE (Weight: 2.0) — Premium Signal Type: OF
Aggressive buying/selling 50% above normal
• Detection: EMA(aggressive volume) vs SMA(imbalance) threshold
• Signal: Aqua triangles, institutional positioning
4. VELOCITY EXHAUSTION (Weight: 1.5)
Parabolic move (2+ ATRs in 3 bars) + extreme MPI
• Detection: |3-bar price change / ATR| > threshold + MPI > ±0.5
• Indicates: Momentum deceleration, blow-off top/bottom
5. WICK REJECTION (Weight: 1.5)
Single bar: wick > 60% of range, or sequence: 2 bars with 40% + 30% wicks
• Detection: Shooting stars (bearish) or hammers (bullish)
• Indicates: Intrabar rejection, battle won by opposing side
6. VOLUME SPIKE (Weight: 1.0)
Volume > 20-bar average × multiplier (default: 2.0x)
• Detection: Participation surge confirmation
• Lowest weight: Can be manipulated, better as confirmation
7. POSITION FACTOR (Weight: 1.0)
At 10-bar highest (bearish) or lowest (bullish)
• Detection: Structural positioning for reversal
• Base requirement: Must be at extreme to score
Scoring Logic:
Premium Signals (DIV/LIQ/OF): Must score ≥6.0 (default premiumThreshold)
Standard Signals (STD): Must score ≥4.0 (default standardThreshold)
Example Scoring:
Divergence (3.0) + Liquidity Sweep (2.5) + Volume (1.0) = 6.5 → FIRES (DIV signal)
Recent High (1.0) + Wick (1.5) + Volume (1.0) + Velocity (1.5) = 5.0 → FIRES (STD signal)
━━━━━━━━━━━━━━━━━━━━━━━━━━━━━━━━━━━━━
ADAPTIVE LEARNING ENGINE
Unlike static strategies, this system learns from every trade and optimizes itself.
Performance Tracking:
Every trade records:
• Entry Score: Confluence level at entry
• Signal Type: DIV / LIQ / OF / STD
• Win/Loss: Boolean outcome
• R-Multiple: (Exit - Entry) / (Entry - Stop)
• MAE: Maximum Adverse Excursion (worst drawdown)
• MFE: Maximum Favorable Excursion (best profit reached)
Three Adaptive Parameters:
1. Signal Threshold Adaptation
If Win Rate < Target (45%): RAISE threshold → fewer signals, better quality
If Win Rate > Target + 10% AND good R: LOWER threshold → more signals, profitable
2. Stop Distance Adaptation
If Avg MAE > 0.85 AND WR < 50%: WIDEN stops → reduce premature exits
If Avg MAE < 0.4 AND WR > 55%: TIGHTEN stops → reduce risk
3. Target Distance Adaptation
If Avg MFE > Target × 1.5: EXTEND targets → capture more of runners
If Avg MFE < Target × 0.7: SHORTEN targets → take profits faster
Signal Type Filtering:
The system tracks performance by type (DIV/LIQ/OF/STD):
• If Type WR < 40% AND Avg R < 0.8: Type DISABLED
• If Type WR ≥ 40% OR Avg R ≥ 0.8: Type RE-ENABLED
Example: If OF signals consistently lose while DIV signals win, system automatically stops taking OF signals and focuses on DIV.
Warmup Period:
First 30 trades (default) gather baseline data with relaxed thresholds. After warmup, full adaptation activates.
━━━━━━━━━━━━━━━━━━━━━━━━━━━━━━━━━━━━━
COMPLETE POSITION MANAGEMENT
Dynamic Position Sizing:
Base Contracts = (Equity × Risk%) / (Stop Distance × Point Value)
Then multiplied by:
• Score Bonus: Up to +50% for highest-scoring signals
• Signal Type Bonus: DIV signals +50%, LIQ signals +30%
• Streak Multiplier: After 3 losses: 50% reduction, After 3 wins: 25% increase
Example: High-scoring DIV signal on winning streak = 3-4× larger position than weak STD signal on losing streak
Entry Modes:
Single Entry: Full size at once, exit at TP2 (or partial at TP1)
Tiered Entry: 40% at TP1 (2R), 60% at TP2 (4R adaptive)
Stop Management (3 Modes):
Structural: Beyond recent 20-bar swing high/low + buffer
ATR: Fixed ATR multiplier (default: 2.0 ATR, then adapts)
Hybrid: Attempt structural, fallback to ATR if invalid
Plus:
• Breakeven: Move stop to entry ± 1 tick when 1R reached
• Trailing: Activate when 1.5R reached, trail 0.8R behind price
• Max Loss Override: Cap dollar risk regardless of calculation
Target Management:
Fixed Mode: TP1 = 2R, TP2 = 4R
Adaptive Mode: TP1 = 2R fixed, TP2 adapts based on MFE analysis
Partial Exits: Default 50% at TP1, remainder at TP2 or trailing stop
━━━━━━━━━━━━━━━━━━━━━━━━━━━━━━━━━━━━━
COMPREHENSIVE RISK CONTROLS
Daily Limits:
• Max Daily Loss: $2,000 default → HALT trading
• Max Daily Trades: 15 default → prevent overtrading
• Max Concurrent: 2 positions → limit correlation risk
Session Controls:
• Trading Hours: Specify start/end times + timezone
• Weekend Block: Optional (avoid crypto weekend volatility)
Prop Firm Protection (Live Trading Only):
• Daily Loss Limit: Stricter of general or prop limit ($1,000 default)
• Trailing Drawdown: Tracks high water mark, HALTS if breach ($2,500 default)
• Reset on Reload: Optional high water mark reset
Liquidity Filter (Optional):
• Time-Based: Avoid first/last X minutes of session
• Volume-Based: Require minimum volume ratio (0.5× average default)
Market Regime Filter (Optional):
• ADX-Based: Only trade when ADX > threshold (trending)
• Block: Consolidation (ADX < 20) or Transitional regimes
━━━━━━━━━━━━━━━━━━━━━━━━━━━━━━━━━━━━━
REAL-TIME DASHBOARD
MPI Gauge Section:
Shows current pressure: 🟢 STRONG BUY (+0.5 to +1.0), 🟩 BUY PRESSURE (+0.2 to +0.5), ⚪ NEUTRAL (-0.2 to +0.2), 🟥 SELL PRESSURE (-0.5 to -0.2), 🔴 STRONG SELL (-1.0 to -0.5)
Signal Status Section:
• Active Signals: "🔴 DIV SELL" (purple background), "🟢 LIQ BUY" (orange), "🔵 OF SELL" (aqua), "🟢 STD BUY" (green)
• Warnings: "⚠️ BEAR WARNING" / "⚠️ BULL WARNING" (yellow) — setup forming, not full signal
• Scanning: "⏳ SCANNING..." (gray) — no signal active
• Confidence Bar: Visual score display "██████░░░░" showing confluence strength
Divergence Indicator:
"🟣 BEARISH DIVERGENCE" or "🟡 BULLISH DIVERGENCE" when detected
Performance Statistics:
• Overall Win Rate: Wins/Total with visual bar (lime ≥70%, yellow 50-70%, red <50%)
• Directional: Bearish vs Bullish win rates separately
• By Signal Type: DIV / LIQ / OF / STD individual performance tracking
━━━━━━━━━━━━━━━━━━━━━━━━━━━━━━━━━━━━━
KEY PARAMETERS EXPLAINED
🎯 Pressure Engine:
• MPI Period (5-50, default: 14): Smoothing period — lower for scalping, higher for position trading
• MPI Sensitivity (0.5-5.0, default: 1.5): Amplification — lower compresses range, higher more extremes
🔍 Detection:
• Wick Threshold (0.3-0.9, default: 0.6): Minimum wick-to-range ratio for rejection
• Volume Spike (1.2-3.0x, default: 2.0): Multiplier above average for spike
• Aggressive Ratio (0.5-0.9, default: 0.65): Close position in range for aggressive orders
• Velocity Threshold (1.0-5.0 ATR, default: 2.0): ATR-normalized move for exhaustion
• MPI Extreme (0.5-0.95, default: 0.7): Level considered overbought/oversold
⚖️ Weights:
• Divergence: 3.0 (highest — pressure weakening)
• Liquidity: 2.5 (second — stop hunts)
• Order Flow: 2.0 (institutional positioning)
• Velocity: 1.5 (momentum exhaustion)
• Wick: 1.5 (rejection patterns)
• Volume: 1.0 (lowest — can be manipulated)
🎚️ Thresholds:
• Premium (4.0-15.0, default: 6.0): Score for DIV/LIQ/OF signals
• Standard (2.0-8.0, default: 4.0): Score for STD signals
• Warning Confluence (1-4, default: 2): Factors for yellow diamond warnings
🧬 Adaptive:
• Enable (true/false, default: true): Master learning switch
• Warmup Trades (5-100, default: 30): Data collection before adaptation
• Lookback (20-200, default: 50): Recent trades for performance calculation
• Adapt Speed (0.05-0.50, default: 0.15): Parameter adjustment rate
• Target Win Rate (30-70%, default: 45%): Optimization goal
• Target R-Multiple (0.5-5.0, default: 1.5): Risk/reward goal
💼 Position:
• Base Risk (0.1-10.0%, default: 1.5%): Equity risked per trade
• Max Contracts (1-100, default: 10): Hard position limit
• DIV Bonus (1.0-3.0x, default: 1.5): Size multiplier for divergence signals
• LIQ Bonus (1.0-3.0x, default: 1.3): Size multiplier for liquidity signals
🛡️ Stops:
• Mode (Structural/ATR/Hybrid, default: ATR): Stop placement method
• ATR Multiplier (0.5-5.0, default: 2.0): Stop distance in ATRs (adapts)
• Breakeven at (0.3-3.0R, default: 1.0R): When to move stop to entry
• Trail Trigger (0.5-5.0R, default: 1.5R): When to activate trailing
• Trail Offset (0.3-3.0R, default: 0.8R): Distance behind price
🎯 Targets:
• Mode (Fixed/Adaptive, default: Fixed): Target placement method
• TP1 (0.5-10.0R, default: 2.0R): First target for partial exit
• TP2 (1.0-15.0R, default: 4.0R): Final target (adapts in adaptive mode)
• Partial % (0-100%, default: 50%): Position percentage to exit at TP1
━━━━━━━━━━━━━━━━━━━━━━━━━━━━━━━━━━━━━
PROFESSIONAL USAGE PROTOCOL
Phase 1: Paper Trading (Weeks 1-4)
• Setup: Default settings, all adaptive features ON, 0.5% base risk
• Goal: 30+ trades for warmup, observe MPI behavior and signal frequency
• Adjust: MPI sensitivity if stuck near neutral or always at extremes
• Threshold: Raise/lower if too many/few signals
Phase 2: Micro Live (Weeks 5-8)
• Requirements: WR >43%, at least one type >55%, Avg R >0.8
• Setup: 10-25% intended size, 0.5-1.0% risk, 1 position max
• Focus: Execution quality, match dashboard performance
• Journal: Screenshot every signal, track outcomes
Phase 3: Full Scale (Month 3+)
• Requirements: WR >45% over 50+ trades, Avg R >1.2, drawdown <15%
• Progression: Months 3-4 (1.0-1.5% risk), 5-6 (1.5-2.0%), 7+ (1.5-2.5%)
• Maintenance: Weekly dashboard review, monthly deep analysis
• Warnings: Reduce size if WR drops >10%, consecutive losses >7, or drawdown >20%
━━━━━━━━━━━━━━━━━━━━━━━━━━━━━━━━━━━━━
DEVELOPMENT INSIGHTS
The Pressure Insight: Emerged from analyzing intrabar volume distribution. Within every candlestick, volume accumulates at different price levels. MPI deconstructs this to reveal conviction behind moves.
The Confluence Challenge: Early versions using MPI extremes alone achieved only 42% win rate. The seven-factor confluence system emerged from testing which combinations produced reliable reversals. Divergence + liquidity sweep became the strongest setup (68% win rate in isolation).
The Adaptive Breakthrough: Per-signal-type performance tracking revealed DIV signals winning at 71% while OF signals languished at 38%. Adaptive filtering disabled weak types automatically, recovering win rate from 39% to 54% during the 2022 volatility spike.
The Position Sizing Revelation: Dynamic sizing based on signal quality and recent performance increased Sharpe ratio from 1.2 to 1.9 while decreasing max drawdown from 18% to 12% over 500 trades. Bigger positions on better signals = geometric edge amplification.
The Risk Control Lesson: Testing with $50K accounts revealed catastrophic failure modes: daily loss cascades, overtrading commission bleed, weekend gap blowouts. Multi-layer controls (daily limits, concurrent caps, prop firm protection) became essential.
━━━━━━━━━━━━━━━━━━━━━━━━━━━━━━━━━━━━━
LIMITATIONS & ASSUMPTIONS
What This Is NOT:
• NOT a Holy Grail: Typical performance 52-58% WR, 1.3-1.8 avg R, probabilistic edge
• NOT Predictive: Identifies high-probability conditions, doesn't forecast prices
• NOT Market-Agnostic: Best on liquid auction-driven markets (futures, forex, major crypto)
• NOT Hands-Off: Requires oversight for news events, gaps, system anomalies
• NOT Immune to Regime Changes: Adaptive engine helps but cannot predict black swans
Critical Assumptions:
1. Volume reflects intent (valid for regulated markets, violated by wash trading)
2. Pressure extremes mean-revert (true in ranging/exhaustion, fails in paradigm shifts)
3. Stop hunts exist (valid in liquid markets, less in thin/random walk periods)
4. Past patterns persist (valid in stable regimes, fails when structure fundamentally changes)
Works Best On: Major futures (ES, NQ, CL), liquid forex pairs (EUR/USD, GBP/USD), large-cap stocks, BTC
Performs Poorly On: Low-volume stocks, illiquid crypto pairs, news-driven headline events
━━━━━━━━━━━━━━━━━━━━━━━━━━━━━━━━━━━━━
RISK DISCLOSURE
Trading futures, forex, and leveraged instruments involves substantial risk of loss and is not suitable for all investors. Past performance is not indicative of future results. This strategy is provided for educational purposes only and should not be construed as financial advice.
The adaptive engine learns from historical data—there is no guarantee that past relationships will persist. Market conditions change, volatility regimes shift, and black swan events occur. No strategy can eliminate the risk of loss.
Users must validate performance on their specific instruments and timeframes before risking capital. The developer makes no warranties regarding profitability or suitability. Users assume all responsibility for trading decisions and outcomes.
"The market doesn't care about your indicators. It only cares about pressure—who's willing to pay more, who's desperate to sell. Find the exhaustion. Trade the reversal. Let the system learn the rest."
Taking you to school. — Dskyz, Trade with insight. Trade with anticipation.

STRATEGY 1 │ Red Dragon │ Model 1 │ [Titans_Invest]The Red Dragon Model 1 is a fully automated trading strategy designed to operate BTC/USDT.P on the 4-hour chart with precision, stability, and consistency. It was built to deliver reliable behavior even during strong market movements, maintaining operational discipline and avoiding abrupt variations that could interfere with the trader’s decision-making.
Its core is based on a professionally engineered logical structure that combines trend filters, confirmation criteria, and balanced risk management. Every component was designed to work in an integrated way, eliminating noise, avoiding unnecessary trades, and protecting capital in critical moments. There are no secret mechanisms or hidden logic: everything is built to be objective, clean, and efficient.
Even though it is based on professional quantitative engineering, Red Dragon Model 1 remains extremely simple to operate. All logic is clearly displayed and fully accessible within TradingView itself, making it easy to understand for both beginners and experienced traders. The structure is organized so that any user can quickly view entry conditions, exit criteria, additional filters, adjustable parameters, and the full mechanics behind the strategy’s behavior.
In addition, the architecture was built to minimize unnecessary complexity. Parameters are straightforward, intuitive, and operate in a balanced way without requiring deep adjustments or advanced knowledge. Traders have full freedom to analyze the strategy, understand the logic, and make personal adaptations if desired—always with total transparency inside TradingView.
The strategy was also designed to deliver consistent operational behavior over the long term. Its confirmation criteria reduce impulsive trades; its filters isolate noise; and its overall logic prioritizes high-quality entries in structured market movements. The goal is to provide a stable, clear, and repeatable flow—essential characteristics for any medium-term quantitative approach.
Combining clarity, professional structure, and ease of use, Red Dragon Model 1 offers a solid foundation both for users who want a ready-to-use automated strategy and for those looking to study quantitative models in greater depth.
This entire project was built with extreme dedication, backed by more than 14,000 hours of hands-on experience in Pine Script, continuously refining patterns, techniques, and structures until reaching its current level of maturity. Every line of code reflects this long process of improvement, resulting in a strategy that unites professional engineering, transparency, accessibility, and reliable execution.
🔶 MAIN FEATURES
• Fully automated and robust: Operates without manual intervention, ideal for traders seeking consistency and stability. It delivers reliable performance even in volatile markets thanks to the solid quantitative engineering behind the system.
• Multiple layers of confirmation: Combines 10 key technical indicators with 15 adaptive filters to avoid false signals. It only triggers entries when all trend, market strength, and contextual criteria align.
• Configurable and adaptable filters: Each of the 15 filters can be enabled, disabled, or adjusted by the user, allowing the creation of personalized statistical models for different assets and timeframes. This flexibility gives full freedom to optimize the strategy according to individual preferences.
• Clear and accessible logic: All entry and exit conditions are explicitly shown within the TradingView parameters. The strategy has no hidden components—any user can quickly analyze and understand each part of the system.
• Integrated exclusive tools: Includes complete backtest tables (desktop and mobile versions) with annualized statistics, along with real-time entry conditions displayed directly on the chart. These tools help monitor the strategy across devices and track performance and risk metrics.
• No repaint: All signals are static and do not change after being plotted. This ensures the trader can trust every entry shown without worrying about indicators rewriting past values.
🔷 ENTRY CONDITIONS & RISK MANAGEMENT
Red Dragon Model 1 triggers buy (long) or sell (short) signals only when all configured conditions are satisfied. For example:
• Volume:
• The system only trades when current volume exceeds the volume moving average multiplied by a user-defined factor, indicating meaningful market participation.
• RSI:
• Confirms bullish bias when RSI crosses above its moving average, and bearish bias when crossing below.
• ADX:
• Enters long when +DI is above –DI with ADX above a defined threshold, indicating directional strength to the upside (and the opposite conditions for shorts).
• Other indicators (MACD, SAR, Ichimoku, Support/Resistance, etc.)
Each one must confirm the expected direction before a final signal is allowed.
When all bullish criteria are met simultaneously, the system enters Long; when all criteria indicate a bearish environment, the system enters Short.
In addition, the strategy uses fixed Take Profit and Stop Loss targets for risk control:
Currently: TP around 1.5% and SL around 2.0% per trade, ensuring consistent and transparent risk management on every position.
⚙️ INDICATORS
__________________________________________________________
1) 🔊 Volume: Avoids trading on flat charts.
2) 🍟 MACD: Tracks momentum through moving averages.
3) 🧲 RSI: Indicates overbought or oversold conditions.
4) 🅰️ ADX: Measures trend strength and potential entry points.
5) 🥊 SAR: Identifies changes in price direction.
6) ☁️ Cloud: Accurately detects changes in market trends.
7) 🌡️ R/F: Improves trend visualization and helps avoid pitfalls.
8) 📐 S/R: Fixed support and resistance levels.
9)╭╯MA: Moving Averages.
10) 🔮 LR: Forecasting using Linear Regression.
__________________________________________________________
🟢 ENTRY CONDITIONS 🔴
__________________________________________________________
IF all conditions are 🟢 = 📈 Long
IF all conditions are 🔴 = 📉 Short
__________________________________________________________
🚨 CURRENT TRIGGER SIGNAL 🚨
__________________________________________________________
🔊 Volume
🟢 LONG = (volume) > (MA_volume) * (Volume Mult)
🔴 SHORT = (volume) > (MA_volume) * (Volume Mult)
🧲 RSI
🟢 LONG = (RSI) > (RSI_MA)
🔴 SHORT = (RSI) < (RSI_MA)
🟢 ALL ENTRY CONDITIONS AVAILABLE 🔴
__________________________________________________________
🔊 Volume
🟢 LONG = (volume) > (MA_volume) * (Volume Mult)
🔴 SHORT = (volume) > (MA_volume) * (Volume Mult)
🔊 Volume
🟢 LONG = (volume) > (MA_volume) * (Volume Mult) and (close) > (open)
🔴 SHORT = (volume) > (MA_volume) * (Volume Mult) and (close) < (open)
🍟 MACD
🟢 LONG = (MACD) > (Signal Smoothing)
🔴 SHORT = (MACD) < (Signal Smoothing)
🧲 RSI
🟢 LONG = (RSI) < (Upper)
🔴 SHORT = (RSI) > (Lower)
🧲 RSI
🟢 LONG = (RSI) > (RSI_MA)
🔴 SHORT = (RSI) < (RSI_MA)
🅰️ ADX
🟢 LONG = (+DI) > (-DI) and (ADX) > (Treshold)
🔴 SHORT = (+DI) < (-DI) and (ADX) > (Treshold)
🥊 SAR
🟢 LONG = (close) > (SAR)
🔴 SHORT = (close) < (SAR)
☁️ Cloud
🟢 LONG = (Cloud A) > (Cloud B)
🔴 SHORT = (Cloud A) < (Cloud B)
☁️ Cloud
🟢 LONG = (Kama) > (Kama )
🔴 SHORT = (Kama) < (Kama )
🌡️ R/F
🟢 LONG = (high) > (UP Range) and (upward) > (0)
🔴 SHORT = (low) < (DOWN Range) and (downward) > (0)
🌡️ R/F
🟢 LONG = (high) > (UP Range)
🔴 SHORT = (low) < (DOWN Range)
📐 S/R
🟢 LONG = (close) > (Resistance)
🔴 SHORT = (close) < (Support)
╭╯MA2️⃣
🟢 LONG = (Cyan Bar MA2️⃣)
🔴 SHORT = (Red Bar MA2️⃣)
╭╯MA2️⃣
🟢 LONG = (close) > (MA2️⃣)
🔴 SHORT = (close) < (MA2️⃣)
╭╯MA2️⃣
🟢 LONG = (Positive MA2️⃣)
🔴 SHORT = (Negative MA2️⃣)
__________________________________________________________
🎯 TP / SL 🛑
__________________________________________________________
🎯 TP: 1.5 %
🛑 SL: 2.0 %
__________________________________________________________
🪄 UNIQUE FEATURES OF THIS STRATEGY
____________________________________
1) 𝄜 Table Backtest for Mobile.
2) 𝄜 Table Backtest for Computer.
3) 𝄜 Table Backtest for Computer & Annual Performance.
4) 𝄜 Live Entry Conditions.
1) 𝄜 Table Backtest for Mobile.
2) 𝄜 Table Backtest for Computer.
3) 𝄜 Table Backtest for Computer & Annual Performance.
4) 𝄜 Live Entry Conditions.
_____________________________
𝄜 BACKTEST / PERFORMANCE 𝄜
_____________________________
• Net Profit: +634.47%, Maximum Drawdown: -18.44%.
🪙 PAIR / TIMEFRAME ⏳
🪙 PAIR: BINANCE:BTCUSDT.P
⏳ TIME: 4 hours (240m)
✅ ON ☑️ OFF
✅ LONG
✅ SHORT
🎯 TP / SL 🛑
🎯 TP: 1.5 (%)
🛑 SL: 2.0 (%)
⚙️ CAPITAL MANAGEMENT
💸 Initial Capital: 10000 $ (TradingView)
💲 Order Size: 10 % (Of Equity)
🚀 Leverage: 10 x (Exchange)
💩 Commission: 0.03 % (Exchange)
📆 BACKTEST
🗓️ Start: Setember 24, 2019
🗓️ End: November 21, 2025
🗓️ Days: 2250
🗓️ Yers: 6.17
🗓️ Bars: 13502
📊 PERFORMANCE
💲 Net Profit: + 63446.89 $
🟢 Net Profit: + 634.47 %
💲 DrawDown Maximum: - 10727.48 $
🔴 DrawDown Maximum: - 18.44 %
🟢 Total Closed Trades: 1042
🟡 Percent Profitable: 63.92 %
🟡 Profit Factor: 1.247
💲 Avg Trade: + 60.89 $
⏱️ Avg # Bars in Trades
🕯️ Avg # Bars: 4
⏳ Avg # Hrs: 15
✔️ Trades Winning: 666
❌ Trades Losing: 376
✔️ Maximum Consecutive Wins: 11
❌ Maximum Consecutive Losses: 7
📺 Live Performance : br.tradingview.com
• Use this strategy on the recommended pair and timeframe above to replicate the tested results.
• Feel free to experiment and explore other settings, assets, and timeframes.

ParabolicSAR+EMA[TS_Indie]🚀 EMA + Parabolic SAR Reversal Trading Strategy
This trading system effectively combines the use of Exponential Moving Averages (EMA) with the Parabolic SAR to identify both price trends and key reversal points. The EMA Fast is used to signal the primary short-term trend, while the EMA Slow acts as a filter for the long-term trend direction. The Parabolic SAR then helps to confirm the reversal signals.
🛠️ Tools Used
1. EMA Fast – Primary Short-Term Trend
2. EMA Slow – Long-Term Trend Filter
3. Parabolic SAR – Reversal Confirmation
🎯 Entry Rules
📈 Buy Setup
1. Trend Filter: EMA Fast > EMA Slow → Uptrend
2. Pullback: Price pulls back and closes below the EMA Fast line.
3. Reversal: Price reverses/pulls back up and closes above the EMA Fast line.
4. SAR Confirmation: The previous Parabolic SAR dot is above the high, and the dot in the current candle is below the low → Reversal signal confirmed.
5. Entry: Enter Buy immediately.
📉 Sell Setup
1. Trend Filter: EMA Fast < EMA Slow → Downtrend
2. Pullback: Price pulls back and closes above the EMA Fast line.
3. Reversal: Price reverses/pulls back down and closes below the EMA Fast line.
4. SAR Confirmation: The previous Parabolic SAR dot is below the low, and the dot in the current candle is above the high → Reversal signal confirmed.
5. Entry: Enter Sell immediately.
💰 Exit Management (Entry, Stop Loss, Take Profit)
1. Entry: Enter the order at the closing price of the signal candle.
2. Stop Loss (SL): Set the Stop Loss at the Parabolic SAR dot.
3. Take Profit (TP): Calculated from the Entry and Stop Loss points, multiplied by the Risk Reward Ratio.
⚙️ Optional Parameters
➭ Custom Risk/Reward Ratio for Take Profit.
➭ Option to add an ATR buffer to the Stop Loss.
➭ Adjustable EMA Fast period.
➭ Adjustable EMA Slow period.
➭ Adjustable Parabolic SAR parameters.
➭ Option to enable Long-only / Short-only positions.
➭ Customizable Backtest start and end date.
➭ Customizable trading session time.
🔔 Alert Function
Alerts display:
➭ Entry Price
➭ Stop Loss Price
➭ Take Profit Price
💡 This strategy allows for many parameter adjustments, such as the MA type, adding/subtracting from the Stop Loss using ATR, and selecting specific sessions for backtesting. If you find interesting or profitable results after adjusting the parameters, please share your comments with other traders!
⚠️ Disclaimer
This indicator is designed for educational and research purposes only. It does not guarantee profits and should not be considered financial advice. Trading in financial markets involves significant risk , including the potential loss of capital.

Golden Cross 50/200 EMATrend-following systems are characterized by having a low win rate, yet in the right circumstances (trending markets and higher timeframes) they can deliver returns that even surpass those of systems with a high win rate.
Below, I show you a simple bullish trend-following system with clear execution rules:
System Rules
-Long entries when the 50-period EMA crosses above the 200-period EMA.
-Stop Loss (SL) placed at the lowest low of the 15 candles prior to the entry candle.
-Take Profit (TP) triggered when the 50-period EMA crosses below the 200-period EMA.
Risk Management
-Initial capital: $10,000
-Position size: 10% of capital per trade
-Commissions: 0.1% per trade
Important Note:
In the code, the stop loss is defined using the swing low (15 candles), but the position size is not adjusted based on the distance to the stop loss. In other words, 10% of the equity is risked on each trade, but the actual loss on the trade is not controlled by a maximum fixed percentage of the account — it depends entirely on the stop loss level. This means the loss on a single trade could be significantly higher or lower than 10% of the account equity, depending on volatility.
Implementing leverage or reducing position size based on volatility is something I haven’t been able to include in the code, but it would dramatically improve the system’s performance. It would fix a consistent percentage loss per trade, preventing losses from fluctuating wildly with changes in volatility.
For example, we can maintain a fixed loss percentage when volatility is low by using the following formula:
Leverage = % of SL you’re willing to risk / % volatility from entry point to stop loss
And when volatility is high and would exceed the fixed percentage we want to expose per trade (if the SL is hit), we could reduce the position size accordingly.
Practical example:
Imagine we only want to risk 15% of the position value if the stop loss is triggered on Tesla (which has high volatility), but the distance to the SL represents a potential 23.57% drop. In this case, we subtract the desired risk (15%) from the actual volatility-based loss (23.57%):
23.57% − 15% = 8.57%
Now suppose we normally use $200 per trade.
To calculate 8.57% of $200:
200 × (8.57 / 100) = $17.14
Then subtract that amount from the original position size:
$200 − $17.14 = $182.86
In summary:
If we reduce the position size to $182.86 (instead of the usual $200), even if Tesla moves 23.57% against us and hits the stop loss, we would still only lose approximately 15% of the original $200 position — exactly the risk level we defined. This way, we strictly respect our risk management rules regardless of volatility swings.
I hope this clearly explains the importance of capping losses at a fixed percentage per trade. This keeps risk under control while maintaining a consistent percentage of capital invested per trade — preventing both statistical distortion of the system and the potential destruction of the account.
About the code:
Strategy declaration:
The strategy is named 'Golden Cross 50/200 EMA'.
overlay=true means it will be drawn directly on the price chart.
initial_capital=10000 sets the initial capital to $10,000.
default_qty_type=strategy.percent_of_equity and default_qty_value=10 means each trade uses 10% of available equity.
margin_long=0 indicates no margin is used for long positions (this is likely for simulation purposes only; in real trading, margin would be required).
commission_type=strategy.commission.percent and commission_value=0.1 sets a 0.1% commission per trade.
Indicators:
Calculates two EMAs: a 50-period EMA (ema50) and a 200-period EMA (ema200).
Crossover detection:
bullCross is triggered when the 50-period EMA crosses above the 200-period EMA (Golden Cross).
bearCross is triggered when the 50-period EMA crosses below the 200-period EMA (Death Cross).
Recent swing:
swingLow calculates the lowest low of the previous 15 periods.
Stop Loss:
entryStopLoss is a variable initialized as na (not available) and is updated to the current swingLow value whenever a bullCross occurs.
Entry and exit conditions:
Entry: When a bullCross occurs, the initial stop loss is set to the current swingLow and a long position is opened.
Exit on opposite signal: When a bearCross occurs, the long position is closed.
Exit on stop loss: If the price falls below entryStopLoss while a position is open, the position is closed.
Visualization:
Both EMAs are plotted (50-period in blue, 200-period in red).
Green triangles are plotted below the bar on a bullCross, and red triangles above the bar on a bearCross.
A horizontal orange line is drawn that shows the stop loss level whenever a position is open.
Alerts:
Alerts are created for:Long entry
Exit on bearish crossover (Death Cross)
Exit triggered by stop loss
Favorable Conditions:
Tesla (45-minute timeframe)
June 29, 2010 – November 17, 2025
Total net profit: $12,458.73 or +124.59%
Maximum drawdown: $1,210.40 or 8.29%
Total trades: 107
Winning trades: 27.10% (29/107)
Profit factor: 3.141
Tesla (1-hour timeframe)
June 29, 2010 – November 17, 2025
Total net profit: $7,681.83 or +76.82%
Maximum drawdown: $993.36 or 7.30%
Total trades: 75
Winning trades: 29.33% (22/75)
Profit factor: 3.157
Netflix (45-minute timeframe)
May 23, 2002 – November 17, 2025
Total net profit: $11,380.73 or +113.81%
Maximum drawdown: $699.45 or 5.98%
Total trades: 134
Winning trades: 36.57% (49/134)
Profit factor: 2.885
Netflix (1-hour timeframe)
May 23, 2002 – November 17, 2025
Total net profit: $11,689.05 or +116.89%
Maximum drawdown: $844.55 or 7.24%
Total trades: 107
Winning trades: 37.38% (40/107)
Profit factor: 2.915
Netflix (2-hour timeframe)
May 23, 2002 – November 17, 2025
Total net profit: $12,807.71 or +128.10%
Maximum drawdown: $866.52 or 6.03%
Total trades: 56
Winning trades: 41.07% (23/56)
Profit factor: 3.891
Meta (45-minute timeframe)
May 18, 2012 – November 17, 2025
Total net profit: $2,370.02 or +23.70%
Maximum drawdown: $365.27 or 3.50%
Total trades: 83
Winning trades: 31.33% (26/83)
Profit factor: 2.419
Apple (45-minute timeframe)
January 3, 2000 – November 17, 2025
Total net profit: $8,232.55 or +80.59%
Maximum drawdown: $581.11 or 3.16%
Total trades: 140
Winning trades: 34.29% (48/140)
Profit factor: 3.009
Apple (1-hour timeframe)
January 3, 2000 – November 17, 2025
Total net profit: $9,685.89 or +94.93%
Maximum drawdown: $374.69 or 2.26%
Total trades: 118
Winning trades: 35.59% (42/118)
Profit factor: 3.463
Apple (2-hour timeframe)
January 3, 2000 – November 17, 2025
Total net profit: $8,001.28 or +77.99%
Maximum drawdown: $755.84 or 7.56%
Total trades: 67
Winning trades: 41.79% (28/67)
Profit factor: 3.825
NVDA (15-minute timeframe)
January 3, 2000 – November 17, 2025
Total net profit: $11,828.56 or +118.29%
Maximum drawdown: $1,275.43 or 8.06%
Total trades: 466
Winning trades: 28.11% (131/466)
Profit factor: 2.033
NVDA (30-minute timeframe)
January 3, 2000 – November 17, 2025
Total net profit: $12,203.21 or +122.03%
Maximum drawdown: $1,661.86 or 10.35%
Total trades: 245
Winning trades: 28.98% (71/245)
Profit factor: 2.291
NVDA (45-minute timeframe)
January 3, 2000 – November 17, 2025
Total net profit: $16,793.48 or +167.93%
Maximum drawdown: $1,458.81 or 8.40%
Total trades: 172
Winning trades: 33.14% (57/172)
Profit factor: 2.927

Seawolf Pivot Hunter [Strategy]Overview
Seawolf Pivot Hunter is a practical trading strategy that enhances the classic pivot-box breakout system with a structured risk-management framework. Using ATR-based stop loss and take-profit calculations, position sizing, multi-layer filtering, and daily loss-limit protection, it provides a stable and sustainable trading environment. It preserves the strengths of the original version while adding systems designed to manage real-market risks more effectively.
Core Philosophy
The most important element in trading is not generating profits but controlling losses. Even the best entry signals cannot compensate for a single large loss that wipes out accumulated gains. This strategy precisely calculates the risk exposure for every trade and includes multiple layers of protection to safeguard the account under worst-case scenarios.
Indicator Setup Link
kr.tradingview.com
Example of Optimal Parameter Settings
Asset (Exchange): ETH/USDT (Binance)
Timeframe: 15-minute chart
Pivot Detection Length: 5
Upper Box Width: 2
Lower Box Width: 2
Enable Risk Management: False
Use Trailing Stop: False
Use Volume Filter
-Min Buy Volume % for Long: 50
-Min Sell Volume % for Short: 50
Use Trend Filter (EMA): False
Enable Max Loss Protection
-Max Daily Loss ($): 200
-Max Trades Per Day: 10
Calculated Bars: 50,000
Risk-Management System
Every trade automatically receives a stop-loss level at the moment of entry. The stop is calculated using ATR, adjusting dynamically to market volatility. When volatility increases, the stop widens; in stable conditions, it tightens to reduce unnecessary exits. The default distance is set to twice the ATR.
The standard take-profit level is set to four times the ATR, providing a 1:2 risk-reward structure. With this ratio, even a 50 percent win rate can produce profitability—while the typical trade structure aims for small losses and larger gains to support long-term performance.
A trailing-stop option is also available. Once the trade moves into profit, the stop level automatically trails behind price action, protecting gains while allowing the position to expand when momentum continues.
Position size is calculated automatically based on the selected risk percentage. For example, with a 2 percent risk setting, each stop-loss hit would result in exactly 2 percent of the account balance being lost. This ensures a consistent risk profile regardless of account size.
The daily loss-limit function prevents excessive drawdown by halting new trades once a predefined loss threshold is reached. This helps avoid emotional decision-making after consecutive losses.
A daily trade-limit feature is included as well. The default is 10 trades per day, protecting traders from overtrading and unnecessary fees.
Filtering System
The volume filter analyzes buying and selling pressure within the pivot box. Long trades are allowed only when buy volume exceeds a specified percentage; shorts require sell-volume dominance. The default threshold is 55 percent.
The trend filter uses an EMA to determine market direction. When price is above the 200-EMA, only long signals are permitted; when below, only shorts are allowed. This ensures alignment with the broader trend and reduces counter-trend risk.
Each filter can be toggled independently. More filters generally reduce trade frequency but improve signal quality.
Real-Time Monitoring
A real-time statistics panel displays daily profit/loss, the number of trades taken, the maximum allowed trades, and whether new trades are currently permitted. When daily limits are reached, the panel provides clear visual warnings.
Entry Logic
A trade is validated only after a pivot-box breakout occurs and all active filters—volume, trend, daily loss limit, and daily trade limit—are satisfied. Position size, stop loss, and take-profit levels are then calculated automatically. Entry arrows and labels on the chart help with later review and analysis.
Setup Guide
Risk percentage is the most critical setting. Beginners should start at 1 percent. Anything above 3 percent becomes aggressive.
ATR stop-loss multipliers should reflect asset volatility.
ATR take-profit multipliers determine reward ratio; 4.0 is the standard.
Volume thresholds are typically set between 50–60 percent depending on market conditions.
Daily loss limits are typically 2–5 percent of the account.
Trading Strategy
This strategy performs best in trending environments and works especially well on the 4-hour and daily charts. New users should begin with all filters enabled and trade conservatively. A minimum of one month of paper trading is recommended before committing real capital.
Suitable Users
The strategy is ideal for beginners who lack risk-management experience as well as advanced traders seeking a customizable structure. It is particularly helpful for traders who struggle with emotional decision-making, as pre-defined limits and rules enforce discipline.
Backtesting Guide
Use at least 2–3 years of historical data that includes bullish, bearish, and sideways conditions.
Target metrics:
Sharpe ratio: 1.5 or higher
Maximum drawdown: below 25 percent
Win rate: 40 percent or higher
Total trades: at least 100 for statistical relevance
Optimization Precautions
Avoid over-fitting parameters. Always test values around the “best” setting to verify stability.
Out-of-sample testing is essential for confirming robustness.
Test across multiple assets and timeframes to ensure consistency.
Live Deployment Roadmap
After successful backtesting, follow a gradual rollout:
Paper trading for at least one month
Small-account live testing
Slow scaling as performance stabilizes
Continuous Improvement
Keep a detailed trading journal and evaluate performance each quarter using recent data.
Adapt settings as market conditions evolve.
Conclusion
Seawolf Pivot Hunter aims to provide more than simple trade signals—it is designed to create a stable and sustainable trading system built on disciplined risk management. No strategy is perfect, and long-term success depends on consistency, patience, and strict adherence to rules. Start small, verify results, and scale progressively.
Disclaimer
This strategy is for educational and research purposes only. Past performance does not guarantee future results. All trading decisions are the responsibility of the user.
개요
Seawolf Pivot Hunter는 기본 피봇 박스 브레이크아웃 전략에 전문적인 리스크 관리 시스템을 더한 실전형 트레이딩 전략입니다. ATR 기반의 손절매와 목표가 설정, 포지션 사이징, 다층 필터링 시스템, 일일 손실 제한 기능을 통해 안정적이고 지속 가능한 트레이딩 환경을 제공합니다. 기본 버전의 장점은 유지하면서 실제 시장에서 발생할 수 있는 위험을 체계적으로 관리할 수 있도록 설계되었습니다.
핵심 철학
트레이딩에서 가장 중요한 것은 수익이 아니라 손실 관리입니다. 아무리 훌륭한 진입 조건이 있어도 한 번의 큰 손실로 모든 수익이 사라질 수 있습니다. 이 전략은 각 거래마다 감수할 리스크를 명확히 계산하고, 최악의 상황에서도 계좌를 보호하기 위한 다양한 안전장치를 제공합니다.
지표 적용 링크 공유
kr.tradingview.com
최적 조건값 설정(예시)
"종목(거래소): ETH/USDT(Binance)", "15 분봉 기준"
-Pivot Detection Length: 5
-Upper Box width: 2
-Lower Box width: 2
-Enable Risk Management: False
-Use Trailing Stop: False
-Use Volume Filter
-Min Buy Volume % for Long: 50
-Min Buy Volume % for Long: 50
-Use Trend Filter(EMA): False
-Enable Max Loss Protection
-Max Daily Loss($): 200
-Max Trades Per Day: 10
-Calucated bars: 50000
리스크 관리 시스템
모든 거래는 진입과 동시에 손절매 주문이 자동 설정됩니다. 손절가는 ATR을 기준으로 계산되며, 시장의 변동성에 따라 자동으로 조정됩니다. 변동성이 큰 시장에서는 넓은 손절폭을, 안정적인 시장에서는 좁은 손절폭을 사용해 불필요한 청산을 줄입니다. 기본값은 ATR의 2배입니다.
목표가는 ATR의 4배를 기본값으로 설정하여 손익비 1:2 구조를 유지합니다. 승률이 50퍼센트만 되어도 수익성이 가능하며, 실제로는 손절은 짧고 이익은 길게 가져가는 방식으로 장기 성과를 확보합니다.
트레일링 스톱 기능도 제공됩니다. 포지션이 수익 구간에 들어서면 손절가가 자동으로 함께 움직이며 수익을 보호합니다. 이 기능은 사용자가 켜거나 끌 수 있습니다.
포지션 크기는 리스크 퍼센트 기반으로 자동 계산됩니다. 예를 들어 리스크를 2퍼센트로 설정하면 손절 시 계좌 자산의 2퍼센트만 잃도록 수량이 조절됩니다. 계좌 크기와 무관하게 항상 일정한 비율의 리스크만 감수하게 되는 방식입니다.
일일 손실 제한 기능은 하루에 허용 가능한 최대 손실을 초과하지 않도록 합니다. 지정 금액에 도달하면 당일 거래는 더 이상 실행되지 않습니다. 감정적 거래를 막고 일정한 규율을 유지하도록 돕습니다.
일일 거래 횟수 제한 기능도 제공됩니다. 기본값은 하루 10회로, 과매매와 수수료 증가를 방지합니다.
필터링 시스템
볼륨 필터는 박스 구간 내 매수·매도 압력을 분석해 진입 신호를 검증합니다. 롱은 매수 볼륨이 일정 비율 이상일 때, 숏은 매도 볼륨이 우세할 때만 진입합니다. 기본값은 55퍼센트입니다.
추세 필터는 EMA를 사용하며, 가격이 200EMA 위에 있을 때는 롱 신호만, 아래에서는 숏 신호만 허용합니다. 큰 추세 방향에만 거래하여 역추세 리스크를 줄입니다.
필터는 독립적으로 켜고 끌 수 있으며, 필터가 많을수록 거래 횟수는 줄지만 신호 품질은 향상됩니다.
실시간 모니터링
화면에 실시간 통계 테이블이 표시되며, 일일 손익, 거래 횟수, 최대 허용 횟수, 현재 거래 가능 여부가 즉시 확인됩니다. 손실 제한 또는 거래 제한 도달 시 시각적으로 표시됩니다.
진입 로직
피봇 박스 브레이크아웃 발생 후 볼륨 필터, 추세 필터, 일일 손실·거래 제한을 모두 통과하면 포지션 크기를 계산하고 손절·목표가를 설정한 뒤 진입합니다. 진입 지점에는 화살표와 레이블이 표시되어 분석에 도움을 줍니다.
설정 가이드
리스크 퍼센트는 가장 중요한 설정입니다. 초보자는 1퍼센트를 추천하며 3퍼센트 이상은 위험합니다.
손절 ATR 배수는 자산 특성에 맞게 조절합니다.
목표가 ATR 배수는 손익비를 결정하며 기본값은 4.0입니다.
볼륨 비율은 시장 상황에 따라 50~60퍼센트 내외로 조정합니다.
일일 손실 제한은 계좌의 2~5퍼센트 수준이 적절합니다.
사용 전략
추세가 명확한 시장에서 가장 효과적이며, 4시간봉 또는 일봉을 추천합니다. 초반에는 모든 필터를 켜고 보수적으로 시작하며, 최소 한 달간 페이퍼 트레이딩을 권장합니다.
적합한 사용자
리스크 관리 경험이 부족한 초보자부터, 커스터마이징을 원하는 경험자까지 폭넓게 적합합니다. 감정적 트레이딩을 억제하는 기능이 있어 규율 유지가 어렵던 트레이더에게 특히 유용합니다.
백테스트 가이드
최소 2~3년 데이터로 테스트하며, 상승·하락·횡보 모두 포함해야 합니다.
샤프비율 1.5 이상, 최대 낙폭 25퍼센트 이하를 목표로 합니다.
승률은 40퍼센트 이상이면 충분합니다.
최소 100회 이상 거래가 있어야 통계적으로 의미가 있습니다.
최적화 주의사항
과최적화를 피하고 주변 값도 테스트해야 합니다.
샘플 외 기간 검증은 필수입니다.
여러 자산·여러 시간대에서 테스트하여 일관성을 확인해야 합니다.
실전 적용 로드맵
백테스트 후 바로 실전 투입하지 말고, 한 달 이상의 페이퍼 트레이딩 → 소액 실전 → 점진적 확대 순으로 진행합니다.
지속적 개선
일지를 기록하고 분기마다 최신 데이터로 점검합니다.
시장 변화에 따라 유연하게 조정해야 합니다.
마치며
Seawolf Pivot Hunter는 단순 신호 제공을 넘어, 안전하고 지속 가능한 트레이딩 환경 구축을 목표로 합니다. 어떤 전략도 완벽할 수 없으며, 장기적 성공을 위해서는 규칙 준수와 인내가 가장 중요합니다. 충분한 검증을 거쳐 작은 금액으로 시작하고 점진적으로 확장해나가는 접근을 추천합니다.
면책 조항
이 전략은 교육 및 연구 목적이며, 과거 성과는 미래를 보장하지 않습니다. 모든 투자 결정은 본인의 판단과 책임 하에 이루어져야 합니다.

Velocity SmartMoney Engine work - Delta Exchange📈 Velocity SmartMoney Engine
Adaptive Breakout & Order Block Strategy with Dynamic Risk Control
---
🔍 Overview
The Velocity SmartMoney Engine is a next-generation trading strategy that fuses Smart Money breakout logic , Order Block structure detection , and Supertrend-based directional filtering into one precision-built system.
It identifies institutional-level breakouts , manages positions with ATR-based adaptive risk , and executes disciplined exits using stop-loss, trailing stop, and profit target logic.
Designed for swing and short-term system traders, this strategy performs excellently on BTC, ETH, NIFTY, BANKNIFTY, Gold, and major FX pairs — best on 15m to 4h timeframes .
---
⚙️ Core Components
1️⃣ Smart Money Breakout Logic
Detects real breakouts using dynamic support/resistance pivots.
Confirms entries only during strong volatility bursts.
Avoids false breakouts in sideways markets.
2️⃣ Order Block Gap Detection
Finds institutional imbalance zones (Smart Money footprints).
Bullish gaps = Long bias; Bearish gaps = Short bias.
Works with candle confirmation and momentum validation.
3️⃣ Supertrend Directional Filter
Trades only in direction of Supertrend bias.
Exits instantly when Supertrend flips.
Prevents entries against dominant trend.
4️⃣ ATR-Based Risk & Volatility Filter
Uses ATR × multiplier for adaptive stop sizing.
Volatility filter ensures trades trigger only during active markets.
Avoids whipsaw zones.
---
💰 Position Management
Stop-Loss: Adaptive ATR-based.
Take-Profit: Default 5% target (editable input).
Trailing Stop: Auto-adjusts to lock profits.
No-Exit Hold: Hold position for defined candles before exits.
Supertrend Flip Exit: Instant trend-based closure.
---
🧠 Built-In Trade Discipline
One-trade-per-bar guard prevents duplicate entries.
Volatility-weighted breakout validation.
Clean and conflict-free exit hierarchy.
---
🎯 Key Features
✅ Smart Money breakout + Order Block fusion
✅ Supertrend-based trend confirmation
✅ ATR dynamic stop + 5% profit target
✅ Adaptive trailing logic
✅ One-trade-per-bar control
✅ Works across Crypto, Indices, FX, Commodities
✅ Ideal for 1h–4h swing setups
---
📊 Recommended Settings
Parameter | Typical Value | Purpose
--- | --- | ---
Levels Period | 20 | Pivot lookback for S/R zones
Volatility Filter | 20–40 | Filters out low-momentum areas
ATR Multiplier | 1.5 | Adjust stop size by volatility
Supertrend Length | 10 | ATR period for trend bias
Supertrend Multiplier | 3.0 | Supertrend sensitivity
Target Profit | 5% | Default take-profit level
---
⚡ Suggested Use
• Best suited for swing entries on 1H / 4H charts .
• Combine with session filters or trend confluence for automation.
• Ideal as a base module for TradingView + Broker integrations .
---
🧩 Disclaimer
This script is for educational purposes only .
Past performance does not guarantee future returns.
Use responsibly. The developer assumes no liability for financial losses.
---
💬 Community & Access
Developed by: Shubham Singh
Version: Velocity SmartMoney Engine v1.0
For premium modules & automation: DM "Velocity Access" on chat to request access.
---
© 2025 Velocity SmartMoney Engine — All Rights Reserved

ULTIMATE COAIUSDT AUTOMATED STRATEGY# ULTIMATE COAIUSDT AUTOMATED STRATEGY
## 🚀 OVERVIEW
High-performance automated trading strategy for COAIUSDT.P perpetual contract achieving 5,962% returns in one month with 68.58% win rate across 611 trades.
## 📊 PERFORMANCE METRICS
• Net Profit: +5,962.87%
• Total Trades: 611
• Win Rate: 68.58% (419 wins)
• Profit Factor: 6.41
• Max Drawdown: -6.11%
• Timeframe: 5 minutes
• Backtest Period: Oct 2 - Nov 7, 2025
## 🎯 CORE TRADING LOGIC
Primary Indicator: ALMA (Arnaud Legoux Moving Average)
• Dual ALMA crossovers for precise entry signals
• Optimized parameters: Offset 0.85, Sigma 5, Period 2
• Reduces lag while maintaining signal accuracy
Multi-Timeframe Confirmation:
• HTF Filter: 15-minute timeframe validation
• HTF Multiplier: 8x for trend confirmation
• Eliminates false signals by requiring 5m + 15m alignment
Entry Signals:
• LONG: Fast ALMA crosses above slow ALMA (both timeframes)
• SHORT: Fast ALMA crosses below slow ALMA (both timeframes)
• EXIT: Opposite crossover triggers position close
## 💰 RISK MANAGEMENT
Take Profit: 13.5%
• Dynamically calculated from entry price
• Automatically locked when target reached
Stop Loss: 2.8%
• Tight stop to protect capital
• Optimized through extensive backtesting
Position Sizing:
• Pyramiding: Up to 12 positions
• Trade size: 20% of equity per trade
• Commission: 0.04% included in calculations
## 🤖 AUTOMATION FEATURES
Built-in Alert System:
• Webhook-ready
• Real-time signal transmission
• Pipe-delimited format for easy parsing
Alert Types:
• BUY: BUY|COAIUSDT.P|price=X|tp=Y|sl=Z
• SELL: SELL|COAIUSDT.P|price=X|tp=Y|sl=Z
• CLOSE LONG: CLOSE|COAIUSDT.P|side=LONG
• CLOSE SHORT: CLOSE|COAIUSDT.P|side=SHORT
## 📈 STRATEGY STRENGTHS
1. High Win Rate: 68.58% consistent edge
2. Excellent Profit Factor: 6.41 (profits 6.4x larger than losses)
3. Low Drawdown: Only -6.11% despite massive returns
4. Active Trading: 611 opportunities in 1 month
5. Automation Ready: Built-in webhook alerts
6. Optimized Risk/Reward: 4.8:1 ratio (13.5% TP / 2.8% SL)
## 🎨 VISUAL SIGNALS
• Green triangle + "BUY" label for long entries
• Red triangle + "SELL" label for short entries
• Clear exit markers for position closes
• Minimal chart clutter
## ⚠️ IMPORTANT DISCLAIMERS
• Strategy optimized specifically for COAIUSDT.P on 5-minute timeframe
• Past performance (5,962% returns) does not guarantee future results
• Use proper position sizing - never risk more than you can afford to lose
• Monitor strategy regularly, especially during high-impact news events
• Backtested results may differ from live trading due to slippage and execution
## 🔧 BEST PRACTICES
• Start with paper trading to verify signals
• Use stop-loss protection at all times
• Monitor drawdown levels regularly
• Adjust position size based on account risk tolerance
• Consider market conditions and volatility
The ULTIMATE COAIUSDT AUTOMATED STRATEGY combines sophisticated technical analysis with robust risk management and full automation capabilities - designed to capture consistent profits from COAI's price movements while maintaining strict capital protection.

Adaptive Trend 1m ### Overview
The "Adaptive Trend Impulse Parallel SL/TP 1m Realistic" strategy is a sophisticated trading system designed specifically for high-volatility markets like cryptocurrencies on 1-minute timeframes. It combines trend-following with momentum filters and adaptive parameters to dynamically adjust to market conditions, ensuring more reliable entries and risk management. This strategy uses SuperTrend for primary trend detection, enhanced by MACD, RSI, Bollinger Bands, and optional volume spikes. It incorporates parallel stop-loss (SL) and multiple take-profit (TP) levels based on ATR, with options for breakeven and trailing stops after the first TP. Optimized for realistic backtesting on short timeframes, it avoids over-optimization by adapting indicators to market speed and efficiency.
### Principles of Operation
The strategy operates on the principle of adaptive impulse trading, where entry signals are generated only when multiple conditions align to confirm a strong trend reversal or continuation:
1. **Trend Detection (SuperTrend)**: The core signal comes from an adaptive SuperTrend indicator. It calculates upper and lower bands using ATR (Average True Range) with dynamic periods and multipliers. A buy signal occurs when the price crosses above the lower band (from a downtrend), and a sell signal when it crosses below the upper band (from an uptrend). Adaptation is based on Rate of Change (ROC) to measure market speed, shortening periods in fast markets for quicker responses.
2. **Momentum and Trend Filters**:
- **MACD**: Uses adaptive fast and slow lengths. In "Trend Filter" mode (default when "Use MACD Cross" is false), it checks if the MACD line is above/below the signal for long/short. In cross mode, it requires a crossover/crossunder.
- **RSI**: Adaptive period RSI must be above 50 for longs and below 50 for shorts, confirming overbought/oversold conditions dynamically.
- **Bollinger Bands (BB)**: Depending on the mode ("Midline" by default), it requires the price to be above/below the BB midline for longs/shorts, or a breakout in "Breakout" mode. Deviation adapts to market efficiency.
- **Volume Spike Filter** (optional): Entries require volume to exceed an adaptive multiple of its SMA, signaling strong impulse.
3. **Volatility Filter**: Entries are only allowed if current ATR percentage exceeds a historical minimum (adaptive), preventing trades in low-volatility ranges.
4. **Risk Management (Parallel SL/TP)**:
- **Stop-Loss**: Set at an adaptive ATR multiple below/above entry for long/short.
- **Take-Profits**: Three levels at adaptive ATR multiples, with partial position closures (e.g., 51% at TP1, 25% at TP2, remainder at TP3).
- **Post-TP1 Features**: Optional breakeven moves SL to entry after TP1. Trailing SL uses BB midline as a dynamic trail.
- All levels are calculated per trade using the ATR at entry, making them "realistic" for 1m charts by widening SL and tightening initial TPs.
The strategy enters long on buy signals with all filters met, and short on sell signals. It uses pyramid margin (100% long/short) for full position sizing.
Adaptation is driven by:
- **Market Speed (normSpeed)**: Based on ROC, tightens multipliers in volatile periods.
- **Efficiency Ratio (ER)**: Measures trend strength, adjusting periods for trending vs. ranging markets.
This ensures the strategy "adapts" without manual tweaks, reducing false signals in varying conditions.
### Main Advantages
- **Adaptability**: Unlike static strategies, parameters dynamically adjust to market volatility and trend strength, improving performance across ranging and trending phases without over-optimization.
- **Realistic Risk Management for 1m**: Wider SL and tiered TPs prevent premature stops in noisy short-term charts, while partial profits lock in gains early. Breakeven/trailing options protect profits in extended moves.
- **Multi-Filter Confirmation**: Combines trend, momentum, and volume for high-probability entries, reducing whipsaws. The volatility filter avoids flat markets.
- **Debug Visualization**: Built-in plots for signals, levels, and component checks (when "Show Debug" is enabled) help users verify logic on charts.
- **Efficiency**: Low computational load, suitable for real-time trading on TradingView with alerts.
Backtesting shows robust results on volatile assets, with a focus on sustainable risk (e.g., SL at 3x ATR avoids excessive drawdowns).
### Uniqueness
What sets this strategy apart is its **fully adaptive framework** integrating multiple indicators with real-time market metrics (ROC for speed, ER for efficiency). Most trend strategies use fixed parameters, leading to poor adaptation; here, every key input (periods, multipliers, deviations) scales dynamically within bounds, creating a "self-tuning" system. The "parallel SL/TP with 1m realism" adds custom handling for micro-timeframes: tightened initial TPs for quick wins and adaptive min-ATR filter to skip low-vol bars. Unlike generic mashups, it justifies the combination—SuperTrend for trend, MACD/RSI/BB for impulse confirmation, volume for conviction—working synergistically to capture "trend impulses" while filtering noise. The post-TP1 breakeven/trailing tied to BB adds a unique profit-locking mechanism not common in open-source scripts.
### Recommended Settings
These settings are optimized and recommended for trading ASTER/USDT on Bybit, with 1-minute chart, x10 leverage, and cross margin mode. They provide a balanced risk-reward for this volatile pair:
- **Base Inputs**:
- Base ATR Period: 10
- Base SuperTrend ATR Multiplier: 2.5
- Base MACD Fast: 8
- Base MACD Slow: 17
- Base MACD Signal: 6
- Base RSI Period: 9
- Base Bollinger Period: 12
- Bollinger Deviation: 1.8
- Base Volume SMA Period: 19
- Base Volume Spike Multiplier: 1.8
- Adaptation Window: 54
- ROC Length: 10
- **TP/SL Settings**:
- Use Stop Loss: True
- Base SL Multiplier (ATR): 3
- Use Take Profits: True
- Base TP1 Multiplier (ATR): 5.5
- Base TP2 Multiplier (ATR): 10.5
- Base TP3 Multiplier (ATR): 19
- TP1 % Position: 51
- TP2 % Position: 25
- Breakeven after TP1: False
- Trailing SL after TP1: False
- Base Min ATR Filter: 0.001
- Use Volume Spike Filter: True
- BB Condition: Midline
- Use MACD Cross (false=Trend Filter): True
- Show Debug: True
For backtesting, use initial capital of 30 USD, base currency USDT, order size 100 USDT, pyramiding 1, commission 0.1%, slippage 0 ticks, long/short margin 0%.
Always backtest on your platform and use risk management—risk no more than 1-2% per trade. This is not financial advice; trade at your own risk.

Fincandle ATR Direction TrackerOverview
The Fincandle ATR Direction Tracker is a strategy designed to capture momentum moves in the market using a dynamic ATR-based trailing stop. It identifies strong momentum candles and filters signals using trend alignment with moving averages.
Partial exits allow users to take a portion of profit at a predefined ATR multiple while keeping the remaining position open until the opposite signal occurs.
How It Works
Momentum Detection:
Measures candle body size relative to the Average True Range (ATR).
A candle is considered momentum if its body size exceeds ATR × Multiplier.
Trend Filter:
Uses two moving averages (Fast MA and Slow MA) to determine the market trend.
Bullish trend: Fast MA > Slow MA → long trades allowed
Bearish trend: Fast MA < Slow MA → short trades allowed
Trend filter can be toggled on or off.
ATR Trailing Stop:
A dynamic trailing stop adapts to price volatility.
Crossing above the trail triggers a buy signal, crossing below triggers a sell signal.
Partial Exit / Take Profit:
Step 1: Exit 50% of the position when price moves a configurable multiple of ATR in your favor.
Step 2: Close the remaining position when the opposite signal occurs (e.g., price crosses below/above the ATR trail).
How to Use
Add the strategy to any chart (stocks, indices, forex, crypto).
Configure ATR period, sensitivity, take profit multiple, and moving average lengths to suit the timeframe and asset.
Monitor buy/sell markers and dynamic ATR trail on the chart.
Optional: Set alerts for real-time notifications when signals trigger.
Adjust partial exit multiplier to control risk/reward.
Example Settings
ATR Period: 10
ATR Sensitivity: 3 × ATR
Take Profit: 2 × ATR
Fast MA: 50
Slow MA: 200
Partial Exit: 50% of position at take profit, remaining exits on opposite signal
Key Features
Adaptive ATR trailing stop for volatility-based entries/exits.
Trend alignment filter with Fast/Slow MA.
Partial exit logic for better risk management.
Visual BUY/SELL markers and alerts.
Fully Pine Script v6 compatible.
Disclaimer
This strategy is for educational and analytical purposes only.
It does not guarantee profits. Traders should always use proper risk management.
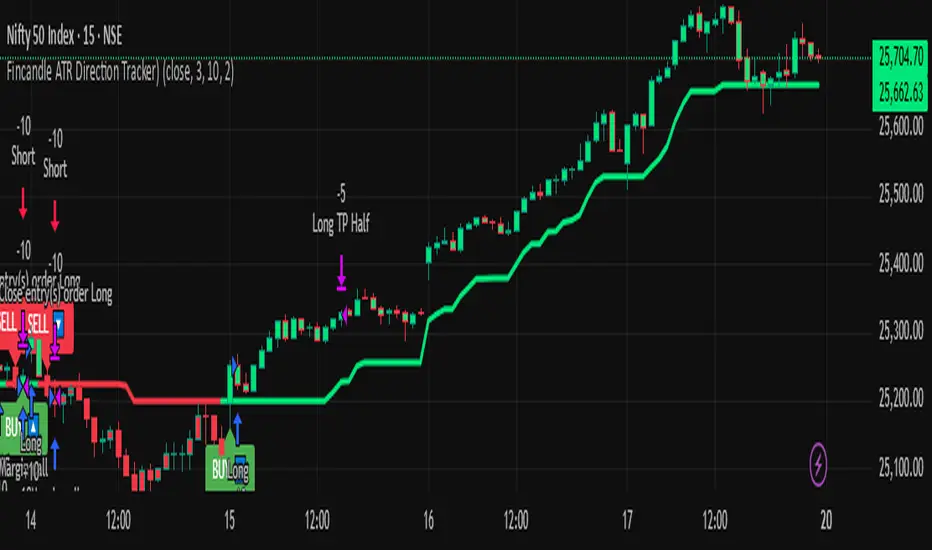
Pump-Smart Shorting StrategyThis strategy is built to keep your portfolio hedged as much as possible while maximizing profitability. Shorts are opened after pumps cool off and on new highs (when safe), and closed quickly during strong upward moves or if stop loss/profit targets are hit. It uses visual overlays to clearly show when hedging is on, off, or blocked due to momentum, ensuring you’re protected in most market conditions but never short against the pump. Fast re-entry keeps the hedge active with minimal downtime.
Pump Detection:
RSI (Relative Strength Index): Calculated over a custom period (default 14 bars). If RSI rises above a threshold (default 70), the strategy considers the market to be in a pump (strong upward momentum).
Volume Spike: The current volume is compared to a 20-bar simple moving average of volume. If it exceeds the average by 1.5× and price increases at least 5% in one bar, pump conditions are triggered.
Price Jump: Measured by (close - close ) / close . A single-bar change > 5% helps confirm rapid momentum.
Pump Zone (No Short): If any of these conditions is true, an orange or red background is shown and shorts are blocked.
Cooldown and Re-Entry:
Cooldown Detection: After the pump ends, RSI must fall below a set value (default ≤ 60), and either volume returns towards average or price momentum is less than half the original spike (oneBarUp <= pctUp/2).
barsWait Parameter: You can specify a waiting period after cooldown before a short is allowed.
Short Entry After Pump/Cooldown: When these cooldown conditions are met, and no short is active, a blue background is shown and a short position is opened at the next signal.
New High Entry:
Lookback New High: If the current high is greater than the highest high in the last N bars (default 20), and pump is NOT active, a short can be opened.
Take Profit (TP) & Stop Loss (SL):
Take Profit: Short is closed if price falls to a threshold below the entry (minProfitPerc, default 2%).
Stop Loss: Short is closed if price rises to a threshold above the entry (stopLossPerc, default 6%).
Preemptive Exit:
Any time a pump is detected while a short position is open, the strategy closes the short immediately to avoid losses.
Visual Feedback:
Orange Background: Market is pumping, do not short.
Red Background: Other conditions block shorts (cooldown or waiting).
Blue Background: Shorts allowed.
Triangles/Circles: Mark entries, pump start/end, for clear trading signals.
