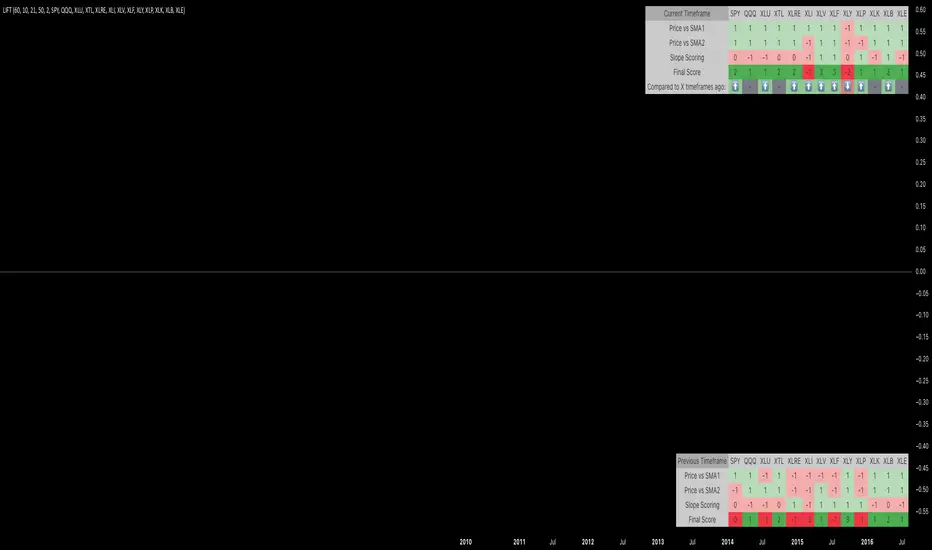
L.I.F.T. - Legaci Index Flow TrackerL.I.F.T. - Legaci Index Flow Tracker
The 'Legaci Index Flow Tracker' is a cutting-edge tool designed for traders and analysts who want to gain unparalleled insight into the strength and momentum of key market indices. This innovative indicator evaluates the relationship between 13 customisable indices and their respective Simple Moving Averages (SMAs), along with the slopes of those SMAs, to deliver a comprehensive market sentiment analysis.
Key Features:
Dynamic Scoring System :
Each index is evaluated across four categories, assigning a score of +1 (bullish) or -1 (bearish) based on price action and momentum.
Intuitive Table Display :
Scores for each index are presented in an easy-to-read table, highlighting:
The index ticker.
Individual scores for the 4 categories (price vs. SMA and slope).
A Final Score summarising the overall strength or weakness of each index.
Customisable Parameters :
Timeframe : Adapt to short-term, mid-term, or long-term trading strategies.
Lookback Period : Fine-tune slope calculations to capture precise market trends.
SMA Lengths : Adjust the moving average lengths to align with your trading methodology.
Index Selection : Choose from the 13 default indices or customise them to track your preferred market segments.
Why use the "L.I.F.T."?
This indicator is perfect for traders seeking a big-picture overview of market flow across multiple indices while maintaining the flexibility to drill down into specific trends. By tracking price action, SMA relationships, and momentum slopes in a unified framework, the Legaci Index Flow Tracker helps you:
Identify market trends at a glance.
Pinpoint the strongest and weakest indices in any timeframe.
Stay ahead of market shifts with actionable insights.
Whether you’re a day trader or a long-term strategist, the indicator is an essential addition to your toolkit, providing you with the clarity and precision needed to navigate today’s complex markets.
Pesquisar nos scripts por "price action"
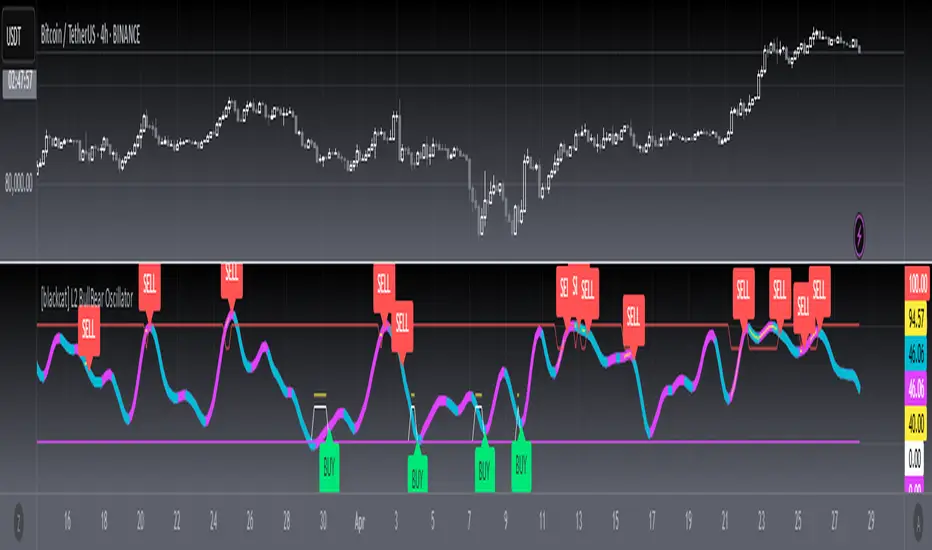
[blackcat] L2 BullBear OscillatorOVERVIEW
The " L2 BullBear Oscillator" is a custom trading indicator for TradingView that helps traders identify market trends, potential tops and bottoms, and the strength of trends using various moving averages and price relationships.
FEATURES
Calculates a base oscillator based on the close price relative to the highest and lowest prices over the past 60 periods.
Smoothes the oscillator using exponential moving averages (EMAs).
Determines market strength through relative strength indicators and moving averages.
Identifies potential tops and strong support levels based on specific conditions involving oscillators and price actions.
Plots several signals to help traders make informed decisions.
HOW TO USE
Install the script on your TradingView chart.
Customize the settings in the "Inputs" section:
Set the periods for the short-term and long-term EMAs.
Set the periods for the three SMAs used in calculations.
Interpret the plots:
BullBear Signal (Fuchsia Line): Indicates the overall market trend. Uptrends suggest buying opportunities, while downtrends suggest selling.
Decreasing BullBear Signal (Aqua Line): Highlights periods when the trend is weakening or turning bearish, signaling possible selling opportunities.
Potential Top Condition (Yellow Plot): Signals possible trend reversals from bullish to bearish, indicating times to consider taking profits or preparing for a downtrend.
High Price Condition (Yellow Plot): Indicates strong bullish momentum but also potentially overbought conditions, which might precede a correction.
Earning Condition (Red Line): Possibly signifies strong bullish signals, indicating good times to enter long positions.
Strong Support Condition (White Arrows): Signals potential bottoms or support levels, indicating buying opportunities.
Start Hiding Condition (Fuchsia Plot): Might indicate times to exit positions or reduce exposure due to unfavorable market conditions.
ALGORITHMS
Moving Averages:
Simple Moving Averages (SMAs): Used to calculate averages of price data over specified periods.
Exponential Moving Averages (EMAs): Used to give more weight to recent prices, making the moving averages more responsive to new data.
Oscillator Calculation:
The base oscillator is calculated based on the close price's position within the highest and lowest prices over 60 periods, normalized to a 0-100 scale.
This oscillator is then smoothed using EMAs to reduce noise and make trends more visible.
Relative Strength Indicator:
Calculated based on the close price's position within the highest and lowest prices over 20 periods, also normalized to a 0-100 scale.
This is smoothed using SMAs to get a more stable signal.
Condition Checks:
Various conditions are checked to identify potential tops, strong support, and other market states based on the relationships between these indicators and price actions.
LIMITATIONS
The script is based on historical data and does not guarantee future performance.
It is recommended to use the script in conjunction with other analysis tools.
The effectiveness of the strategy may vary depending on the market conditions and asset being traded.
NOTES
The script is designed for educational purposes and should not be considered financial advice.
Users are encouraged to backtest the strategy on a demo account before applying it to live trades.
THANKS
Special thanks to the TradingView community for their support and feedback.
BTC Trendline Patterns with Signals BTC Trendline Patterns with Signals
This custom Pine Script indicator automatically detects key pivot points in Bitcoin price action and draws support and resistance trendlines. The indicator provides buy (long) and sell (short) signals when these trendlines are broken. This can help traders identify potential breakout opportunities and trend reversals based on established price levels.
Features:
Pivot Point Detection: Automatically identifies pivot highs and lows in the price chart, based on customizable parameters (Pivot Left and Pivot Right).
Support and Resistance Trendlines: Draws trendlines based on the identified pivot points. These lines represent significant price levels where price may experience support or resistance.
Breakout Signals: Provides buy (long) and sell (short) signals when the price breaks above the resistance trendline (for buy signals) or below the support trendline (for sell signals).
Customizable Pivot Lengths: Adjust the number of bars considered for determining pivot points using the Pivot Left and Pivot Right input parameters.
How it Works:
Pivot Detection: The script identifies the highest high (pivotHigh) and the lowest low (pivotLow) within a specific range of bars (defined by Pivot Left and Pivot Right).
Trendline Plotting: Once pivots are detected, the script draws resistance (red) and support (green) trendlines connecting the most recent pivots. These trendlines act as dynamic support and resistance levels.
Breakout Signals: The script generates signals:
BUY (Long): Triggered when the price breaks above the most recent resistance trendline.
SELL (Short): Triggered when the price breaks below the most recent support trendline.
Parameters:
Pivot Left: Number of bars to the left of the pivot point to consider.
Pivot Right: Number of bars to the right of the pivot point to consider.
Line Width: Customizable line width for drawing trendlines.
Ideal Use:
Timeframes: This indicator works well on timeframes ranging from 1-minute to daily charts. For best results, use it on 1-hour, 4-hour, or daily charts.
Strategy: Ideal for breakout traders or trend-following strategies. Use it to identify potential entry points when price breaks key levels of support or resistance.
Example Use Case:
Swing Traders: Traders looking for potential breakouts can use this script to identify key levels in the market and wait for the price to break through resistance for a long trade or support for a short trade.
Day Traders: For those looking to enter and exit trades in a single day, this indicator can help pinpoint areas of support and resistance, and provide actionable signals when price breaks those levels.
Disclaimer:
This script is not a guarantee of success and should be used in conjunction with other technical analysis tools. Always perform additional research and backtesting before live trading.
Important Notes:
The pivot points and trendlines may adjust dynamically as the price evolves. Adjust the pivot settings to suit the volatility and timeframe of the market you're trading.
This indicator works best when combined with other indicators such as volume, RSI, or MACD for confirmation.
How to Use:
Add the indicator to your chart.
Adjust the Pivot Left and Pivot Right parameters to fine-tune the pivot point detection.
Monitor for trendline breakouts. When the price breaks above the resistance line, a BUY signal will appear. When the price breaks below the support line, a SELL signal will appear.
Use the signals to enter trades at the right moment.
Final Notes:
If you're submitting to TradingView for publishing, keep your description clear and informative, but also concise. Traders need to quickly understand how your indicator works, what parameters they can adjust, and how it might fit into their trading strategy.

Relative Moving Average (RMA) For Loop [QuantAlgo]Introducing the Relative Moving Averages (RMA) For Loop by QuantAlgo , an innovative technical indicator that combines the smoothness of RMA with an advanced loop-based trend scoring system. Whether you're a day trader looking for high-probability entries or a medium- to long-term investor seeking trend confirmations, this indicator offers a fresh perspective and high-quality signals on market momentum!
💫 Core Architecture
At its heart, the RMA For Loop uses a unique approach to trend detection. Unlike traditional moving average systems that only look at current price relationships, this indicator employs a loop-based scoring mechanism that analyzes historical RMA relationships. Think of it as having multiple trend-confirmation checkpoints - each bar is evaluated against its predecessors to build a comprehensive trend score. This smart scoring system helps filter out market noise while catching meaningful trend reversals.
📊 Technical Foundation
The indicator combines two powerful components:
1/ Relative Moving Average (RMA): A sophisticated moving average that provides smoother price action interpretation than simple or exponential moving averages
2/ For Loop Analysis: A dynamic scoring system that evaluates how current RMA values stack up against historical levels, creating a momentum-based trend score
The magic happens when these components work together:
→ The RMA smooths out price action, reducing false signals
→ The For Loop system analyzes multiple historical points to validate trend strength
→ Crossover confirmations add an extra layer of validation
→ Visual cues provide instant feedback on trend direction and changes
📈 Key Features & Signals
The RMA For Loop provides clear, actionable signals through:
Color-coded RMA line that adapts to trend direction
Dynamic fills between price and RMA for enhanced visualization
Trend change markers (⌽) that pinpoint potential reversal points
Smart bar coloring that helps you "feel" the market's pulse
Customizable alerts for both bullish and bearish reversals
🎯 Practical Usage Tips
Here's how to get the most out of the RMA For Loop:
1/ Initial Setup:
Add the indicator to your TradingView chart by clicking on the star icon to add it to your favorites ⭐️
Start with the default RMA length of 55 for balanced sensitivity
Use the standard loop range (1-70) for comprehensive trend analysis
Adjust threshold levels based on your trading style (higher for fewer but stronger signals)
2/ Reading Signals:
Watch for trend change markers (⌽) - they indicate validated trend reversals
Pay attention to RMA line color changes - they confirm trend direction
Monitor bar colors for additional trend confirmation
Configure alerts for trend changes in both bullish and bearish directions, ensuring you never miss significant technical developments.
⚡️ Pro Tips
Fine-tune the RMA length based on your timeframe:
→ Lower values (20-40) for more responsive signals
→ Higher values (60-100) for stronger trend confirmation
Adjust threshold levels based on market volatility:
→ Increase thresholds in choppy markets
→ Standard settings work well in trending markets
Combine with volume analysis and/or other system(s) for additional confirmation
Use multiple timeframes for a complete market picture

PO3 ExotradesPO3 Exotrades Indicator
The PO3 Exotrades indicator is designed to provide an advanced and customizable way to visualize market trends on higher timeframes. It displays scaled and color-coded candles with precise wick and body structures for better chart analysis. This indicator is ideal for traders who want to analyze and monitor higher timeframe (HTF) market data directly on lower timeframe charts.
Key Features:
Scaled and Customizable Candles: The indicator allows for adjustable candle size and spacing, making it suitable for different trading styles and preferences. You can scale up or down the candle body width while maintaining the original height to ensure accurate visual representation.
Color-Coding for Market Direction: The indicator automatically colors the body of the candles based on the market's trend. Green represents a bullish candle, while red represents a bearish candle, giving quick visual cues for price movement direction.
Wicks Visualization: The indicator also visualizes the wicks of the candles, providing detailed insight into price action and volatility. Wicks can be color-customized for both bullish and bearish movements.
Timeframe Customization: You can set the timeframe (TF) to your preferred value, allowing for flexibility in analyzing high timeframe candles on lower timeframe charts.
Chart Trading (CRT) Friendly: Ideal for Chart Trading (CRT), the indicator's clean and clear visuals help traders spot key market signals more effectively, making it a perfect tool for those who engage in intra-day or long-term chart trading.
User-Friendly Adjustments: Customize the appearance of the candles, wicks, and their spacing to suit your preferences, enhancing your chart analysis and trading strategy.
How to Use:
Apply the PO3 Exotrades indicator to your chart.
Adjust the scale to increase or decrease the candle width for better visual clarity.
Use the indicator's color-coded candles to identify bullish and bearish market conditions quickly.
Analyze the wick structures to understand volatility and price action during key market movements.
Leverage the HTF data on lower timeframes to align your trading strategies with higher timeframe trends, optimizing your entries and exits.
Whether you're a scalper, day trader, or swing trader, the PO3 Exotrades indicator enhances your technical analysis and provides an edge in your trading decisions by visualizing HTF data in a clear and actionable way.

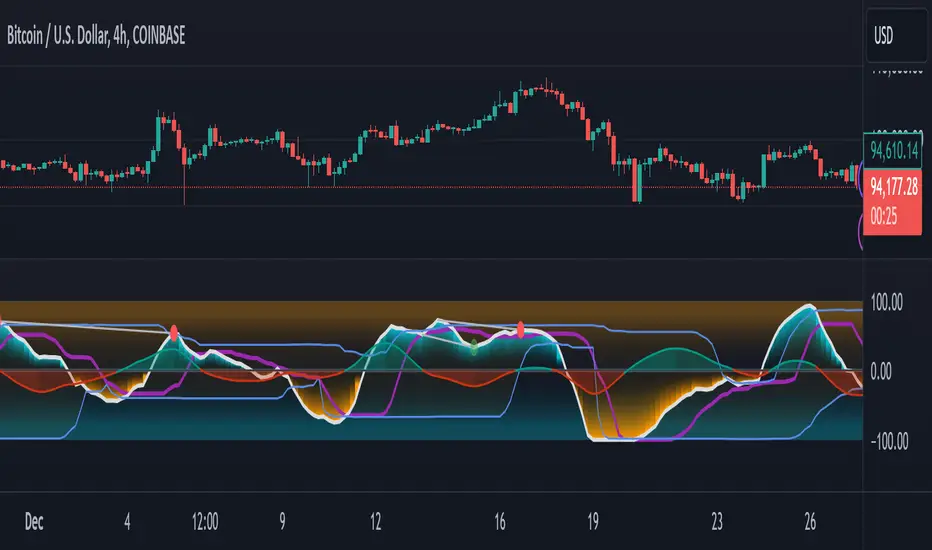
GMO (Gyroscopic Momentum Oscillator) GMO
Overview
This indicator fuses multiple advanced concepts to give traders a comprehensive view of market momentum, volatility, and potential turning points. It leverages the Gyroscopic Momentum Oscillator (GMO) foundation and layers on IQR-based bands, dynamic ATR-adjusted OB/OS levels, torque filtering, and divergence detection. The outcome is a versatile tool that can assist in identifying both short-term squeezes and long-term reversal zones while detecting subtle shifts in momentum acceleration.
Key Components:
Gyroscopic Momentum Oscillator (GMO) – A physics-inspired metric capturing trend stability and momentum by treating price dynamics as “angle,” “angular velocity,” and “inertia.”
IQR Bands – Highlight statistically typical oscillation ranges, providing insight into short-term squeezes and potential near-term trend shifts.
ATR-Adjusted OB/OS Levels – Dynamic thresholds for overbought/oversold conditions, adapting to volatility, aiding in identifying long-term potential reversal zones.
Torque Filtering & Scaling – Smooths and thresholds torque (the rate of change of momentum) and visually scales it for clarity, indicating sudden force changes that may precede volatility adjustments.
Divergence Detection – Highlights potential reversal cues by comparing oscillator swings against price swings, revealing regular and hidden bullish/bearish divergences.
Conceptual Insights
IQR Bands (Short-Term Squeeze & Trend Direction):
Short-Term Momentum and Squeeze: The IQR (Interquartile Range) bands show where the oscillator tends to “live” statistically. When the GMO line hovers within compressed IQR bands, it can signal a momentum squeeze phase. Exiting these tight ranges often correlates with short-term breakout opportunities.
Trend Reversals: If the oscillator pushes beyond these IQR ranges, it may indicate an emerging short-term trend change. Traders can watch for GMO escaping the IQR “comfort zone” to anticipate a new directional move.
Dynamic OB/OS Levels (Long-Term Reversal Zones):
ATR-Based Adaptive Thresholds: Instead of static overbought/oversold lines, this tool uses ATR to adjust OB/OS boundaries. In calm markets, these lines remain closer to ±90. As volatility rises, they approach ±100, reflecting greater permissible swings.
Long-Term Trend Reversal Potential: If GMO hits these dynamically adjusted OB/OS extremes, it suggests conditions ripe for possible long-term trend reversals. Traders seeking major inflection points may find these adaptive levels more reliable than fixed thresholds.
Torque (Sudden Force & Directional Shifts):
Momentum Acceleration Insight: Torque represents the second derivative of momentum, highlighting how quickly momentum is changing. High positive torque suggests a rapidly strengthening bullish force, while high negative torque warns of sudden bearish pressure.
Early Warning & Stability/Volatility Adjustments: By monitoring torque spikes, traders can anticipate momentum shifts before price fully confirms them. This can signal imminent changes in stability or increased volatility phases.
Indicator Parameters and Usage
GMO-Related Inputs:
lenPivot (Default 100): Length for calculating the pivot line (slow market axis).
lenSmoothAngle (Default 200): Smooths the angle measure, reducing noise.
lenATR (Default 14): ATR period for scaling factor, linking price changes to volatility.
useVolatility (Default true): If true, volatility (ATR) influences inertia, adjusting momentum calculations.
useVolume (Default false): If true, volume affects inertia, adding a liquidity dimension to momentum.
lenVolSmoothing (Default 50): Smooths volume calculations if useVolume is enabled.
lenMomentumSmooth (Default 20): EMA smoothing of GMO for a cleaner oscillator line.
normalizeRange (Default true): Normalizes GMO to a fixed range for consistent interpretation.
lenNorm (Default 100): Length for normalization window, ensuring GMO’s scale adapts to recent extremes.
IQR Bands Settings:
iqrLength (Default 14): Period to compute the oscillator’s statistical IQR.
iqrMult (Default 1.5): Multiplier to define the upper and lower IQR-based bands.
ATR-Adjusted OB/OS Settings:
baseOBLevel (Fixed at 90) and baseOSLevel (Fixed at 90): Base lines for OB/OS.
atrPeriodForOBOS (Default 50): ATR length for adjusting OB/OS thresholds dynamically.
atrScaling (Default 0.2): Controls how strongly volatility affects OB/OS lines.
Torque Filtering & Visualization:
torqueSmoothLength (Default 10): EMA length to smooth raw torque values.
atrPeriodForTorque (Default 14): ATR period to determine torque threshold.
atrTorqueScaling (Default 0.5): Scales ATR for determining torque’s “significant” threshold.
torqueScaleFactor (Default 10.0): Multiplies the torque values for better visual prominence on the chart.
Divergence Inputs:
showDivergences (Default true): Toggles divergence signals.
lbR, lbL (Defaults 5): Pivot lookback periods to identify swing highs and lows.
rangeUpper, rangeLower: Bar constraints to validate potential divergences.
plotBull, plotHiddenBull, plotBear, plotHiddenBear: Toggles for each divergence type.
Visual Elements on the Chart
GMO Line (Blue) & Zero Line (Gray):
GMO line oscillates around zero. Positive territory hints bullish momentum, negative suggests bearish.
IQR Bands (Teal Lines & Yellow Fill):
Upper/lower bands form a statistical “normal range” for GMO. The median line (purple) provides a central reference. Contraction near these bands indicates a short-term squeeze, expansions beyond them can signal emerging short-term trend changes.
Dynamic OB/OS (Red & Green Lines):
Red line near +90 to +100: Overbought zone (dynamic).
Green line near -90 to -100: Oversold zone (dynamic).
Movement into these zones may mark significant, longer-term reversal potential.
Torque Histogram (Colored Bars):
Plotted below GMO. Green bars = torque above positive threshold (bullish acceleration).
Red bars = torque below negative threshold (bearish acceleration).
Gray bars = neutral range.
This provides early warnings of momentum shifts before price responds fully.
Precession (Orange Line):
Scaled for visibility, adds context to long-term angular shifts in the oscillator.
Divergence Signals (Shapes):
Circles and offset lines highlight regular or hidden bullish/bearish divergences, offering potential reversal signals.
Practical Interpretation & Strategy
Short-Term Opportunities (IQR Focus):
If GMO compresses within IQR bands, the market might be “winding up.” A break above/below these bands can signal a short-term trade opportunity.
Long-Term Reversal Zones (Dynamic OB/OS):
When GMO approaches these dynamically adjusted extremes, conditions may be ripe for a major trend shift. This is particularly useful for swing or position traders looking for significant turnarounds.
Monitoring Torque for Acceleration Cues:
Torque spikes can precede price action, serving as an early catalyst signal. If torque turns strongly positive, anticipate bullish acceleration; strongly negative torque may warn of upcoming bearish pressure.
Confirm with Divergences:
Divergences between price and GMO reinforce potential reversal or continuation signals identified by IQR, OB/OS, or torque. Use them to increase confidence in setups.
Tips and Best Practices
Combine with Price & Volume Action:
While the indicator is powerful, always confirm signals with actual price structure, volume patterns, or other trend-following tools.
Adjust Lengths & Periods as Needed:
Shorter lengths = more responsiveness but more noise. Longer lengths = smoother signals but greater lag. Tune parameters to match your trading style and timeframe.
Use ATR and Volume Settings Wisely:
If markets are highly volatile, consider useVolatility to refine momentum readings. If liquidity is key, enable useVolume.
Scaling Torque:
If torque bars are hard to read, increase torqueScaleFactor further. The scaling doesn’t affect logic—only visibility.
Conclusion
The “GMO + IQR Bands + ATR-Adjusted OB/OS + Torque Filtering (Scaled)” indicator presents a holistic framework for understanding market momentum across multiple timescales and conditions. By interpreting short-term squeezes via IQR bands, long-term reversal zones via adaptive OB/OS, and subtle acceleration changes through torque, traders can gain advanced insights into when to anticipate breakouts, manage risk around potential reversals, and fine-tune timing for entries and exits.
This integrated approach helps navigate complex market dynamics, making it a valuable addition to any technical analysis toolkit.
IBD Market School [tradeviZion]IBD Market School Indicator: User Guide and Settings Reference
A comprehensive guide to configuring and using the IBD Market School indicator for TradingView
Introduction
The IBD Market School indicator is an advanced market analysis tool that implements Investor's Business Daily's methodology for identifying optimal trading opportunities. By tracking key market indexes and analyzing price and volume patterns, it provides actionable buy and sell signals based on the CANSLIM investment system.
The indicator offers a comprehensive set of features:
Complete Signal System
10 primary buy signals (B1-B10)
Additional buy-side indicators (HH - Higher High, ED - Expired Days)
14 sell signals (S1-S14)
Index Rise 6% signal for Distribution/Stalling Day expiration
Market Health Tracking
Distribution Day detection and counting
Stalling Day identification and validation
Automatic 25-day signal expiration
6% price rise monitoring for signal clearing
Market Condition Analysis
Rally Day detection (major and minor)
Follow-Through Day confirmation
Dynamic market exposure management (0-100%)
Power Trend analysis with multiple states
Risk Management Features
Circuit Breaker system for major declines
Buy Switch system for exposure control
Customizable volume analysis (Nasdaq/S&P 500)
Distribution day clustering detection
Visual Analysis Tools
IBD-style candle display option
Power Trend state visualization
Signal line drawing system
Customizable tooltips and alerts
Proper configuration of the indicator's settings is essential as it affects:
Signal detection sensitivity and accuracy
Market exposure calculations and adjustments
Volume confirmation requirements
Visual display of market conditions and signals
Alert system behavior and notifications
This guide provides detailed explanations of each component and setting to help you optimize the indicator for your trading strategy while maintaining adherence to IBD's proven methodology.
📊 General Settings
This section controls the indicator's tooltip display, alert behavior, and candle visualization preferences.
The General Settings panel allows you to configure tooltip modes, alert types, and candle appearance.
Tooltip Display Mode
Select how detailed the tooltips should be when hovering over signals and indicators:
The three tooltip display modes: Simple (left), Detailed (center), and Market Analysis (right).
Simple Mode
Displays concise signal definitions
Shows basic entry and exit conditions
Focuses on essential trigger points
Perfect for experienced traders
Detailed Mode
Provides in-depth explanations of each buy/sell signal
Shows complete validation criteria and conditions
Includes volume requirements and percentage thresholds
Explains the context and significance of each signal
Market Analysis Mode
Focuses on broad market health metrics
Shows market exposure percentage and trend
Displays buy switch and power trend status
Tracks distribution days and signal buffers
Note: Choose the tooltip mode based on your needs:
- Simple: Provides quick, essential information on signals for fast decision-making
- Detailed: Breaks down conditions for each buy/sell signal, ideal for users wanting in-depth explanations
- Market Analysis: Focuses on broad market health, including exposure, buy switch, distribution days, and trends
Market Exposure Alert System
The indicator alerts you when market exposure levels change, helping you adjust your positions accordingly.
Alert Types
On Close (Recommended)
Triggers only after bar closes
More reliable signals as price action is confirmed
Real-Time
Triggers immediately when conditions are met
Note: Signals may change by bar close
Setting Up Alerts
Click the "..." (More) button on the indicator label "$tradeviZion - IBD Market School"
Select "Add alert on $tradeviZion - IBD Market School..."
In the Create Alert dialog:
Settings tab:
Verify the symbol and timeframe (e.g., NASDAQ:IXIC , 1D)
Condition: Select "$tradeviZion - IBD Market School"
Alert function: Choose "Any alert() function call"
Expiration: Set to "Open-ended alert"
Alert name will auto-populate
Switch to Notifications tab:
Enable "Notify in app" for push notifications in the mobile app
Enable "Show toast notification" for on-screen alerts
Enable "Play sound" and customize duration (e.g., Thin, 10 seconds)
Optional settings:
Send email (requires profile settings configuration)
Webhook URL for POST requests
Send plain text for alternative email format
Click Create to activate the alert
Alert Messages
Message format: "Market exposure change for : Market exposure from % to %"
Example: "Market exposure change for NASDAQ:IXIC : 📈 Market exposure reduced from 100% to 75%"
📈 Arrow indicates exposure increase
📉 Arrow indicates exposure decrease
Messages include previous and new exposure percentages
Note: These alerts specifically track changes in market exposure levels, helping you stay aligned with market conditions. They are essential for maintaining proper position sizing and risk management.
Chart Style Options
IBD-style Candles
Enable to match Investor's Business Daily chart style
For MarketSmith style setup, right-click on chart and go to Settings
Navigate to Symbol tab
Uncheck Body, Borders, and Wicks
Press Alt+R to restore chart view if zoom affects display
To revert to original style, right-click on chart and go to Settings
Navigate to Symbol tab
Check Body, Borders, and Wicks
Color Based on Previous Close
Colors bars based on close vs. previous close
When enabled, determines colors by comparing current close to previous close
Use blue color for closes above previous
Use pink color for closes below previous
📈 Market Exposure Table Settings
Configure how the market exposure information is displayed on your chart.
The Market Exposure Table Settings panel allows you to customize the appearance and layout of the market status display.
Layout Options
• Hide Table
Completely hides the market status display
• Basic (2 Columns)
Shows main indicators in two columns
Compact view without signal list
Ideal for minimalist chart view
• Detailed (2 Columns with Signals)
Displays main indicators plus signal panel
Shows Buy and Sell signals in separate columns
Provides comprehensive market overview
• Stacked (1 Column, Compact)
Vertical layout with single column
Most space-efficient option
Ideal for smaller chart windows
Color Settings
Background : Dark gray background for the table
Text : White text for general information
Buy Signal : Green highlighting for buy signals
Sell Signal : Red highlighting for sell signals
Additional Options
Show Trading Wisdom: Enable rotating trading messages
Displays empowering trading messages
Helps reinforce disciplined trading practices
Updates every 5 bars with new wisdom
Includes tooltips with comprehensive trading guidance
Customizable yellow text color for messages
💹 Buy Signals Settings
This section controls the visibility and behavior of buy signals and related indicators.
The Buy Signals Settings panel allows you to configure signal visibility, volatility calculations, and visual appearance of buy signals.
Signal Display Options
Buy Signals Display : Choose display mode
Show Selected Signals
Hide All
Compact Signals
Individual Signal Toggles
Primary Buy Signals (B1-B10)
Special Indicators (HH, ED)
Understanding Buy Signals
B1: Follow-Through Day (FTD)
Buy on the initial FTD with volume higher than the previous day. You may use an FTD from an index other than the NASDAQ:IXIC , but if you do, you must stay within that index for future Buy and Sell Signals.
B2: Additional Follow-Through
Buy on all additional follow-through days within 25 days from a rally day that closes above the low of the initial follow-through day.
B3: Low Above EMA21
Buy on an up or flat day when the intraday low is at or above the EMA21. Note: Once you have a B3 or B4, you can't have another until it is reset by an S5.
Special Buy Indicators
HH: Higher High (No FTD after Rally)
Triggers when current close exceeds highest point since last confirmed rally. Must not have a Follow-Through Day (FTD). Buy switch turns on when close exceeds last rally's high and turns off if close drops below that high.
ED: Expired Days
Tracks Distribution and Stalling days that have aged out. Days are tracked for a specific trading period and expired days are removed from the count.
Index Rise Settings
Index Rise 6% from DD & SD
Toggle to enable/disable monitoring of price rises above Distribution and Stalling Days. Default value of 6% (adjustable) for monitoring rises above these days.
Understanding Index Rise
This feature tracks significant market recoveries by monitoring when the index rises substantially above Distribution Days (DD) or Stalling Days (SD). When the index rises 6% or more above the closing price of any DD or SD, it indicates a strong market recovery. This is an important signal because it helps identify when the market has shown enough strength to potentially overcome previous distribution periods. When triggered, this signal reduces the distribution day count, effectively acknowledging that the previous distribution pattern may no longer be as relevant due to the market's strong recovery.
B1 Signal Configuration
Volatility Settings
B1 Auto Volatility: Calculates FTD price requirement based on 200-day volatility
B1 Manual Volatility: Fixed value (default 1.245) when auto is disabled
Visual Settings
Label Size: Small (options: Tiny, Small, Normal, Large)
Signal Color: Light green background for buy signals
Text Color: Customizable text color for signal labels
Important Notes
Signal visibility affects both chart display and calculations
Auto volatility is recommended for most users
Manual volatility should only be adjusted by experienced users
Visual settings apply to all enabled buy signals
Confirmation Rules
Price Requirements
Follow-Through Day (B1) thresholds based on 200-day volatility:
Below 0.4% volatility: 0.7% gain required
0.4% to 0.55% volatility: 0.85% gain required
0.55% to 1% volatility: 1% gain required
Above 1% volatility: 1.245% gain required
EMA Breaks (S5/S6): 0.2% threshold below 21 EMA
Downside Reversal (B9): 1.75% high-to-low spread required
Volume Requirements
Distribution Days: Volume > previous day, with -0.20% or more price decline
Stalling Days: Volume ≥ 95% of previous day
Follow-Through Days (B1/B2): Volume > previous day
Accumulation Days (B7): Volume > previous day, close in upper 25% range
Sell Signals Settings
This section controls the visibility and behavior of sell signals and market weakness indicators.
The Sell Signals Settings panel allows you to configure signal visibility and visual appearance of sell signals and market health indicators.
Signal Display Options
Sell Signals Display: Dropdown with options to control signal visibility:
Show Selected Signals
Hide All
Compact Signals
Individual Signal Toggles
Primary Sell Signals: S1-S14 and CB (Circuit Breaker)
Market Health Indicators:
Distribution Days (DD): Indicative of institutional selling. Occurs when:
Market closes down by at least 0.2%
Volume greater than or equal to prior day
Tracked for 25 trading days
Stalling Days (SD): Sign of heavy volume without upside progress. Occurs when:
Market at/near new highs
Closes with small gain (0% to 0.4%)
High volume in lower half of day's range
Understanding Sell Signals
S1: Follow-Through Day Undercut
Sell if the index closes below the low of the initial follow-through day.
S2: Failed Rally Attempt
Sell if the index undercuts the major low of the rally attempt. Market exposure is reduced to zero and the Buy Switch is turned off.
S2ml: Minor Low Undercut
Minor Low undercut of rally attempt. Market exposure is reduced by two. This does not turn off the Buy Switch.
S3: Full Distribution Minus One
Sell after the distribution count increases to one less than the full distribution count.
S4: Full Distribution
Sell after reaching the full distribution count.
S5: Break Below EMA21
Sell if the index closes 0.2% or more below the EMA21. Note: Once you have an S5, S6, or S7, you can't have another until it is reset by a B3.
S6: Overdue Break Below EMA21
Sell if the index closes down 0.2% or more below the EMA21 after 30 days have passed since the last B3 without triggering an S5.
S7: Trending Below EMA21
Sell after S5 on the 5th consecutive day that the high is below the EMA21 and a down day.
S8: Living Below EMA21
Sell after S5 on the 10th and every 5th consecutive day after that (15th, 20th, 25th, etc.) that the high is below the EMA21.
S9: Break Below 50-Day MA
Sell if the index closes below the 50-Day Moving Average. Triggers only if a B6 signal was previously printed.
S10: Bad Break
Sell if the close is down 2.25% or greater in the bottom 25% of the range. Close below the MA50 or intraday high below EMA21.
S11: Downside Reversal
Sell after a Downside Reversal Day, which occurs with:
New High within 13 weeks
Close in bottom quartile of range
Close Down for the day
Spread of 1.75% or greater
S12: Lower Low
Sell after closing below the last marked low as defined by MarketSmith.
S13: Distribution Cluster
Distribution and stalling days increase to four up to eight days within a rolling eight-day period.
S14: Break Below Higher High
Sell after closing below the last marked high that printed a B8 (Higher High).
CB: Circuit Breaker
Triggers when the index drops 10% from the highest high since the FTD (B1) and falls 5% or more below the 50-Day MA intraday.
Buy/Sell Undercut Lines
This section controls the visibility and appearance of important price level lines on your chart.
The Buy/Sell Undercut Lines panel allows you to configure which signal lines are displayed and their visual appearance.
Line Visibility
Buy Signal Lines :
B8 Line: First high above the last pivot high
HH Line: Close above the prior high since last confirmed rally without FTD
Sell Signal Lines :
S1 Line: Close below the initial follow-through day
S2 Line: Undercut of major low
S2ml Line: Minor low undercut
S12 Line: Close below last marked low
S14 Line: Close below last marked high
Line Appearance
Color Settings :
B8: Green (Buy signal)
HH: Green (Buy signal)
S1: Red (Sell signal)
S2: Red (Sell signal)
S2ml: Orange (Modified sell signal)
S12: Purple (Pivot low signal)
S14: Blue (Close below pivot)
Line Style : Dashed (options: solid, dotted, dashed)
Line Width : 1 (adjustable)
📈 Rally Signal Settings
The Rally Signal Settings panel allows you to configure Rally Day detection and visualization.
Rally Day:
Toggle to enable/disable Rally Day signals. These mark the beginning of potential market uptrends when the market closes higher than the previous day, following a significant decline.
Visual Settings:
Label Size: small (options: tiny, small, normal, large)
Background Color: Customizable background for Rally Day labels
Text Color: Customizable text color for Rally Day labels
Distribution Day Settings:
Use Manual FullDDcount: Option to manually set the minimum combined number of Distribution and Stalling Days
Count Value: Default is 6 days (adjustable when manual mode is enabled)
This setting determines how many Distribution/Stalling Days are required to trigger a new rally
Pivot Point Settings
The Pivot Point Settings panel allows you to configure the display of high/low points and percentage changes between pivots.
Display Options
Display H/L Points
Toggle to show or hide pivot levels (high and low points) on the chart
%Change
Toggle to display percentage changes between pivot points
Color Settings
Positive % Color : Blue (customizable) - Used for positive percentage changes
Negative % Color : Pink (customizable) - Used for negative percentage changes
Precision Settings
Decimal Places: Set the number of decimal places (default: 2) for:
Pivot point price levels
Percentage change calculations
⚡ Power Trend Settings
This section controls how Power Trend information is visualized on your chart.
The Power Trend Settings panel allows you to configure how trend states are displayed and customize their visual appearance.
Example of Power Trend visualization showing both boxes (green background) and trend lines. The boxes indicate trend state while lines show trend transitions.
Display Options
Show Power Trend Line : Display trend states as lines on the chart
Show Boxes : Display trend states as boxes
Show Background : Display trend states as background colors
Power Trend Color Settings
On : Light green - Full power trend active
Resume : Light green - Power trend resuming
Off : Gray - Power trend inactive
With Floor : Yellow - Under pressure with support
No Floor : Orange - Under pressure without support
Power Trend Line Settings
Line Width : Set line thickness (default: 1)
Line Offset : Adjust line position (default: 5)
Power Trend Box Settings
Text Align : Set text alignment (left, center, right)
Text Position : Set vertical position (top, middle, bottom)
Size : Set box size (tiny, small, normal, large)
Color : Customize box background color
Power Trend States
Full Power (On)
Represents strongest market condition with maximum exposure of +7
Base maximum exposure of 5 plus 2 buffer signals
Buffer allows maintaining high exposure during normal pullbacks
2 sell signals reduce count from 7 to 5 without affecting base
Indicates very healthy market that can absorb normal profit-taking
Resume State
Shows successful market recovery after pressure period
Requires 10+ days without S2 minor, S9, or S13 signals
Must reestablish all initial strength conditions
Maintains same benefits as Full Power (+7 max, +2 floor)
Shows as light green in visualization
Under Pressure With Floor
First warning stage triggered by S2 minor or S13 signals
Reduces maximum exposure to +5
Maintains minimal protection with +1 floor
Suggests defensive positioning while keeping core positions
Shows as yellow in visualization
Under Pressure No Floor
Severe warning stage triggered by S9 signal
Maintains +5 maximum exposure but removes floor protection
Indicates higher risk of continued market decline
Requires careful position management
Shows as orange in visualization
Power Trend Off
Triggered by EMA/MA crossdowns with declining price
Can also be activated by S2 or Circuit Breaker signals
Maximum exposure limited to +5 with no buffer signals
Suggests focus on capital preservation
Shows as gray in visualization
Power Trend System Rules
Each state enforces strict exposure limits with automatic floor and ceiling adjustments
Power Trend can activate Buy Switch when entering Full Power state
Restraint Rule limits exposure to +2 until significant progress or B4 signal when starting from zero exposure
State transitions immediately update exposure limits and Buy Switch status
Distribution Cluster (S13) can move Power Trend to Under Pressure With Floor state
System maintains exposure floors to prevent panic selling while allowing flexibility below floor levels
Weekly SMAs Settings
The Weekly SMAs Settings panel allows you to configure the weekly moving averages display and calculations.
SMA 1: 10 periods (enabled), Red
Length: 10
Optional EMA toggle
Width: 1
SMA 2: 20 periods, Pink
Length: 20
Optional EMA toggle
Width: 1
SMA 3: 30 periods, Green
Length: 30
Optional EMA toggle
Width: 1
SMA 4: 40 periods (enabled), White
Length: 40
Optional EMA toggle
Width: 1
SMAs Settings
The SMAs Settings panel allows you to configure the daily moving averages display and calculations.
MA 1: 10 periods, Optional EMA, Pink
Length: 10
Optional EMA toggle
Width: 1
MA 2: 21 periods (enabled), EMA, Green
Length: 21
EMA enabled
Width: 1
MA 3: 50 periods (enabled), SMA, Red
Length: 50
EMA disabled
Width: 1
MA 4: 200 periods (enabled), SMA, White
Length: 200
EMA disabled
Width: 1
Volume Settings (NASDAQ & S&P 500)
This section controls volume data sources for market analysis. Proper volume settings are crucial for confirming market signals and analyzing institutional participation.
The Volume Settings panel allows you to configure volume data sources and custom ticker options for accurate market analysis.
Important Volume Source Information
TradingView's default volume data differs from IBD's Yahoo Finance data source
Current default settings (IXIC and TVOL) provide the most accurate results compared to IBD signals
Volume differences between TradingView and IBD are expected due to different data sources
Custom ticker options are provided for future compatibility with Yahoo Finance volume data
Volume Configuration
Nasdaq Volume Settings
Default Source: NASDAQ:IXIC (Nasdaq Composite Index)
Custom Ticker Option: USI:TVOL.NQ
Enable custom source by checking "Use Custom Nasdaq Ticker?"
Note: Custom ticker must be price-based for accurate volume analysis
S&P 500 Volume Settings
Default Source: TVOL (S&P 500 Total Volume)
Custom Ticker Option: USI:TVOL.NY
Enable custom source by checking "Use Custom S&P 500 Ticker?"
Note: Custom ticker must be price-based for accurate volume analysis
Volume Analysis Impact
Used for Distribution Day confirmation
Required for Follow-Through Day validation
Helps identify institutional buying/selling
Critical for Stalling Day detection
Recommendations
Keep default settings for most accurate current results
Only use custom tickers if you have confirmed price-based volume sources
Be aware that volume-based signals might slightly differ from IBD due to data source differences
Future updates may add Yahoo Finance volume compatibility
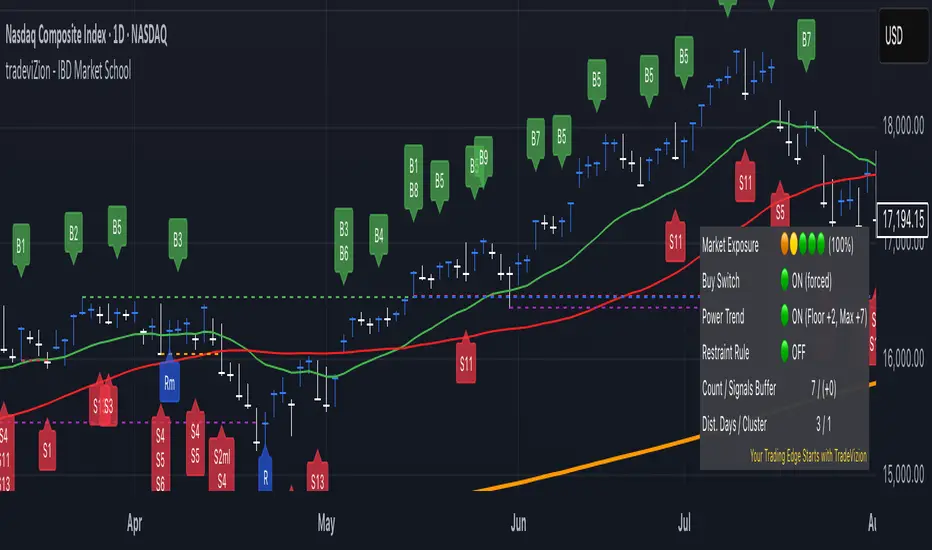
Market Status Table
The Market Status Table provides a real-time visual overview of current market conditions and signal status. Users can customize the table's appearance through the Market Exposure Table Settings.
The Market Status Table can be displayed in three different layouts: Basic (left), Detailed (center), and Stacked (right).
Layout Options
Hide Table
Completely hides the market status display
Basic (2 Columns)
Shows main indicators in two columns
Compact view without signal list
Ideal for minimalist chart view
Detailed (2 Columns with Signals)
Displays main indicators plus signal panel
Shows Buy and Sell signals in separate columns
Provides comprehensive market overview
Stacked (1 Column, Compact)
Vertical layout with single column
Most space-efficient option
Ideal for smaller chart windows
Main Indicators
• Market Exposure
Displayed as colored dots: 🟠 🟢 🟢 🟢 🟢
Shows current exposure level (0-100%)
(⚪ ⚪ ⚪ ⚪ ⚪): 0% exposure
(🟠 ⚪ ⚪ ⚪ ⚪): 30% exposure
(🟠 🟡 ⚪ ⚪ ⚪): 55% exposure
(🟠 🟡 🟢 ⚪ ⚪): 75% exposure
(🟠 🟡 🟢 🟢 ⚪): 90% exposure
(🟠 🟡 🟢 🟢 🟢): 100% exposure
• Key Status Indicators
Buy Switch: Shows ON (forced) or OFF status
Power Trend: Displays current state with floor and maximum values
Restraint Rule: Indicates ON or OFF status
Count / Signals Buffer: Shows current count and available buffer (e.g., "7 / (+0)")
Dist. Days / Cluster: Displays distribution day count and cluster status (e.g., "1 / 0")
• Signal Panel (Available in Detailed layout)
Lists all active Buy and Sell signals
Highlighted signals indicate currently active conditions
Green highlighting shows confirmed signals
Provides quick reference for all available signals
Status Indicator Colors
🟢 indicates "ON" or positive conditions (e.g., Buy Switch ON, Power Trend Full Power)
🟡 indicates "Under Pressure" or caution (e.g., Power Trend Under Pressure With Floor)
🟠 indicates "Under Pressure No Floor" or increased caution
🔴 indicates "OFF" or negative conditions (e.g., Buy Switch OFF, Power Trend OFF)
• Signal Colors
Green background for buy signals
Red background for sell signals
Black text on signal backgrounds for better visibility
• Number Formats
Count / Buffer signals shown as "7 / (+2)"
Distribution Days / Cluster count shown as "1 / 0"
Exposure percentage shown with dots (e.g., "90%")
Trading Wisdom - Market Risk Management
"The key to successful trading is not just knowing when to enter, but managing your exposure based on market health. Always check two critical indicators before any trade:
1. Market Exposure Levels
100% (5 dots): Full positions in strong market
90% (4 dots): Slightly reduced positions
75% (3 dots): Moderate positions, more cautious
55% (2 dots): Half positions only
30% (1 dot): Small positions only
0% (0 dots): Stay in cash
2. Distribution Days Risk Levels
1-2 Days: Normal market behavior
3 Days: Caution - reduce new positions
4+ Days: High risk - defensive positioning
5-6 Days: Consider moving to cash
Remember: It's better to miss an opportunity than to catch a falling market. Let the Market Exposure Table be your guide to smart position sizing."
Pro Tip: Make checking these two indicators part of your daily routine. They're your first line of defense against major drawdowns.
Conclusion
The IBD Market School indicator brings William O'Neil's proven methodology to TradingView, providing a comprehensive system for market analysis and risk management. This tool automates the complex task of tracking market signals while maintaining strict adherence to IBD's time-tested principles.
Key Features
Follows IBD's core methodology for identifying market direction
Automates tracking of Distribution Days, Follow-Through Days, and market signals
Provides clear market exposure guidance through the Power Trend system
Helps maintain discipline through systematic Buy Switch control
Offers multiple layers of risk management
Best Practices
Always check Market Exposure and Distribution Day count before making trades
Let the Buy Switch guide your market participation
Follow Power Trend states for proper position sizing
Use the default volume settings for most accurate signal generation
Monitor all confirmation rules for proper signal validation
Remember: This indicator is designed to replicate IBD's methodology as closely as possible within TradingView's environment. While it automates signal detection and exposure management, successful trading still requires discipline, patience, and strict adherence to risk management principles.
"The goal is not to be right about the market - it's to make money by following the market's signals and managing risk."
Enigma End Game Indicator
Enigma End Game Indicator Description
The Enigma End Game indicator is a powerful tool designed to enhance the way traders approach support and resistance, combining mainstream technical analysis with a unique, dynamic perspective. At its core, this indicator enables traders to adapt to market conditions in real time by applying a blend of classic and modern interpretations of support and resistance levels.
In traditional support and resistance analysis, we recognize the significant price points where the market has historically reversed or consolidated. However, the *Enigma End Game* indicator takes this one step further by analyzing each individual candle's high as a potential resistance level and each low as support. This allows the trader to stay more agile, as the market constantly updates and evolves. The dynamic nature of this method acknowledges that price movements are fractal in nature, meaning that these levels are not static but adjust in response to price action on multiple timeframes.
### How It Works:
When using the *Enigma End Game* indicator, it doesn't simply plot buy and sell signals automatically. Instead, the indicator highlights key levels based on the interaction between price and historical price action. Here's how it operates:
1. **Buy Logic:**
The indicator identifies bullish signals based on the *Enigma* logic, but it does not trigger an immediate buy. Instead, it plots arrows above or below the candles, indicating the key price levels where price action has shifted. Traders then focus on these areas, particularly looking for buy opportunities *below* these levels during key market sessions (such as London or New York) while aligning with both mainstream support and resistance and *Enigma* levels.
2. **Sell Logic:**
Similarly, when the indicator identifies a sell signal, it plots an arrow above the candle where price action has reversed. This does not immediately suggest selling. Traders wait for a price retracement back to the previously breached low (for a sell order) or high (for a buy order), observing price action closely on lower timeframes (such as the 1-minute chart) to refine entry points. The entry is triggered when price starts to show signs of reversing at these levels, further validated by mainstream and *Enigma* support/resistance.
### Practical Example – XAU/USD (Gold):
For instance, in the settings of the *Enigma End Game* indicator, if we select the 5-minute (5MN) timeframe as the key level, the indicator will only plot the first 3 arrows following the *Enigma* logic. The arrows will appear above or below the candle that was breached, indicating a potential trend reversal. In this scenario, the first arrow marks the point where price broke a significant support or resistance level. Afterward, the trader watches for a subsequent candle to close below (in the case of a sell) the previous candle’s low, confirming a bearish bias.
Now, the trader does not rush into a sell order. Instead, they wait for the price to pull back towards the previously breached low. At this point, the trader can use a lower timeframe (like the 1-minute chart) to identify both mainstream support and resistance levels and *Enigma* levels above the main 5-minute key level. These additional levels provide a clearer understanding of where price might reverse and give the trader a stronger edge in refining their entry point.
The trader then sets a sell order *above* the price level of the previous low, but only once signs show that price is retracing and ready to fall again. The price point where this retracement occurs, confirmed by both mainstream and *Enigma* levels, becomes the entry signal for the trade.
### Summary:
The *Enigma End Game* indicator combines time-tested principles of support and resistance with a more modern, adaptive view, empowering traders to read the market with greater precision. It guides you to wait for optimal entries, based on dynamic support and resistance levels that change with each price movement. By combining signals on higher timeframes with refined entries on lower timeframes, traders gain a unique advantage in navigating both obvious and hidden levels of support and resistance, ultimately improving their ability to time trades with higher probability of success.
This indicator allows for a more calculated, strategic approach to trading—highlighting the right moments to enter the market while providing the flexibility to adjust to different market conditions.
The *ENIGMA Signals with Retests* indicator is a versatile trading tool that combines key market sessions with dynamic support and resistance levels. It uses logic to identify potential buy and sell signals based on the behavior of recent price swings (highs and lows) and offers flexibility with the number of arrows plotted per session. The user can customize settings like arrow frequency, line styles, and session times, allowing for personalized trading strategies.
The indicator detects buy and sell signals by checking if the price breaks the previous swing high (for buy signals) or swing low (for sell signals). It then stores these levels and draws horizontal lines on the chart, representing critical price levels where traders can expect potential price reactions.
A key feature of this indicator is its ability to limit the number of arrows per session, ensuring a cleaner chart and reducing signal clutter. Horizontal lines are drawn at the identified buy or sell levels, with the option to display labels like "BUY - AT OR BELOW" and "SELL - AT OR ABOVE" to further clarify entry points.
The indicator also incorporates session filtering, allowing traders to focus on specific market sessions (Asia, London, and New York) for more relevant signals, and it ensures that no more than a user-defined number of arrows are plotted within a session.

Rejection Candle DetectorUsing the Rejection Candle Detector with Order Blocks
Plotting Order Blocks:
Identify Key Levels: Begin by identifying key levels on the chart where large buying or selling activity has taken place. These areas are often referred to as order blocks.
Draw the Blocks: Use horizontal lines or rectangular zones to mark these order blocks on your chart. These levels will act as potential support or resistance areas where price is likely to react.
Setting Up the Rejection Candle Detector:
Apply the Indicator: Add the Rejection Candle Detector to your TradingView chart.
Customize Settings: Adjust the look-back period, label colors, and transparency according to your preferences.
Monitoring Price Action:
Wait for Price to Reach an Order Block: Monitor the chart for when the price approaches one of your predefined order blocks.
Look for Rejection Candles: The Rejection Candle Detector will help you identify rejection candlestick patterns within the look-back period (default is 10 bars).
Entry Decision:
Confirm Rejection: Once the price touches an order block and a rejection candle is detected by the indicator, this could signal a potential entry point. Rejection candles indicate that the price tried to move past the order block but was pushed back, showing strong resistance or support at that level.
Align with Your Analysis: Ensure that the detected rejection candle aligns with your overall trading analysis and strategy. Consider other factors such as trend direction, volume, and market conditions before making an entry.
Managing the Trade:
Set Stop Loss: Place a stop loss just beyond the order block to manage your risk in case the price breaks through the level.
Target Levels: Define your target levels for taking profit based on the next significant support or resistance levels on the chart.
Monitor and Adjust: Continue to monitor the trade and adjust your stop loss or take profit levels as needed based on price action and market conditions.
Example Scenario:
Order Block: You identify an order block at the $50 level on your chart, marking it as a potential support zone.
Price Reaction: Price approaches and tests the $50 level.
Rejection Candle: The Rejection Candle Detector spots a hammer candlestick (a bullish rejection pattern) forming right at the $50 level.
Entry Point: You decide to enter a long trade at the close of the hammer candle, setting your stop loss just below the $50 level.
Trade Management: Set your target at the next resistance level, say $55, and monitor the trade, adjusting as necessary...

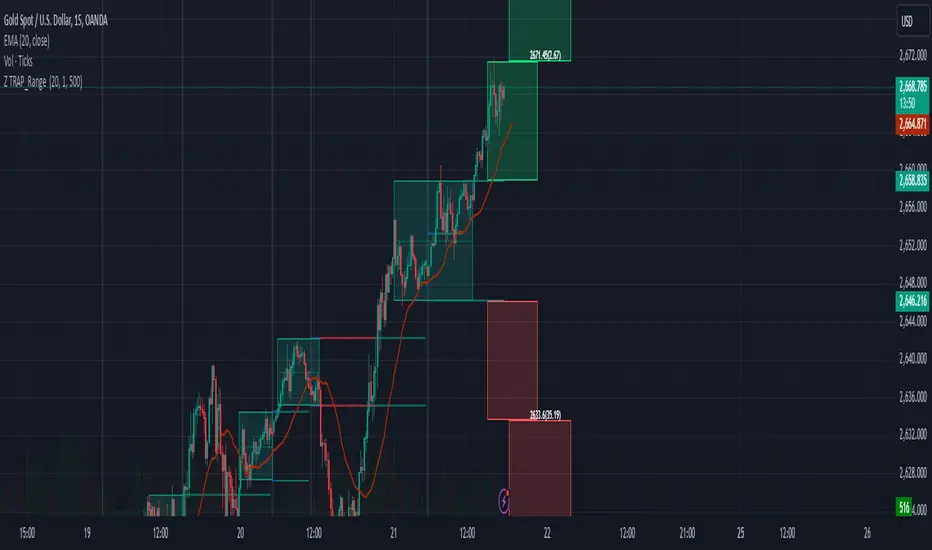
Z TRAP_Range Indicator Name: Z TRAP_Range
Primary Function:
This indicator is designed to identify and highlight price ranges on a TradingView chart. It detects periods of consolidation (when price remains within a defined range) and marks these areas using dynamic boxes. It also visualizes range breakouts and provides additional extension levels for potential price targets.
Features Overview:
Dynamic Range Detection:
Identifies price ranges based on a moving average (ma) and ATR (atr) calculations.
Considers a customizable minimum range length (length) to detect valid consolidation zones.
Highlights the range's top and bottom boundaries with colored boxes.
Breakout Visualization:
Green Box (upCss): Indicates upward breakout from the detected range.
Red Box (dnCss): Indicates downward breakout from the detected range.
Blue Box (unbrokenCss): Indicates that price remains within the range (consolidation).
Extension Levels:
Projects two upward and two downward extension levels based on the height of the detected range.
Helps identify potential price targets after a breakout.
Customizable Style Settings:
Change colors for breakout upward, breakout downward, and unbroken ranges.
Adjust ATR multiplier (mult) and range detection sensitivity.
Annotations:
Displays labels showing key price levels, including range top, bottom, and extension levels.
Provides details like the difference between the close price and the range level for better context.
Historical Context:
Maintains a visual record of previous ranges and breakouts on the chart.
Can handle overlapping ranges and dynamically adjust boundaries.
How the Indicator Works:
Range Detection:
When the price remains close to the moving average for the defined length of bars, a new range is detected. The range top and bottom are calculated using the ATR-based width (ma ± atr).
Breakout Detection:
If the price moves above the range top, an upward breakout is marked.
If the price moves below the range bottom, a downward breakout is marked.
If the price stays within the range, the box color remains blue.
Dynamic Updates:
Existing ranges are adjusted dynamically for overlaps, and new ranges are created when necessary.
Visual Elements:
Boxes:
Highlight price ranges with colors indicating breakout or consolidation.
Box colors dynamically change based on price action.
Lines:
Draw horizontal levels for the range’s top and bottom.
Extension lines project potential targets based on range height.
Labels:
Display price levels and their differences from the close price.
Show the height of each extension level for additional insights.
Customization Options:
Minimum Range Length: Adjust the sensitivity of range detection.
Range Width: Change the ATR multiplier for wider or narrower ranges.
ATR Length: Modify the ATR period for fine-tuning volatility sensitivity.
Color Settings: Customize box colors for upward, downward, and unbroken ranges.
Use Cases:
Consolidation Zones:
Identify accumulation or distribution phases where price is consolidating.
Breakout Trading:
Detect potential breakout opportunities and visualize target levels using range extensions.
Support and Resistance:
Use historical ranges as support/resistance zones for future price action.
How to Use:
Copy and paste the script into TradingView (create a new Pine Script v5 indicator).
Add the indicator to your chart and observe the visualized ranges and breakouts.
Adjust the input parameters to align with your trading style or instrument volatility.
Use the extension levels to plan entry, exit, or stop-loss placement for breakout trades.
This indicator is highly versatile and suits traders looking for structured price action analysis. It provides a clear and visually appealing way to track consolidation zones and breakout potential.
Volatility-Driven Trend Reversal (VTR) IndicatorThe Volatility-Driven Trend Reversal (VTR) Indicator is a sophisticated Pine Script trading tool designed to provide clear, non-repainting buy and sell signals based on a combination of trend-following, volatility-based, and momentum analysis. It utilizes Exponential Moving Average (EMA) for trend direction, Average True Range (ATR) for dynamic volatility bands, and Relative Strength Index (RSI) for momentum filtering. The VTR Indicator is built to operate effectively on all market pairs, including cryptocurrency, stocks, and forex, providing traders with reliable, actionable signals for both trend continuation and reversal strategies.
This indicator is tailored to reduce noise and avoid over-signaling by filtering out minor fluctuations. With its unique volatility-based ATR bands, the VTR Indicator excels in volatile environments, such as cryptocurrency markets, and helps traders capture significant price movements while managing risk effectively.
Key Features
Trend Confirmation (EMA):
The indicator relies on the 50-period Exponential Moving Average (EMA) to define the market's primary trend direction. A rising EMA suggests an uptrend, while a falling EMA indicates a downtrend.
Volatility-Based ATR Bands:
ATR (Average True Range) is used to calculate dynamic support and resistance levels based on market volatility. The upper and lower bands represent potential overbought and oversold zones, ensuring that price action aligns with the overall market volatility.
These bands are adaptive to price fluctuations, making them a powerful tool for detecting volatility shifts in real-time.
Momentum Filter (RSI):
The 14-period Relative Strength Index (RSI) is applied to ensure that buy signals only appear when the market is showing upward momentum (RSI above 50) and sell signals when there is downward momentum (RSI below 50).
This filtering mechanism helps avoid false signals during periods of consolidation or ranging markets, improving the signal's overall accuracy.
Non-Repainting Logic:
The buy and sell signals generated by the VTR Indicator are persistent and will not repaint after the bar closes. Once a signal is confirmed, it stays active until an opposite condition triggers a new signal.
This is achieved using a persistent signalState variable, which tracks the current market trend and prevents premature or false signals.
Stop-Loss and Take-Profit Levels:
The indicator automatically generates Stop Loss (SL) and Take Profit (TP) levels based on the ATR multiplier to assist with trade risk management.
These levels are dynamically calculated as a multiple of the ATR value, helping traders manage potential volatility and exit at strategic points.
Multi-Market Compatibility:
The VTR Indicator is suitable for all market pairs (cryptocurrencies, stocks, forex, indices), allowing traders to apply it across various timeframes and asset classes without losing performance reliability.
Alert System:
Built-in alert conditions notify traders of Buy and Sell signals, ensuring they don’t miss any potential trading opportunities.
Signal Logic & Interpretation
Buy Signal (Long Entry):
Condition 1: The price closes above the upper ATR band, suggesting potential upward price movement.
Condition 2: The RSI is above 50, confirming bullish momentum.
Buy Signal Confirmation: The buy signal is generated when both conditions are met and there is no prior active buy signal.
Sell Signal (Short Entry):
Condition 1: The price closes below the lower ATR band, suggesting potential downward price movement.
Condition 2: The RSI is below 50, confirming bearish momentum.
Sell Signal Confirmation: The sell signal is generated when both conditions are met and there is no prior active sell signal.
No Repainting:
Once a buy or sell signal is confirmed, it will not be altered, erased, or replaced by future bars. This ensures that the trader can trust the signal once it appears, knowing it will not change as the market moves.
Exit Points:
Take Profit: When a long position is active, the TP level is calculated as a multiple of the ATR above the entry price.
Stop Loss: When a long position is active, the SL level is calculated as a multiple of the ATR below the entry price.
For short positions, these levels are reversed: TP is below the entry price, and SL is above the entry price.
Trading Strategy:
Entry:
Enter a long position when the buy signal is generated, confirmed by the price crossing the upper ATR band and the RSI being above 50.
Enter a short position when the sell signal is generated, confirmed by the price crossing the lower ATR band and the RSI being below 50.
Exit:
For long positions, exit when the price reaches the Take Profit (TP) level or hits the Stop Loss (SL) level.
For short positions, exit when the price reaches the Take Profit (TP) level or hits the Stop Loss (SL) level.
Risk Management:
Use the ATR-based Stop Loss (SL) and Take Profit (TP) levels to manage risk dynamically.
Always ensure your stop-loss levels are within your risk tolerance for each trade.
Unique Aspects:
Adaptability: The VTR Indicator adapts to changing market conditions, making it suitable for high volatility environments like cryptocurrency trading.
Non-Repainting: Once a signal is generated, it remains valid and doesn't change with new bars, ensuring a reliable trading strategy.
Built-in Risk Management: Automatic dynamic SL and TP levels allow for strategic trade exits, enhancing trade management.
Example Scenario
Scenario 1 (Bullish Trend):
The price is above the upper ATR band, and the RSI is above 50, signaling a strong bullish trend. The buy signal is triggered, and the price continues to rise, hitting the take-profit target based on ATR levels.
Exit: The price reaches the TP level or hits the SL level, and the position is closed.
Scenario 2 (Bearish Trend):
The price is below the lower ATR band, and the RSI is below 50, signaling a strong bearish trend. A sell signal is generated, and the price continues to decline, hitting the take-profit target.
Exit: The price reaches the TP level or hits the SL level, and the short position is closed.

Hosoda ProjectionsThis script, written in Pine Script v5, introduces a technical analysis tool called "Hosoda Projections." Inspired by Ichimoku Kinkō Hyō and wave-based forecasting methods, this indicator helps traders visualize potential future price levels using a combination of pivot detection and projected price movements. It offers a unique way to anticipate market dynamics and define potential targets, making it particularly useful for those who seek to combine historical price patterns with forward-looking strategies.
The script works by detecting key pivot points in the market using a customizable lookback period and then calculating a ZigZag pattern based on price fluctuations that exceed a specified percentage threshold. These pivots are used to identify three recent swing points, which serve as the foundation for projecting possible future price levels. Using these swings, the script generates levels that correspond to Fibonacci-based extensions and projections, such as 38.2%, 61.8%, 100%, 161.8%, and additional extensions like 261.8% and 361.8%. These levels are visualized on the chart as horizontal lines and labeled with their respective values for easy interpretation.
The primary advantage of the Hosoda Projections script is its ability to provide a structured approach to identifying potential price targets. By leveraging the natural rhythm of price movements, it offers insights into where the market might find support or resistance in the future. This can help traders refine their entry and exit points, manage risk more effectively, and gain a deeper understanding of market sentiment. Additionally, the dynamic nature of the projections adapts to new price data, ensuring the tool remains relevant across changing market conditions.
This script is particularly valuable for traders who appreciate the harmony between historical price action and predictive analysis. Whether you are trading forex, stocks, or cryptocurrencies, the Hosoda Projections tool can enhance your trading strategy by providing actionable and visually intuitive forecasts.

Enhanced Volume Flow Analysis Pro ♾️ IFEnhanced Volume Flow Analysis Pro (EVFA Pro)
A Comprehensive Guide to Understanding and Using Volume Flow Analysis
Introduction
The Enhanced Volume Flow Analysis Pro (EVFA Pro) represents a sophisticated approach to understanding market dynamics through the lens of volume analysis. This advanced technical indicator has been designed to peel back the layers of market activity, revealing the intricate dance between institutional and retail traders. By combining volume analysis, participant behavior patterns, and market condition recognition, EVFA Pro provides traders with a deeper understanding of market movements and potential opportunities.
Understanding the Core Framework
At its heart, EVFA Pro works by analyzing and categorizing trading volume based on several key characteristics. The indicator examines not just the raw volume, but also the context in which that volume occurs. It considers factors such as price movement, historical patterns, and market conditions to classify trading activity as either institutional or retail in nature.
The framework adapts dynamically to different market environments. Whether you're trading stocks, ETFs, cryptocurrencies, or commodities, the indicator automatically adjusts its parameters to match the typical behavior patterns of each asset class. This adaptability extends to different trading styles as well, with optimizations for everything from quick-paced scalping to longer-term position trading.
Market Participant Analysis
One of the most powerful aspects of EVFA Pro is its ability to distinguish between institutional and retail trading activity. The indicator accomplishes this through a sophisticated analysis of volume patterns, order flow, and price action. Institutional trading typically leaves distinct footprints in the market - large, well-organized volume patterns that often occur at strategic price levels. EVFA Pro identifies these patterns and separates them from the more scattered, emotion-driven patterns typical of retail trading.
The indicator maintains a constant watch on participation rates from both groups. When institutional participation rises above normal levels, it could signal the beginning of a significant move. Similarly, spikes in retail activity, especially when combined with certain price patterns, might indicate potential market turning points.
Reading Market Conditions
Market conditions are not static, and EVFA Pro recognizes this fundamental truth. The indicator continuously evaluates market conditions, classifying them into four main categories: normal, volatile, ranging, and trending. This classification isn't merely descriptive - it directly influences how the indicator interprets various patterns and signals.
In volatile markets, the indicator becomes more conservative in its pattern recognition, requiring stronger confirmation before signaling potential opportunities. During ranging periods, it adjusts to look for shorter-term movements and potential breakout scenarios. In trending markets, the focus shifts to finding continuation patterns and potential exhaustion points.
Pattern Recognition and Signal Generation
Pattern recognition in EVFA Pro goes beyond simple technical patterns. The indicator looks for complex interactions between volume, price, and participant behavior. It identifies accumulation patterns - periods where institutional buyers are actively building positions, often while keeping price movements relatively subtle to avoid drawing attention. Similarly, it recognizes distribution patterns, where larger players are gradually reducing positions.
Signal generation involves a sophisticated weighing of multiple factors. Volume strength, institutional participation, trend alignment, and price momentum all play roles in determining signal strength. This multi-factor approach helps reduce false signals and provides a more reliable indication of potential market moves.
Visual Analysis Tools
The visual components of EVFA Pro have been carefully designed to present complex information in an intuitive format. The main chart overlay uses color-coded volume bars to show the relative participation of institutional and retail traders. The intensity of these colors varies with volume significance, helping traders quickly identify potentially important market activity.
The information table provides a real-time summary of market conditions, participant activity, and detected patterns. This dashboard-style display allows traders to quickly assess market conditions and potential opportunities without needing to analyze multiple indicators.
Practical Application in Trading
To use EVFA Pro effectively, traders should integrate it into a comprehensive trading strategy. The indicator works best when its signals are considered alongside other forms of analysis and risk management tools. Strong signals from EVFA Pro might suggest potential opportunities, but traders should always consider the broader market context, their own risk tolerance, and their overall trading plan.
The indicator's alerts system can help traders stay informed of potentially significant market developments. However, these alerts should be viewed as starting points for analysis rather than automatic trading signals. Each alert provides specific information about the type of pattern or condition detected, allowing traders to quickly assess whether further investigation is warranted.
Advanced Features and Customization
EVFA Pro offers extensive customization options to suit different trading styles and preferences. Traders can adjust sensitivity levels, color schemes, and display options to match their needs. The indicator also includes special considerations for different trading sessions, allowing for more accurate analysis during pre-market, regular trading hours, and after-hours periods.
Market Application and Interpretation
Success with EVFA Pro comes from understanding not just what it shows, but why it shows what it does. The indicator's patterns and signals reflect real market dynamics - the actions and reactions of different types of traders. By understanding these underlying dynamics, traders can make more informed decisions about market opportunities and risks.
Disclaimer
This indicator and documentation are provided for educational and informational purposes only. Trading in financial markets involves substantial risk of loss and is not suitable for every investor. The analysis provided by the Enhanced Volume Flow Analysis Pro indicator should not be considered as financial advice or a recommendation to make any specific trade or investment. Users of this indicator should understand that:
1. Past performance is not indicative of future results
2. All trading decisions and their outcomes are the responsibility of the individual trader
3. This tool should be used as part of a comprehensive trading strategy that includes proper risk management and due diligence
4. Markets can be highly unpredictable, and no technical analysis tool can guarantee success
Users should carefully consider their investment objectives, level of experience, and risk appetite before using this indicator. It is strongly recommended to consult with a qualified financial advisor before making any investment decisions.
VolbandsThe Volbands indicator dynamically plots upper and lower volatility bands based on implied daily moves derived from volatility indices. This tool provides a visual forecast of the next trading day's price range, helping traders anticipate potential price movement boundaries.
Key Features:
1. Auto-Detect Volatility Index: Volbands automatically detects the appropriate volatility index based on the current symbol. For example, it uses the VIX for S&P 500, VXN for Nasdaq 100, and custom indexes like VXAPL for Apple. Users can also manually select a specific volatility index if preferred.
2. Projected Bands:
- The indicator plots the projected upper and lower bands for the next trading day using the implied move from the volatility index.
- Displays today’s projected bands as a reference and overlays next day’s bands with a slight offset, visually indicating the anticipated range.
3. Dynamic Updates: The indicator updates automatically as new bars are added, ensuring that users have up-to-date projections based on the latest volatility data.
4. Highlighting Extreme Price Action: Candles that close outside of the projected bands are colored in yellow, highlighting moments of higher-than-expected volatility.
5. Informative Table: A customizable table displays relevant information, including:
- The selected or auto-detected volatility index
- Implied daily move percentage
- Projected upper and lower levels
Potential Applications:
- Risk Management: The Volbands indicator can help traders set more informed stop-loss and take-profit levels based on volatility-driven price projections.
- Identifying Overbought/Oversold Conditions: Price movement outside the projected bands may indicate overbought or oversold conditions, potentially signaling trade opportunities.
-Enhancing Entry and Exit Points: The projected bands act as soft support and resistance levels, assisting traders in timing entries and exits in anticipation of volatility-driven price reactions.
Future Enhancements:
Potential improvements to expand functionality could include:
- Additional Volatility Indices: Expanding coverage to include more assets and volatility indices.
- Alerts: Setting alerts for when prices breach the projected bands, enabling traders to react quickly to unexpected price movements.
- Customization of Bands: Adding options for users to adjust the implied move percentage, creating customized bands that reflect individual trading strategies.
This indicator combines implied volatility with price action, offering valuable insights to traders on expected price ranges and volatility.

Daily CRTDaily CRT Indicator
The Daily CRT Indicator is a custom technical analysis tool designed to help traders identify and visualize key price patterns on the daily timeframe. Specifically, it detects and marks the "Sweep and Close Inside" pattern, which is a price action pattern that can signal potential trading opportunities.
Key Features:
Pattern Detection:
The indicator detects two specific price action patterns:
Sweep and Close Above: When the current price sweeps above the previous day’s high and closes inside the range, indicating a potential bullish breakout or continuation.
Sweep and Close Below: When the current price sweeps below the previous day’s low and closes inside the range, signaling a potential bearish move.
Horizontal Lines:
The indicator automatically draws horizontal lines at the previous day’s high and low levels whenever a pattern is detected, providing a visual reference for key support and resistance zones.
These lines are displayed in real-time on the chart and adjust dynamically as new patterns form.
Customizable Line Appearance:
Choose the color, thickness, and style (solid, dashed, or dotted) of the lines to fit your preferred chart aesthetic.
Alert System:
The indicator comes with built-in alerts. Set an alert to notify you when the Sweep and Close Inside pattern is detected, helping you stay on top of potential trade setups.
History Management:
Show History: Optionally display the detected patterns on previous bars (past patterns).
Customizable History Duration: Control how far back you want to view the patterns, allowing you to adjust for a cleaner chart and focus on the most recent setups.
Visual Labels:
When the pattern is detected, the indicator can display a label under the bar (customizable) to highlight the occurrence of the pattern, making it easier for traders to spot potential trade signals.
Built for the Daily Timeframe:
This indicator is specifically designed to work on the daily timeframe and is ideal for swing traders and longer-term traders who are focused on the daily price action and want to capture patterns that indicate potential market reversals or breakouts.
How It Works:
The indicator monitors the previous day's price action and looks for situations where the current price action either sweeps the previous day's high or low and then closes inside the range of the previous day's bar. This type of price movement can often signal that a reversal or continuation is about to occur. The indicator marks these setups by drawing horizontal lines and optionally displays labels for quick identification.
Settings & Customization:
Line Color: Customize the color of the lines marking the previous day’s high and low.
Line Thickness: Choose from different thickness levels for better visibility.
Line Style: Pick from solid, dashed, or dotted styles.
Show History: Toggle the display of historical patterns, with the option to control how many days back to show.
Show Labels: Option to toggle the display of labels when the pattern is detected.
Alert Condition: Receive alerts when a pattern is detected, ensuring you never miss a trade opportunity.
Ideal For:
Swing Traders: This indicator is perfect for traders looking to capture swings in the market based on daily price action.
Pattern Traders: Those who trade based on specific chart patterns will benefit from this tool, as it identifies important reversal and breakout signals.
Technical Analysts: Anyone who incorporates price action patterns into their strategy can use this tool as a supplemental analysis tool to improve their trading decisions.
By using the Daily CRT Indicator, you’ll have a powerful tool to help you spot important price action patterns that may indicate key market moves. Whether you're looking to catch breakouts, reversals, or simply track significant support and resistance levels, this indicator is a versatile addition to your trading toolkit.
This description provides a clear understanding of how the Daily CRT Indicator works and what value it offers, making it easy for traders to know if it fits their trading style. Feel free to tweak the description further depending on the details you’d like to emphasize.
Enhanced London Session SMC SetupEnhanced London Session SMC Setup Indicator
This Pine Script-based indicator is designed for traders focusing on the London trading session, leveraging smart money concepts (SMC) to identify potential trading opportunities in the GBP/USD currency pair. The script uses multiple techniques such as Order Block Detection, Imbalance (Fair Value Gap) Analysis, Change of Character (CHoCH) detection, and Fibonacci retracement levels to aid in market structure analysis, providing a well-rounded approach to trade setups.
Features:
London Session Highlight:
The indicator visually marks the London trading session (from 08:00 AM to 04:00 PM UTC) on the chart using a blue background, signaling when the high-volume, high-impulse moves tend to occur, helping traders focus their analysis on this key session.
Order Block Detection:
Identifies significant impulse moves that may form order blocks (supply and demand zones). Order blocks are areas where institutions have executed large orders, often leading to price reversals or continuation. The indicator plots the high and low of these order blocks, providing key levels to monitor for potential entries.
Imbalance (Fair Value Gap) Detection:
Detects and highlights price imbalances or fair value gaps (FVG) where the market has moved too quickly, creating a gap in price action. These areas are often revisited by price, offering potential trade opportunities. The upper and lower bounds of the imbalance are visually marked for easy reference.
Change of Character (CHoCH) Detection:
This feature identifies potential trend reversals by detecting significant changes in market character. When the price action shifts from bullish to bearish or vice versa, a CHoCH signal is triggered, and the corresponding level is marked on the chart. This can help traders catch trend reversals at key levels.
Fibonacci Retracement Levels:
The script calculates and plots the key Fibonacci retracement levels (0.618 and 0.786 by default) based on the highest and lowest points over a user-defined swing lookback period. These levels are commonly used by traders to identify potential pullback zones where price may reverse or find support/resistance.
Directional Bias Based on Market Structure:
The indicator provides a market structure analysis by comparing the current highs and lows to the previous periods' highs and lows. This helps in identifying whether the market is in a bullish or bearish state, providing a clear directional bias for trade setups.
Alerts:
The indicator comes with built-in alert conditions to notify the trader when an order block, imbalance, CHoCH, or other significant price action event is detected, ensuring timely action can be taken.
Ideal Usage:
Timeframe: Suitable for intraday trading, particularly focusing on the London session (08:00 AM to 04:00 PM UTC).
Currency Pair: Specifically designed for GBP/USD but can be adapted to other pairs with similar market behavior.
Trading Strategy: Best used in conjunction with a price action strategy, focusing on the key levels identified (order blocks, FVG, CHoCH) and using Fibonacci retracement levels for precision entries.
Target Audience: Ideal for traders who follow smart money concepts (SMC) and are looking for a structured approach to identify high-probability setups during the London session.

Nova Volume Indicator (NVI) by SplitzMagicNova Volume Indicator
The Nova Volume Indicator is an innovative trading tool designed to enhance your trading strategy by analysing volume momentum and market dynamics. This indicator empowers traders to make informed decisions by providing clear and actionable buy and sell signals based on real-time data.
How It Works:
The Nova Volume Indicator utilizes advanced algorithms to assess volume changes and price movements. Key features include:
Volume Momentum Calculation: By evaluating the relationship between price changes and volume, the indicator identifies significant momentum shifts, enabling traders to pinpoint entry and exit points with precision.
Trend Direction Filter: The indicator includes a price filter that determines the prevailing market trend based on a moving average. This ensures that trades align with the overall market direction, enhancing the probability of success.
Alert System: With customizable alert thresholds, users receive notifications when momentum crosses defined levels, keeping them informed of potential trading opportunities without the need for constant monitoring.
No Trade Signal: A black background on the histogram indicates that there are no valid trading opportunities at that moment. Use this feature to avoid entering trades during uncertain market conditions.
How to Use the Nova Volume Indicator for Entries:
Identifying the Trend: Before making any trades, check the indicator's trend direction. If the price is above the moving average, focus on bullish signals; if below, look for bearish signals.
Spotting Entries:
Buy Signal: Look for a green histogram bar indicating positive volume momentum. Enter a trade at the close of the candle when the momentum score exceeds your alert threshold and the price is above the moving average.
Sell Signal: A red histogram bar signals negative volume momentum. Enter a short position at the close of the candle when the momentum score falls below the alert threshold and the price is below the moving average.
Setting Stops and Targets: Place your stop-loss below the recent swing low for buy trades or above the recent swing high for sell trades. Aim for a minimum 1:2 risk-to-reward ratio to maximize your profitability.
Customizable Settings:
The Nova Volume Indicator offers several input settings to help you tailor the indicator to your unique trading style:
Signal Period: Adjust the period for calculating the signal line (EMA of momentum score). A shorter period reacts quickly, while a longer one smooths the signals.
Volatility Period: Control the lookback period for assessing market volatility. Shorter periods capture recent fluctuations, and longer periods provide a broader view of price behavior.
Price Filter MA Length: Set the period for the moving average used to filter trades based on price action, helping determine the trend direction.
Alert Threshold: Define the level at which the indicator signals potential buying or selling opportunities. Customize this setting to suit your trading preferences.
The Nova Volume Indicator is a powerful addition to any trader’s toolkit, designed to simplify decision-making and improve trading outcomes. Whether you're a beginner or a seasoned trader, this indicator offers the insights you need to navigate the markets confidently. Explore its customizable features to create a unique trading experience tailored to your needs. Start using the Nova Volume Indicator today and elevate your trading journey!
Any questions you may have or if you have anything to input to improve this then please leave a comment.

David_30-Minute Boxes This indicator draws boxes for 30-minute intervals on the chart, highlighting significant price movements. The boxes begin at 00:00 and end at 22:00. Each box is color-coded according to price action:
Green Box: The closing price at the end of the 30-minute period is above the opening price.
Red Box: The closing price at the end of the 30-minute period is below the opening price.
Dark Green Box: The closing price at the end of the box is higher than the high of the previous box.
Dark Red Box: The closing price at the end of the box is lower than the low of the previous box.
The boxes dynamically adjust within each 30-minute interval to reflect the high and low of the period. The border of each box is fully transparent for a clean and uncluttered visual display.
Optional Candle Numbering
In the indicator settings, you can enable or disable the numbering of individual candles within each box. The numbering restarts at 1 for each new box, helping to track the progression of individual 30-minute intervals.
Use Cases
This indicator is particularly useful for traders who want to analyze short-term movements and the dynamics within 30-minute intervals. The color-coding of the boxes provides quick visual insights into the strength of price action within a time interval, making it easier to spot momentum shifts or important support and resistance levels.

Signals Pro [traderslog]The "Signals Pro" indicator is an advanced and versatile trading tool designed to help traders accurately identify key buy and sell signals using a combination of technical analysis factors such as candle patterns , RSI (Relative Strength Index) , and candle stability . It is highly customizable and offers a range of options that make it suitable for both short-term and long-term traders. By filtering market noise and providing actionable insights, this indicator enhances decision-making and helps traders capitalize on market movements.
At the core of the "Signals Pro" indicator is the concept of Candle Stability . The Candle Stability Index measures the ratio between a candle's body and its wicks, providing insight into the strength of the price movement during that period. A higher value indicates that the candle is more stable, meaning that the price has moved significantly without much retracement. This stability filter is crucial because it prevents the generation of signals during volatile or choppy market conditions where price direction is uncertain. Traders can adjust the Candle Stability Index from 0 to 1, allowing for precise control over how stable a candle must be for the indicator to generate a signal.
Another key feature is the use of RSI (Relative Strength Index) , a momentum oscillator that measures the speed and change of price movements. The RSI index parameter in the indicator can be customized to detect overbought or oversold conditions. When the RSI falls below the defined threshold, it signals that the market may be oversold , which can indicate a potential buying opportunity . Conversely, when the RSI exceeds a certain value, it suggests that the market is overbought , signaling a potential selling opportunity . This allows traders to time their trades more effectively by entering when market conditions are favorable and exiting before a potential reversal occurs.
The Candle Delta Length is another critical element of the "Signals Pro" indicator. This parameter measures how much the price has increased or decreased over a specific number of candles. By adjusting the Candle Delta Length , traders can define how many periods the indicator should analyze before generating a signal. A longer Candle Delta Length means the price has been trending in one direction for a longer period, providing more reliable signals. For instance, if the price has been steadily decreasing for five candles, this could signal a bullish reversal , triggering a buy signal .
To further enhance its accuracy, the "Signals Pro" indicator includes a unique feature that allows traders to disable repeating signals . This is particularly useful in situations where the market is moving sideways or during low volatility periods, where multiple signals may cluster close together, creating confusion. By enabling the disable repeating signals option, traders can prevent these repeated signals and focus on the most important and confirmed signals, ensuring cleaner charts and reducing the risk of overtrading.
A key technical aspect of the indicator is its ability to detect bullish and bearish engulfing patterns . The indicator looks for bullish engulfing patterns, which occur when a bullish candle fully engulfs the body of the previous bearish candle, signaling a potential bullish reversal . Conversely, bearish engulfing patterns occur when a bearish candle fully engulfs the previous bullish candle, indicating a bearish reversal . By incorporating these candle patterns with the Candle Stability Index and RSI levels , the indicator provides highly reliable signals based on price action and market sentiment.
Visual customization is another major advantage of the "Signals Pro" indicator. Traders can choose from several different label styles , such as text bubbles , triangles , or arrows to mark the buy and sell signals on the chart. This makes the signals stand out and easy to interpret at a glance. Furthermore, the color of these signals can be customized: green for buy signals and red for sell signals , along with options to adjust the text size and label styles for even more personalization. Traders can make the signals more or less prominent based on their preference, enhancing readability and workflow efficiency.
The indicator also includes a comprehensive alert system , ensuring traders never miss an opportunity. Alerts can be set for both buy and sell signals , and the system triggers in real-time when a valid signal is generated. This is especially useful for active traders who want to stay on top of the markets without constantly monitoring their screens. The alert system helps ensure that traders are notified of potential trading opportunities as soon as they arise, allowing them to act quickly in volatile markets.
From a practical standpoint, the "Signals Pro" indicator is designed to work seamlessly across multiple timeframes, making it suitable for scalpers, day traders, swing traders, and even long-term investors. Its flexibility allows it to adapt to different trading styles and time horizons, providing value for a wide range of market participants.
In summary, the Signals Pro indicator offers a robust and customizable solution for identifying buy and sell signals . By combining candle stability , RSI analysis , and engulfing patterns , the indicator provides traders with reliable signals to enter or exit trades. The ability to customize signal appearance, coupled with a real-time alert system , makes the "Signals Pro" indicator an invaluable tool for traders looking to improve their timing and decision-making. Whether you are looking to capture short-term price movements or want to time entries and exits in longer-term trends, this indicator offers the insights needed to navigate the markets with confidence.

Judas Swing ICT 01 [TradingFinder] New York Midnight Opening M15🔵 Introduction
The Judas Swing (ICT Judas Swing) is a trading strategy developed by Michael Huddleston, also known as Inner Circle Trader (ICT). This strategy allows traders to identify fake market moves designed by smart money to deceive retail traders.
By concentrating on market structure, price action patterns, and liquidity flows, traders can align their trades with institutional movements and avoid common pitfalls. It is particularly useful in FOREX and stock markets, helping traders identify optimal entry and exit points while minimizing risks from false breakouts.
In today's volatile markets, understanding how smart money manipulates price action across sessions such as Asia, London, and New York is essential for success. The ICT Judas Swing strategy helps traders avoid common pitfalls by focusing on key movements during the opening time and range of each session, identifying breakouts and false breakouts.
By utilizing various time frames and improving risk management, this strategy enables traders to make more informed decisions and take advantage of significant market movements.
In the Judas Swing strategy, for a bullish setup, the price first touches the high of the 15-minute range of New York midnight and then the low. After that, the price returns upward, breaks the high, and if there’s a candlestick confirmation during the pullback, a buy signal is generated.
bearish setup, the price first touches the low of the range, then the high. With the price returning downward and breaking the low, if there’s a candlestick confirmation during the pullback to the low, a sell signal is generated.
🔵 How to Use
To effectively implement the Judas Swing strategy (ICT Judas Swing) in trading, traders must first identify the price range of the 15-minute window following New York midnight. This range, consisting of highs and lows, sets the stage for the upcoming movements in the London and New York sessions.
🟣 Bullish Setup
For a bullish setup, the price first moves to touch the high of the range, then the low, before returning upward to break the high. Following this, a pullback occurs, and if a valid candlestick confirmation (such as a reversal pattern) is observed, a buy signal is generated. This confirmation could indicate the presence of smart money supporting the bullish movement.
🟣 Bearish Setup
For a bearish setup, the process is the reverse. The price first touches the low of the range, then the high. Afterward, the price moves downward again and breaks the low. A pullback follows to the broken low, and if a bearish candlestick confirmation is seen, a sell signal is generated. This confirmation signals the continuation of the downward price movement.
Using the Judas Swing strategy enables traders to avoid fake breakouts and focus on strong market confirmations. The strategy is versatile, applying to FOREX, stocks, and other financial instruments, offering optimal trading opportunities through market structure analysis and time frame synchronization.
To execute this strategy successfully, traders must combine it with effective risk management techniques such as setting appropriate stop losses and employing optimal risk-to-reward ratios. While the Judas Swing is a powerful tool for predicting price movements, traders should remember that no strategy is entirely risk-free. Proper capital management remains a critical element of long-term success.
By mastering the ICT Judas Swing strategy, traders can better identify entry and exit points and avoid common traps from fake market movements, ultimately improving their trading performance.
🔵 Setting
Opening Range : High and Low identification time range.
Extend : The time span of the dashed line.
Permit : Signal emission time range.
🔵 Conclusion
The Judas Swing strategy (ICT Judas Swing) is a powerful tool in technical analysis that helps traders identify fake moves and align their trades with institutional actions, reducing risk and enhancing their ability to capitalize on market opportunities.
By leveraging key levels such as range highs and lows, fake breakouts, and candlestick confirmations, traders can enter trades with more precision. This strategy is applicable in forex, stocks, and other financial markets and, with proper risk management, can lead to consistent trading success.

SMA, VWAP with Buy/Sell Signals - First Signal OnlyIndicator: SMA, VWAP with First Buy/Sell Signals
Overview:
This indicator plots two Simple Moving Averages (SMA 20 and SMA 200) and the Volume-Weighted Average Price (VWAP) on the chart, with fully customizable colors and line thickness. Additionally, it provides buy and sell signals based on the price action relative to these indicators.
Buy Signal:
A buy signal is generated when a green candle (bullish candle) closes above the SMA 20, SMA 200, and VWAP without touching them (i.e., the low of the candle is above all three). This signal will only be plotted for the first such candle of the day to avoid signal clutter.
Sell Signal:
A sell signal is generated when a candle closes below the SMA 20, SMA 200, and VWAP without touching them (i.e., the high of the candle is below all three). Similar to the buy signal, it will only be plotted for the first qualifying candle of the day.
Customization:
SMAs and VWAP: Users can adjust the lengths, colors, and line thickness of the SMAs and VWAP to suit their preferences.
Signal Shape: You can choose from different shapes (arrow, circle, or cross) to represent the buy and sell signals on the chart.
Key Features:
First Candle Only: Both buy and sell signals are generated only for the first candle that satisfies the conditions, ensuring clean and actionable signals.
Visual Customization: Full control over the appearance of the indicator, including signal shapes and line properties.
Works Across Assets: This indicator is applicable to any asset (stocks, forex, crypto) where price action relative to moving averages and VWAP is important.

Median Kijun-Sen [InvestorUnknown]The Median Kijun-Sen is a versatile technical indicator designed for both trend-following strategies and long-term market valuation. It incorporates various display modes and includes a backtest mode to simulate its performance on historical price action.
Key Features:
1. Trend-Following and Long-Term Valuation:
The indicator is ideal for trend-following strategies, helping traders identify entry and exit points based on the relationship between price and the Kijun-Sen calculated from median price (customizable price source).
With longer-term settings, it can also serve as a valuation tool (in oscillator display mode), assisting in identifying potential overbought or oversold conditions over extended timeframes.
2. Display Modes:
The indicator can be displayed in three main modes, each serving a different purpose:
Overlay Mode : Plots the Median Kijun-Sen directly over the price chart, useful for visualizing trends relative to price action.
Oscillator Mode : Displays the oscillator that compares the current price to the Median Kijun-Sen, providing a clearer signal of trend strength and direction
Backtest Mode : Simulates the performance of the indicator with different settings on historical data, offering traders a way to evaluate its reliability and effectiveness without needing TradingView's built-in strategy tool
3. Backtest Functionality:
The inbuilt backtest mode enables users to evaluate the indicator's performance across historical data by simulating long and short trades. Users can customize the start and end dates for the backtest, as well as specify whether to allow long & short, long only, or short only signals.
This backtest functionality mimics TradingView's strategy feature, allowing users to test the effectiveness of their chosen settings before applying them to live markets.
equity(series int sig, series float r, startDate, string signals, bool endDate_bool) =>
if time >= startDate and endDate_bool
float a = 0
if signals == "Long & Short"
if sig > 0
a := r
else
a := -r
else if signals == "Long Only"
if sig > 0
a := r
else if signals == "Short Only"
if sig < 0
a := -r
else
runtime.error("No Signal Type found")
var float e = na
if na(e )
e := 1
else
e := e * (1 + a)
float r = 0.0
bool endDate_bool = use_endDate ? (time <= endDate ? true : false) : true
float eq = 1.0
if disp_mode == "Backtest Mode"
r := (close - close ) / close
eq := equity(sig, r, startDate, signals, endDate_bool)
4. Hint Table for Pane Suggestions:
An inbuilt hint table guides users on how to best visualize the indicator in different display modes:
For Overlay Mode, it is recommended to use the same pane as the price action.
For Oscillator and Backtest Modes, it is advised to plot them in a separate pane for better clarity.
This table also provides step-by-step instructions on how to move the indicator to a different pane and adjust scaling, making it user-friendly.
Potential Weakness
One of the key drawbacks is the indicator’s tendency to produce false signals during price consolidations, where price action lacks clear direction and may trigger unnecessary trades. This is particularly noticeable in markets with low volatility.
Alerts
The indicator includes alert conditions for when it crosses above or below key levels, enabling traders to receive notifications of LONG or SHORT signals.
Summary
The Median Kijun-Sen is a highly adaptable tool that serves multiple purposes, from trend-following to long-term valuation. With its customizable settings, backtest functionality, and built-in hints, it provides traders with valuable insights into market trends while allowing them to optimize the indicator to their specific strategy.
This versatility, however, comes with the potential weakness of false signals during consolidation phases, so it's most effective in trending markets.

OnChart - ExodusEye - Screener Motivation Behind OnChart ExodusEye Screener:
The goal of the ExodusEye Screener is to provide traders with a quick and efficient way to identify trading opportunities across multiple symbols without manually checking each one. By integrating the powerful logic of OnChart features, the screener aims to streamline the analysis process, helping traders find actionable insights in real-time.
█ Overall Explanation
The ExodusEye Screener is a tool that underlays directly onto the chart, using the logic from various OnChart features. It offers 4 modes of operation:
MagnetZone Mode: Highlights symbols where new strategic zones have formed, indicating potential areas of interest.
CandleSniper Mode: Identifies symbols with bullish or bearish decision points, helping traders spot potential turning moments.
NeonZenith Mode: Displays decision points across four different categories, showing where key levels are being reached live.
Off Mode: Disables the overlay, allowing traders to use the chart without any active screener logic.
█ How to Use:
Modes: Select the mode that aligns with your current strategy. Each mode focuses on a specific aspect of the market, providing insights tailored to different trading approaches.
Symbols: Choose the symbols you want the screener to analyze. The screener will automatically update and show relevant information for each selected symbol based on the active mode.
█ Detailed Feature Explanations:
--------------🎯 CandleSniper --------------
Overview:
The CandleSniper indicator is designed to identify potential turning points in the market by combining various technical analysis tools. It leverages a combination of the MACD indicator, advanced phase analysis technique, and Fibonacci levels to highlight moments where price action may be reversing. This helps traders spot divergence opportunities and set potential target levels.
Explanation
MACD Divergence with Phase Analysis:
The indicator leverages the MACD (Moving Average Convergence Divergence) to identify divergences, which can indicate potential reversal points in the market. The MACD is computed using standard short and long lengths, along with a signal line.
An advanced phase analysis technique is employed to measure the difference between price and its moving averages, enabling the identification of cyclical turning points in the market
A potential bullish decision point is identified when the MACD line crosses above the signal line during a cyclical turning point. Conversely, a potential bearish decision point is identified when the MACD line crosses below the signal line during a cyclical turning point.
Inputs and Settings:
lookbackPeriod: Defines the period over which the indicator looks back to calculate the Fibonacci levels. Adjusting this setting can change the sensitivity of the decision points.
Dimmer and DimmerPeriod: These settings control the smoothing applied to the price data before the phase calculation. They help in reducing noise and ensuring that only significant price movements are considered for decision points.
How to Use:
Traders can use the CandleSniper indicator to identify potential decision points by observing the color changes on the bars and the plotted Fibonacci levels:
🟢 Bullish Decision Points:
When the indicator detects a bullish divergence, it highlights the bars in purple and plots potential upward Fibonacci levels as targets.
🔴 Bearish Decision Points:
When a bearish divergence is detected, the indicator highlights the bars in white and plots downward Fibonacci levels as targets.
These decision points can help traders identify when the market might be ready for a reversal or continuation or even use as a start point from where the trader can start his own analysis
--------------🧲 MagnetZone Horizon --------------
Overview:
The MagnetZone Horizon indicator is a specialized tool designed to identify potential gaps between two significant changes in the Average True Range (ATR). These gaps, calculated dynamically, serve as areas where the price might react, often acting as smart Fair Value Gaps (FVG). By highlighting these zones, traders can gain insights into where the market might find support, resistance, or potential reversal points.
Settings and Their Impact:
Factor: This setting multiplies the ATR to scale the detected gaps. A higher factor results in broader zones, which might capture more significant market movements, while a lower factor creates tighter zones for more precise analysis.
Division: This setting works in conjunction with the Factor to further refine the gap calculations. Adjusting the Division setting allows traders to fine-tune how sensitive the indicator is to ATR changes, which can help in pinpointing more precise smart FVGs.
Use Cases:
Gap Trading:
Traders can use the identified gaps as potential areas to enter or exit trades, particularly if the price approaches these smart FVGs. The idea is to capitalize on the likelihood that the market will react to these gaps.
Reversal Identification:
The zones marked by the MagnetZone Horizon can indicate potential reversal points, especially in volatile markets where significant ATR changes suggest a shift in market sentiment.
Trend Continuation or Rejection:
By monitoring how the price interacts with these dynamically calculated zones, traders can assess whether a trend is likely to continue or reverse, aiding in more informed trading decisions.
The MagnetZone Horizon indicator is particularly useful for traders looking to identify significant gaps in market activity that are influenced by volatility. These smart FVGs provide a deeper understanding of where the market might react, offering a valuable tool for enhancing trading strategies and adds another strategic piece to the puzzle in the OnChart Suite.
--------------🟢NeonZenith Indicator--------------
Overview:
NeonZenith is a tool designed to provide traders with a better understanding of market trends and potential decision points by utilising multiple elements, including EMAs and Fibonacci levels. This indicator identifies key structures in recent price movements, helping traders recognize potential trend shifts and generate target levels for their trading strategies.
Key Features:
Trend Direction Identification:
NeonZenith uses EMAs to help traders gauge the overall trend direction. By analysing the relationship between different EMAs, the tool highlights potential points where trends may strengthen or reverse, offering decision points for traders to consider in their strategies.
Decision Points:
The tool generates decision points based on EMA interactions, providing traders with crucial levels that may indicate potential market entries or exits. These decision points are derived from the intersection of EMAs, which are known for their reliability in identifying trend shifts.
Settings:
Left and Right Border Width:
These settings control the lookback period for identifying significant price structures. By adjusting these parameters, traders can fine-tune the sensitivity of the indicator to recent price movements.
█ Conclusion
The OnChart ExodusEye Screener simplifies the process of finding trading opportunities by using the logic of OnChart's indicators. By providing real-time insights directly on the chart, it helps traders quickly identify potential setups across multiple symbols.