Support Resistance Channels/Zones Multi Time FrameHello All,
For long time I have been getting a lot of requests for Support/Resistance Multi Time Frame script. Here ' Support Resistance Channels/Zones Multi Time Frame ' is in your service.
This script works if the Higher Time Frame you set is higher than the chart time frame. so the time frame in the options should be higher than the chart time frame.
The script checks total bars and highest/lowest in visible part of the chart and shows all S/R zones that fits according the highest/lowest in visible part. you can see screenshots below if it didn't make sense or if you didn't understand
Let see the options:
Higher Time Frame : the time frame that will be used to get Support/Resistance zones, should be higher than chart time frame
Pivot Period : is the number to find the Pivot Points on Higher time frame, these pivot points are used while calculating the S/R zones
Loopback Period : is the number of total bars on higher time frame which is used while finding pivot points
Maximum Channel Width % : is the percent for maximum width for each channel
Minimum Strength : each zone should contain at least a 1 or more pivot points, you set it here. (Open/High/Low/Close also are considered while calculating the strength)
Maximum Number of S/R : the number of maximum Support/Resistance zones. there can be less S/Rs than this number if it can not find enough S/Rs
Show S/R that fits the Chart : because of we use higher time frame, you should enable this option then the script shows only S/Rs that fits the current chart. if you disable this option, all S/R zones are shown and it may shrink the chart. also you may not see any S/R zone if you don't choose the higher time frame wisely ;)
Show S/R channels in a table : if you enable this option (by default it's enabled) then lower/upper bands of all S/R zones shown in a table ( even if it doesn't fit the chart ). you can change its location. zones are sorted according to their strengths. first one is the strongest.
and the other options is about colors and transparency.
Screenshots before and after zoom-out:
after zoom-out number of visible bars and highest/lowest change and it shows more S/R zones that fits the current chart!
if you see Support Resistance zone like below then you should decrease ' Maximum Channel Width ' or you should set higher time frame better:
You can change colors and transparency:
You can change Table location:
Alerts added :)
P.S. I haven't tested it so much, if you see any issue please drop a comment or send me message
Enjoy!
Pesquisar nos scripts por "pivot points"

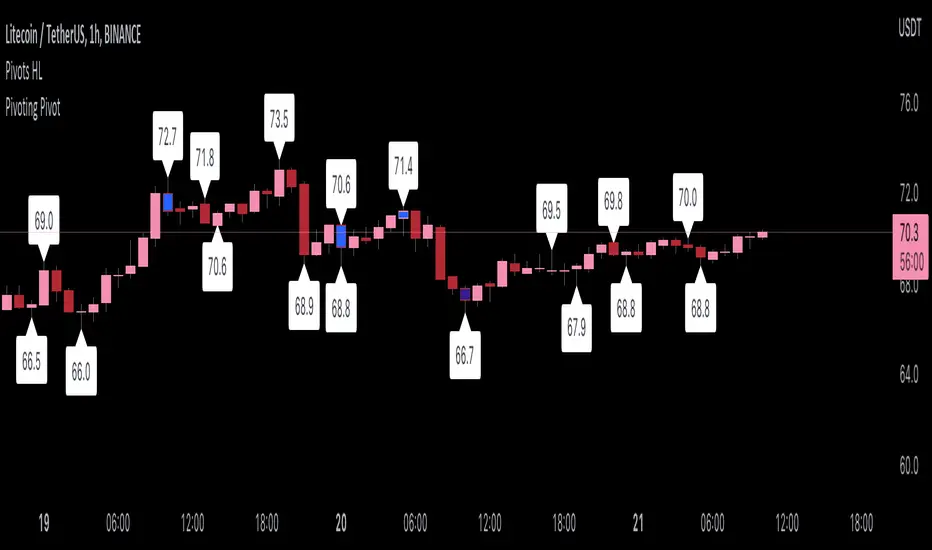
Pivoting PivotMany people use Pivots when conducting analysis, but I don't see many people using pivoting pivots. Pivoting pivots are pivots that don't have any other pivots around them. They can be useful when trying to separate pivot clusters from important pivot points.
The code is calculated by finding the distance between two candlesticks (left check), then calculating the distance between the last pivot and the current candlestick.
On the chart: labels are TradingView's official pivot high and pivot low script, and the blue candle color is my pivoting pivots (both with a look left and look right of 2).
Special thanks to @fikira for helping me with ideas for the calculations!
Bias Pivot PointA simple indicator that uses Pivot Points as a filter and to generate a Directional Bias .
How to use this indicator?
1. Directional Bias
Bullish => Closing Price > Pivot Point
Bearish => Closing Price < Pivot Point
2. Support / Resistance
Each Pivot Points can be used as Support or Resistance
3. Take Profit Targets
Each Pivot Points can be used as targets for taking profit

Joint Conditions Strategy Suite + TradingConnector alerts bot"Please give us combined alerts with the possibility of having several conditions in place to trigger the alert." - was the top voted request from users under one of the recent blogposts by TradingView.
Ask and you shall receive ;)
TradingView is a great platform, with unmatched set of functionalities, yet this particular combo of features indeed seems not to be in place. Fortunately, TradingView is also very open platform, thanks to PineScript coding language, which enables developing combos like the requried one and plenty of other magic.
I have already published numerous "educational" scripts, showing how to code indicators and alerts with PineScript, but... this is not one of them. This one is for real. READY FOR USE on real markets, also by the non-coding traders. Just take my script, set parameters with dropdowns, backtest the strategy, fire the alerts and execute them.
HOW TO USE IT
In "Settings" popup I tried to mimic the CreateAlert popup dropdowns for selecting logic. Let's say you want to enter Long position at Stochastic KxD crossover. In first line of Long Entry conditions set "StochK" + "Crossing Up" + "StochD". Last field doesn't matter because in 3rd dropdown something else than "value" was selected. In second line you could set "maB" + "Greater Than" + "maC" to filter out those entries which are in direction of the uptrend. And yeah, add ADX>25 to make sure the market is actually moving: "ADX" + "Greater Than" + "value" + "25". All condition lines must be TRUE (or skipped) for the entry to be triggered. Toghether with an alert.
The same for Short entries. Combinations are limitless.
INDICATORS AND MTF (MULTI-TIMEFRAME)
In those dropdowns you can select candle values like open/close/high/low/ohlc4, but also some most popular indicators, which I have pre-built into this script: RSI, various Moving Averages, ADX-DMI, Stochastic and Bollinger Bands for start. You can configure parameters of those indicators also in "Settings" popup, in "Indicator Definitions" section. What's important, you can use any of these indicators from higher timeframe, setting MTF multiplier. So if you applied this indicator to 1h chart, but want to use rsi(close,14) from 4h chart, set MTF to 4. If you want to use current timeframe indicators, keep MTF at 1, which is a default setting here.
Note for coders: to keep focus of this script on joining conditions, entire logic for those indicators has been moved to external library, also open source. I encourage you to dig into the code and see how it's done. I love the addition of libraries concept in PineScript.
CUSTOM INDICATOR
Following the "openness" spirit of my master - which is TradingView itself - my work is also open, in 2 ways:
1. This script is open source. So you can grab it, modify or add any functionalities you want. I cannot and don't want to stop you from doing that. I'm asking for only one favor - please mention this source script in your credits.
2. You can import the plot (series) from any other indicator on TradingView. In Settings popup of my script, scroll down to "Indicator Definitions" section, and select the series of your choice in the first dropdown. Now it is ready to use in conditions dropdowns on top of the Settings popup.
Let me give you an example of that last scenario. Take another script of mine, "Pivot Points on SR lines DEMO". You can find it in "Indicators & Strategies" library or here: (). Attach it to your chart. Now come back to THIS script, open Settings popup and in "Custom Indicator aka Imported Source" select "Pivot Points on SR lines: ...". The way it works - it detects if a pivot point happened on Support/Resistance line from the past and returns 1 for PivotLow and -1 for Pivot High. Now in first Long Entry condition set: "custom indicator" + "Greater Than" + "value" + "0" and long entries will be marked on every pivot low noticed on Support/Resistance line.
ALERTS
Last but not least - the alerts. This script produces alerts on the entries calculated by strategy logic, as marked on the chart by the backtester. Moreover, syntax of those alerts is already prepared and fully compatible with TradingConnector - alerts executing tool (bot), if you want to auto-execute those trades. Apart from installing the tool, you need to set
up the alerts in TradingView, here is how:
open CreateAlert popup
in first dropdown select "Joint Conditions Strategy Template"
in second dropdown select "alert() function calls only"
And that's all. You only need to set one alert for the whole script, not one for Longs and one for Shorts as it was in the past. Also, you don't need to setup closing alerts, because stop-loss/take-profit/trailing-stop information is embedded in the entry alert so your broker receives it as early as possible. Alerts sent will look like this: "long sl=40 tp=80", which is exactly what TradingConnector expects.
Phew, that's all folks. If you think I should add something to this template (maybe other indicators?) please let me know in comments or via DM. Happy trading!
P.S. Pyramiding is not supported in this script.
Disclaimer : I'm not saying above combination of conditions will make you money. Actually none of this can be considered financial advice. It is only a software tool. Use it wisely, be aware of the risk and do your own research!

Double Top/BottomHere is an attempt to identify double top/bottom based on pivot high/lows.
Logic is simple.
Double Bottom:
Last two pivot High Lows make W shape
Last Pivot Low is higher than previous Last Pivot Low.
Last Pivot High is lower than previous last Pivot High.
Price has not gone below Last Pivot Low
Price breaks out of last Pivot High to complete W shape
Double Top:
Last two pivot High Lows make M shape
Last Pivot Low is higher than previous Last Pivot Low.
Last Pivot High is lower than previous last Pivot High.
Price has not gone above Last Pivot High
Price breaks out of last Pivot Low to complete M shape
Prameters:
Parameters PvtLenL , PvtLenR and waitforclose determines pivot points.
FilterPivots clears repetitive pivots formed in same direction before calculating the possible double top/bottom.
For example:
CheckForAbsolutePeaks and AbsolutePeakLoopback works together. When CheckForAbsolutePeaks is enabled, script only generates double bottom or top signal if previous last pivot is absolute high or low for AbsolutePeakLoopback periods.
ConsiderMovingAverage does two things. First, it makes sure that fast moving average and slow moving averages are aligned with the direction we are going to forecast. Second, it makes sure that the crossover happend recently and with last BarCrossoverLimit bars. For example, to call it double bottom, Fast MA should be higher than Slow MA and crossover of FastMA above SlowMA should have happened in last 10 bars (BarCrossoverLimit)
PivotDisplayMode can be Actual, Filtered or None. Actual will display all pivot high low generated. Filtered will only display last 5 pivot high and pivot lows which are filtered . That means, it will remove the repetitive pivots formed without making pivots on the other side.
Welcome and suggestions and feedbacks.

Support Resistance ChannelsHello All,
For Long time I was planning to make Support/Resistance Channels script, finally I had time and here it is.
How this script works?
- it finds and keeps Pivot Points
- when it found a new Pivot Point it clears older S/R channels then;
- for each pivot point it searches all pivot points in its own channel with dynamic width
- while creating the S/R channel it calculates its strength
- then sorts all S/R channels by strength
- it shows the strongest S/R channels, before doing this it checks old location in the list and adjust them for better visibility
- if any S/R channel was broken on last move then it gives alert and put shape below/above the candle
- The colors of the S/R channels are adjusted automatically
You can set/change following settings:
- Pivot Period
- Source : High/Low or Close/Open can be used
- Maximum Channel Width %: this is the maximum channel width rate, this is calculated using Highest/Lowest levels in last 300 bars
- Number of S/R to show : this is the number of Strongest S/R to show
- Loopback Period: While calculating S/R levels it checks Pivot Points in LoopBack Period
- Show S/R on last # Bars: To see S/R levels only on last N bars
- Start Date: the script starts calculating Pivot Point from this date, the reason I put this option is for visuality. Explained below
- You can set colors/transparency
- and You can enable/disable shapes for broken S/R levels
Examples:
You can change colors as you wish:
here " Show S/R on last # Bars " set 100:
Sometimes visuality may corrupt because of old S/R levels, to solve it you need to set "Start Date" in the options to start the script in visual part (last 292 bars)
here in first screenshot it doesn't look good (shrink), then on second screenshot I set the "Start Date" it looks better, if you change time frame don't forget to set it again :)
Enjoy!

Higher Order PivotsFirst order pivot points are defined as 3 or 5 bar "V" shaped patterns. For example a high with a lower high either side of the peak and in the case of the 5 bar variant with lower highs adjacent to a high below the peak.
Second order pivot points are defined by three first order pivots in the same manner. For example a peak pivot high with a lower pivot high to either side.
Third order pivots follow the same pattern, a peak second order pivot high with two adjacent second order pivot highs.
As it can take a significant and variable amount of time before higher order pivots are confirmed, it is generally inadvisable to use higher order pivots for live trading!
However they can be used for historical analysis. For example to delineate market structure of major market inflections.
For example :
Delineating market structure using 2nd order pivots derived from 3 bar, 1st order pivots
Major market inflections from 3rd order pivots derived from 5 bar, 1st order pivots

Combo Backtest 123 Reversal & Dynamic Pivot Point This is combo strategies for get a cumulative signal.
First strategy
This System was created from the Book "How I Tripled My Money In The
Futures Market" by Ulf Jensen, Page 183. This is reverse type of strategies.
The strategy buys at market, if close price is higher than the previous close
during 2 days and the meaning of 9-days Stochastic Slow Oscillator is lower than 50.
The strategy sells at market, if close price is lower than the previous close price
during 2 days and the meaning of 9-days Stochastic Fast Oscillator is higher than 50.
Second strategy
This Pivot points is calculated on the current day.
Pivot points simply took the high, low, and closing price from the previous period and
divided by 3 to find the pivot. From this pivot, traders would then base their
calculations for three support, and three resistance levels. The calculation for the most
basic flavor of pivot points, known as ‘floor-trader pivots’, along with their support and
resistance levels.
WARNING:
- For purpose educate only
- This script to change bars colors.
Combo Strategy 123 Reversal & Dynamic Pivot Point This is combo strategies for get a cumulative signal.
First strategy
This System was created from the Book "How I Tripled My Money In The
Futures Market" by Ulf Jensen, Page 183. This is reverse type of strategies.
The strategy buys at market, if close price is higher than the previous close
during 2 days and the meaning of 9-days Stochastic Slow Oscillator is lower than 50.
The strategy sells at market, if close price is lower than the previous close price
during 2 days and the meaning of 9-days Stochastic Fast Oscillator is higher than 50.
Second strategy
This Pivot points is calculated on the current day.
Pivot points simply took the high, low, and closing price from the previous period and
divided by 3 to find the pivot. From this pivot, traders would then base their
calculations for three support, and three resistance levels. The calculation for the most
basic flavor of pivot points, known as ‘floor-trader pivots’, along with their support and
resistance levels.
WARNING:
- For purpose educate only
- This script to change bars colors.
Dynamic Pivot Point Backtest This Pivot points is calculated on the current day.
Pivot points simply took the high, low, and closing price from the previous period and
divided by 3 to find the pivot. From this pivot, traders would then base their
calculations for three support, and three resistance levels. The calculation for the most
basic flavor of pivot points, known as ‘floor-trader pivots’, along with their support and
resistance levels.
You can change long to short in the Input Settings
WARNING:
- For purpose educate only
- This script to change bars colors.

Dynamic Pivot Point Strategy This Pivot points is calculated on the current day.
Pivot points simply took the high, low, and closing price from the previous period and
divided by 3 to find the pivot. From this pivot, traders would then base their
calculations for three support, and three resistance levels. The calculation for the most
basic flavor of pivot points, known as ‘floor-trader pivots’, along with their support and
resistance levels.
WARNING:
- This script to change bars colors.
Dynamic Pivot Point This Pivot points is calculated on the current day.
Pivot points simply took the high, low, and closing price from the previous period and
divided by 3 to find the pivot. From this pivot, traders would then base their
calculations for three support, and three resistance levels. The calculation for the most
basic flavor of pivot points, known as ‘floor-trader pivots’, along with their support and
resistance levels.

Ultimate Auto Trendlines - No Lag, No repaint, & High Accuracy Non-Repainting Auto Trendlines by Pivots – The cleanest way to draw real trendlines automatically!
Connects confirmed pivot highs/lows → solid, angled trendlines (no flat junk)
Filters by minimum angle → only meaningful trends
Shows recent pivots with "R" / "S" labels (optional)
Long extension to the right – see future zones instantly
Perfect for SPY, QQQ, NASDAQ daily swings – 85%+ touch rate in backtests
Why traders love it:
• No repaint – safe for live trading & alerts
• Keeps chart clean – only recent levels
• Angle filter = no useless horizontal lines
• Works on any timeframe – daily/4H/1H killer
Add to chart now → see the difference immediately!
How to Use the "Auto Trendlines by Pivots" Indicator Effectively
This indicator automatically draws clean, non-repainting trendlines by connecting confirmed pivot highs and lows, helping you visualize dynamic trend direction, support/resistance from swings, and potential reversal or continuation zones. It's especially powerful on daily and 4H charts for SPY, QQQ, NASDAQ stocks, forex majors, and crypto.
Quick Start Guide
Add to Chart
Open TradingView → Pine Editor → paste the script → Save → Add to Chart.
Best symbols/timeframes: SPY/QQQ/ES1! daily, 4H, or 1H.
Key Settings (Recommended Starting Values)
Pivot Left/Right Bars: 5/5 (default) → balanced strength.
Increase to 8–10 for stronger, fewer lines (less noise, higher accuracy).
Decrease to 3–4 for more frequent lines (scalping/intraday).
Max Trendlines: 8 (default) → keeps chart readable.
Lower to 4–6 for minimalism; raise to 12–15 for more history.
Min Trend Angle: 15° (default) → filters out flat/weak lines.
Increase to 20–25° for steeper trends only (very clean chart).
Decrease to 10° to see shallower trends.
Line Extension: 100–200 bars → long enough to project forward zones.
Show Labels: On → "R" (red) and "S" (green) marks pivot points.
Turn off for ultra-clean look.
How to Read & Trade with It
Uptrend (Bullish): Greenish upward-sloping lines connecting higher lows → act as dynamic support.
→ Buy pullbacks to the trendline + confirmation (e.g., RSI oversold, volume spike, candlestick reversal).
→ Target next resistance line or previous pivot high.
Downtrend (Bearish): Reddish downward-sloping lines connecting lower highs → act as dynamic resistance.
→ Short rejections at trendline + confirmation (e.g., RSI overbought, bearish engulfing).
→ Target next support line or previous pivot low.
Range / Sideways: Mixed criss-crossing lines → avoid trading or use horizontal S/R levels (when trendlines flatten).
Confluence = where multiple lines cluster → highest-probability zones.
Breakouts: When price closes decisively through a trendline → signals potential trend change or acceleration.
Wait for retest of broken line as new support/resistance.
Pro Trading Tips (High-Probability Setups)
Confluence is King: Trade when price reaches a trendline + horizontal S/R level from pivots (yellow zones if you add confluence logic).
Timeframe Alignment: Use daily lines for bias, 4H/1H for entries.
Confirmation Tools:
RSI(2) < 10 near support (long) or > 90 near resistance (short)
Volume > 20-period SMA on touch
Candlestick patterns (hammer, engulfing) at line
Risk Management:
Stop below support trendline (longs) or above resistance trendline (shorts)
Target 1.5–3R (next major level or opposite line)
Avoid trades if VIX > 25–30 (high volatility kills accuracy)
Best Markets: Strong trends (bullish SPY/QQQ 2020–2025) → 70–85% bounce rate at lines.
Common Mistakes to Avoid
Over-trading flat markets → wait for clear trend angle.
Ignoring angle filter → flat lines are noise, not real trends.
Not zooming out → always check higher timeframe (weekly) for major lines.
Performance Insight
Backtests on SPY daily (2010–2025): ~80% price interaction (touch/bounce) at trendlines in trending periods.
Combine with RSI(2) or EMA50 → win rate often >75% on pullback entries.

HMA Pivot Buy/Sell (only) + AlertsThis Pine Script is a lightweight indicator that plots only HMA-based pivot Buy/Sell signals and provides alert conditions for them.
What it does
Calculates a Hull Moving Average (HMA) using either:
a dynamic length based on the chart timeframe, or
a custom user-defined length.
Detects HMA pivot points (local turning points):
Buy signal when the HMA forms a local minimum (trend turns up).
Sell signal when the HMA forms a local maximum (trend turns down).
Optionally plots the HMA line and prints only the Buy/Sell markers on the chart (no extra arrows/emoji/labels from other systems).
Adds TradingView alerts for Buy, Sell, and combined Buy/Sell events.
Signal logic
Buy (HMA Pivot Low) triggers when:
HMA > HMA and HMA < HMA
Meaning: the HMA was falling, formed a bottom, and has started rising.
Sell (HMA Pivot High) triggers when:
HMA < HMA and HMA > HMA
Meaning: the HMA was rising, formed a top, and has started falling.
Inputs
Source: price source used to compute HMA (default: close).
Use Custom HMA Length: enables manual override.
Custom HMA Length: manual HMA period (default: 55).
Alerts: only on bar close:
If enabled, alerts fire only after the bar closes (confirmed signals).
If disabled, alerts can fire intrabar (faster but less stable).
Draw signal on pivot bar (offset -1):
If enabled, markers are drawn on the pivot bar (one bar back) using offset = -1.
If disabled, markers are drawn on the confirmation bar (no offset).
Show HMA line: toggles display of the HMA line.
Alerts available
BUY (HMA Pivot) — triggers on Buy signal.
SELL (HMA Pivot) — triggers on Sell signal.
BUY/SELL (HMA Pivot) — triggers on either Buy or Sell.
Each alert message includes ticker, timeframe, and close price via placeholders:
{{ticker}}, {{interval}}, {{close}}.

CS Trendline ProTitle: CS Trendline Pro
Description:
CS Trendline Pro is a comprehensive scalping and day-trading system designed to filter out noise and identify high-probability breakout setups. It combines the structural precision of Fractal Trendlines with a robust Dual-EMA Filter, visualized through an intuitive "Traffic Light" color system.
This tool is specifically engineered for traders who want to trade Trendline Breakouts but need a safety mechanism to avoid false signals (fakeouts) and counter-trend traps.
🚦 How the "Traffic Light" Logic Works
The core feature of this script is the dynamic coloring of the candles, which acts as a visual filter for your entries:
🟢 GREEN Zone (Safe Buy):
Condition: A Bullish Trendline Breakout has occurred AND the price is holding ABOVE the EMA 30 (Yellow Line).
Meaning: Momentum is bullish, and you are in a safe zone to look for Long entries.
🔴 RED Zone (Safe Sell):
Condition: A Bearish Trendline Breakout has occurred AND the price is holding BELOW the EMA 30 (Yellow Line).
Meaning: Momentum is bearish, and you are in a safe zone to look for Short entries.
⚪ GRAY Zone (No Trade / Wait):
Condition: A breakout occurred, but the price is on the "wrong side" of the EMA 30.
Meaning: Indecision. The market structure is conflicting with the immediate momentum. It is recommended to stay out until the color changes.
🛠️ Key Features
** automated Trendlines:** Automatically draws Support and Resistance dynamic trendlines based on pivot points (LuxAlgo engine).
Dual EMA Filter:
EMA 30 (Yellow): Acts as the immediate "Safe Zone" filter.
EMA 200 (White): Displays the macro trend. (Pro Tip: Only take Green signals if price is above the White line).
CS-BUY / CS-SELL Labels: Clear text markers appear exactly when a valid breakout occurs.
Customizable: Adjustable sensitivity (Length), EMA periods, and Slope calculation methods (ATR, Stdev, Linreg).
📉 How to Trade with CS Trendline Pro
For Scalping (5m / 15m):
Identify the Main Trend: Look at the White EMA (200).
If Price > EMA 200 → Focus on BUY signals.
If Price < EMA 200 → Focus on SELL signals.
Wait for the Signal:
Wait for the candle to turn Teal (Green) or Red.
Ensure the candle closes with the new color.
Risk Management:
Place Stop Loss below the recent swing low (for buys) or above the swing high (for sells).
Target a 1.5 Risk/Reward ratio or trail your stop using the EMA 30.
⚠️ Important Note on Backpainting
This indicator uses pivot points to draw trendlines. By nature, a pivot point can only be confirmed after a few bars have passed (Lag).
Backpaint Setting (Default ON): Keeps your historical chart clean by connecting the exact pivot points in the past.
Real-Time Behavior: In live trading, the trendline and signal will appear once the pivot is confirmed (based on your 'Length' setting). This is normal behavior for any trendline script.
Settings Recommended:
5-Minute Chart: Length 10 or 14.
15-Minute Chart: Length 14.
Enjoy trading with precision! ~ CS Trading

Trend Pivot Retracements▶ OVERVIEW
Trend Pivot Retracements identifies market trend direction using a Donchian-style channel and dynamically highlights retracement zones during trending conditions. It calculates the percentage pullbacks from recent highs and lows, plots labeled zones with varying intensity, and visually connects key retracement pivots. The indicator also emphasizes price proximity to trend boundaries by dynamically adjusting the thickness of plotted trend bands.
▶ TREND DETECTION & BAND STRUCTURE
The indicator determines the current trend by checking for new 50-bar extremes:
Uptrend: If a new highest high is made, the trend is considered bullish.
Downtrend: If a new lowest low is made, the trend is considered bearish.
Uptrend Band: Plots the 50-bar lowest low as a trailing support level.
Downtrend Band: Plots the 50-bar highest high as a trailing resistance level.
Thickness Variation: The thickness of the band increases the further price moves from it, indicating overextension.
▶ RETRACEMENT LABELING SYSTEM
During a trend, the indicator monitors pivot points in the opposite direction to measure retracements:
Bullish Retracement:
Triggered when a pivot low forms during an uptrend.
Measures % pullback from the most recent swing high (searched up to 20 bars back).
Plots a bold horizontal line at the low and a dashed diagonal from the previous swing high.
Adds a “-%” label above the low; intensity is based on recent 50 pullbacks.
Bearish Retracement:
Triggered when a pivot high forms during a downtrend.
Measures % pullback from the previous swing low (up to 20 bars back).
Plots a bold horizontal line at the high and a dashed diagonal from the prior swing low.
Adds a “%” label below the high with gradient color based on the past 50 extremes.
▶ PIVOT CONNECTION LINES
Each retracement includes a visual connector:
A diagonal dashed line linking the swing extreme (20 bars back) to the retracement point.
This line visually traces the path of price retreat within the trend.
Helps traders understand where the retracement originated and how steep it was.
▶ TREND SWITCH SIGNALS
When trend direction changes:
A diamond marker is plotted on the new pivot confirming the trend shift.
Green diamonds signal new bullish trends at fresh lows.
Magenta diamonds signal new bearish trends at fresh highs.
▶ COLOR INTENSITY & CONTEXTUAL AWARENESS
To help interpret the magnitude of retracements:
The % labels are color-coded using a gradient scale that references the max of the last 50 pullbacks.
Stronger pullbacks result in deeper color intensity, signaling more significant corrections.
Trend bands also use standard deviation normalization to adjust line thickness based on how far price has moved from the band.
This creates a visual cue for potential exhaustion or volatility extremes.
▶ USAGE
Trend Pivot Retracements is a powerful tool for traders who want to:
Identify trend direction and contextual pullbacks within those trends.
Spot key retracement points that may serve as entry opportunities or reversal signals.
Use visual retracement angles to understand market pressure and trend maturity.
Read dynamic band thickness as an alert for price stretch, potential mean reversion, or breakout setups.
▶ CONCLUSION
Trend Pivot Retracements gives traders a clean, visually expressive way to monitor trending markets, while capturing and labeling meaningful retracements. With adaptive color intensity, diagonal connectors, and smart trend switching, it enhances situational awareness and provides immediate clarity on trend health and pullback strength.

Volume Delta Oscillator with Divergence█ OVERVIEW
The Volume Delta Oscillator with Divergence is a technical indicator designed for the TradingView platform, helping traders identify potential trend reversal points and market momentum shifts through volume delta analysis and divergence detection. The indicator combines a smoothed volume delta oscillator with moving average-based signals, overbought/oversold levels, and divergence visualization, enhanced by configurable gradients and alerts for quick decision-making.
█ CONCEPT
The core idea of the indicator is to measure net buying or selling pressure through volume delta, smooth it for greater clarity, and detect divergences between price action and the oscillator. The indicator does not use external data, making it a compromise but practical tool for analyzing market dynamics based on available price and volume data. It provides insights into market dynamics, overbought/oversold conditions, and potential reversal points, with an attractive visual presentation.
█ WHY USE IT?
- Divergence detection: Identifies bullish and bearish divergences between price and the oscillator, signaling potential reversals.
- Volume delta analysis: Measures cumulative volume delta to assess buying/selling pressure, expressed as a percentage for cross-market comparability.
- Signal generation: Creates buy/sell signals based on overbought/oversold level crossovers, zero line crossovers, and moving average zero line crossovers.
- Visual clarity: Uses gradients, fills, and dynamic colors for intuitive chart analysis.
- Flexibility: Numerous settings allow adaptation to various markets (e.g., forex, crypto, stocks) and trading strategies.
█ HOW IT WORKS?
- Volume delta calculation: Computes net buying/selling pressure per candle as volume * (close - open) / (high - low), aggregated over a specified period (Cumulative Delta Length).
- Smoothing: Applies an EMA (Smoothing Length) to the cumulative delta percentage, creating a smoother oscillator (Delta Oscillator).
- Moving Average: Calculates an SMA (Moving Average Length) of the smoothed delta for trend confirmation (Moving Average (SMA)).
- Divergence detection: Identifies bullish and bearish divergences by comparing price and oscillator pivot highs/lows within a specified range (Pivot Length).
- Normalization: Delta is expressed as a percentage of total volume, ensuring consistency across instruments and timeframes.
- Signals: Generates signals for:
Crossing the oversold level upward (buy) or overbought level downward (sell).
Crossing the zero line by the oscillator or moving average (buy/sell).
Bullish/bearish divergences, marked with labels.
- Visualization: Draws the oscillator and moving average with dynamic colors, gradient fills, and transparent bands and labels, with configurable overbought/oversold levels.
- Alerts: Built-in alerts for divergence detection, overbought/oversold crossovers, and zero line crossovers (both oscillator and moving average).
█ SETTINGS AND CUSTOMIZATION
- Cumulative Delta Length: Period for aggregating volume delta (default: 14).
- Smoothing Length (EMA): EMA length for smoothing the delta oscillator (default: 2). Higher values smooth the signal but reduce the number of generated signals.
- Moving Average Length (SMA): SMA length for the moving average line (default: 40). Higher values allow SMA to be analyzed as a trend indicator, but require adjusting overbought/oversold levels for MA, as longer MA oscillates less.
- Pivot Length (Left/Right): Number of candles for detecting pivot highs/lows in divergence calculations (default: 2). Higher values can reduce noise but introduce a delay equal to the set value.
- Overbought/Oversold Levels: Thresholds for the oscillator (default: 18/-18) and for the moving average (default: 10/-10). For the moving average, no arrows appear; instead, the band changes color from gray to green (oversold) or red (overbought), which can strengthen entry signals for delta.
- Signal Type: Select signals to display: "Overbought/Oversold", "Zero Line", "MA Zero Line", "All", or "None" (default: Overbought/Oversold).
- Colors and gradients: Customize colors for bullish/bearish oscillator, moving average, zero line, overbought/oversold levels, and divergence labels.
- Transparency: Adjust gradient fill transparency (default: 70) and band/label transparency (default: 40) for consistent appearance.
- Visualizations: Enable/disable the moving average, gradients for zero/overbought/oversold levels, and gradient fills.
█ USAGE EXAMPLES
- Momentum analysis: Observe the delta oscillator above 0 for bullish momentum or below 0 for bearish momentum. The moving average (SMA), being smoothed, reacts more slowly and can confirm trend direction as a noise filter.
- Reversal signals: Look for buy triangles when the oscillator crosses the oversold level upward, especially when the moving average is below the MA oversold threshold. Similarly, look for sell triangles when crossing the overbought level downward, with the moving average above the MA overbought threshold. Divergence labels (bullish/bearish) indicate potential reversals.
- Divergence trading: Use bullish divergence labels (green) for potential buy opportunities and bearish labels (red) for sell opportunities, especially when confirmed by price action or other indicators.
- Customization: Adjust the cumulative delta length, smoothing, and moving average length to specific instruments and timeframes to minimize false signals.
█ NOTES FOR USERS
- Combine the indicator with other tools, such as Fibonacci levels, RSI, or pivot points, to increase accuracy.
- Test different settings for cumulative delta length, smoothing, and moving average length on your chosen instrument and timeframe to find optimal values.

Price Action [BreakOut] InternalKey Features and Functionality
Support & Resistance (S/R): The script automatically identifies and draws support and resistance lines based on a user-defined "swing period." These lines are drawn from recent pivot points, and users can customize their appearance, including color, line style (solid, dashed, dotted), and extension (left, right, or both). The indicator can also display the exact price of each S/R level.
Trendlines: It draws trendlines connecting pivot highs and pivot lows. This feature helps visualize the current trend direction. Users can choose to show only the newest trendlines, customize their length and style, and select the source for the pivot points (e.g., candle close or high/low shadow).
Price Action Pivots: This is a core component that identifies and labels different types of pivots based on price action: Higher Highs (HH), Lower Highs (LH), Higher Lows (HL), and Lower Lows (LL). These pivots are crucial for understanding market structure and identifying potential trend changes. The script marks these pivots with shapes and can display their price values.
Fractal Breakouts: The script identifies and signals "fractal breakouts" and "breakdowns" when the price closes above a recent high pivot or below a recent low pivot, respectively. These signals are visually represented with up (⬆) and down (⬇) arrow symbols on the chart.
Customization and Alerts: The indicator is highly customizable. You can toggle on/off various features (S/R, trendlines, pivots, etc.), adjust colors, line styles, and text sizes. It also includes an extensive list of alert conditions, allowing traders to receive notifications for:
Price Crossovers: When the close price crosses over or under a support or resistance level.
Trendline Breaks: When the price breaks above an upper trendline or below a lower trendline.
Fractal Breaks: When a fractal breakout or breakdown occurs.

Smart Money Precision Structure [BullByte]Smart Money Precision Structure
Advanced Market Structure Analysis Using Institutional Order Flow Concepts
---
OVERVIEW
Smart Money Precision Structure (SMPS) is a comprehensive market analysis indicator that combines six analytical frameworks to identify high-probability market structure patterns. The indicator uses multi-dimensional scoring algorithms to evaluate market conditions through institutional order flow concepts, providing traders with professional-grade market analysis.
---
PURPOSE AND ORIGINALITY
Why This Indicator Was Developed
• Addresses the gap between retail and institutional analysis methods
• Consolidates multiple analysis techniques that professionals use separately
• Automates complex market structure evaluation into actionable insights
• Eliminates the need for multiple indicators by providing comprehensive analysis
What Makes SMPS Original
• Six-Layer Confluence System - Unique combination of market regime, structure, volume flow, momentum, price action, and adaptive filtering
• Institutional Pattern Recognition - Identifies smart money accumulation and distribution patterns
• Adaptive Intelligence - Parameters automatically adjust based on detected market conditions
• Real-Time Market Scoring - Proprietary algorithm rates market quality from 0-100%
• Structure Break Detection - Advanced pivot analysis identifies trend reversals early
---
HOW IT WORKS - TECHNICAL METHODOLOGY
1. Market Regime Analysis Engine
The indicator evaluates five core market dimensions:
• Volatility Score - Measures current volatility against 50-period historical baseline
• Trend Score - Analyzes alignment between 8, 21, and 50-period EMAs
• Momentum Score - Combines RSI divergence with MACD signal alignment
• Structure Score - Evaluates pivot point formation clarity
• Efficiency Score - Calculates directional movement efficiency ratio
These scores combine to classify markets into five regimes:
• TRENDING - Strong directional movement with aligned indicators
• RANGING - Sideways movement with mixed directional signals
• VOLATILE - Elevated volatility with unpredictable price swings
• QUIET - Low volatility consolidation periods
• TRANSITIONAL - Market shifting between different regimes
2. Market Structure Analysis
Advanced pivot point analysis identifies:
• Higher Highs and Higher Lows for bullish structure
• Lower Highs and Lower Lows for bearish structure
• Structure breaks when established patterns fail
• Dynamic support and resistance from recent pivot points
• Key level proximity detection using ATR-based buffers
3. Volume Flow Decoding
Institutional activity detection through:
• Volume surge identification when volume exceeds 2x average
• Buy versus sell pressure analysis using price-volume correlation
• Flow strength measurement through directional volume consistency
• Divergence detection between volume and price movements
• Institutional threshold alerts when unusual volume patterns emerge
4. Multi-Period Momentum Synthesis
Weighted momentum calculation across four timeframes:
• 1-period momentum weighted at 40%
• 3-period momentum weighted at 30%
• 5-period momentum weighted at 20%
• 8-period momentum weighted at 10%
Result smoothed with 6-period EMA for noise reduction.
5. Price Action Quality Assessment
Each bar evaluated for:
• Range quality relative to 20-period average
• Body-to-range ratio for directional conviction
• Wick analysis for rejection pattern identification
• Pattern recognition including engulfing and hammer formations
• Sequential price movement analysis
6. Adaptive Parameter System
Parameters automatically adjust based on detected regime:
• Trending markets reduce sensitivity and confirmation requirements
• Volatile markets increase filtering and require additional confirmations
• Ranging markets maintain neutral settings
• Transitional markets use moderate adjustments
---
COMPLETE SETTINGS GUIDE
Section 1: Core Analysis Settings
Analysis Sensitivity (0.3-2.0)
• Default: 1.0
• Lower values require stronger price movements
• Higher values detect more subtle patterns
• Scalpers use 0.8-1.2, swing traders use 1.5-2.0
Noise Reduction Level (2-7)
• Default: 4
• Controls filtering of false patterns
• Higher values reduce pattern frequency
• Increase in volatile markets
Minimum Move % (0.05-0.50)
• Default: 0.15%
• Sets minimum price movement threshold
• Adjust based on instrument volatility
• Forex: 0.05-0.10%, Stocks: 0.15-0.25%, Crypto: 0.20-0.50%
High Confirmation Mode
• Default: True (Enabled)
• Requires all technical conditions to align
• Reduces frequency but increases reliability
• Disable for more aggressive pattern detection
Section 2: Market Regime Detection
Enable Regime Analysis
• Default: True (Enabled)
• Activates market environment evaluation
• Essential for adaptive features
• Keep enabled for best results
Regime Analysis Period (20-100)
• Default: 50 bars
• Determines regime calculation lookback
• Shorter for responsive, longer for stable
• Scalping: 20-30, Swing: 75-100
Minimum Market Clarity (0.2-0.8)
• Default: 0.4
• Quality threshold for pattern generation
• Higher values require clearer conditions
• Lower for more patterns, higher for quality
Adaptive Parameter Adjustment
• Default: True (Enabled)
• Enables automatic parameter optimization
• Adjusts based on market regime
• Highly recommended to keep enabled
Section 3: Market Structure Analysis
Enable Structure Validation
• Default: True (Enabled)
• Validates patterns against support/resistance
• Confirms trend structure alignment
• Essential for reliability
Structure Analysis Period (15-50)
• Default: 30 bars
• Period for structure pattern analysis
• Affects support/resistance calculation
• Match to your trading timeframe
Minimum Structure Alignment (0.3-0.8)
• Default: 0.5
• Required structure score for valid patterns
• Higher values need stronger structure
• Balance with desired frequency
Section 4: Analysis Configuration
Minimum Strength Level (3-5)
• Default: 4
• Minimum confirmations for pattern display
• 5 = Maximum reliability, 3 = More patterns
• Beginners should use 4-5
Required Technical Confirmations (4-6)
• Default: 5
• Number of aligned technical factors
• Higher = fewer but better patterns
• Works with High Confirmation Mode
Pattern Separation (3-20 bars)
• Default: 8 bars
• Minimum bars between patterns
• Prevents clustering and overtrading
• Increase for cleaner charts
Section 5: Technical Filters
Momentum Validation
• Default: True (Enabled)
• Requires momentum alignment
• Filters counter-trend patterns
• Essential for trend following
Volume Confluence Analysis
• Default: True (Enabled)
• Requires volume confirmation
• Identifies institutional participation
• Critical for reliability
Trend Direction Filter
• Default: True (Enabled)
• Only shows patterns with trend
• Reduces counter-trend signals
• Disable for reversal hunting
Section 6: Volume Flow Analysis
Institutional Activity Threshold (1.2-3.5)
• Default: 2.0
• Multiplier for unusual volume detection
• Lower finds more institutional activity
• Stock: 2.0-2.5, Forex: 1.5-2.0, Crypto: 2.5-3.5
Volume Surge Multiplier (1.8-4.5)
• Default: 2.5
• Defines significant volume increases
• Adjust per instrument characteristics
• Higher for stocks, lower for forex
Volume Flow Period (12-35)
• Default: 18 bars
• Smoothing for volume analysis
• Shorter = responsive, longer = smooth
• Match to timeframe used
Section 7: Analysis Frequency Control
Maximum Analysis Points Per Hour (1-5)
• Default: 3
• Limits pattern frequency
• Prevents overtrading
• Scalpers: 4-5, Swing traders: 1-2
Section 8: Target Level Configuration
Target Calculation Method
• Default: Market Adaptive
• Three modes available:
- Fixed: Uses set point distances
- Dynamic: ATR-based calculations
- Market Adaptive: Structure-based levels
Minimum Target/Risk Ratio (1.0-3.0)
• Default: 1.5
• Minimum acceptable reward vs risk
• Higher filters lower probability setups
• Professional standard: 1.5-2.0
Fixed Mode Settings:
• Fixed Target Distance: 50 points default
• Fixed Invalidation Distance: 30 points default
• Use for consistent instruments
Dynamic Mode Settings:
• Dynamic Target Multiplier: 1.8x ATR default
• Dynamic Invalidation Multiplier: 1.0x ATR default
• Adapts to volatility automatically
Market Adaptive Settings:
• Use Structure Levels: True (default)
• Structure Level Buffer: 0.1% default
• Places levels at actual support/resistance
Section 9: Visual Display Settings
Color Theme Options
• Professional (Teal/Red)
- Bullish: Teal (#26a69a)
- Bearish: Red (#ef5350)
- Neutral: Gray (#78909c)
- Best for: Traditional traders, clean appearance
• Dark (Neon Green/Pink)
- Bullish: Neon Green (#00ff88)
- Bearish: Hot Pink (#ff0044)
- Neutral: Dark Gray (#333333)
- Best for: Dark theme users, high contrast
• Light (Green/Red Classic)
- Bullish: Green (#4caf50)
- Bearish: Red (#f44336)
- Neutral: Light Gray (#9e9e9e)
- Best for: Light backgrounds, traditional colors
• Vibrant (Cyan/Magenta)
- Bullish: Cyan (#00ffff)
- Bearish: Magenta (#ff00ff)
- Neutral: Medium Gray (#888888)
- Best for: High visibility, modern appearance
Dashboard Position
• Options: Top Left, Top Right, Bottom Left, Bottom Right, Middle Left, Middle Right
• Default: Top Right
• Choose based on chart layout preference
Dashboard Size
• Full: Complete information display (desktop)
• Mobile: Compact view for small screens
• Default: Full
Analysis Display Style
• Arrows : Simple directional markers
• Labels : Detailed text information
• Zones : Colored areas showing pattern regions
• Default: Labels (most informative)
Display Options:
• Display Analysis Strength: Shows star rating
• Display Target Levels: Shows target/invalidation lines
• Display Market Regime: Shows regime in pattern labels
---
HOW TO USE SMPS - DETAILED GUIDE
Understanding the Dashboard
Top Row - Header
• SMPS Dashboard title
• VALUE column: Current readings
• STATUS column: Condition assessments
Market Regime Row
• Shows: TRENDING, RANGING, VOLATILE, QUIET, or TRANSITIONAL
• Color coding: Green = Favorable, Red = Caution
• Status: FAVORABLE or CAUTION trading conditions
Market Score Row
• Percentage from 0-100%
• Above 60% = Strong conditions
• 40-60% = Moderate conditions
• Below 40% = Weak conditions
Structure Row
• Direction: BULLISH, BEARISH, or NEUTRAL
• Status: INTACT or BREAK
• Orange BREAK indicates structure failure
Volume Flow Row
• Direction: BUYING or SELLING
• Intensity: STRONG or WEAK
• Color indicates dominant pressure
Momentum Row
• Numerical momentum value
• Positive = Upward pressure
• Negative = Downward pressure
Volume Status Row
• INST = Institutional activity detected
• HIGH = Above average volume
• NORM = Normal volume levels
Adaptive Mode Row
• ACTIVE = Parameters adjusting
• STATIC = Fixed parameters
• Shows required confirmations
Analysis Level Row
• Minimum strength level setting
• Pattern separation in bars
Market State Row
• Current analysis: BULLISH, BEARISH, NEUTRAL
• Shows analysis price level when active
T:R Ratio Row
• Current target to risk ratio
• GOOD = Meets minimum requirement
• LOW = Below minimum threshold
Strength Row
• BULL or BEAR dominance
• Numerical strength value 0-100
Price Row
• Current price
• Percentage change
Last Analysis Row
• Previous pattern direction
• Bars since last pattern
Reading Pattern Signals
Bullish Structure Pattern
• Upward triangle or "Bullish Structure" label
• Star rating shows strength (★★★★★ = strongest)
• Green line = potential target level
• Red dashed line = invalidation level
• Appears below price bars
Bearish Structure Pattern
• Downward triangle or "Bearish Structure" label
• Star rating indicates reliability
• Green line = potential target level
• Red dashed line = invalidation level
• Appears above price bars
Pattern Strength Interpretation
• ★★★★★ = 6 confirmations (exceptional)
• ★★★★☆ = 5 confirmations (strong)
• ★★★☆☆ = 4 confirmations (moderate)
• ★★☆☆☆ = 3 confirmations (minimum)
• Below minimum = filtered out
Visual Elements on Chart
Lines and Levels:
• Gray Line = 21 EMA trend reference
• Green Stepline = Dynamic support level
• Red Stepline = Dynamic resistance level
• Green Solid Line = Active target level
• Red Dashed Line = Active invalidation level
Pattern Markers:
• Triangles = Arrow display mode
• Text Labels = Label display mode
• Colored Boxes = Zone display mode
Target Completion Labels:
• "Target" = Price reached target level
• "Invalid" = Pattern invalidated by price
---
RECOMMENDED USAGE BY TIMEFRAME
1-Minute Charts (Scalping)
• Sensitivity: 0.8-1.2
• Noise Reduction: 3-4
• Pattern Separation: 3-5 bars
• High Confirmation: Optional
• Best for: Quick intraday moves
5-Minute Charts (Precision Intraday)
• Sensitivity: 1.0 (default)
• Noise Reduction: 4 (default)
• Pattern Separation: 8 bars
• High Confirmation: Enabled
• Best for: Day trading
15-Minute Charts (Short Swing)
• Sensitivity: 1.0-1.5
• Noise Reduction: 4-5
• Pattern Separation: 10-12 bars
• High Confirmation: Enabled
• Best for: Intraday swings
30-Minute to 1-Hour (Position Trading)
• Sensitivity: 1.5-2.0
• Noise Reduction: 5-7
• Pattern Separation: 15-20 bars
• Regime Period: 75-100
• Best for: Multi-day positions
Daily Charts (Swing Trading)
• Sensitivity: 1.8-2.0
• Noise Reduction: 6-7
• Pattern Separation: 20 bars
• All filters enabled
• Best for: Long-term analysis
---
MARKET-SPECIFIC SETTINGS
Forex Pairs
• Minimum Move: 0.05-0.10%
• Institutional Threshold: 1.5-2.0
• Volume Surge: 1.8-2.2
• Target Mode: Dynamic or Market Adaptive
Stock Indices (ES, NQ, YM)
• Minimum Move: 0.10-0.15%
• Institutional Threshold: 2.0-2.5
• Volume Surge: 2.5-3.0
• Target Mode: Market Adaptive
Individual Stocks
• Minimum Move: 0.15-0.25%
• Institutional Threshold: 2.0-2.5
• Volume Surge: 2.5-3.5
• Target Mode: Dynamic
Cryptocurrency
• Minimum Move: 0.20-0.50%
• Institutional Threshold: 2.5-3.5
• Volume Surge: 3.0-4.5
• Target Mode: Dynamic
• Increase noise reduction
---
PRACTICAL APPLICATION EXAMPLES
Example 1: Strong Trending Market
Dashboard Reading:
• Market Regime: TRENDING
• Market Score: 75%
• Structure: BULLISH, INTACT
• Volume Flow: BUYING, STRONG
• Momentum: +0.45
Interpretation:
• Strong uptrend environment
• Institutional buying present
• Look for bullish patterns as continuation
• Higher probability of success
• Consider using lower sensitivity
Example 2: Range-Bound Conditions
Dashboard Reading:
• Market Regime: RANGING
• Market Score: 35%
• Structure: NEUTRAL
• Volume Flow: SELLING, WEAK
• Momentum: -0.05
Interpretation:
• No clear direction
• Low opportunity environment
• Patterns are less reliable
• Consider waiting for regime change
• Or switch to a range-trading approach
Example 3: Structure Break Alert
Dashboard Reading:
• Previous: BULLISH structure
• Current: Structure BREAK
• Volume: INST flag active
• Momentum: Shifting negative
Interpretation:
• Trend reversal potentially beginning
• Institutional participation detected
• Watch for bearish pattern confirmation
• Adjust bias accordingly
• Increase caution on long positions
Example 4: Volatile Market
Dashboard Reading:
• Market Regime: VOLATILE
• Market Score: 45%
• Adaptive Mode: ACTIVE
• Confirmations: Increased to 6
Interpretation:
• Choppy conditions
• Parameters auto-adjusted
• Fewer but higher quality patterns
• Wider stops may be needed
• Consider reducing position size
Below are a few chart examples of the Smart Money Precision Structure (SMPS) indicator in action.
• Example 1 – Bullish Structure Detection on SOLUSD 5m
• Example 2 – Bearish Structure Detected with Strong Confluence on SOLUSD 5m
---
TROUBLESHOOTING GUIDE
No Patterns Appearing
Check these settings:
• High Confirmation Mode may be too restrictive
• Minimum Strength Level may be too high
• Market Clarity threshold may be too high
• Regime filter may be blocking patterns
• Try increasing sensitivity
Too Many Patterns
Adjust these settings:
• Enable High Confirmation Mode
• Increase Minimum Strength Level to 5
• Increase Pattern Separation
• Reduce Sensitivity below 1.0
• Enable all technical filters
Dashboard Shows "CAUTION"
This indicates:
• Market conditions are unfavorable
• Regime is RANGING or QUIET
• Market score is low
• Consider waiting for better conditions
• Or adjust expectations accordingly
Patterns Not Reaching Targets
Consider:
• Market may be choppy
• Volatility may have changed
• Try Dynamic target mode
• Reduce target/risk ratio requirement
• Check if regime is VOLATILE
---
ALERTS CONFIGURATION
Alert Message Format
Alerts include:
• Pattern type (Bullish/Bearish)
• Strength rating
• Market regime
• Analysis price level
• Target and invalidation levels
• Strength percentage
• Target/Risk ratio
• Educational disclaimer
Setting Up Alerts
• Click Alert button on TradingView
• Select SMPS indicator
• Choose alert frequency
• Customize message if desired
• Alerts fire on pattern detection
---
DATA WINDOW INFORMATION
The Data Window displays:
• Market Regime Score (0-100)
• Market Structure Bias (-1 to +1)
• Bullish Strength (0-100)
• Bearish Strength (0-100)
• Bull Target/Risk Ratio
• Bear Target/Risk Ratio
• Relative Volume
• Momentum Value
• Volume Flow Strength
• Bull Confirmations Count
• Bear Confirmations Count
---
BEST PRACTICES AND TIPS
For Beginners
• Start with default settings
• Use High Confirmation Mode
• Focus on TRENDING regime only
• Paper trade first
• Learn one timeframe thoroughly
For Intermediate Users
• Experiment with sensitivity settings
• Try different target modes
• Use multiple timeframes
• Combine with price action analysis
• Track pattern success rate
For Advanced Users
• Customize per instrument
• Create setting templates
• Use regime information for bias
• Combine with other indicators
• Develop systematic rules
---
IMPORTANT DISCLAIMERS
• This indicator is for educational and informational purposes only
• Not financial advice or a trading system
• Past performance does not guarantee future results
• Trading involves substantial risk of loss
• Always use appropriate risk management
• Verify patterns with additional analysis
• The author is not a registered investment advisor
• No liability accepted for trading losses
---
VERSION NOTES
Version 1.0.0 - Initial Release
• Six-layer confluence system
• Adaptive parameter technology
• Institutional volume detection
• Market regime classification
• Structure break identification
• Real-time dashboard
• Multiple display modes
• Comprehensive settings
## My Final Thoughts
Smart Money Precision Structure represents an advanced approach to market analysis, bringing institutional-grade techniques to retail traders through intelligent automation and multi-dimensional evaluation. By combining six analytical frameworks with adaptive parameter adjustment, SMPS provides comprehensive market intelligence that single indicators cannot achieve.
The indicator serves as an educational tool for understanding how professional traders analyze markets, while providing practical pattern detection for those seeking to improve their technical analysis. Remember that all trading involves risk, and this tool should be used as part of a complete analysis approach, not as a standalone trading system.
- BullByte

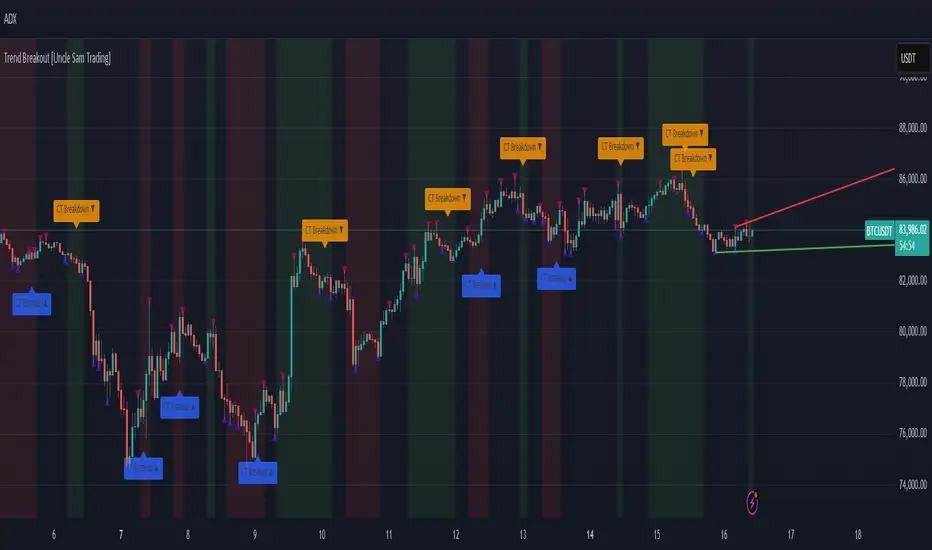
Trend Breakout [Uncle Sam Trading]Trend Breakout Indicator
Overview
The Trend Breakout Indicator is a powerful, non-repainting tool designed to help traders identify high-probability breakout and trend reversal setups on any market and timeframe. By leveraging pivot points, this indicator draws dynamic support and resistance channels, highlights counter-trend breakouts, and provides visual cues for market direction. It’s ideal for traders looking to simplify their analysis while targeting key price levels for entries and exits.
Key Features
Pivot-Based Channels: Draws a red upper channel (resistance) and a green lower channel (support) by connecting recent pivot highs and lows.
Counter-Trend Breakout Signals:
Blue “CT Breakup” signal (▲) when the price breaks above the upper channel during a downtrend, indicating a potential reversal or pullback.
Orange “CT Breakdown” signal (▼) when the price breaks below the lower channel during an uptrend, signaling a potential downmove.
Trend Visualization: Background color shifts to green for uptrends and red for downtrends, making it easy to gauge market direction.
Customizable Settings: Adjust pivot detection sensitivity with “Pivot Left Bars” (default: 5) and “Pivot Right Bars” (default: 1), and control channel extension with “Channel Extension Bars” (default: 50).
Optional Trend Signals: Enable “Show Trend Change Signals” to display trend shifts with green (uptrend) or red (downtrend) arrows.
Alert Conditions: Set alerts for counter-trend breakouts and trend changes directly on TradingView.
Example Performance (BTCUSDT, 1-Hour Chart)
On the BTCUSDT 1-hour chart:
A “CT Breakdown” signal appeared on April 6 at 8:00 AM at $82,700, followed by a drop to $74,400 within hours—a 10% move.
A “CT Breakup” signal occurred on April 9 at 1:00 AM at $76,600, leading to a rally to $86,600 in a few hours—a 9% gain.
These examples highlight the indicator’s ability to spot significant price movements, though results depend on market conditions, your trading style, and risk management.
Settings
Pivot Left Bars (default: 5): Number of bars to the left for pivot detection.
Pivot Right Bars (default: 1): Number of bars to the right for pivot confirmation (ensures non-repainting signals).
Channel Extension Bars (default: 50): How far the channels extend to the right.
Show Pivot Points (default: true): Displays small triangles at pivot highs (maroon) and lows (navy).
Show Counter-Trend Breakout Signals (default: true): Shows CT Breakup and CT Breakdown signals.
Show Trend Change Signals (default: false): Displays trend shift arrows when enabled.
How to Use
Add the indicator to your chart via TradingView’s indicator library.
Adjust the settings to match your trading style and timeframe.
Watch for “CT Breakup” and “CT Breakdown” signals to identify potential trade setups.
Use the background color (green/red) to confirm the current trend.
Set alerts for breakouts or trend changes to stay updated on key signals.
Always combine with proper risk management and your own analysis—past performance is not a guarantee of future results.
Notes
The indicator is non-repainting, meaning signals are confirmed and won’t disappear after they form.
Works on any market (crypto, forex, stocks) and timeframe, such as the BTCUSDT 1-hour chart shown.
Performance varies based on market volatility and your trading strategy.
This is a free tool created to support the TradingView community—feedback is welcome in the comments!
Disclaimer
Trading involves risk, and this indicator is not a guaranteed predictor of future price movements. Always conduct your own analysis and manage risk appropriately. The examples provided (e.g., BTCUSDT signals) are for educational purposes only and reflect past performance, which may not repeat.
Pivot Length Percentiles Oscillator# Pivot Length Percentiles Oscillator: Technical Mechanics Explained
## Introduction
The Pivot Length Percentiles Oscillator is a statistical approach to identifying potential market reversals by analyzing the distribution of price movements relative to pivot points. This publication explains the technical mechanics behind the indicator.
## Core Mechanics
### 1. Pivot Point Detection
The indicator begins by identifying significant pivot highs and lows using a user-defined lookback period:
- `lft`: Number of bars to the left of potential pivot point
- `rht`: Number of bars to the right of potential pivot point
These parameters determine how "significant" a pivot needs to be to qualify for analysis.
### 2. Distance Measurement & Historical Database
For each new pivot point identified, the indicator:
- Calculates the absolute price distance from the previous pivot of the same type
- Records the number of candles between consecutive pivots
- Stores these measurements in dynamic arrays that build a historical database
### 3. Statistical Distribution Analysis
Rather than using fixed values, the oscillator analyzes the complete distribution of historical pivot distances and calculates key percentile values:
- `lw` (Low Percentile): Lower boundary for statistical significance
- `md` (Mid Percentile): Median statistical boundary
- `hi` (High Percentile): Upper boundary for statistical extremes
### 4. Oscillator Construction
Two primary oscillator lines are calculated:
- Green line (`osc1`): Measures current price's fall below recent highs with `low - ta.highest(high, lft)`
- Red line (`osc2`): Measures current price's rise above recent lows with `high - ta.lowest(low, lft)`
### 5. Threshold Generation
The percentile values from the historical distribution create dynamic threshold lines:
- For downside movements: Scaled versions of the low percentile (`lw_distance_low`) and high percentile (`hi_distance_low`)
- For upside movements: Scaled versions of the low percentile (`lw_distance_high`) and high percentile (`hi_distance_high`)
### 6. Signal Logic
Entry signals are generated when:
- **Bullish Signal**: The downside oscillator crosses below a statistical threshold while price continues showing downward momentum (close < previous close AND close < previous open)
- **Bearish Signal**: The upside oscillator crosses above a statistical threshold while price continues showing upward momentum (close > previous close AND close > previous open)
### 7. Visualization Options
Users can toggle between:
- Standard view: Shows the oscillator and threshold lines
- Percentile view: Displays the current movement's percentile rank within the historical distribution
## Implementation Notes
- The indicator scales threshold values by 0.9 to create a slight buffer that reduces false signals
- The movement's continuation is confirmed by checking both close-to-close and close-to-open relationships
- Arrays dynamically update throughout the chart's history, making the indicator increasingly accurate as more data is processed
## Mathematical Framework
The core statistical function calculates percentiles using linear interpolation between values when needed:
```
calculate_percentile(array, percentile) =
sortedValue +
fraction * (sortedValue - sortedValue )
```
where `index = (array.size - 1) * percentile / 100`
This mathematical approach ensures the thresholds adapt dynamically to changing market conditions rather than relying on fixed values.

Pivot Point Calculator PPC V2 by [KhedrFx]📈 Trade Smarter with the Pivot Point Calculator (PPC) by KhedrFx
Want to spot key price levels and make better trading decisions? The Pivot Point Calculator (PPC) by KhedrFx is your go-to TradingView tool for identifying potential support and resistance zones. Whether you’re a Scalper trader, day trader, swing trader, or long-term investor, this script helps you plan precise entries and exits with confidence.
🔹 How to Use Pivot Points in Trading
📊 Step 1: Identify Key Levels
The PPC automatically plots:
Pivot Point (P): The main level where sentiment shifts between bullish and bearish.
Support Levels (S1, S2, S3): Areas where price may bounce higher.
Resistance Levels (R1, R2, R3): Areas where price may face selling pressure.
These levels act as dynamic price zones, helping you anticipate potential market movements.
🔥 Step 2: Choose Your Trading Strategy
1️⃣ Breakout Trading
Buy when the price breaks above the pivot point (P) with strong momentum.
Sell when the price drops below the pivot point (P) with strong momentum.
Use R1, R2, or R3 as profit targets in an uptrend and S1, S2, or S3 in a downtrend.
2️⃣ Reversal (Bounce) Trading
Buy when the price pulls back to S1, S2, or S3 and shows bullish confirmation (e.g., candlestick patterns like a bullish engulfing or hammer).
Sell when the price rallies to R1, R2, or R3 and shows bearish confirmation (e.g., rejection wicks or a bearish engulfing pattern).
🎯 Step 3: Set Smart Stop-Loss & Take-Profit Levels
Stop-Loss: Place it slightly below support (for buy trades) or above resistance (for sell trades).
Take-Profit: Use the next pivot level as a target.
Extreme Zones: R3 and S3 often signal strong reversals or breakouts—watch them closely!
🚀 How to Get Started
1️⃣ Add the PPC script to your TradingView chart.
2️⃣ Choose a timeframe that fits your strategy (5m, 15m, 30m, 1H, 4H, Daily, or Weekly).
3️⃣ Use the pivot points and support/resistance levels to fine-tune your trade entries, exits, and risk management.
⚠️ Trade Responsibly
This tool helps you analyze the market, but it’s not a guarantee of profits. Always do your own research, manage risk, and trade with caution.
💡 Ready to take your trading to the next level? Try the Pivot Point Calculator (PPC) by KhedrFx and start trading with confidence today! 🚀

VMA [Extreme Advanced Custom Table for BTCUSD]This indicator implements a Variable Moving Average (VMA) with a 33-period length—selected in homage to the Tesla 369 concept—to dynamically adjust to market conditions. It not only calculates the adaptive VMA but also displays a custom table of key metrics directly on the chart. Here’s how to use it:
Apply to Your Chart:
Add the indicator to your chart (optimized for BTCUSD, though it can be used on other symbols) and choose your desired source (e.g., close).
Customize Your Visuals:
Trend & Price Lines: Toggle the trend colors, price line, and bar coloring based on the VMA’s direction.
Channels & Slope: Enable the volatility channel and slope line to visualize market volatility and the VMA’s momentum.
Pivot Points & Super VMA: Activate pivot high/low markers for potential reversal points and a Super VMA (SMA of VMA) for an extra smoothing layer.
Table Customization: Adjust the table’s position, colors, and font sizes as needed for your viewing preference.
Monitor Key Metrics:
The dynamic table displays essential information:
VMA Value & Trend: See the current VMA and whether the trend is Bullish, Bearish, or Neutral.
Volatility Index (vI) & Slope: Quickly assess market volatility and the VMA’s slope (both absolute and percentage).
Price-VMA Difference & Correlation: Evaluate how far the price is from the VMA and its correlation.
Higher Timeframe VMA: Compare the current VMA with its higher timeframe counterpart (set via the “Higher Timeframe” input).
Alerts for Key Conditions:
Built-in alert conditions notify you when:
The trend changes (bullish/bearish).
The VMA slope becomes extreme.
The price and VMA correlation falls below a defined threshold.
The VMA crosses its higher timeframe average.
How to Use the Script:
Add to Your Chart:
Open TradingView and apply the indicator to your BTCUSD (or any other) chart.
The indicator will overlay on your chart, plotting the VMA along with optional elements such as the price line, volatility channels, and higher timeframe VMA.
Customize Your Settings:
Inputs:
Choose your data source (e.g., close price).
Adjust the VMA length (default is 33) if desired.
Visual Options:
Toggle trend colors, bar coloring, and additional visuals (price line, volatility channels, slope line, pivot points, and Super VMA) to suit your trading style.
Table Customization:
Set the table position, colors, border width, and font size to ensure key metrics are easily visible.
Higher Timeframe:
You can change the higher timeframe input (default is Daily) to better fit your analysis routine.
Interpret the Indicator:
Trend Analysis:
Watch the color-coded VMA line. A rising (orange) VMA suggests bullish momentum, while a falling (red) one indicates bearish conditions.
What Sets This Script Apart:
Dynamic Adaptation:
Unlike a fixed-period moving average, the VMA adjusts its sensitivity in real time by integrating a volatility measure, making it more adaptive to market swings.
Multi-Layered Analysis:
With integrated volatility channels, pivot points, slope analysis, and a higher timeframe VMA, this tool gives you a fuller picture of market dynamics.
Immediate Data at a Glance:
The real-time table consolidates multiple key metrics into one view, saving time and reducing the need for additional indicators.
Custom Alerts:
Pre-built alert conditions allow for timely notifications, ensuring you don’t miss critical market changes.
