Technical Analysis Consulting Table (TACT)Inspired by Tradingview's own "Technical Analysis Summary", I present to you a table with analogous logic.
You can track any ticker you want, no matter your chart. You can even have multiple tables to track multiple tickers. By default it tracks the Total Crypto Cap.
You can change the resolution you want to track. By default it is the same as the chart.
You can position the table to whichever corner of the chart you want. By default it draws in the bottom right corner.
Background colors and text size can be adjusted.
Indicators Used:
Oscillators
RSI(14)
STOCH(14, 3, 3)
CCI(20)
ADX(14)
AO
Momentum(10)
MACD(12, 26)
STOCH RSI(3, 3, 14, 14)
%R(14)
Bull Bear Power
UO(7,14,28)
Moving Averages
EMA(5)
SMA(5)
EMA(10)
SMA(10)
EMA(20)
SMA(20)
EMA(30)
SMA(30)
EMA(50)
SMA(50)
EMA(100)
SMA(100)
EMA(200)
SMA(200)
Ichimoku Cloud(9, 26, 52, 26)
VMWA(20)
HMA(9)
Pivots
Traditional
Fibonacci
Camarilla
Woodie
WARNING: I have observed up to a couple of seconds of signal jitter/delay, so use it with caution in very small resolutions (1s to 1m).
I hope you enjoy this and good luck with your trading. Suggestions and feedback are most welcome.
Pesquisar nos scripts por "oscillator"

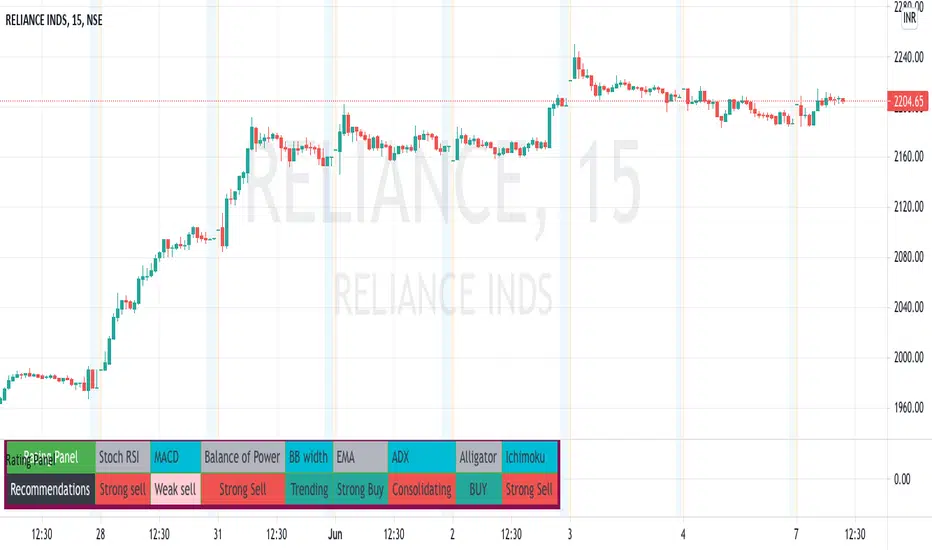
Multi-Indicator Rating PanelThis is a panel for multiple indicators recommendations as often and popularly used with that chart. This idea is derived from the great minds that developed such amazing indicators for our technical analysis of our charts.
The ratings would be self-explanatory in terms of buying/ selling/ weak buy/ weak sell and as for oscillators in terms of trending or consolidation.
These indicator recommendations are just for indicatiive purposes only. you can manipulate the outputs by changing the script or through input panel.
In Future, I'll try to add more and more indicators to suffice everyone's need.
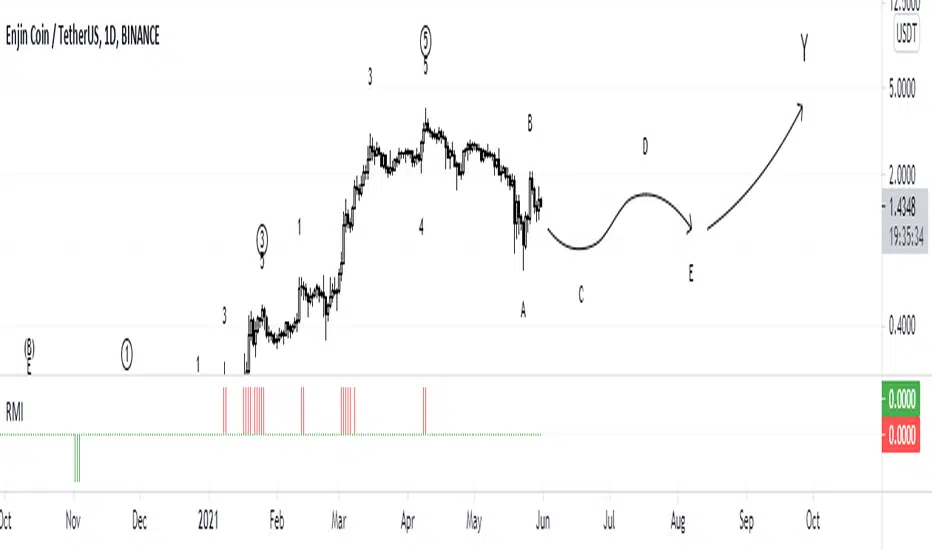
RMIRMI is a combination of RSI and MFI oscillators which considers money flow and strength of supply or demand together.
It estimates that the money of which side is being ran out.
So the power of trends can be predictable approximately.
Where the green columns appear, it means demand is very high and it can fall because buyers may withdraw and sell their assets.
And when red columns appear, it means supply is very high and sellers or new buyers may enter into new deals which may increase the price of a asset.
I would be glad if I hear your feedbacks.
STOCHASTIC+Stochastic Oscillators are used to determine Overbought and Oversold Market conditions. This Stoch is set to a quicker Length then normal with an RSI that changes color depending on Momentum. When RSI is Overbought you well get a red shadow to indicate the market is setting up for a sell. When the RSI is Oversold you will get a green shadow to indicate the market is setting up for a buy

RSI + MFI - Crypto Bull and Bear market A fancy styled version of the RSI (Relative Stochastic Index) + MFI (Money Flow Index) oscillators in order to emphasize buy and sell opportunities.
The 80 and 20 Bands are meant to be used in Bull or Bear markets. Better performing in D timeframes.
The circles represent the cross between RSI and MFI .
Designed for Crypto Markets
Thanks @micheleprandina
Credits:

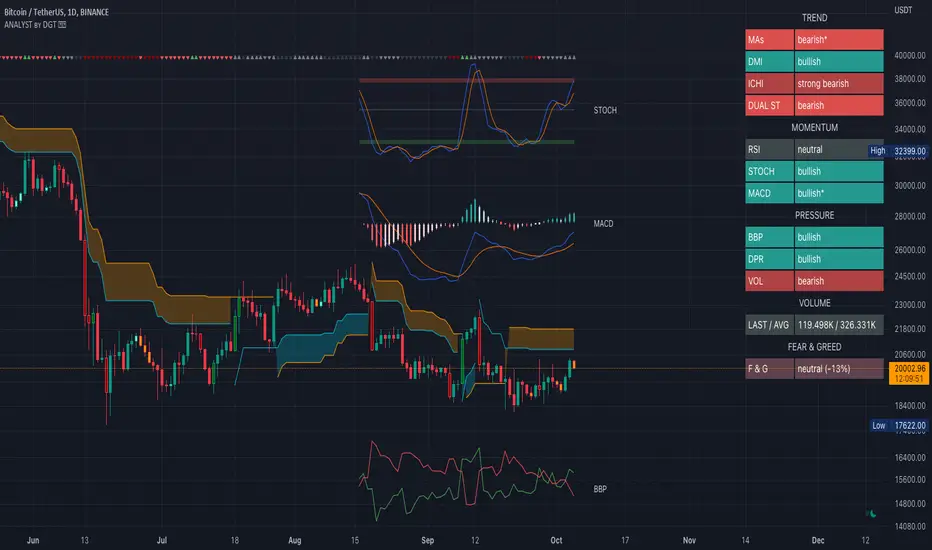
Technical Analyst by DGTWho needs a Technical Analyst?
yes I can hear someone is asking for, and here is one that can help you with technical analysis
The analyst will present a technical anlaysis report at a glance calculated by the most popular technical indicators , and the good part, the anlayst will do it voluntarily
technical skills of the analyst:
- experienced an all markets
- ability to interpret moving averages
- ability to interpret volume changes
- ability to interpret trend folowing indicators such as:
* directional movement index (dmi), identify trend strength and trend direction
* complex ichimoku cloud , identify trend stregth, and tk crosses
- ability to interpret oscillators such as:
* relative strength index, identify oversold overbought levels, identify the rsi flow
* commodity channel index, identify oversold overbought levels
* awesome identify if grawing or falling
* macd if bullish or bearish, and macd histogram if grawing or falling
- ability to calculate probability and its trend
- non-stop hardworker,
- available 7/24,
- highly dedicated always on duty,
- open for new ideas and willing to learn
- upon request the analyst will create reports with custom settings of your choise
the analyst is not a decition maker, trading success is all about following your trading strategy and the analyst aims to help with the presented reports calculated by the most popular technical indicators
the analyst supports 9 of the popular technical indicators and is willing to learn more , please share your comments and feedbacks and help the analyst improve skills
cheers!
Disclaimer : The script is for informational and educational purposes only. Use of the script does not constitutes professional and/or financial advice. You alone the sole responsibility of evaluating the script output and risks associated with the use of the script. In exchange for using the script, you agree not to hold dgtrd TradingView user liable for any possible claim for damages arising from any decision you make based on use of the script
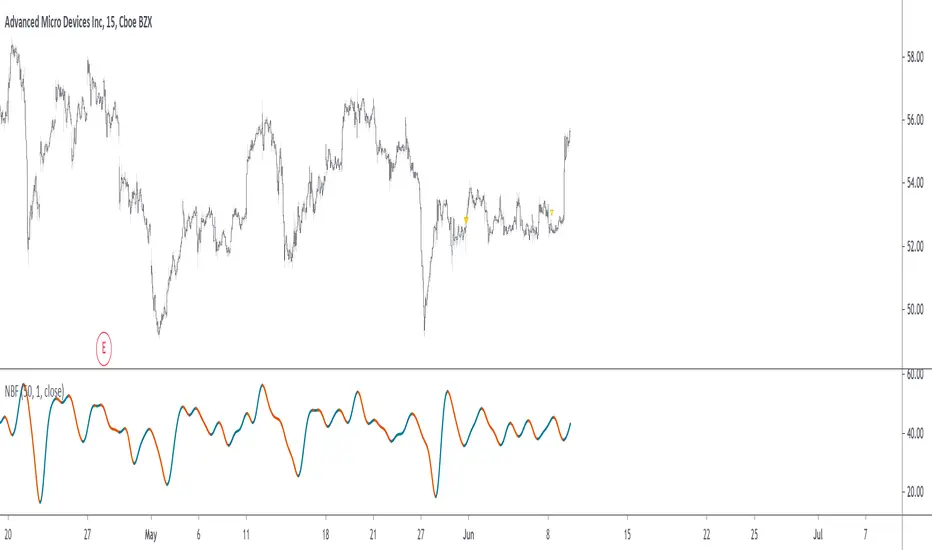
Narrow Bandpass FilterIn technical analysis most bandpass filters like the MACD, TRIX, AO, or COG will have a non-symmetrical frequency response, in fact, this one is generally right-skewed. As such these oscillators will not fully remove lower and higher frequency components from the input signal, the following indicator is a bandpass filter with a more symmetrical frequency response with the possibility to have a narrow bandwidth, this allows the indicator to potentially isolate sinusoids from the input signal.
Indicator & Settings
The filter is calculated via convolution, if we take into account that the frequency response of a filter is the Fourier transform of its weighting function we can deduce that we can get a narrow response by using a sinusoid sin(2𝛑nf) as the weighting function, with the peak of the frequency response being equal to f , this makes the filter quite easy to control by the user, as this one can choose the frequency to be isolated. The length of the weighting function controls the bandwidth of the frequency response, with a higher length returning an ever-smaller frequency response width.
In the indicator settings the "Cycle Period" determine the period of the sinusoid used as a weighting function, while "Bandwidth" determine the filter passband width, with higher values returning a narrower passband, this setting also determine the length of the convolution, because the sum of the weights must add to 0 we know that the length of the convolution must be a multiple of "Cycle Period", so the length of the convolution is equal to "Cycle Period × Bandwidth".
Finally, the windowing option determines if a window is applied to the weighting function, a weighting function allow to remove ripples in the filter frequency response
Above both indicators have a Cycle period of 100 and a Bandwidth of 4, we can see that the indicator with no windowing don't fully remove the trend component in the price, this is due to the presence of ripples allowing lower frequency components to pass, this is not the case for the windowed version.
In theory, an ultra-narrow passband would allow to fully isolate pure sinusoids, below the cycle period of interest is 20
using a bandwidth equal to 10 allow to retain that sinusoid, however, note that this sinusoid is subject to phase shift and that it might not be a dominant frequency in the price.
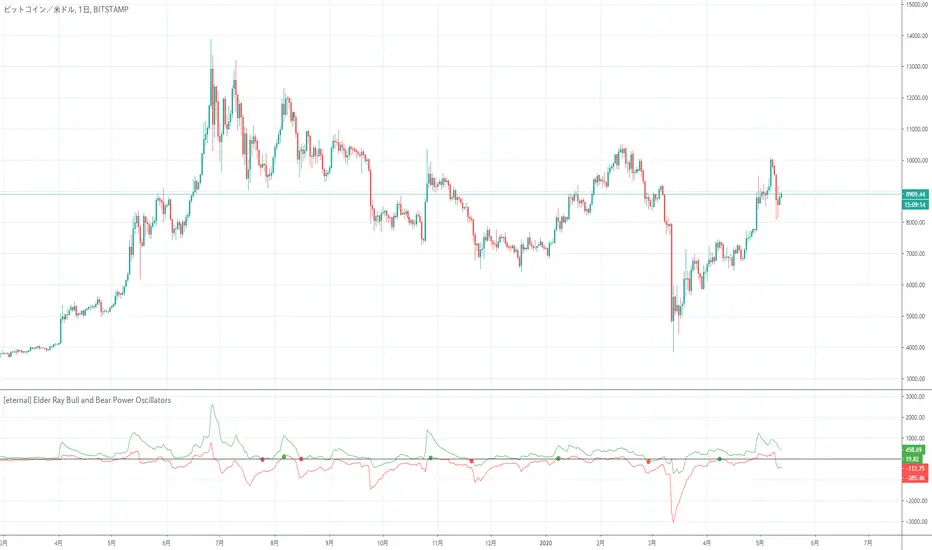
[eternal] Elder Ray Bull and Bear Power OscillatorsElder Ray is an indicator that displays Bull Power and Bear Power at the same time.
This indicator is a modified indicator of Elder Ray.
Setting eternal = False and sommozing Period = 1 will be the same as Elder Ray.
Since the eternal option is a definite signal option, it does not disappear even if the value of close changes if a signal comes out.
In other words, when a signal comes out, it is premised to trade immediately, and the signal comes out at the moment when the bar is updated.
The signal of this indicator seems to be weak in the range market due to its operating principle.
(It seems that the author wanted to try a definite signal)
* It has not been verified whether or not you can finally win, so please use it after individual income and expenditure verification.
Elder RayはBull Power, Bear Powerを同時に表示したインジケーターです。
このインジケーターはElder Rayを改造したインジケーターです。
eternal = False, sommozing Period = 1に設定すると Elder Rayと同じものになります。
eternal オプションは確定シグナルオプションなので、シグナルが出ればcloseの値が変化しても消えることはないです。
つまり、シグナルが出れば即座に取引する前提になっていて、シグナルが出るタイミングはバーが更新した瞬間です。
このインジケーターのシグナルは動作原理上レンジ相場に弱いと思われます。
(作者は確定シグナルを試してみたかったらしい)
※最終的に勝てるかは未検証ですので、個人で収支検証後、使用をお願いします。
RedK Vol_Weighted RSI: Extending the power of the classic RSILet's take the classic Relative Strength Index (RSI) and give it couple of modern upgrades - the results are better visuals with improved signals and trade decision support:
Options and features:
- Dual period: look at the short term RSI vs a backdrop of a longer period RSI (expressing the longer-term "prevailing sentiment") - get clearer "re-entry" points in long bull or bear runs
- Longer period RSI has a "Step" option - since what we won't be really interested in the fractions, but more of the broad "strength" of the sentiment (weak, medium..) - default set to a step of 5. please experiment with what works best for you.
- Option to make the RSI volume-weighted. (On by default) - won't say much here, but possibly this is the biggest and most important added feature for those keen on the combined price - volume effect (and Wyckoff'ians)
- Smoothing option -- i would keep this set to 3 to avoid extra lag due to the smoothing
- scaled to +100 / -100 with zero as the signal line - that's how i like oscillators to work
- Adjustable optional overbought / oversold levels - can also be used to also mark strong up/down levels
- designed for the "visually oriented" -- like me :)
- code is open and commented
What Values to use:
many setting combinations possible. play around and find your sweet spot based on what/how you trade. for me, i usually prefer what i set as defaults in the study.
tip: if you set Length = 14, smoothing = 1, Sent. factor =1, Vol Weighted = No, you're back (almost) with a classic RSI - the only difference would be that i use Weighted Moving Average in my calculation of the RSI (i tend to believe WMA is the most naturally-suited for looking at "market price" data series)
Please feel free to use, share or give feedback.
TradingView's Technical AnalysisAll indicators used on the Technical Analysis Summary from TradingView, composed with oscillators and moving averages. Sell and strong sell will represent more indicators showing sell signals. Buy and strong buy will represent more indicators showing buy signals. A white bar will show neutral signal (don't trade). This can be good for binary options or scalping on small time frames, but also very good on higher times for forex. The signal will appear on the candle before, so wait for the new candle to appear to see what direction the signal will indicate.

Elder ray ( Bull power and bear power combined )Elder-ray is an indicator named for its similarity to x-rays.
It shows the structure of bullish and bearish
power below the surface of the markets. Elder-ray combines a trend-
following moving average with two oscillators to show when to enter
and exit long or short positions.
A moving average reflects the average consensus of value. The high of
each bar reflects the maximum power of bulls during that bar. The low of
each bar marks the maximum power of bears during that bar.
Elder-ray works by comparing the power of bulls and bears during each
bar with the average consensus of value. Bull Power reflects the maximum
power of bulls relative to the average consensus, and Bear Power the max-
imum power of bears relative to that consensus.
When the high of a bar is above the EMA, Bull Power is positive. When
the entire bar sinks below the EMA, which happens during severe de-
clines, Bull Power becomes negative. When the low of a bar is below the
EMA, Bear Power is negative. When the entire bar rises above the EMA,
which happens during wild rallies, Bear Power becomes positive.
The slope of a moving average identifies the current trend of the mar-
ket. When it rises, it shows that the crowd is becoming more bullish; it is
a good time to be long. When it falls, it shows that the crowd is becoming
more bearish; it is a good time to be short. Prices keep getting away from
a moving average but snap back to it, as if pulled by a rubber band. Bull
Power and Bear Power show the length of that rubber band. Knowing the
“Buy low, sell high” sounds good, but traders and investors seem to have
been more comfortable buying Lucent above 70 than below 7. Perhaps they
are not as rational as the efficient market theorists would like us to believe?
Elder-ray gives rational traders a glimpse into what is going on below the sur-
face of the market.
When the trend, identified by the 22-day EMA, is down and bulls are
under water, the rallies back to the surface mark shorting opportunities
normal height of Bull or Bear Power reveals how far prices are likely to get
away from their moving average before returning. Elder-ray offers one of
the best insights into where to take profits—at a distance away from the
moving average that equals the average Bull Power or Bear Power.
Elder-ray gives buy signals in uptrends when Bear Power turns nega-
tive and then ticks up. A negative Bear Power means that the bar is strad-
dling the EMA, with its low below the average consensus of value. Waiting
for Bear Power to turn negative forces you to buy value rather than chase
runaway moves. The actual buy signal is given by an uptick of Bear Power,
which shows that bears are starting to lose their grip and the uptrend is
about to resume. Take profits at the upper channel line or when a trend-
following indicator stops rising. Profits may be greater if you ride the
uptrend to its conclusion, but taking profits at the upper channel line is
more reliable.
Elder-ray gives shorting signals in downtrends when Bull Power turns
positive and then ticks down. We can identify the downtrend by a declin-
ing daily or weekly EMA. A positive Bull Power shows that the bar is strad-
dling the EMA, with its high above the average consensus of value.
Waiting for Bull Power to turn positive before shorting forces you to sell
at or above value instead of chasing waterfall declines. The actual short-
ing signal is given by a downtick of Bull Power, which shows that bulls
are starting to slip and the downtrend is about to resume. Once short, take
profits at the lower channel line or when the trend-following indicator
stops falling, depending on your style.
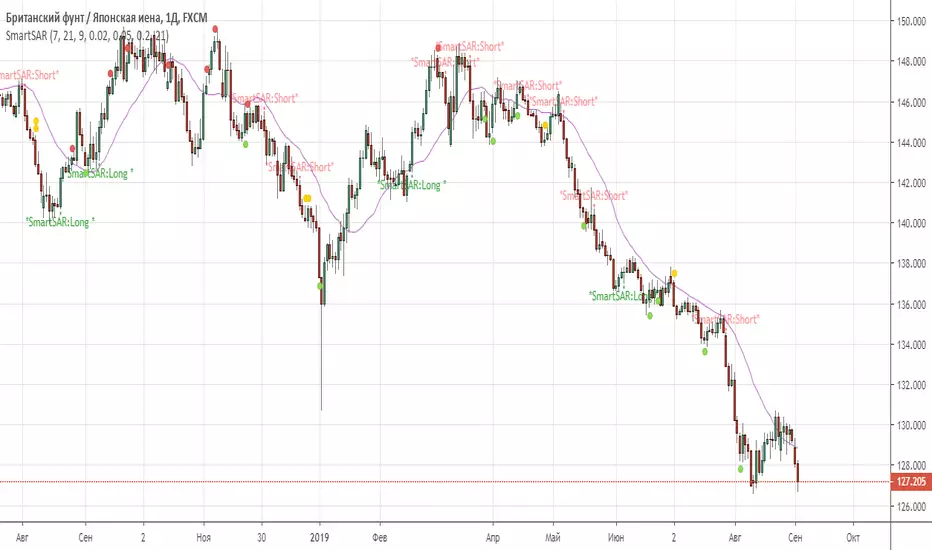
SmartSARSAR signal filtered by 3 indicators: MACD, AC, RVI.
This combination of trend indicator(SAR), 2 oscillators (MACD, RVI) , and 1 Bill Williams (AC) give us good Enter point.
Recommended timeframes: from 30 min and higher.
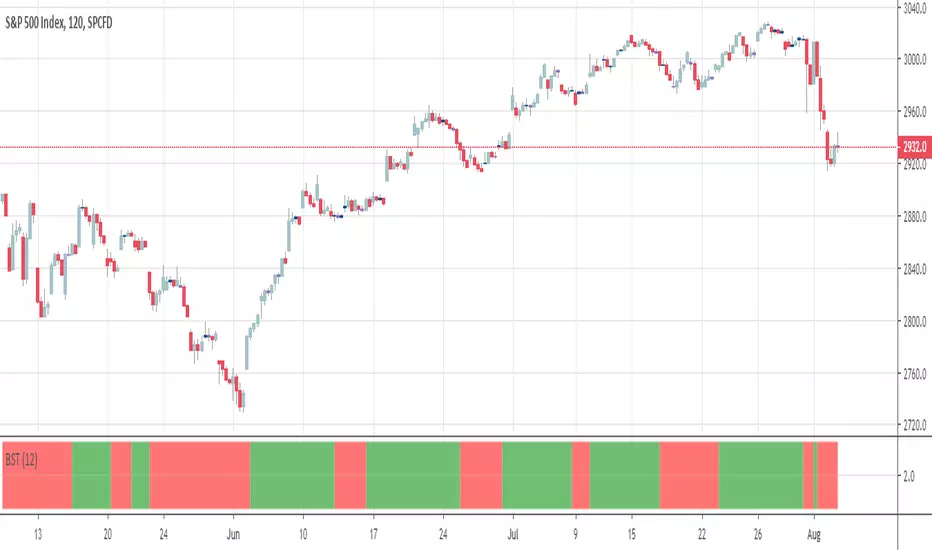
BSTtrend (and a quick note on trading psychology)Hi again :)
Script #2 for tonight, more to come :)
This one is a Pine transcription of a FXCM/LUA script called BSTrend
I used it years ago to trade index on very low timeframes with it. I'm always looking for oscillators that are more reactive than the traditional MACD. And even more reactive than the MACD Zero Lag
This is a proof of concept that Pinescript is my favorite trading programming language vs MT4/LUA/PRT. I just find it easier and the Pinescript community is helping a lot
With the BSTrend you can win but also lose. I see a lot of scripts out there but there is not a better or worst indicator. The key is HOW to use it.
In other words the key is your PSYCHOLOGY, without a rock-solid psychology, you'll end up committing a mistake even with G. himself whispering "BUY NOW", "SELL NOW" to your ears. (wait..... Do you mean this is happening only to me ????)
However, indicators help immensely in reducing the psychology pressure that we have to endure ... sometimes for days..... But better not to overcharge with dozens of indicators per chart and have a tool to detect whenever there is a confluence/convergence of your favorite indicators :) #algorithm #builder
I'll publish an educational post about next week
Those are the exact words that my mentor traders told me 6 years ago when I started trading
PS
____________________________________________________________
Be sure to hit the thumbs up as it shows me that I'm not doing this for nothing and will motivate to deliver more quality content in the future.
- I'm an officially approved PineEditor/LUA/MT4 approved mentor on codementor. You can request a coaching with me if you want and I'll teach you how to build kick-ass indicators and strategies
Jump on a 1 to 1 coaching with me
- You can also hire for a custom dev of your indicator/strategy/bot/chrome extension/python
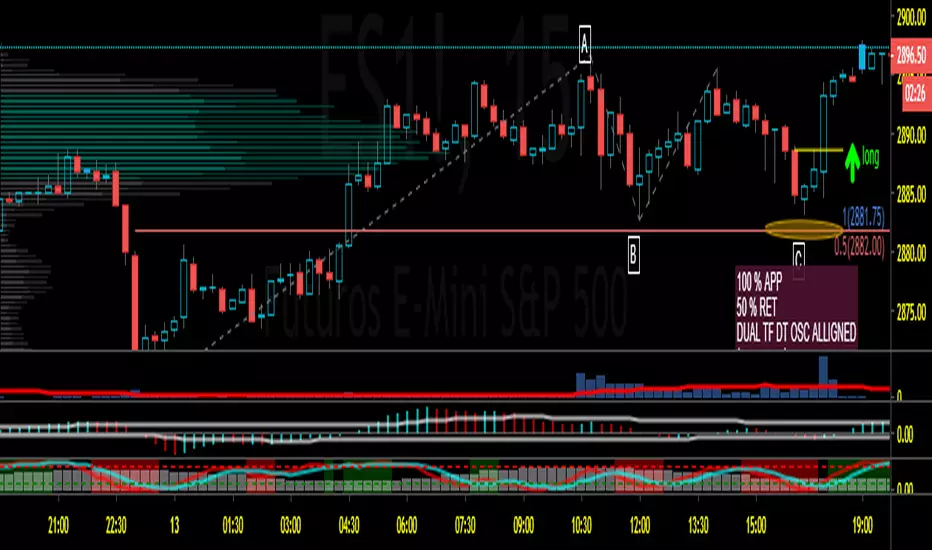
DTOsc Dual Time Frame V1Based on the concept of Robert Miner Book "High Probabilities Strategies"
This script shows at the same time the DTosc of the current time frame and the higher one (shaded gray columns)
For daily-weekly, for hour-daily, for 15 or 5 minutes hour are automatically selected as higher time frame
The green zone shows that both oscillators are alligned
Four Types. Type 1 is fastest and Type 4 is slowest. Menu selection.
Is a filter for elliott trades, as Robert Miner book shows, but not a complete trading system by itself. When fibonacci retracement , and extensions in price and time, patter positions and dual TF momentums are aligned trades could be taken
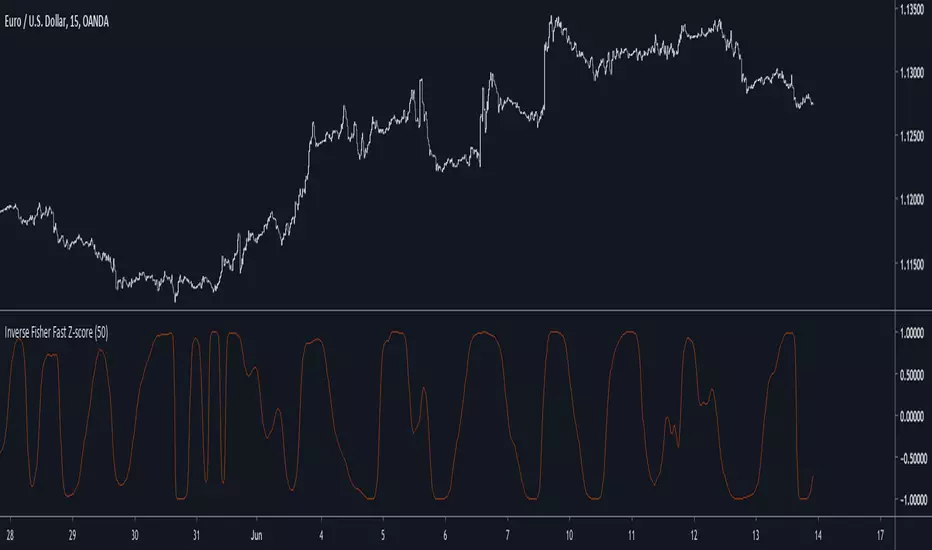
Inverse Fisher Fast Z-scoreIntroduction
The fast z-score is a modification of the classic z-score that allow for smoother and faster results by using two least squares moving averages, however oscillators of this kind can be hard to read and modifying its shape to allow a better interpretation can be an interesting thing to do.
The Indicator
I already talked about the fisher transform, this statistical transform is originally applied to the correlation coefficient, the normal transform allow to get a result similar to a smooth z-score if applied to the correlation coefficient, the inverse transform allow to take the z-score and rescale it in a range of (1,-1), therefore the inverse fisher transform of the fast z-score can rescale it in a range of (1,-1).
inverse = (exp(k*fz) - 1)/(exp(k*fz) + 1)
Here k will control the squareness of the output, an higher k will return heavy side step shapes while a lower k will preserve the smoothness of the output.
Conclusion
The fisher transform sure is useful to kinda filter visual information, it also allow to draw levels since the rescaling is in a specific range, i encourage you to use it.
Notes
During those almost 2 weeks i was even lazier and sadder than ever before, so i think its no use to leave, i also have papers to publish and i need tv for that.
Thanks for reading !
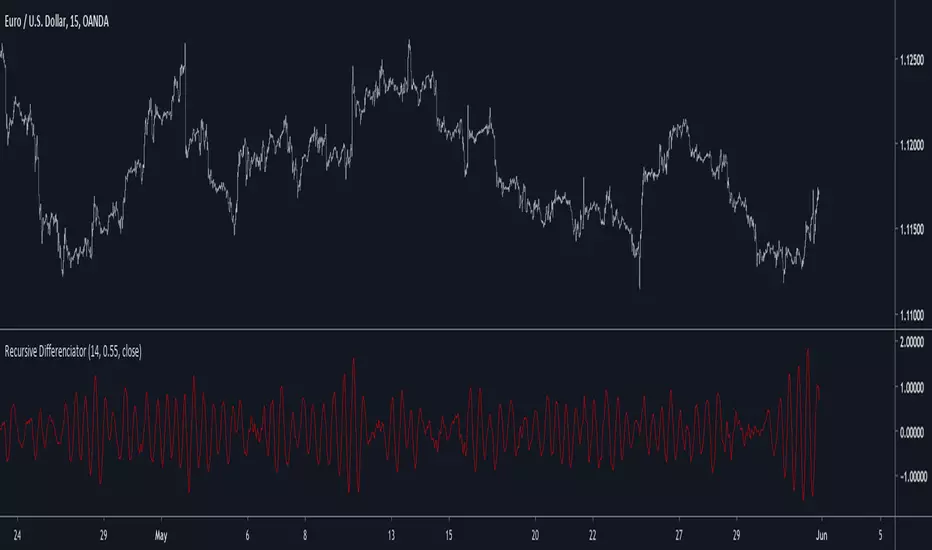
Recursive DifferenciatorIntroduction
Cycles can be spotted by using a wide range of methods, most of them will involve bandpass filtering, here i will show a method using recursion with the change() function.
The Indicator
As i explained in other indicators using recursion i posted rescaling the input is important, i will use the rsi of an exponential moving average as input. alpha control the amount of output the indicator will use as input, values closer to 0.5 will use more input resulting in more periodic results.
Lowering alpha when length is higher can help get more periodic results.
Conclusion
I have showed a new cycle indicator using recursion. Recursion with oscillators can highlights cycles in price thus being easier to predict.
Thanks for reading !