Real Momentum Osc.An earlly oscillator. Sometimes It mat be dangerous. Be careful please. I just combined TSI, WMA, Stochastic.
Pesquisar nos scripts por "oscillator"

[blackcat] L1 Vitali Apirine Rate Of Change With BandsLevel: 1
Background
Vitali Apirine introuced this RoC indicator of “Rate Of Change With Bands” on March 2021.
Function
In Vitali Apirine's article “Rate Of Change With Bands” , the author introduces a concept of identifying overbought and oversold levels based on calculating standard deviation bands of the rate of change (ROC) momentum oscillator. The rate of change bands widen and narrow as the ROC deviation increases and decreases. The author proposes using this indicator in conjunction with other technical analysis methods to determine if the instrument is overbought or oversold.
Key Signal
UpperBand --> overbought threshold
oMARoc --> Output RoC Moving Average
LowerBand --> oversold threshold
Labels
L --> Long
S --> Short
XL --> Close Long
XS --> Close Short
Pros and Cons
100% Vitali Apirine definition translation, even variable names are the same. This help readers who would like to use pine to read his article.
Remarks
The 1st script for Blackcat1402 Vitali Apirine series publication.
Readme
In real life, I am a prolific inventor. I have successfully applied for more than 60 international and regional patents in the past 12 years. But in the past two years or so, I have tried to transfer my creativity to the development of trading strategies. Tradingview is the ideal platform for me. I am selecting and contributing some of the hundreds of scripts to publish in Tradingview community. Welcome everyone to interact with me to discuss these interesting pine scripts.
The scripts posted are categorized into 5 levels according to my efforts or manhours put into these works.
Level 1 : interesting script snippets or distinctive improvement from classic indicators or strategy. Level 1 scripts can usually appear in more complex indicators as a function module or element.
Level 2 : composite indicator/strategy. By selecting or combining several independent or dependent functions or sub indicators in proper way, the composite script exhibits a resonance phenomenon which can filter out noise or fake trading signal to enhance trading confidence level.
Level 3 : comprehensive indicator/strategy. They are simple trading systems based on my strategies. They are commonly containing several or all of entry signal, close signal, stop loss, take profit, re-entry, risk management, and position sizing techniques. Even some interesting fundamental and mass psychological aspects are incorporated.
Level 4 : script snippets or functions that do not disclose source code. Interesting element that can reveal market laws and work as raw material for indicators and strategies. If you find Level 1~2 scripts are helpful, Level 4 is a private version that took me far more efforts to develop.
Level 5 : indicator/strategy that do not disclose source code. private version of Level 3 script with my accumulated script processing skills or a large number of custom functions. I had a private function library built in past two years. Level 5 scripts use many of them to achieve private trading strategy.

Strategy - DMI Indicator with DPO Indicator as a GuardThe Directional Movement Index Indicator is one of my favorite indicators in tradingview's built-in library. It is free to use for all
For more information on what the DMI is, please visit: www.tradingview.com
The only problem I've come across with the DMI is that when it hits a 'trade range zone' it triggers false new trends (this is the case with almost every indicator I've ever tested).
This script modifies the DMI by removing the need for the ADX logic. It only focuses on the +DI and the -DI.
In order to remove the 'noise' generated during a trade range zone I have added another powerful indicator called the Detrended Price Oscillator.
The DPO is also a 'built-in' indicator on tradingview. www.tradingview.com
The DPO is used in conjunction with the DMI to stop trade ranges from wrecking your profits.
This strategy logic simply checks for the DMI indicator to cross itself. If the +DI crosses over the -DI this is a bullish cross and visa versa, if the -DI crosses over the +DI then it could mean bearish sentiment is building.
But then strategy logic uses the DPO to check if the DPO is above 0 or below 0 value
If the +DI crosses over the -DI and the DPO is above 0 value, then it's a Long entry point.
However, if the +DI crosses over the -DI and the DPO is below 0 value, then the Long signal is void.
And visa versa, if the -DI crosses over the +DI and the DPO is below 0 value, then it's a Short entry point (unless the DPO is greater than 0)
With this DPO 'guard' in place, it helps us keep the total trades executed to a minimum.
This is vital to push through trade ranges that can wreck your profit potential.
I wish I could create a better plotting mechanism for this indicator so you can better see the visuals. But combining the DMI to scale with the DPO is not possible.
The best solution is to simply add another DMI indicator to your chart so you can compare the DMI to this script that is dominated by the DPO (yellow line).
Enjoy! Likes are much appreciated!

Stochastic TrendDear community,
I've made another simple trading bot for you to use. This bot is based on the Stochastic Oscillator. It only produces long trades currently.
I changed the oscillation period to a much longer one, which in turn creates opportunities to trade long term trends.
The bot goes long when the Entry lines is crossed from below and it will close its long position once the Exit line has been crossed from above.

Full strategy Psar+ adx + cmf + rsi This ia full strategy made with a combination of a trender, volume, volatility and oscillator.
In this case we only go long.
Indicators used:
Default PSAR
Default CMF
Modified RSI logic, not using OB/OS
ADX with EMA applied
The rules are : we check if we are in a uptrend on psar, together with a positive value in volume, rsi is above the middle line(50), using a big length, and lastly the ADx is superior to the ema ADx
For exit, we check the opposite, like downtrend psar, negative value volume, rsi < 50, and adx < ema adx
If you have any questions let me know.

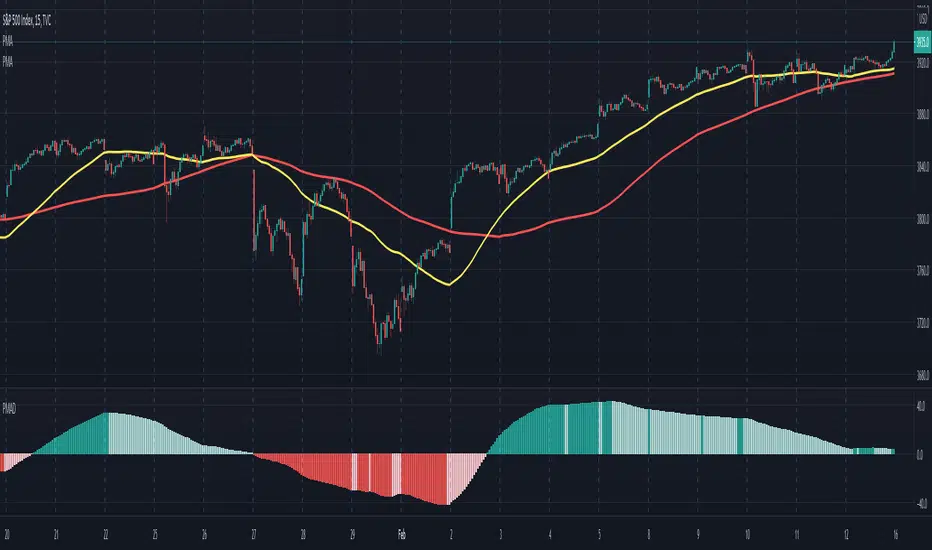
Moving Average Periodical DivergenceUses the difference between two PMA (Moving Average Periodical) indicators to create an oscillator.
Useful for visualizing daily/weekly cycles, strength and potential momentum. The defaults are 2 days (fast) and 5 days (slow).
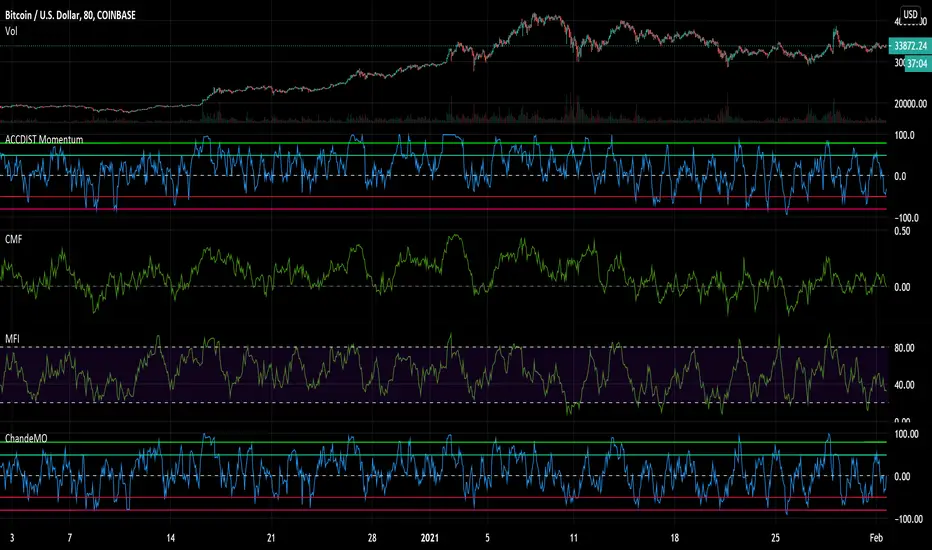
Accumulation and Distribution MomentumThis applies Chande Momentum to Accumulation and Distribution index as a means to changes.
Experimental oscillator.
Compare it to both Money Flows, Acc/Dis and Chande and you notice it has elements of all of them. Could potentially replace other volume based momentum indicators in your strategy.
It is a little more volatile, reaching from side to side, while having a tendency to lean towards the side that gets the most action over a longer period of time.
It also tends to reach and hang in oversold regions BEFORE a pump - something I noticed.
Could be used as an early warning sign as well as for overall trend analysis.
Comparison (Malaysia Index & Sector)This is just a simple tool for convenient to compare and showing a clear image of all sector and index in Malaysia. They are just in one indicator. From this indicator, you can predict momentum of each sector in Malaysia, which is currently in bull or bear trend.
STRUCTURE
In the setting, the first line with the option of the following index (Malaysia Index) :
1. FBMKLCI
2. FTSEMYX:FBMSCAP
3. FTSEMYX:FBMACE
4. FTSEMYX:FBM70
5. FTSEMYX:FBMT100
6. FTSEMYX:FBMFLG
7. FTSEMYX:FBMEMAS
8. FTSEMYX:FA40
9. FTSEMYX:FBMMSCS
10. FTSEMYX:FBMAPMYR
11. FTSEMYX:FBMMSCAP
The rest of lines is all of the following sector (Malaysia Sector):
1. Technology
2. Telecommunication
3. Health
4. Consumer Product
5. Industrial Product
6. Construction
7. Property
8. Plantation
9. Utilities
10. Transportation
11. Energy
12. REIT
13. Finance
The last line (Line 15) is provided for other stock/index which is not available in option to manually fill.
All sector and index price are smoothen by Moving Average (MA). The default moving average is Relative Moving Average (RMA) which is used in Relative Strength Index ( RSI ) Oscillator. But the range is different from RSI , it is from -100 to 100 instead of 0 to 100. In the end, result and interpretation are just the same as RSI . Green area indicates oversold area, while red area is overbought.
Other choice of Moving Averages are available to change.
The problem of putting all together is the script may take longer to process. It is just for convenient use.
Bottom-Up or Top-Down Invest?

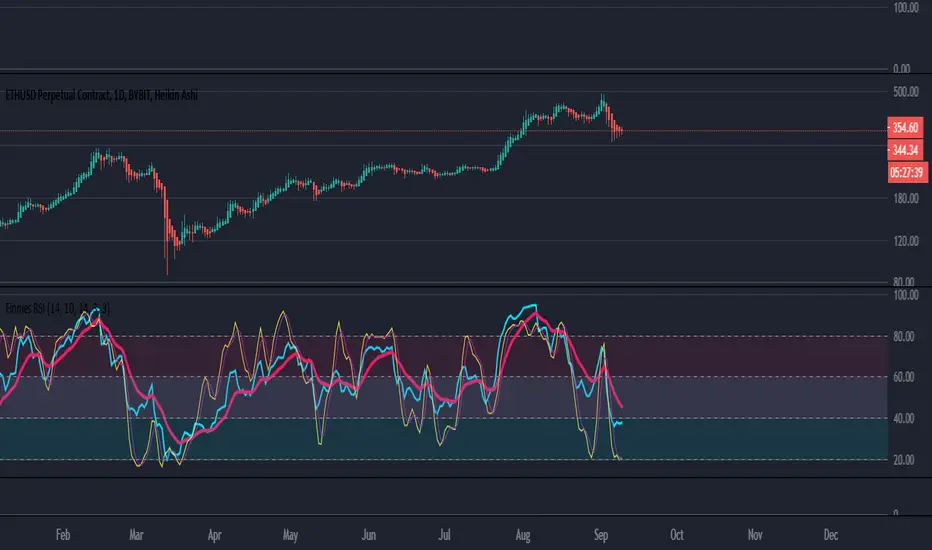
Finnie's RSI with EMA + MFI + Stoch V2RSI seams to be one of the most used indicators by far, and that comes because of merit . With that in mind, the goal of this indicator is to expand upon the tradition RSI or Relative Strength Index we all know and love :) I started by adding an EMA crossover. Which gives you, the users, a general idea of when to buy and sell outside of just watching a line go down and up. To take thinks even further, I decided to add options for both Fast and Slow Stochastic oscillators. Adding STOCH brings in another variable when deciding on an entry, technically its a bit hard to explain but in practice it would go something like this: you notice RSI is down around the level 20 mark and RSI is crossing up above it's EMA , which is BULLISH signal, and you're thinking about going long. As a second confirmation you can look at the STOCH rsi , if it's also crossing above the previously spoken EMA that's another BULLISH signal. This process can be repeated once RSI has risen to find an exit.
V2 changes:
-added MFI
-added overbought(yellow)/oversold(red) visual indicator
-removed K stoch in order to clean the indicator up visually, I haven't regretted it since :)

Finnie's RSI with EMA crossover + StochRSI seams to be one of the most used indicators by far, and that comes because of merit. With that in mind, the goal of this indicator is to expand upon the tradition RSI or Relative Strength Index we all know and love :) I started by adding an EMA crossover. Which gives you, the users, a general idea of when to buy and sell outside of just watching a line go down and up. To take thinks even further, I decided to add options for both Fast and Slow Stochastic oscillators. Adding STOCH brings in another variable when deciding on an entry, technically its a bit hard to explain but in practice it would go something like this: you notice RSI is down around the level 20 mark and RSI is crossing up above it's EMA, which is BULLISH signal, and you're thinking about going long. As a second confirmation you can look at the STOCH rsi, if it's also crossing above the previously spoken EMA that's another BULLISH signal. This process can be repeated once RSI has risen to find an exit.
EDIT: If you find the indicator is a bit too cluttered for you, feel free to disable the 'STOCH rsi' feature in settings :)
Indicator: Net Price Trend [xQT5]This is my original indicator - "Net Price Trend".I made a little personal research about how to analyzing price, and had main idea about view of net price (like net volume), when I'd created the oscillator.
Also, I added high and low border based on historical and typical price movement - you can change it on your opinion.
Trade rules are:
- when indicator is above "0" - it's bullish's zone
- when indicator is under "0" - it's bear's zone
- when indicator is under "-20" - it's attention zone for close sell's position
- when indicator is above "20" - it's attention zone for close buy's position
Enjoy it!

Percentage Price Over SMAReturn the percentage of closing prices greater than SMA's with periods within a user-selected range. An exponential moving average applied to these results is also displayed (in orange).
Settings
Min : Minimum period of the SMA in the range
Max : Maximum period of the SMA in the range
Smooth : Period of the EMA
Src : Input series of the indicator
Usage
The indicator is a normalized oscillator. A value of 100 indicates that 100% of the current closing price is over SMA's with periods ranging from min to max , this indicates a bullish market, while a value of 0 would indicate a bearish market.
In this image the indicator use min = 50 and max = 200, here AMD has been strongly bullish at the start, and ended being strongly bearish at the end, during this bullish period the indicator is over its overbought level, while it is under its oversold level during the bearish period.
In case the market is ranging we can expect the indicator to be around 50%, using the smoothed result might be more useful to detect ranging markets with this indicator.
If the smoothed result is within the overbought/oversold levels, then we can say that the market is either ranging or transitioning from a bullish/bearish market to an opposite one.

Z Score Enhanced Time Segmented Volume (Multi MA)**THIS VERSION HAS BEEN STANDARDIZED WITH A Z SCORE CALCULATION AND ALLOWS THE USER TO SELECT WHICH MOVING AVERAGE THEY WOULD LIKE TO UTILIZE FOR THE SIGNAL LINE**
Chart shows the Non-Standardized Enhanced Time Segmented Volume (Multi MA) with default settings on top and the Standardized version with default settings on the bottom.
Time Segmented Volume was developed by Worden Brothers, Inc to be a leading indicator by comparing various time segments of both price and volume . Essentialy it is designed to measure the amount of money flowing in and out of an instrument.
Time Segmented Volume was originally ported to TradingView by user @liw0 and later corrected by user @vitelot. I never quite understood how to read Time Segmented Volume until I ran across a version by user @storma where they indicated when price would be long or short, but that code also utilized the incorrect calculation from user @liw0.
In an effort to make Time Segmented Volume more accessible and easier to read, I have re-coded it here. The calculations are based on the code from @vitelot and I have added direction indicators below the chart.
If the histogram (TSV) is greater than zero and greater than the moving average, price should be moving long and there will be a green box below the chart.
If TSV falls below the moving average while still being greater than zero, the trend may be exhausting and has been coded to read Price Action Long - FAILURE with a black x below the chart.
If the histogram (TSV) is less than zero and less than the moving average, price should be moving short and there will be a red box below the chart.
If TSV rises above the moving average while still being less than zero, the trend may be exhausting and has been coded to read Price Action Short - FAILURE with a black x below the chart.
At times, the moving average may be above zero while TSV is below zero or vice versa. In these situations the chart will indicate long or short based on whether or not TSV is greater or less than zero. It is possible a new trend may be forming as the moving average obviously lags, but also possible price is consolidating with little volume and causing TSV to oscillate close to zero.
**Z Score // Standardized Option **
Thist Standardized code implements all of the above but also allows the user to select a threshold level that should not need to be adjusted for each instrument (since the output is standardized).
If the TSV value meets the long and short signal requirements above and TSV is greater than the threshold values a green or red box will print ABOVE the oscillator. The histogram will also change color based on which threshold TSV has met.
This calculation allows us to compare current volatility to the mean (moving average) of the population (Z-Length). The closer the TSV Z-Score is to the mean, the closer it will be to the Zero Line and therefore price is likely consolidating and choppy. The farther TSV Z-Score is from the mean, the more likely price is trending.
The MA Mode determines the Moving Average used to calculate TSV itself. The Z-Score is ALWAYS calculated with a simple moving average (as that is the standard calculation for Z-Score).
The Threshold Levels are the levels at which TSV Z-Score will change from gray to yellow, orange, green ( bullish ), or red ( bearish ).
Statistically speaking, confidence levels in relation to Z-Score are noted below. The built in Threshold Levels are the positive and negative values for 90%, 95%, and 99%. This would indicate when volatility is greater than these values they are out of the ordinary from the standard range. You may wish to adjust these levels for TSV Z-Score to be more responsive to your trading needs
80% :: 1.28
85% :: 1.44
90% :: 1.64
95% :: 1.96
99% :: 2.58
The Z Length is the period for which the Z Score is calculated
More information regarding Time Segmented Volume can be found here: www.worden.com
Original code ported by @liw0
Corrected by @vitelot
Updated/Enhancements by @eylwithsteph with inspiration from @storma
Multiple MA Options Credits to @Fractured and @lejmer
Bits and Pieces from @AlexGrover, @Montyjus, and @Jiehonglim
As always, trade at your own risk.

Dual Purpose Pine Based CorrelationThis is my "Pine-based" correlation() function written in raw Pine Script. Other names applied to it are "Pearson Correlation", "Pearson's r", and one I can never remember being "Pearson Product-Moment Correlation Coefficient(PPMCC)". There is two basic ways to utilize this script. One is checking correlation with another asset such as the S&P 500 (provided as a default). The second is using it as a handy independent indicator correlated to time using Pine's bar_index variable. Also, this is in fact two separate correlation indicators with independent period adjustments, so I guess you could say this indicator has a dual purpose split personality. My intention was to take standard old correlation and apply a novel approach to it, and see what happens. Either way you use it, I hope you may find it most helpful enough to add to your daily TV tool belt.
You will notice I used the Pine built-in correlation() in combination with my custom function, so it shows they are precisely equal, even when the first two correlation() parameters are reversed on purpose or by accident. Additionally, there's an interesting technique to provide a visually appealing line with two overlapping plot()s combined together. I'm sure many members may find that plotting tactic useful when a bird's nest of plotting is occurring on the overlay pane in some scenarios. One more thing about correlation is it's always confined to +/-1.0 irregardless of time intervals or the asset(s) it is applied to, making it a unique oscillator.
As always, I have included advanced Pine programming techniques that conform to proper "Pine Etiquette". For those of you who are newcomers to Pine Script, this code release may also help you comprehend the "Power of Pine" by employing advanced programming techniques in Pine exhibiting code utilization in a most effective manner. One of the many tricks I applied here was providing floating point number safeties for _correlation(). While it cannot effectively use a floating point number, it won't error out in the event this should occur especially when applying "dominant cycle periods" to it, IF you might attempt this.
NOTICE: You may have observed there is a sqrt() custom function and you may be thinking... "Did he just sick and twistedly overwrite the Pine built-in sqrt() function?" The answer is... YES, I am and yes I did! One thing I noticed, is that it does provide slightly higher accuracy precision decimal places compared to the Pine built-in sqrt(). Be forewarned, "MY" sqrt() is technically speaking slower than snail snot compared to the native Pine sqrt(), so I wouldn't advise actually using it religiously in other scripts as a daily habit. It is seemingly doing quite well in combination with these simple calculations without being "sluggish". Lastly, of course you may always just delete the custom sqrt() function, via Pine Editor, and then the script will still operate flawlessly, yet more efficiently.
Features List Includes:
Dark Background - Easily disabled in indicator Settings->Style for "Light" charts or with Pine commenting
AND much, much more... You have the source!
The comments section below is solely just for commenting and other remarks, ideas, compliments, etc... regarding only this indicator, not others. When available time provides itself, I will consider your inquiries, thoughts, and concepts presented below in the comments section, should you have any questions or comments regarding this indicator. When my indicators achieve more prevalent use by TV members, I may implement more ideas when they present themselves as worthy additions. As always, "Like" it if you simply just like it with a proper thumbs up, and also return to my scripts list occasionally for additional postings. Have a profitable future everyone!

Stochastic RSI DivergencesAdapted from TradingView's RSI Divergences to instead use Stochastic RSI as the oscillator.

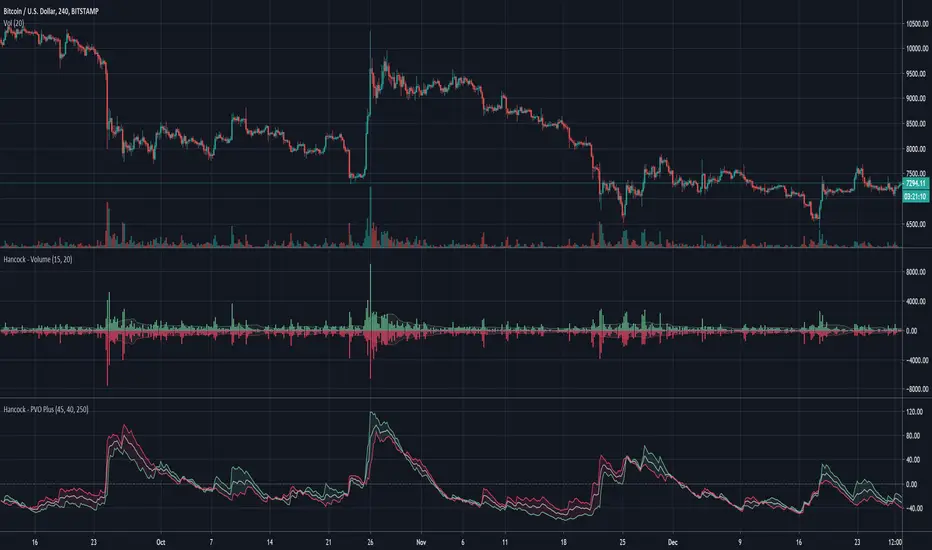
Hancock - PVO PlusEstimates the buy and sell volume of each candle by using a configurable lower time-frame and creates a momentum oscillator for buy and sell volume, PVO.
This indicator shows higher than normal volume when the silver line cross above 0 and lower than normal when below. The green and red oscillators give an indication of trend direction where the wider they are the stronger the trend.
Happy trading
Hancock
Elder's force index impulseForce Index is an oscillator. It combines volume with prices
to discover the force of bulls or bears behind every rally or decline.
It brings together three essential pieces of information the direction of price
change, its extent, and the volume during that change. It provides a practical way of
using volume for making trading decisions.
Force Index can be used in its raw form, but its signals stand out much more
clearly if we smooth it with a moving average. Using a short EMA of Force Index
helps pinpoint entry and exit points. Using a longer EMA helps confirm trends.
Efi long > 0 (bullish trend) and efi short < 0 = buy signal (green bar)
Efi long < 0 (bear trend) and efi short>0 = sell signal (red bar)

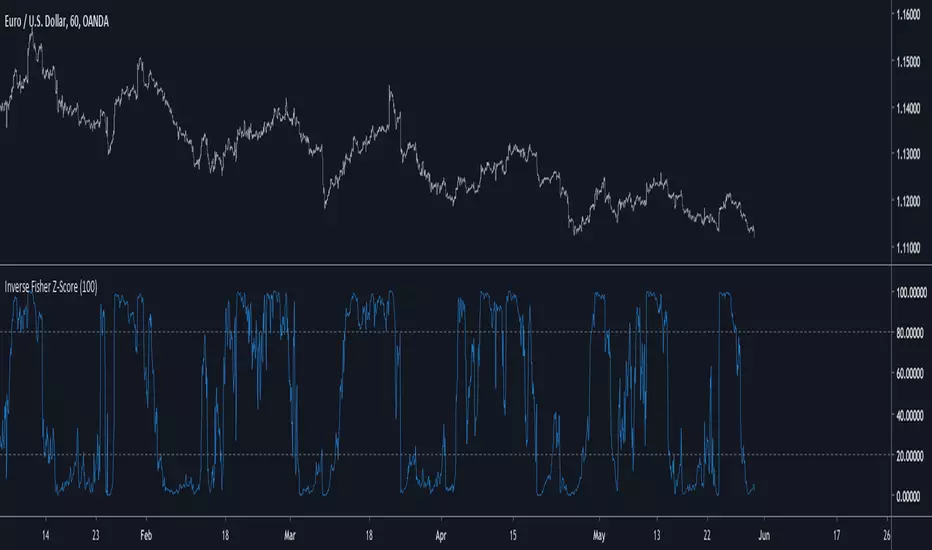
Inverse Fisher Z-Score Introduction
The inverse fisher transform or hyperbolic tangent function is a type os sigmoid function (sometime called squashing function) , those types of functions can rescale a result in a certain range and are widely used in artificial intelligence. More in depth the fisher transform can make the correlation coefficient of a time series normally distributed, in practice if you apply the fisher transform to the correlation coefficient between a time series and a linear function you will end up with an estimate of the z-score of the time series. The inverse transform however can do the contrary, it can take the z-score and transform it into a rough estimate of the correlation coefficient, if your z-score is not smooth then you will have a non-smooth estimate of the correlation coefficient, that's quite nice no ?
The Indicator
The inverse fisher transform of the z-score will produce results in a range of 1/-1, here however i will rescale in a range of 100/0 because its a standard range for oscillators in technical analysis. Values over 80 indicate an overbought market, under 20 an oversold market. The smooth option in the indicator settings will make the indicator use a linearly weighted moving average as input thus resulting in a smoother result.
The indicator with smooth option.
Conclusion
I presented a new oscillator indicator who use the inverse fisher transform of a z-score. Using the fisher transform and its inverse can give a new shape to your indicator, make sure to control the scale of your indicator before applying the fisher transform, the inverse transform should be applied to values in range of 1/-1 but you can use higher limits (2/-2,3/-3...) , however remember that higher limits will approximate an heavy side step function (square shape) . I hope you will find an use to this indicator.
Thanks for reading !
Stocks and RSI (IFR e Estocagem)A simple script that promotes a good visualization of the oscillators.
It shows a graph with two plots, one of relative strength index and one of stock, painting the red line when overbought and green when oversold.
Um script simples mas que promove uma boa visualização dos osciladores.
Mostra um gráfico com duas plotagens, uma do índice de força relativa e outra de estocagem, pintando a linha de vermelho quando está sobrecomprado e de verde quando sobrevendido.

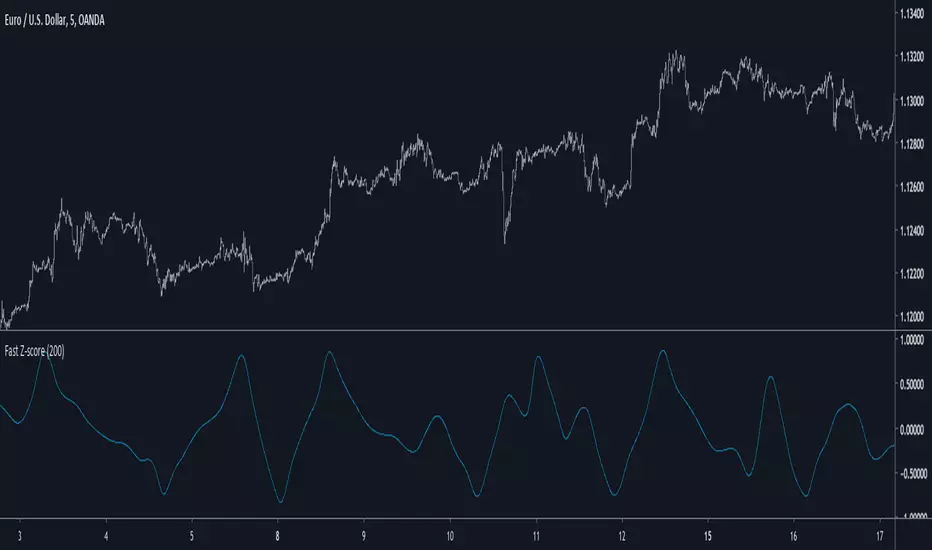
Fast Z-ScoreIntroduction
The ability of the least squares moving average to provide a great low lag filter is something i always liked, however the least squares moving average can have other uses, one of them is using it with the z-score to provide a fast smoothing oscillator.
The Indicator
The indicator aim to provide fast and smooth results. length control the smoothness.
The calculation is inspired from my sample correlation coefficient estimation described here
Instead of using the difference between a moving average of period length/2 and a moving average of period length , we use the difference between a lsma of period length/2 and a lsma of period length , this difference is then divided by the standard deviation. All those calculations use the price smoothed by a moving average as source.
The yellow version don't divide the difference by a standard deviation, you can that it is less reactive. Both version have length = 200
Conclusion
I presented a smooth and responsive version of a z-score, the result could be used to estimate an even faster lsma by using the line rescaling technique and our indicator as correlation coefficient.
Hope you like it, feel free to modify it and share your results ! :)
Notes
I have been requested a lot of indicators lately, from mt4 translations to more complex time series analysis methods, this accumulation of work made that it is impossible for me to publish those within a short period of time, also some are really complex. I apologize in advance for the inconvenience, i will try to do my best !
BossHouse - CCI ExtendedBossHouse - CCI Extended ( An Extended version of the Original CCI ).
The commodity channel index (CCI) is an oscillator originally introduced by Donald Lambert in 1980.
Guideline
________
Lambert's trading guidelines for the CCI focused on movements above +100 and below −100 to generate buy and sell signals. Because about 70 to 80 percent of the CCI values are between +100 and −100, a buy or sell signal will be in force only 20 to 30 percent of the time. When the CCI moves above +100, a security is considered to be entering into a strong uptrend and a buy signal is given. The position should be closed when the CCI moves back below +100. When the CCI moves below −100, the security is considered to be in a strong downtrend and a sell signal is given. The position should be closed when the CCI moves back above −100.
Since Lambert's original guidelines, traders have also found the CCI valuable for identifying reversals. The CCI is a versatile indicator capable of producing a wide array of buy and sell signals.
CCI can be used to identify overbought and oversold levels. A security would be deemed oversold when the CCI dips below −100 and overbought when it exceeds +100. From oversold levels, a buy signal might be given when the CCI moves back above −100. From overbought levels, a sell signal might be given when the CCI moved back below +100.
As with most oscillators, divergences can also be applied to increase the robustness of signals. A positive divergence below −100 would increase the robustness of a signal based on a move back above −100. A negative divergence above +100 would increase the robustness of a signal based on a move back below +100.
Trend line breaks can be used to generate signals. Trend lines can be drawn connecting the peaks and troughs. From oversold levels, an advance above −100 and trend line breakout could be considered bullish. From overbought levels, a decline below +100 and a trend line break could be considered bearish.
Settings
_______
Show 0 line
Lenght
Source
Any help and suggestions will be appreciated.
Marcos Issler @ Isslerman
marcos@bosshouse.com.br

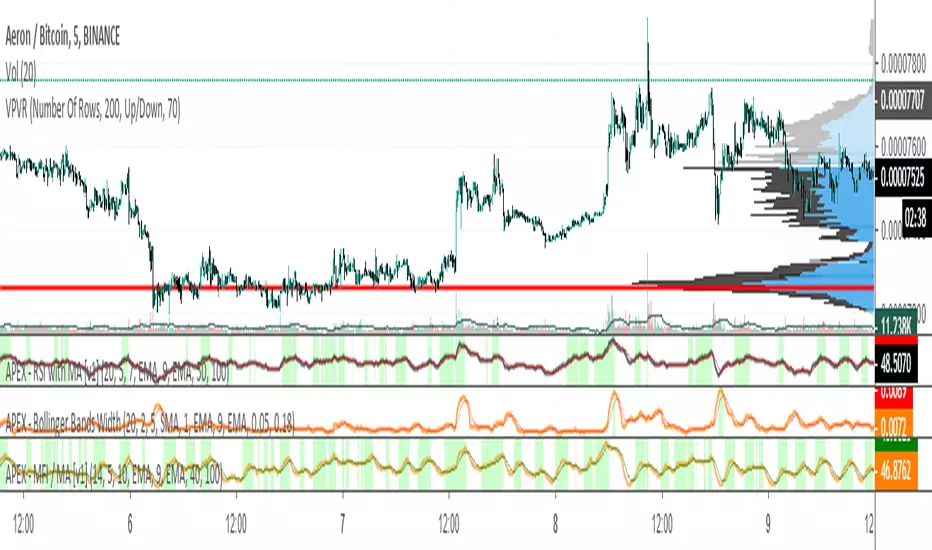
APEX - MFI / MA [v1]The Money Flow Index is a volume indicator used for measuring buying and selling pressure. This is done by analyzing both price and volume. The MFI's calculation generates a value that is then plotted as a line that moves within a range of 0-100, making it an oscillator. When the MFI rises, this indicates an increase in buying pressure. When it falls, this indicates an increase in selling pressure. The Money Flow Index can generate several signals, most notably; overbought and oversold conditions and divergences.
You are also able to add addition smoothing and or a moving average on top of the MFI. This can help you trade only areas with increasing buying pressure.