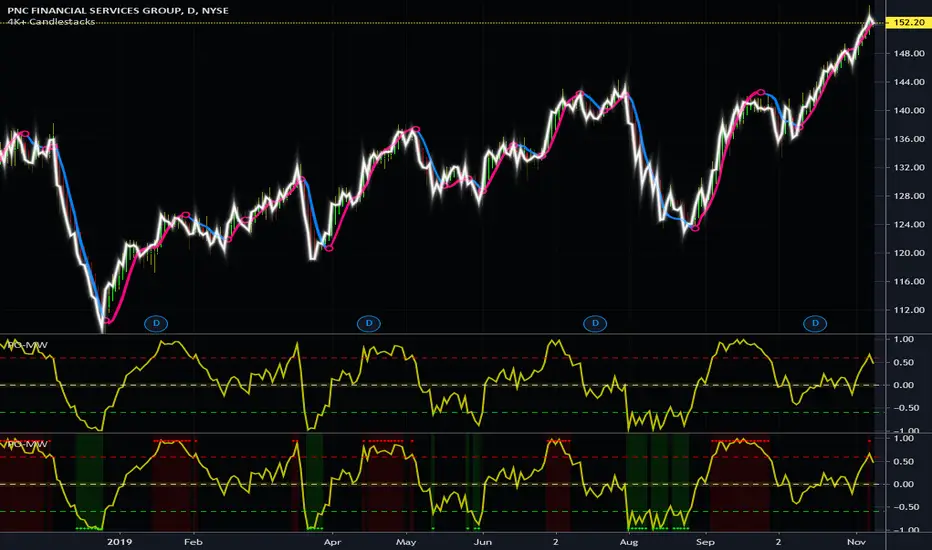
Projection Oscillator - Mel Widner, Ph.D.For any Mel Widner, Ph.D fans out there, I present this decades old "Projection Oscillator" employing PSv4.0, originally formulated by Mel Widner for TASC - July of 1995 Traders Tips. Just when you may have thought it was the end of the evolutionary line for Mel Widner technology, it's not! Basically it's a hybridization of linear regression, banding, and a stochastic rolled into one. It's purpose is intended to help identify reversal points.
While working on another member's project, I discovered other implementations on TV and a few scarcely found on the internet, they are not entirely correct and not in a package like this. I'm submitting this as a complimentary indicator for their trading system AND also for the TV community for hybridized indicator evolution. My implementation is a heavily modified version of the original indicator using novel techniques, surpassing Widner's original intended design.
Utilizing the "Power of Pine", I included the maximum amount of features I could surmise in an ultra small yet impressive package. Configurations are displayed above in multiple scenarios that should be suitable for most traders. Of notable mention, the original design was a range from 0-100 just like any other stochastic, but I rescaled the oscillator more towards a zero mean unity scale(+/-1.0), while still leaving the waveforms completely intact.
Features List Includes:
Dark Background - Easily disabled in indicator Settings->Style for "Light" charts or with Pine commenting
AND much, much more... you have the source!
For those of you who are new to Pine Script, this script also may help you understand advanced programming techniques in Pine and how they may be utilized in a most effective manner. I would like to see Tradingview become the go to platform for the best indicators attainable with this contribution to the TV community. This is commonly what my dense intricate code looks like behind the veil. If you are wondering why there is no notes, that's because the notation is in the variable naming. If you wish to contribute additional ideas, please do so below in the comments about all things Pine in regards to this indicator.
NOTICE: Copy pasting bandits who may be having nefarious thoughts, DO NOT attempt this, because this may violate Tradingview's terms, conditions and/or house rules regarding publishing and "fair" reuse of code. "WE" are always watching the TV community vigilantly for mischievous behaviors and actions that exploit well intended authors for the purpose of unscrupulously increasing brownie points in reputation scores. Hiding behind a "protected" wall may not protect you from investigation and account penalization by TV staff. Be respectful, and don't just throw a meaningless feature in there, then branding it as "your" gizmo if you reuse this code for publishing another indicator. Fair enough? Alrighty then... I firmly believe in "innovating" future state-of-the-art indicators, and please contact me if you wish to do so.
The comments section below is solely just for commenting and other remarks, ideas, compliments, etc... regarding only this indicator, not others. When available time provides itself, I will consider your inquiries, thoughts, and concepts presented below in the comments section if you do have any questions or comments regarding this indicator. When my indicators achieve more prevalent use by TV members, I may implement more ideas when they present themselves as worthy additions. As always, "Like" it if you simply just like it with a proper thumbs up, and also return to my scripts list occasionally for additional postings. Have a profitable future everyone!
Pesquisar nos scripts por "oscillator"
Bagot Price Oscillator "BPO"This is BP Oscillator / Bagot Price Oscillator
It is part of the Rabbit hole algorithm/ strategy which jets to be revealed
but works stand aloe very good
Initial idea: When lines cross it signals you change of trend
but since reversal trading is a sucker game, you should wait for your baseline to get broken in the signal direction
blue - long
red - short
Baseline options: any style of MA or line on chart indicator, speed of baseline for this oscillator needs to be on the faster side of mid-speed settings, ex.: if you would be using MA that would be around 15, for HMA round 20 -30
Important
The slower line "50" of the BPO needs to be set to: is centered

Bilateral Stochastic Oscillator StrategyIntroduction
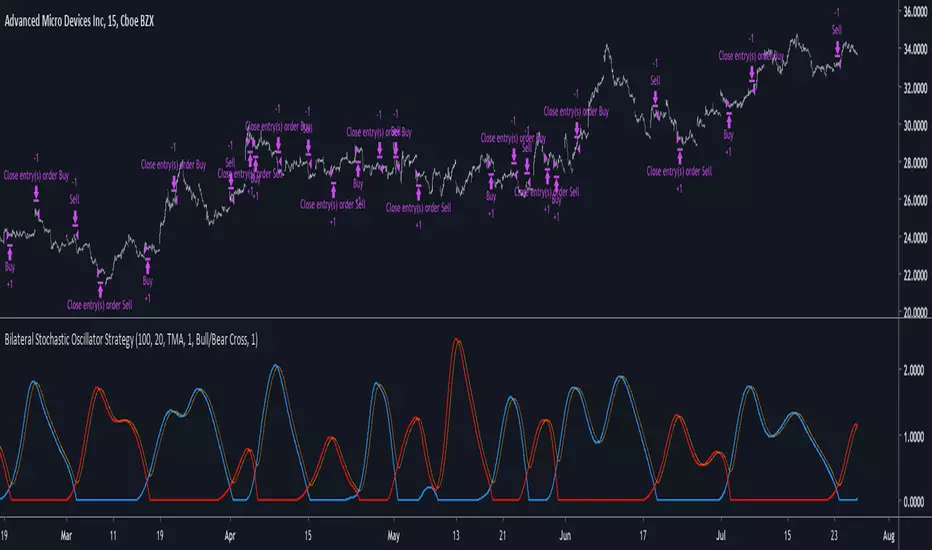
Strategy based on the bilateral stochastic oscillator, this oscillator aim to detect trends and possible reversal points of the current trend. The oscillator is composed of 1 bull line in blue and 1 bear line in red as well as a signal line in orange, the strategy have many options such as two different strategy framework and a martingale mode. If you require more information about the indicator go check it into my uploaded indicators.
Strategy Frameworks
There are two frameworks available that can be selected from the strategy settings window. Both have the same closing conditions, the "Bull/Bear Cross" entry conditions are :
Buy : when the bull line cross over the bear line
Sell : when the bear line cross over the bull line
The "Signal Cross" entry conditions are :
Buy : when the bull line cross over the signal line
Sell : when the bear line cross over the signal line
Both have the same close conditions that is : close when bull/bear cross under the signal line.
Introduction To Martingale
The martingale money management system consist to double the order size after a loosing trade and can be described as a 2^x where x is the current number of loosing trades since the last win trade, when we win a trade the order size return to the default order size. Therefore our order size function is based on exponential growth.
This system enable the trader to win back his previous losses plus a potential profit, martingales must always be used with stops and sometimes take profits in order to get control in a strategy.
It must always be taken into account that in a series of losses the balance can exponentially decay thus ending to 0 in a matter of trades, this is why it is not recommended to use such system. The strategy allow you to select a martingale multiplier that can be inferior to 2 thus limiting risks, a multiplied of 1 disable the martingale.
Results
Those are the some statistics of the strategy applied to some forex majors by using the default settings in a time frames of 15 minutes.
//-------------------------------------------------------
EURUSD - Order Size 1000 - Spread 0.0002
Profit : $ 21.08
Trades : 19
PP : 57.89 %
Profit Factor : 3.228
Max Drawdown : -$ 3.81
Average Trade : $ 1.11
//-------------------------------------------------------
GBPUSD - Order Size 1000 - Spread 0.0002
Profit : $ 2.31
Trades : 20
PP : 55 %
Profit Factor : 0.938
Max Drawdown : -$ 20.29
Average Trade : $ 0.12
//-------------------------------------------------------
EURAUD - Order Size 1000 - Spread 0.0002
Profit : -$ 9.22
Trades : 20
PP : 40 %
Profit Factor : 0.698
Max Drawdown : -$ 23.44
Average Trade : $ 0.46
//-------------------------------------------------------
EURCHF - Order Size 1000 - Spread 0.0002
Profit : $ 1.58
Trades : 24
PP : 54.17 %
Profit Factor : 1.103
Max Drawdown : -$ 7.23
Average Trade : $ 0.07
//-------------------------------------------------------
Conclusions
Based on the results the strategy does not posses the sufficient performance in order to apply a martingale or any other growth systems as order size. Parameters might be subject to drastic changes depending on the market/time-frame in order to return long-term positive results. I let you draw your conclusions.
Stationary Extrapolated Levels OscillatorIntroduction
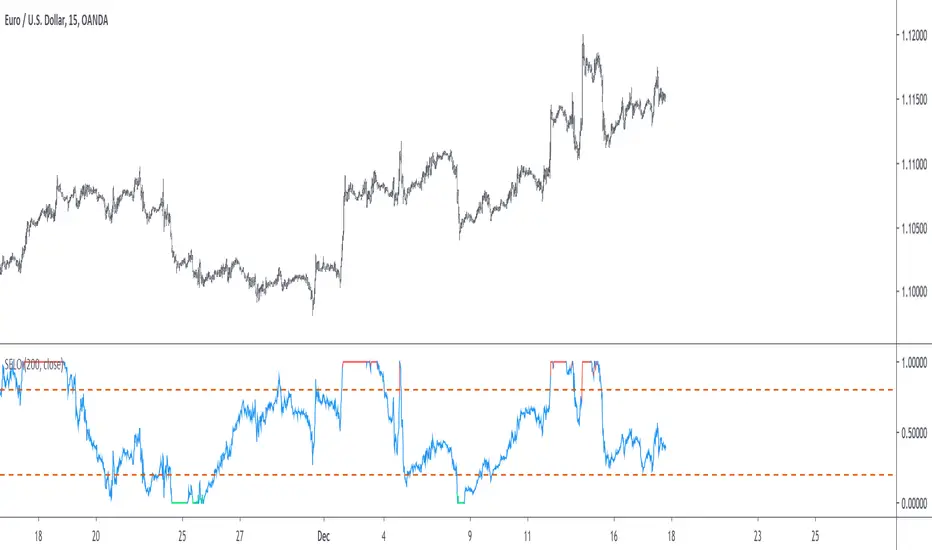
The oscillator version of the stationary extrapolated levels indicator. The methodology behind the extrapolated levels where to minimize the risk of making a decision based only on a forecast, therefore the indicator plotted levels in order to determine possible reversal points, signals where generated when the detrended series crossed over/under those levels.
The Indicator
First we detrend the price, this is because forecasting the trend is often harder than a series without trend (stationarity > non-stationarity) , then we forecast the detrended price with a linear extrapolation over a period of length and apply a max/min filter twice to the forecast, the max/min filters are just the highest and lowest function in pine. So the max/min filter have lag length/2 , by applying it two times we have a lag of length which is the period of the forecast. Because we use highest and lowest we can apply min-max normalization in the form of :
x' = (x - min(x, min'))/(max(x,max') - min(x, min'))
where x is the detrended price, max' the highest of the forecast of x and min' the lowest of the forecast of x . This result in a scaled oscillator in a range of (1,0),
When the indicator is equal to 1 or 0 there are high chances of reversals, more in depth this mean that the detrended price have crossed the highest/lowest of the forecast, when the indicator is equal to 0 or 1 for a long time this mean that the forecast was quite inaccurate, you can minimize risk by focusing on the cross between the detrended price and the 0.8/0.2 levels.
Conclusion
I've shown an oscillator version of my previous "Stationary extrapolated levels" indicator, the method involving taking the highest and lowest of the forecast is a great way to minimize the risk involved by time-series forecasting driven decisions. So i hope you find an use to it.
Thanks for reading !
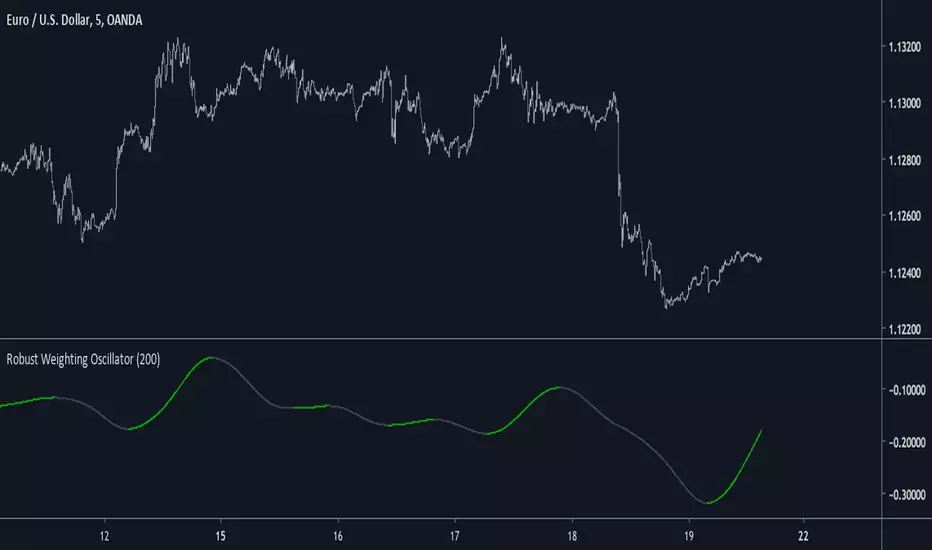
Robust Weighting OscillatorIntroduction
A simple oscillator using a modified lowess architecture, good in term of smoothness and reactivity.
Lowess Regression
Lowess or local regression is a non-parametric (can be used with data not fitting a normal distribution) smoothing method. This method fit a curve to the data using least squares.
In order to have a lowess regression one must use tricube kernel for the weightings w , the weightings are determined using a k-nearest-neighbor model.
lowess is then calculated like so :
Σ (wG(y-a-bx)^2)
Our indicator use G , a , b and remove the square as well as replacing x by y
Conclusion
The oscillator is simple and nothing revolutionary but its still interesting to have new indicators.
Lowess would be a great method to be made on pinescript, i have an estimate but its not that good. Some codes use a simple line equation in order to estimate a lowess smoother, i can describe it as ax + b where a is a smooth oscillator, b some kind of filter defined by lp + bp with lp a smooth low pass filter and bp a bandpass filter, x is a variable dependent of the smoothing span.
John Ehlers Universal Oscillator [mwlang]This version of John Ehlers Universal Oscillator fixes a degrees to radians bug in LazyBear's version published here:
APEX - Absolute Price Oscillator [v1]The Absolute Price Oscillator is calculated as a difference of two moving averages of an asset and is expressed as an absolute value. It rates the strength of the trend. This Oscillator can be used primarily as a filter for stronger trends or for coin specific strategies.
Values are a coin and Moving average base specific.
[astropark] MACD, RSI+, Awesome Oscillator, DMI, ADX, OBV//******************************************************************************
// Copyright by astropark v4.0.0
// MACD, RSI+, Awesome Oscillator, DMI, ADX, OBV
// 24/10/2018 Added RSI with Center line to have clear glue of current trend
// 10/12/2018 Added MACD
// 13/12/2018 Added multiplier for MACD in order to make it clearly visible over RSI graph
// 11/01/2019 Added Awesome Oscillator (AO)
// 11/01/2019 Added Directional Movement Index (DMI) with ADX
// 14/01/2019 Added On Balance Volume (OBV)
//******************************************************************************

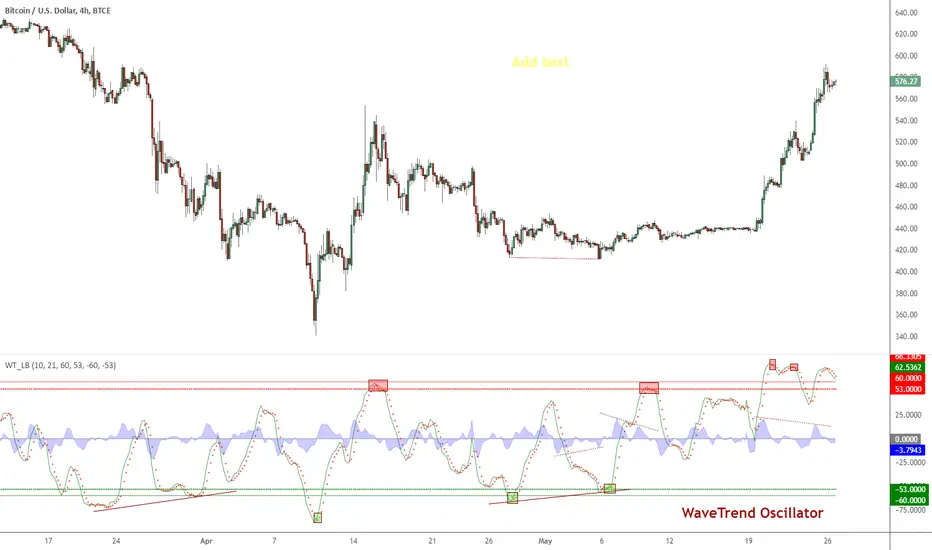
WaveTrend Oscillator (Dark Mode) [Krypt]My WaveTrend Oscillator indicator optimized for dark backgrounds. The light mode is available here:

AWESOME OSCILLATOR V2 by KIVANCfr3762AWESOME OSCILLATOR V2 by KIVANC @fr3762
CONVERTING THE OSCILLATOR to a curved line and added a 7 period SMA as a signal line,
crosses are BUY or SELL signals like in MACD
Buy: when AO line crosses above signal line
Sell: when Signal line crosses above AO line
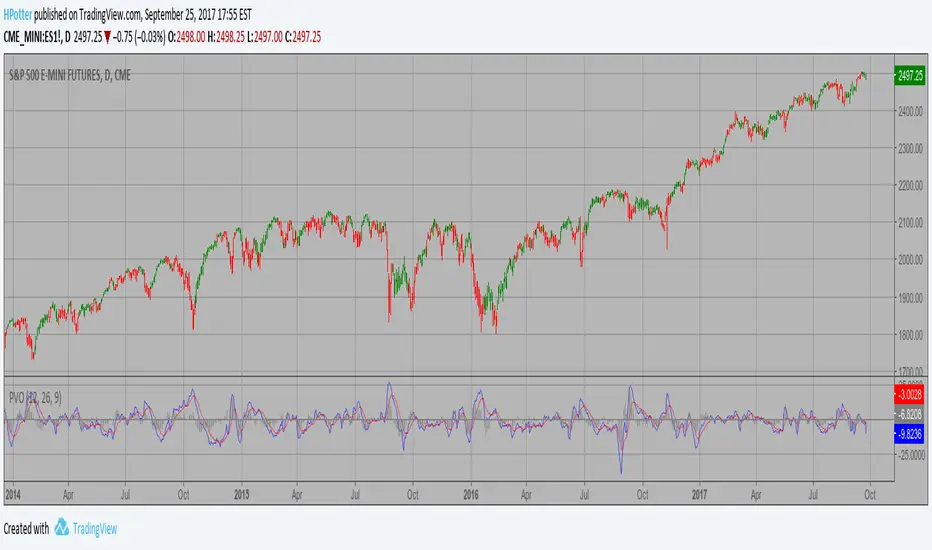
Percentage Volume Oscillator (PVO) Backtest The Percentage Volume Oscillator (PVO) is a momentum oscillator for volume.
PVO measures the difference between two volume-based moving averages as a
percentage of the larger moving average. As with MACD and the Percentage Price
Oscillator (PPO), it is shown with a signal line, a histogram and a centerline.
PVO is positive when the shorter volume EMA is above the longer volume EMA and
negative when the shorter volume EMA is below. This indicator can be used to define
the ups and downs for volume, which can then be use to confirm or refute other signals.
Typically, a breakout or support break is validated when PVO is rising or positive.
You can change long to short in the Input Settings
WARNING:
- For purpose educate only
- This script to change bars colors.

Percentage Volume Oscillator (PVO) Strategy The Percentage Volume Oscillator (PVO) is a momentum oscillator for volume.
PVO measures the difference between two volume-based moving averages as a
percentage of the larger moving average. As with MACD and the Percentage Price
Oscillator (PPO), it is shown with a signal line, a histogram and a centerline.
PVO is positive when the shorter volume EMA is above the longer volume EMA and
negative when the shorter volume EMA is below. This indicator can be used to define
the ups and downs for volume, which can then be use to confirm or refute other signals.
Typically, a breakout or support break is validated when PVO is rising or positive.
WARNING:
This script to change bars colors.
Oscillator Moving Average (OsMA)This code for Oscillator of Moving Averages (OsMA) is based on MACD 4C indicator code published by vkno422 . Many thanks to vkno422. I have borrowed the concept of 4 colours which I find very useful.
For those who are not familiar with OsMA, it is histogram of difference between MACD (oscillator) and its MA (signal line). The zero line cross over of this indicator is used in many strategies.
This version includes MACD & its signal line together with OsMA histogram. I have programmed flexibility for switching OFF/ON individual indicator components as well as changing the periods for various moving averages.
I am dedicating this indicator to the TV trading community hoping that people will find it useful.

Indicator: WaveTrend Oscillator [WT]WaveTrend Oscillator is a port of a famous TS/MT indicator.
When the oscillator is above the overbought band (red lines) and crosses down the signal (dotted line), it is usually a good SELL signal. Similarly, when the oscillator crosses above the signal when below the Oversold band (green lines), it is a good BUY signal.
I have marked some cross-overs in the above chart. As you can see, they are *not* the only useful signals WT generates. Try it on your instrument and let me know what you think.
Jenkins OscillatorAn oscillator designed to capture price movement relative to recent intra-candle volatility. Z-score normalization is applied to smoothed price and therefore should be read in terms of standard deviation AND direction.

Frequency Momentum Oscillator [QuantAlgo]🟢 Overview
The Frequency Momentum Oscillator applies Fourier-based spectral analysis principles to price action to identify regime shifts and directional momentum. It calculates Fourier coefficients for selected harmonic frequencies on detrended price data, then measures the distribution of power across low, mid, and high frequency bands to distinguish between persistent directional trends and transient market noise. This approach provides traders with a quantitative framework for assessing whether current price action represents meaningful momentum or merely random fluctuations, enabling more informed entry and exit decisions across various asset classes and timeframes.
🟢 How It Works
The calculation process removes the dominant trend from price data by subtracting a simple moving average, isolating cyclical components for frequency analysis:
detrendedPrice = close - ta.sma(close , frequencyPeriod)
The detrended price series undergoes frequency decomposition through Fourier coefficient calculation across the first 8 harmonics. For each harmonic frequency, the algorithm computes sine and cosine components across the lookback window, then derives power as the sum of squared coefficients:
for k = 1 to 8
cosSum = 0.0
sinSum = 0.0
for n = 0 to frequencyPeriod - 1
angle = 2 * math.pi * k * n / frequencyPeriod
cosSum := cosSum + detrendedPrice * math.cos(angle)
sinSum := sinSum + detrendedPrice * math.sin(angle)
power = (cosSum * cosSum + sinSum * sinSum) / frequencyPeriod
Power measurements are aggregated into three frequency bands: low frequencies (harmonics 1-2) capturing persistent cycles, mid frequencies (harmonics 3-4), and high frequencies (harmonics 5-8) representing noise. Each band's power normalizes against total spectral power to create percentage distributions:
lowFreqNorm = totalPower > 0 ? (lowFreqPower / totalPower) * 100 : 33.33
highFreqNorm = totalPower > 0 ? (highFreqPower / totalPower) * 100 : 33.33
The normalized frequency components undergo exponential smoothing before calculating spectral balance as the difference between low and high frequency power:
smoothLow = ta.ema(lowFreqNorm, smoothingPeriod)
smoothHigh = ta.ema(highFreqNorm, smoothingPeriod)
spectralBalance = smoothLow - smoothHigh
Spectral balance combines with price momentum through directional multiplication, producing a composite signal that integrates frequency characteristics with price direction:
momentum = ta.change(close , frequencyPeriod/2)
compositeSignal = spectralBalance * math.sign(momentum)
finalSignal = ta.ema(compositeSignal, smoothingPeriod)
The final signal oscillates around zero, with positive values indicating low-frequency dominance coupled with upward momentum (trending up), and negative values indicating either high-frequency dominance (choppy market) or downward momentum (trending down).
🟢 How to Use This Indicator
→ Long/Short Signals: the indicator generates long signals when the smoothed composite signal crosses above zero (indicating low-frequency directional strength dominates) and short signals when it crosses below zero (indicating bearish momentum persistence).
→ Upper and Lower Reference Lines: the +25 and -25 reference lines serve as threshold markers for momentum strength. Readings beyond these levels indicate strong directional conviction, while oscillations between them suggest consolidation or weakening momentum. These references help traders distinguish between strong trending regimes and choppy transitional periods.
→ Preconfigured Presets: three optimized configurations are available with Default (32, 3) offering balanced responsiveness, Fast Response (24, 2) designed for scalping and intraday trading, and Smooth Trend (40, 5) calibrated for swing trading and position trading with enhanced noise filtration.
→ Built-in Alerts: the indicator includes three alert conditions for automated monitoring - Long Signal (momentum shifts bullish), Short Signal (momentum shifts bearish), and Signal Change (any directional transition). These alerts enable traders to receive real-time notifications without continuous chart monitoring.
→ Color Customization: four visual themes (Classic green/red, Aqua blue/orange, Cosmic aqua/purple, Custom) allow chart customization for different display environments and personal preferences.

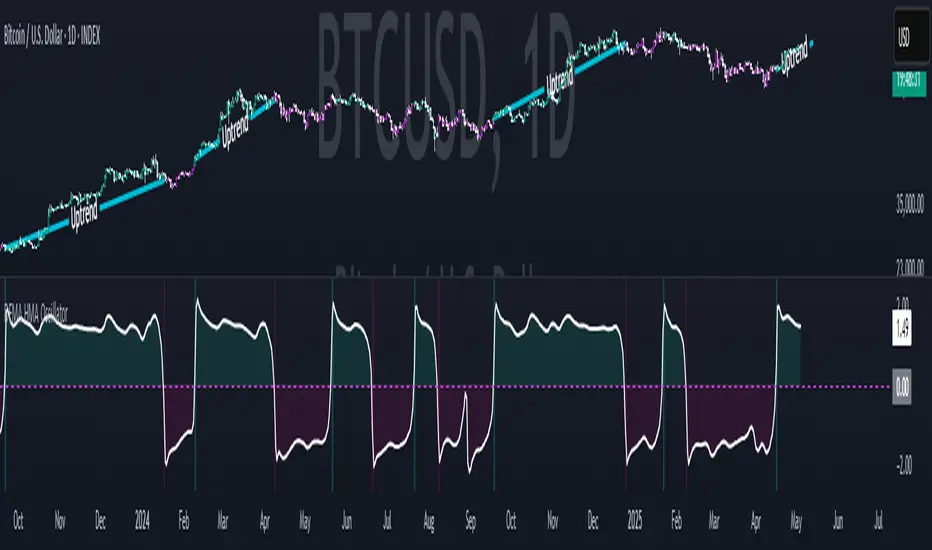
DEMA HMA Z-score OscillatorThis custom oscillator combines the power of the Hull Moving Average (HMA) with the Z-Score to identify momentum shifts and potential trend reversals. The Z-Score measures how far the current HMA is from its historical mean, helping to spot overbought or oversold conditions.
Uptrend: Long signals are generated when the Z-Score crosses above the defined Long Threshold.
Downtrend: Short signals are triggered when the Z-Score drops below the Short Threshold.
Visuals: The Z-Score is plotted along with background color changes and fills to clearly indicate trend strength. Green fills highlight uptrends, while pink fills indicate downtrends.
Alerts: Alerts are available for both long and short conditions based on Z-Score crossovers.
Customizable Inputs:
HMA Length
Smoothing Length (for DEMA)
Z-Score Length
Long and Short Thresholds
This indicator is ideal for detecting momentum shifts, confirming trend strength, and helping to time entry/exit points in your trading strategy.
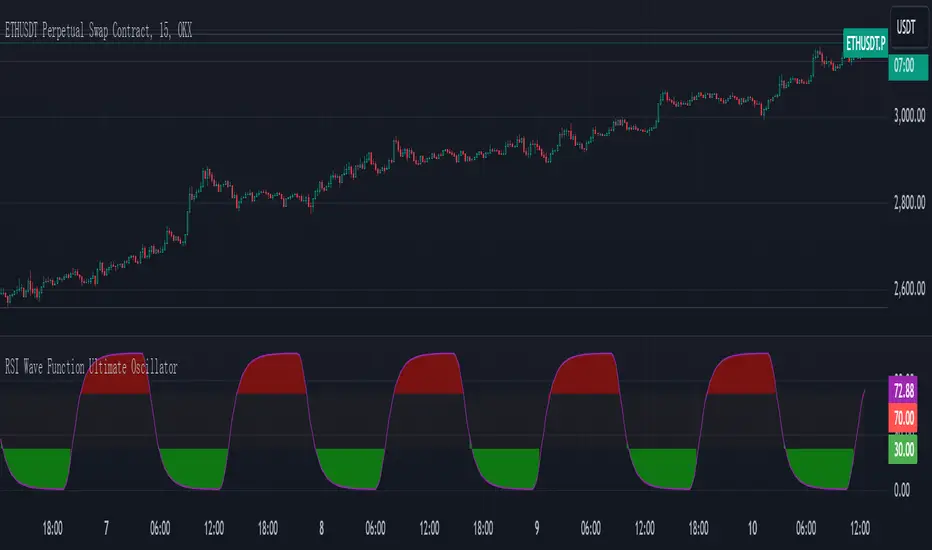
RSI Wave Function Ultimate OscillatorEnglish Explanation of the "RSI Wave Function Ultimate Oscillator" Pine Script Code
Understanding the Code
Purpose:
This Pine Script code creates a custom indicator that combines the Relative Strength Index (RSI) with a wave function to potentially provide more nuanced insights into market dynamics.
Key Components:
* Wave Function: This is a custom calculation that introduces a sinusoidal wave component to the price data. The frequency parameter controls the speed of the oscillation, and the decay factor determines how quickly the influence of past prices diminishes.
* Smoothed Signal: The wave function is applied to the closing price to create a smoothed signal, which is essentially a price series modulated by a sine wave.
* RSI: The traditional RSI is then calculated on this smoothed signal, providing a measure of the speed and change of price movements relative to recent price changes.
Calculation Steps:
* Wave Function Calculation:
* A sinusoidal wave is generated based on the bar index and the frequency parameter.
* The wave is combined with the closing price using a weighted average, where the decay factor determines the weight given to previous values.
* RSI Calculation:
* The RSI is calculated on the smoothed signal using a standard RSI formula.
* Plotting:
* The RSI values are plotted on a chart, along with horizontal lines at 70 and 30 to indicate overbought and oversold conditions.
* The area between the RSI line and the overbought/oversold lines is filled with color to visually represent the market condition.
Interpretation and Usage
* Wave Function: The wave function introduces cyclical patterns into the price data, which can help identify potential turning points or momentum shifts.
* RSI: The RSI provides a measure of the speed and change of price movements relative to recent price changes. When applied to the smoothed signal, it can help identify overbought and oversold conditions, as well as potential divergences between price and momentum.
* Combined Indicator: The combination of the wave function and RSI aims to provide a more sensitive and potentially earlier indication of market reversals.
* Signals:
* Crossovers: Crossovers of the RSI line above or below the overbought/oversold lines can be used to generate buy or sell signals.
* Divergences: Divergences between the price and the RSI can indicate a weakening trend.
* Oscillations: The amplitude and frequency of the oscillations in the RSI can provide insights into the strength and duration of market trends.
How it Reflects Market Volatility
* Amplified Volatility: The wave function can amplify the volatility of the price data, making it easier to identify potential turning points.
* Smoothing: The decay factor helps to smooth out short-term fluctuations, allowing the indicator to focus on longer-term trends.
* Sensitivity: The combination of the wave function and RSI can make the indicator more sensitive to changes in market momentum.
In essence, this custom indicator attempts to enhance traditional RSI analysis by incorporating a cyclical component that can potentially provide earlier signals of market reversals.
Note: The effectiveness of this indicator will depend on various factors, including the specific market, time frame, and the chosen values for the frequency and decay parameters. It is recommended to conduct thorough backtesting and optimize the parameters to suit your specific trading strategy.
Probabilistic Trend Oscillator** MACD PLOTS ARE NOT PART OF THE INDICATOR IT IS FOR COMPARSION**
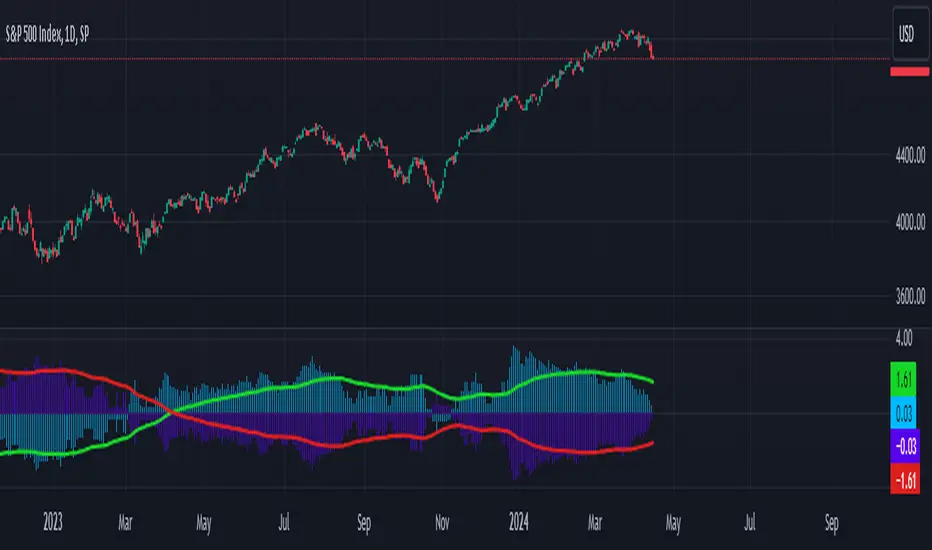
The "Probabilistic Trend Oscillator" is a technical indicator designed to measure trend strength and direction by analyzing price behavior relative to a moving average over both long-term and short-term periods. This indicator incorporates several innovative features, including probabilistic trend detection, enhanced strength scaling, and percentile-based thresholds for identifying potential trend reversals.
Key Components
Inputs:
The indicator allows users to customize several key parameters:
EMA Length defines the period for the Exponential Moving Average (EMA), which serves as a baseline to classify trend direction.
Long and Short Term Lengths provide customizable periods for analyzing trend strength over different timeframes.
Signal Line Length is used to smooth the trend strength data, helping users spot more reliable trend signals.
Extreme Value Lookback Length controls how far back to look when calculating percentile thresholds, which are used to identify overbought and oversold zones.
Trend Classification:
The indicator categorizes price behavior into four conditions:
Green: Price closes above the open and is also above the EMA, suggesting a strong upward trend.
Red: Price closes below the open but is above the EMA, indicating weaker upward pressure.
Green1: Price closes above the open but remains below the EMA, representing weak upward movement.
Red1: Price closes below the open and the EMA, signaling a strong downward trend.
Trend Strength Calculation:
The script calculates long-term and short-term trend values based on the frequency of these trend conditions, normalizing them to create probabilistic scores.
It then measures the difference between the short-term and long-term trend values, creating a metric that reflects the intensity of the current trend. This comparison provides insight into whether the trend is strengthening or weakening.
Enhanced Trend Strength:
To emphasize significant movements, the trend strength metric is scaled by the average absolute price change (distance between close and open prices). This creates an "enhanced trend strength" value that highlights periods with high momentum.
Users can toggle between two variations of trend strength:
Absolute Trend Strength is a straightforward measure of the trend's force.
Relative Trend Strength accounts for deviations between short term and long term values, focusing on how current price action differs from a long term behavior.
Percentile-Based Thresholds:
The indicator calculates percentile thresholds over the specified lookback period to mark extreme values:
The 97th and 3rd percentiles act as overbought and oversold zones, respectively, indicating potential reversal points.
Intermediate levels (75th and 25th percentiles) are added to give additional context for overbought or oversold conditions, creating a probabilistic range.
Visualization:
The selected trend strength value (either absolute or relative) is plotted in orange.
Overbought (green) and oversold (red) percentiles are marked with dashed lines and filled in blue, highlighting potential reversal zones.
The signal line—a smoothed EMA of the trend strength—is plotted in white, helping users to confirm trend changes.
A gray horizontal line at zero acts as a baseline, further clarifying the strength of upward vs. downward trends.
Summary
This indicator provides a flexible, probabilistic approach to trend detection, allowing users to monitor trend strength with customizable thresholds and lookback periods. By combining percentile-based thresholds with enhanced trend strength scaling, it offers insights into market reversals and momentum shifts, making it a valuable tool for both trend-following and counter-trend trading strategies.

Bayesian Bias OscillatorWhat is a Bayes Estimator?
Bayesian estimation, or Bayesian inference, is a statistical method for estimating unknown parameters of a probability distribution based on observed data and prior knowledge about those parameters. At first , you will need a prior probability distribution, which is a prior belief about the distribution of the parameter that you are interested in estimating. This distribution represents your initial beliefs or knowledge about the parameter value before observing any data. Second , you need a likelihood function, which represents the probability of observing the data given different values of the parameter. This function quantifies how well different parameter values explain the observed data. Then , you will need a posterior probability distribution by combining the prior distribution and the likelihood function to obtain the posterior distribution of the parameter. The posterior distribution represents the updated belief about the parameter value after observing the data.
Bayesian Bias Oscillator
This tool calculates the Bayes bias of returns, which are directional probabilities that provide insight on the "trend" of the market or the directional bias of returns. It comes with two outputs: the default one, which is the Z-Score of the Bayes Bias, and the regular raw probability, which can be switched on in the settings of the indicator.
The Z-Score output value doesn't tell you the probability, but it does tell you how much of a standard deviation the value is from the mean. It uses both probabilities, the probability of a positive return and the probability of a negative return, which is just (1 - probability of a positive return).
The probability output value shows you the raw probability of a positive return vs. the probability of a negative return. The probability is the value of each line plotted (blue is the probability of a positive return, and purple is the probability of a negative return).
Market Trend OscillatorMarket Trend Oscillator segments the market into ranged bound and trending aspect. The threshold level segregates both types of market. With higher level, both the risk and reward lower down.
The MTO indicator, is based on Standard Deviation, difference between highest high and lowest low, ATR and ADR. There are two different volatility aspect which are:
Volatility according to the movement of one price e.g. closing price.
Volatility according to the candles.
The minimum of both these aspects gives an insight into the volatility of the market. To segregate a dynamic value with ATR and ADR is used with the threshold level. Moreover, the volatilities can be smoothed to have a smoother decision making.

Triple Trend OscillatorI developed the Triple Trend Oscillator (TTO) to combine the strengths of Supertrend, Sequential Filtered Trend, and Trend Magic indicators, offering a comprehensive view of market trends. This tool is designed to filter out market noise, highlight clear trends, and incorporate volume analysis to pinpoint momentum behind market moves.

Volume Flow Oscillator (VFO)I created the Volume Flow Oscillator (VFO) to explore the intricate interplay between volume and price movements over a specific lookback period. This tool contrasts volumes that move in sync with the price against those that move in opposition, signaling potential overbought or oversold territories. To determine the direction, I compare the current price to its value four periods back, shedding light on underlying bullish or bearish momentum. The VFO enriches my analysis and decision-making by offering a detailed perspective on how volume trends correlate with price changes. Its color-coded visuals are crucial for highlighting optimal trading points based on volume dynamics.
