Volume Comparison with Buyer/Seller PressureTHIS indicator is well-structured and provides a comprehensive way to analyze volume alongside buyer and seller pressure. This indicator helps traders analyze volume dynamics in the stock or cryptocurrency market while simultaneously assessing buyer and seller pressure. Its use case revolves around identifying strong buying or selling activity, neutral conditions, and volume trends over different time periods. Below is a breakdown of how to use this indicator:
This Pine Script indicator helps traders analyze volume dynamics in the stock or cryptocurrency market while simultaneously assessing buyer and seller pressure. Its use case revolves around identifying strong buying or selling activity, neutral conditions, and volume trends over different time periods. Below is a breakdown of how to use this indicator:
Key Features and Use Case
Volume-Based Insights:
Displays daily volume and compares it to the 3-day, 5-day, 10-day, and 20-day moving averages of volume. Helps traders identify days with unusual volume spikes relative to historical averages, signaling potential reversals or breakouts.
Buyer and Seller Pressure:
Measures buyer pressure: how much the closing price dominates the trading range of the day.
Measures seller pressure: how much the opening price dominates the trading range of the day.
Highlights areas where buying or selling pressure is particularly strong (≥ 0.75).
Background Signals:
Green Background: Strong buyer pressure (indicative of potential upward momentum).
Red Background: Strong seller pressure (indicative of potential downward momentum).
Gray Background: Neutral market conditions (neither buying nor selling dominance).
Alerts:
Alerts traders when:
Strong buying signals are detected.
Strong selling signals are detected.
The market is neutral, with neither buyers nor sellers in control.
Decision-Making Aid:
Combines volume analysis with price action (buyer/seller pressure) to help traders identify:
Potential breakout opportunities.
Reversal points.
Neutral zones where a trader might avoid trading due to indecision in the market.
How to Use It in Trading:------->
Add the Indicator:
Apply this Indicator to your Trading View chart to start visualizing the buyer/seller pressure and volume averages.
Interpret Volume Trends:
Look for days when daily volume significantly exceeds the 3-day, 5-day, 10-day, or 20-day average.
These could indicate:
A breakout when aligned with strong buyer pressure.
A sell-off when aligned with strong seller pressure.
React to Background Colors:
* Green Background (Strong Buyer Pressure):
Suggests buyers are dominating the market, and upward momentum is likely.
Use this signal to consider buying opportunities, especially if volume is above average.
* Red Background (Strong Seller Pressure):
Indicates sellers are in control, and prices might fall.
Use this signal to consider selling or shorting opportunities.
* Gray Background (Neutral Market):
Reflects indecision; avoid entering trades during these periods unless other signals support a strategy.
Volume Confirmation:
Combine volume analysis with buyer/seller pressure to confirm trends.
Example: A high daily volume with strong buyer pressure signals a high-probability uptrend.
Set Alerts:
Enable alerts to receive real-time notifications when the market generates strong buy/sell signals or enters a neutral zone.
Who Can Benefit:
* Day Traders: Quickly assess intraday market dynamics and volume trends.
* Swing Traders: Identify breakout opportunities or reversal points based on strong buyer/seller pressure.
* Volume Analysts: Compare historical volume averages to current conditions for deeper insights.
Limitations:
Does not guarantee success—should be combined with other technical indicators or strategies.
In low-volume markets, signals may produce false positives or unreliable results.
Assumes traders have basic knowledge of price action and volume analysis.
By integrating this indicator into your strategy, you gain a powerful tool to analyze buyer/seller dominance alongside volume trends, improving your market timing and trade execution.
The Buyer and Seller Pressure components in this indicator provide crucial insights into the market's sentiment and momentum by analyzing the price action relative to the trading volume. Here's how they are used:
1. Buyer Pressure:
Formula:
Buyer Pressure = (Close − Open) / (High − Low )
Interpretation:
* A high buyer pressure (≥ 0.75) indicates strong bullish sentiment, where the price closes much higher than it opened, and the range (high-low) is sufficiently wide.
* It identifies periods of aggressive buying, often signaling potential bullish trends or confirming upward momentum.
2. Seller Pressure:
Formula:
Seller Pressure = (Close − Open ) / (High -Low )
Interpretation:
*A high seller pressure (≥ 0.75) suggests strong bearish sentiment, where the price closes much lower than it opened, within a wide range.
*It helps identify periods of aggressive selling, signaling potential bearish trends or downward momentum.
Purpose in the Indicator:
1. Market Sentiment Analysis:
* Buyer Pressure and Seller Pressure allow traders to gauge market sentiment—whether buyers or sellers dominate a particular time frame.
* This helps in identifying trend reversals or confirmations.
2. Decision-Making Framework:
* The indicator uses thresholds (default 0.75) to classify the market into:
* Strong Buy Signal: When buyer pressure is dominant.
* Strong Sell Signal: When seller pressure is dominant.
* Neutral Signal: When neither buyer nor seller pressure dominates.
*This classification provides a straightforward decision-making tool for traders.
Risk Management:
*By identifying periods of strong buying or selling, traders can avoid entering trades in highly volatile or one-sided markets, which helps reduce risk.
Volume Confirmation:
*Integrating volume data with buyer/seller pressure helps confirm trends. For example:
*High buyer pressure accompanied by higher-than-average volume strengthens the bullish signal.
*Similarly, high seller pressure with higher-than-average volume confirms bearish signals.
Trade Timing:
*The indicator highlights conditions of potential entry (strong buy) or exit (strong sell), allowing traders to time their trades better based on real-time market activity.
Use Case:
*Example:
*Suppose the indicator shows Buyer Pressure = 0.85 with daily volume above the 3-day average. This combination suggests strong bullish activity with momentum, signaling a buy opportunity.
*Conversely, if Seller Pressure = 0.80 with volume above the 5-day average, it signals strong bearish momentum, ideal for selling or shorting.
This indicator combines buyer/seller pressure with volume dynamics, making it valuable for short-term and intraday traders looking for precise market entries and exits.
The background color in this indicator plays an important visual role in helping traders quickly identify the market sentiment based on buyer and seller pressure. It provides a dynamic, color-coded background that changes depending on the strength of the market's buying or selling activity.
Here's how it works:
Background Color Logic:
1. Green Background (Strong Buy Signal):
*Condition: The background turns green when buyer pressure is greater than or equal to 0.75 (strong buying pressure).
*Interpretation: A green background indicates that there is significant bullish sentiment in the market, with strong buying activity. Traders can interpret this as an environment conducive to buying or holding long positions.
*Visual Effect: This helps to quickly spot bullish market conditions, reinforcing potential entry signals for buyers.
2.Red Background (Strong Sell Signal):
*Condition: The background turns red when seller pressure is greater than or equal to 0.75 (strong selling pressure).
*Interpretation: A red background indicates that the market is dominated by selling, showing strong bearish sentiment. Traders can consider this as a signal to sell or short the asset.
*Visual Effect: The red background highlights moments when the market is heavily selling, prompting traders to either exit long positions or take short positions.
Gray Background (Neutral/Indecision Zone):
Condition: The background turns gray when neither buyer nor seller pressure exceeds 0.75. This means the market is neutral, with no dominant bullish or bearish sentiment.
Interpretation: A gray background suggests market indecision or balance between buyers and sellers. It can indicate periods of consolidation or sideways movement where no strong trend is forming.
Visual Effect: The gray background helps traders avoid entering trades when the market lacks a clear direction or when the sentiment is neutral, reducing risk during indecisive times.
Practical Use:
Instant Visual Confirmation:
*Traders can use the background color as an instant confirmation of the market’s sentiment. For instance, if the background turns green, traders might feel more confident in making a long (buy) trade.
*If the background turns red, it serves as a strong visual cue to short or exit a long position.
Helps with Trade Timing:
*The background color can be used in conjunction with other indicators and volume data to time entries and exits more effectively. For example:
*A green background with strong volume indicates a strong trend that could justify a buy.
*A red background with a significant volume surge signals strong selling pressure, which could prompt a sell.
Simplifies Market Analysis:
*For traders who prefer visual cues over complex analysis, the background color simplifies market conditions. Instead of focusing on individual numbers or values, the color-coded background gives them a quick, intuitive view of the market sentiment.
Summary:
* Green background = Strong buying pressure (bullish sentiment)
* Red background = Strong selling pressure (bearish sentiment)
* Gray background = Neutral market (indecision or balance between buyers and sellers)
This background color functionality helps traders stay aware of the prevailing market sentiment at a glance, providing an intuitive way to guide trading decisions.
Pesquisar nos scripts por "moving averages"

Bullish Reversal Bar Strategy [Skyrexio]Overview
Bullish Reversal Bar Strategy leverages the combination of candlestick pattern Bullish Reversal Bar (description in Methodology and Justification of Methodology), Williams Alligator indicator and Williams Fractals to create the high probability setups. Candlestick pattern is used for the entering into trade, while the combination of Williams Alligator and Fractals is used for the trend approximation as close condition. Strategy uses only long trades.
Unique Features
No fixed stop-loss and take profit: Instead of fixed stop-loss level strategy utilizes technical condition obtained by Fractals and Alligator or the candlestick pattern invalidation to identify when current uptrend is likely to be over (more information in "Methodology" and "Justification of Methodology" paragraphs)
Configurable Trading Periods: Users can tailor the strategy to specific market windows, adapting to different market conditions.
Trend Trade Filter: strategy uses Alligator and Fractal combination as high probability trend filter.
Methodology
The strategy opens long trade when the following price met the conditions:
1.Current candle's high shall be below the Williams Alligator's lines (Jaw, Lips, Teeth)(all details in "Justification of Methodology" paragraph)
2.Price shall create the candlestick pattern "Bullish Reversal Bar". Optionally if MFI and AO filters are enabled current candle shall have the decreasing AO and at least one of three recent bars shall have the squat state on the MFI (all details in "Justification of Methodology" paragraph)
3.If price breaks through the high of the candle marked as the "Bullish Reversal Bar" the long trade is open at the price one tick above the candle's high
4.Initial stop loss is placed at the Bullish Reversal Bar's candle's low
5.If price hit the Bullish Reversal Bar's low before hitting the entry price potential trade is cancelled
6.If trade is active and initial stop loss has not been hit, trade is closed when the combination of Alligator and Williams Fractals shall consider current trend change from upward to downward.
Strategy settings
In the inputs window user can setup strategy setting:
Enable MFI (if true trades are filtered using Market Facilitation Index (MFI) condition all details in "Justification of Methodology" paragraph), by default = false)
Enable AO (if true trades are filtered using Awesome Oscillator (AO) condition all details in "Justification of Methodology" paragraph), by default = false)
Justification of Methodology
Let's explore the key concepts of this strategy and understand how they work together. The first and key concept is the Bullish Reversal Bar candlestick pattern. This is just the single bar pattern. The rules are simple:
Candle shall be closed in it's upper half
High of this candle shall be below all three Alligator's lines (Jaw, Lips, Teeth)
Next, let’s discuss the short-term trend filter, which combines the Williams Alligator and Williams Fractals. Williams Alligator
Developed by Bill Williams, the Alligator is a technical indicator that identifies trends and potential market reversals. It consists of three smoothed moving averages:
Jaw (Blue Line): The slowest of the three, based on a 13-period smoothed moving average shifted 8 bars ahead.
Teeth (Red Line): The medium-speed line, derived from an 8-period smoothed moving average shifted 5 bars forward.
Lips (Green Line): The fastest line, calculated using a 5-period smoothed moving average shifted 3 bars forward.
When the lines diverge and align in order, the "Alligator" is "awake," signaling a strong trend. When the lines overlap or intertwine, the "Alligator" is "asleep," indicating a range-bound or sideways market. This indicator helps traders determine when to enter or avoid trades.
Fractals, another tool by Bill Williams, help identify potential reversal points on a price chart. A fractal forms over at least five consecutive bars, with the middle bar showing either:
Up Fractal: Occurs when the middle bar has a higher high than the two preceding and two following bars, suggesting a potential downward reversal.
Down Fractal: Happens when the middle bar shows a lower low than the surrounding two bars, hinting at a possible upward reversal.
Traders often use fractals alongside other indicators to confirm trends or reversals, enhancing decision-making accuracy.
How do these tools work together in this strategy? Let’s consider an example of an uptrend.
When the price breaks above an up fractal, it signals a potential bullish trend. This occurs because the up fractal represents a shift in market behavior, where a temporary high was formed due to selling pressure. If the price revisits this level and breaks through, it suggests the market sentiment has turned bullish.
The breakout must occur above the Alligator’s teeth line to confirm the trend. A breakout below the teeth is considered invalid, and the downtrend might still persist. Conversely, in a downtrend, the same logic applies with down fractals.
How we can use all these indicators in this strategy? This strategy is a counter trend one. Candle's high shall be below all Alligator's lines. During this market stage the bullish reversal bar candlestick pattern shall be printed. This bar during the downtrend is a high probability setup for the potential reversal to the upside: bulls were able to close the price in the upper half of a candle. The breaking of its high is a high probability signal that trend change is confirmed and script opens long trade. If market continues going down and break down the bullish reversal bar's low potential trend change has been invalidated and strategy close long trade.
If market really reversed and started moving to the upside strategy waits for the trend change form the downtrend to the uptrend according to approximation of Alligator and Fractals combination. If this change happens strategy close the trade. This approach helps to stay in the long trade while the uptrend continuation is likely and close it if there is a high probability of the uptrend finish.
Optionally users can enable MFI and AO filters. First of all, let's briefly explain what are these two indicators. The Awesome Oscillator (AO), created by Bill Williams, is a momentum-based indicator that evaluates market momentum by comparing recent price activity to a broader historical context. It assists traders in identifying potential trend reversals and gauging trend strength.
AO = SMA5(Median Price) − SMA34(Median Price)
where:
Median Price = (High + Low) / 2
SMA5 = 5-period Simple Moving Average of the Median Price
SMA 34 = 34-period Simple Moving Average of the Median Price
This indicator is filtering signals in the following way: if current AO bar is decreasing this candle can be interpreted as a bullish reversal bar. This logic is applicable because initially this strategy is a trend reversal, it is searching for the high probability setup against the current trend. Decreasing AO is the additional high probability filter of a downtrend.
Let's briefly look what is MFI. The Market Facilitation Index (MFI) is a technical indicator that measures the price movement per unit of volume, helping traders gauge the efficiency of price movement in relation to trading volume. Here's how you can calculate it:
MFI = (High−Low)/Volume
MFI can be used in combination with volume, so we can divide 4 states. Bill Williams introduced these to help traders interpret the interaction between volume and price movement. Here’s a quick summary:
Green Window (Increased MFI & Increased Volume): Indicates strong momentum with both price and volume increasing. Often a sign of trend continuation, as both buying and selling interest are rising.
Fake Window (Increased MFI & Decreased Volume): Shows that price is moving but with lower volume, suggesting weak support for the trend. This can signal a potential end of the current trend.
Squat Window (Decreased MFI & Increased Volume): Shows high volume but little price movement, indicating a tug-of-war between buyers and sellers. This often precedes a breakout as the pressure builds.
Fade Window (Decreased MFI & Decreased Volume): Indicates a lack of interest from both buyers and sellers, leading to lower momentum. This typically happens in range-bound markets and may signal consolidation before a new move.
For our purposes we are interested in squat bars. This is the sign that volume cannot move the price easily. This type of bar increases the probability of trend reversal. In this indicator we added to enable the MFI filter of reversal bars. If potential reversal bar or two preceding bars have squat state this bar can be interpret as a reversal one.
Backtest Results
Operating window: Date range of backtests is 2023.01.01 - 2024.12.31. It is chosen to let the strategy to close all opened positions.
Commission and Slippage: Includes a standard Binance commission of 0.1% and accounts for possible slippage over 5 ticks.
Initial capital: 10000 USDT
Percent of capital used in every trade: 50%
Maximum Single Position Loss: -5.29%
Maximum Single Profit: +29.99%
Net Profit: +5472.66 USDT (+54.73%)
Total Trades: 103 (33.98% win rate)
Profit Factor: 1.634
Maximum Accumulated Loss: 1231.15 USDT (-8.32%)
Average Profit per Trade: 53.13 USDT (+0.94%)
Average Trade Duration: 76 hours
How to Use
Add the script to favorites for easy access.
Apply to the desired timeframe and chart (optimal performance observed on 4h ETH/USDT).
Configure settings using the dropdown choice list in the built-in menu.
Set up alerts to automate strategy positions through web hook with the text: {{strategy.order.alert_message}}
Disclaimer:
Educational and informational tool reflecting Skyrex commitment to informed trading. Past performance does not guarantee future results. Test strategies in a simulated environment before live implementation
These results are obtained with realistic parameters representing trading conditions observed at major exchanges such as Binance and with realistic trading portfolio usage parameters.

Pi Cycle Top & Bottom OscillatorThis TradingView script implements the Pi Cycle Top & Bottom Oscillator, a technical indicator designed to identify potential market tops and bottoms using moving average relationships. Here's a detailed breakdown:
Indicator Overview
Purpose: The indicator calculates an oscillator based on the ratio of a 111-day simple moving average (SMA) to double the 350-day SMA. It identifies potential overbought (market tops) and oversold (market bottoms) conditions.
Visualization: The oscillator is displayed in a standalone pane with dynamic color coding to represent different market conditions.
Inputs
111-Day Moving Average Length (length_111): Adjustable parameter for the short-term moving average. Default is 111 days.
350-Day Moving Average Length (length_350): Adjustable parameter for the long-term moving average. Default is 350 days.
Overheat Threshold (upper_threshold): Percentage level above which the market is considered overheated. Default is 100%.
Cooling Down Threshold (lower_threshold): Percentage level below which the market is cooling down. Default is 75%.
Calculation
Moving Averages:
111-day SMA of the closing price.
350-day SMA of the closing price.
Double the 350-day SMA (
𝑚
𝑎
_
2
_
350
=
𝑚
𝑎
_
350
×
2
ma_2_350=ma_350×2).
Oscillator:
Ratio of the 111-day SMA to double the 350-day SMA, expressed as a percentage:
oscillator
=
𝑚
𝑎
_
111
𝑚
𝑎
_
2
_
350
×
100
oscillator=
ma_2_350
ma_111
×100
Market Conditions
Overheated Market (Potential Top): Oscillator >= Overheat Threshold (100% by default). Highlighted in red.
Cooling Down Market (Potential Bottom): Oscillator <= Cooling Down Threshold (75% by default). Highlighted in green.
Normal Market Condition: Oscillator is between these thresholds. Highlighted in blue.
Visual Features
Dynamic Oscillator Plot:
Color-coded to indicate market conditions:
Red: Overheated.
Green: Cooling down.
Blue: Normal condition.
Threshold Lines:
Red Dashed Line: Overheat Threshold.
Green Dashed Line: Cooling Down Threshold.
White Dashed Line: Additional high-value marker at 30 for reference.
Alerts
Overheat Alert: Triggers when the oscillator crosses the overheat threshold, signaling a potential market top.
Cooling Down Alert: Triggers when the oscillator crosses the cooling down threshold, signaling a potential market bottom.
Use Case
This script is particularly useful for traders seeking early signals of market reversals. The thresholds and dynamic color coding provide visual cues and alerts to aid decision-making in identifying overbought or oversold conditions.

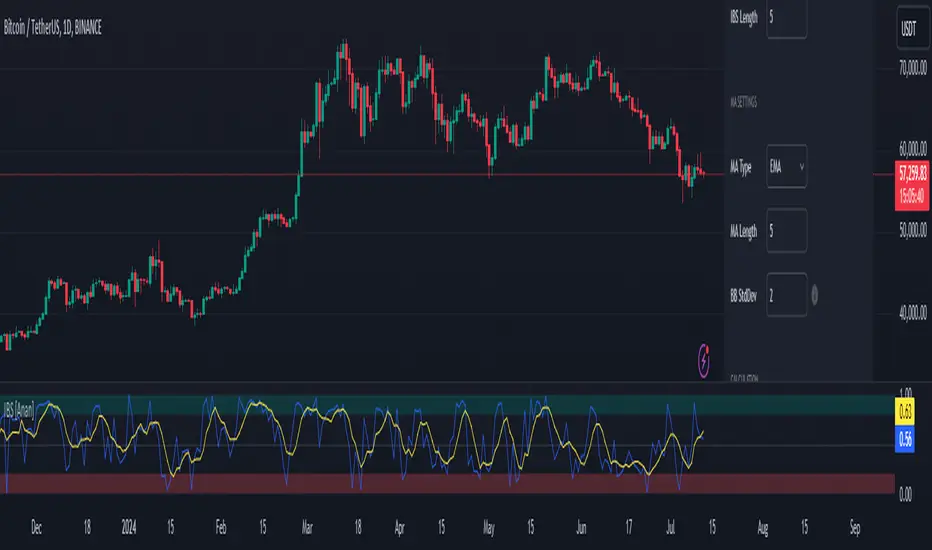
Internal Bar Strength IBS [Anan]This indicator calculates and displays the Internal Bar Strength (IBS) along with its moving average. The IBS is a measure that represents where the closing price is relative to the high-low range of a given period.
█ Main Formula
The core of this indicator is the Internal Bar Strength (IBS) calculation. The basic IBS formula is:
ibs = (close - low) / (high - low)
I enhanced the original formula by incorporating a user-defined length parameter. This modification allows for greater flexibility in analysis and interpretation. The extended version enables users to adjust the indicator's length according to their specific needs or market conditions. Notably, setting the length parameter to 1 reproduces the behavior of the original formula, maintaining backward compatibility while offering expanded functionality:
ibs = (close - ta.lowest(low, ibs_length)) / (ta.highest(high, ibs_length) - ta.lowest(low, ibs_length))
Where:
- `close` is the closing price of the current bar
- `lowest low` is the lowest low price over the specified IBS length
- `highest high` is the highest high price over the specified IBS length
█ Key Features
- Calculates IBS using a user-defined length
- Applies a moving average to the IBS values
- Offers multiple moving average types
- Includes optional Bollinger Bands or Donchian Channel overlays
- Visualizes bull and bear areas
█ Inputs
- IBS Length: The period used for IBS calculation
- MA Type: The type of moving average applied to IBS (options: SMA, EMA, SMMA, WMA, VWMA, Bollinger Bands, Donchian)
- MA Length: The period used for the moving average calculation
- BB StdDev: Standard deviation multiplier for Bollinger Bands
█ How to Use and Interpret
1. IBS Line Interpretation:
- IBS values range from 0 to 1
- Values close to 1 indicate the close was near the high, suggesting a bullish sentiment
- Values close to 0 indicate the close was near the low, suggesting a bearish sentiment
- Values around 0.5 suggest the close was near the middle of the range
2. Overbought/Oversold Conditions:
- IBS values above 0.8 (teal zone) may indicate overbought conditions
- IBS values below 0.2 (red zone) may indicate oversold conditions
- These zones can be used to identify potential reversal points
3. Trend Identification:
- Consistent IBS values above 0.5 may indicate an uptrend
- Consistent IBS values below 0.5 may indicate a downtrend
4. Using Moving Averages:
- The yellow MA line can help smooth out IBS fluctuations
- Crossovers between the IBS and its MA can signal potential trend changes
5. Bollinger Bands/Donchian Channel:
- When enabled, these can provide additional context for overbought/oversold conditions
- IBS touching or exceeding the upper band may indicate overbought conditions
- IBS touching or falling below the lower band may indicate oversold conditions
Remember that no single indicator should be used in isolation. Always combine IBS analysis with other technical indicators, price action analysis, and broader market context for more reliable trading decisions.
Han Algo - Moving average strategyHan Algo Indicator Strategy Description
Overview:
The Han Algo Indicator is designed to identify trend directions and signal potential buy and sell opportunities based on moving average crossovers. It aims to provide clear signals while filtering out noise and minimizing false signals.
Indicators Used:
Moving Averages:
200 SMA (Simple Moving Average): Used as a long-term trend indicator.
100 SMA: Provides a medium-term perspective on price movements.
50 SMA: Offers insights into shorter-term trends.
20 SMA: Provides a very short-term perspective on recent price actions.
Trend Identification:
The indicator identifies the trend based on the relationship between the closing price (close) and the 200 SMA (ma_long):
Uptrend: When the closing price is above the 200 SMA.
Downtrend: When the closing price is below the 200 SMA.
Sideways: When the closing price is equal to the 200 SMA.
Buy and Sell Signals:
Buy Signal: Generated when transitioning from a downtrend to an uptrend (buy_condition):
Displayed as a green "BUY" label above the price bar.
Sell Signal: Generated when transitioning from an uptrend to a downtrend (sell_condition):
Displayed as a red "SELL" label below the price bar.
Signal Filtering:
Signals are filtered to prevent consecutive signals occurring too closely (min_distance_bars parameter):
Ensures that only significant trend reversals are captured, minimizing false signals.
Visualization:
Background Color:
Changes to green for uptrend and red for downtrend (bgcolor function):
Provides visual cues for current market sentiment.
Usage:
Traders can customize the indicator's parameters (long_term_length, medium_term_length, short_term_length, very_short_term_length, min_distance_bars) to align with their trading preferences and timeframes.
The Han Algo Indicator helps traders make informed decisions by highlighting potential trend reversals and aligning with market trends identified through moving average analysis.
Disclaimer:
This indicator is intended for educational purposes and as a visual aid to support trading decisions. It should be used in conjunction with other technical analysis tools and risk management strategies.

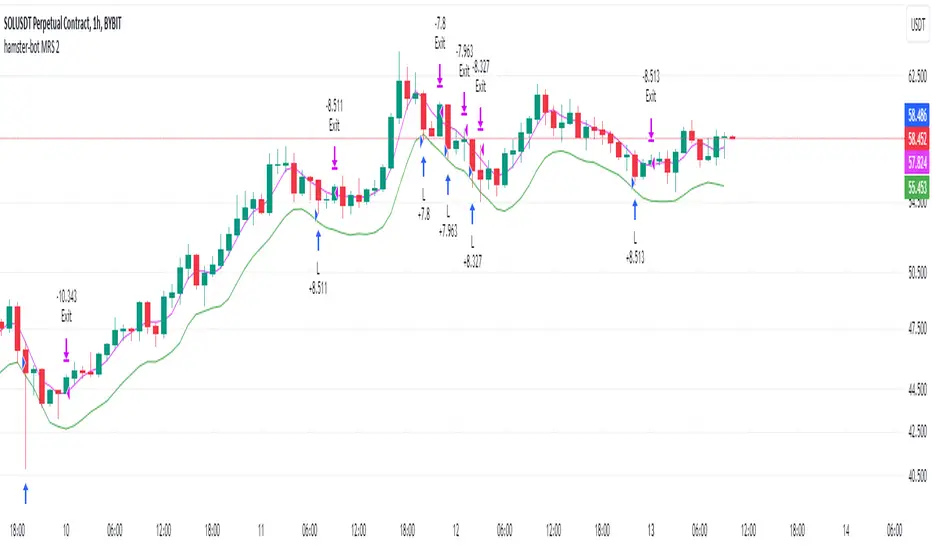
hamster-bot MRS 2 (simplified version) MRS - Mean Reversion Strategy (Countertrend) (Envelope strategy)
This script does not claim to be unique and does not mislead anyone. Even the unattractive backtest result is attached. The source code is open. The idea has been described many times in various sources. But at the same time, their collection in one place provides unique opportunities.
Published by popular demand and for ease of use. so that users can track the development of the script and can offer their ideas in the comments. Otherwise, you have to communicate in several telegram chats.
Representative of the family of counter-trend strategies. The basis of the strategy is Mean reversion . You can also read about the Envelope strategy .
Mean reversion , or reversion to the mean, is a theory used in finance that suggests that asset price volatility and historical returns eventually will revert to the long-run mean or average level of the entire dataset.
The strategy is very simple. Has very few settings. Good for beginners to get acquainted with algorithmic trading. A simple adjustment will help avoid overfitting. There are many variations of this strategy, but for understanding it is better to start with this implementation.
Principle of operation.
1)
A conventional MA is being built. (fuchsia line). A limit order is placed on this line to close the position.
2)
(green line) A limit order is placed on this line to open a long position
3)
(red line) A limit order is placed on this line to open a short position
Attention!
Please note that a limit order is used. Conclude that the strategy has a limited capacity. And the results obtained on low-liquid instruments will be too high in the tester. On real auctions there will be a different result.
Note for testing the strategy in the spot market:
When testing in the spot market, do not include both long and short at the same time. It is recommended to test only the long mode on the spot. Short mode for more advanced users.
Settings:
Available types of moving averages:
SMA
EMA
TEMA - triple exponential moving average
DEMA - Double Exponential Moving Average
ZLEMA - Zero lag exponential moving average
WMA - weighted moving average
Hma - Hull Moving Average
Thma - Triple Exponential Hull Moving Average
Ehma - Exponential Hull Moving Average
H - MA built based on highs for n candles | ta.highest(len)
L - MA built based on lows for n candles | ta.lowest(len)
DMA - Donchian Moving Average
A Kalman filter can be applied to all MA
The peculiarity of the strategy is a large selection of MA and the possibility of shifting lines. You can set up a reverse trending strategy on the Donchian channel for example.
Use Long - enable/disable opening a Long position
Use Short - enable/disable opening a Short position
Lot Long, % - % allocated from the deposit for opening a Long position. In the spot market, do not use % greater than 100%
Lot Short, % - allocated % of the deposit for opening a Short position
Start date - the beginning of the testing period
End date - the end of the testing period (Example: only August 2020 can be tested)
Mul - multiplier. Used to offset lines. Example:
Mul = 0.99 is shift -1%
Mul = 1.01 is shift +1%
Non-strict recommendations:
1) Test the SPOT market on crypto exchanges. (The countertrend strategy has liquidation risk on futures)
2) Symbols altcoin/bitcoin or altcoin/altcoin. Example: ETH/BTC or DOGE/ETH
3) Timeframe is usually 1 hour
If the script passes moderation, I will supplement it by adding separate settings for closing long and short positions according to their MA
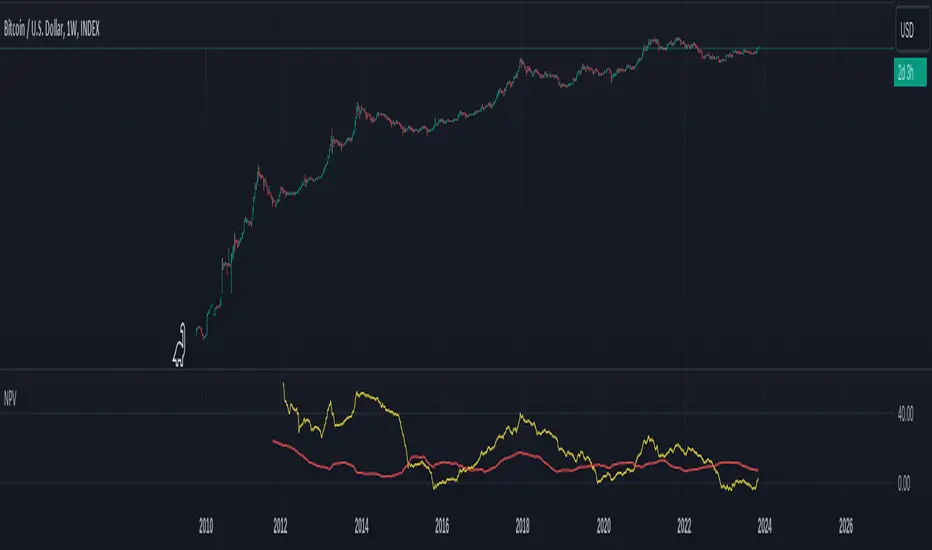
Normalized Price VolumeThe Normalized Price Volume (NPV) indicator is a unique tool designed to offer insights into the relationship between price movements and trading volume. By normalizing these factors, NPV helps traders identify potential price trends and reversals with greater precision.
Key Features:
Normalization: NPV leverages the Average True Range (ATR) to normalize price changes, making them comparable across different assets and timeframes.
Price and Volume Ratios: The indicator calculates the ratio of normalized price changes and volume to provide valuable information about the dynamics between price and trading activity.
Sum of Changes: NPV also presents the sum of normalized price changes over a user-defined period, allowing you to gauge the overall trend strength.
Customizable Averages: Adjust the length of the moving averages used in the price and volume ratios to fine-tune the sensitivity of the indicator to your trading strategy.
NPV is a versatile tool that can be used for various trading and investment approaches. Whether you're a day trader, swing trader, or investor, NPV can help you make more informed decisions by shedding light on the interactions between price and volume in the market.
Disclaimer: This indicator is for educational and informational purposes only. It should be used in conjunction with other analysis techniques and not solely for making trading decisions.
Net Positions (Net Longs & Net Shorts) - By LeviathanThis script is an experimental indicator that visualizes the entering and exiting of long and short positions in the market. It also includes other useful tools, such as NL/NS Profile, NL/NS Delta, NL/NS Ratio, Volume Heatmap, Divergence finder, Relative Strength Index of Net Longs and Net Shorts, EMAs and VWMAs and more.
To avoid misinterpretation, it's important to understand some basics. The “real” ratio between net long and net short positions in a given market is always 1:1. A futures contract is an agreement between two parties to buy or sell an underlying asset at an agreed-upon price. Each contract has a long side and a short side, with one party agreeing to buy (long) and the other party agreeing to sell (short) the asset at the agreed-upon price. The long position holder anticipates that the asset's price will rise, while the short position holder expects it to fall. Because every futures contract involves both a buyer and a seller, it is impossible to have more net longs than net shorts or vice versa (in terms of the net value). For every long position opened, there must be a corresponding short position taken by another market participant (and vice versa), thus maintaining the 1:1 ratio between longs and shorts. While there can be an imbalance in the number of traders/accounts holding long and short contracts, the net value of positions held on each side remains 1 to 1.
Open Interest (OI) is a metric that tracks the number of open (unsettled) contracts in a given market. For example, Open Interest of 100 BTC means that there are currently 100 BTC worth of longs and 100 BTC worth of shorts open in the market. There may be more traders on one side holding smaller positions, and fewer traders on the other side holding larger positions, but the net value of positions on one side is equal to the net value of positions on the other side → 100 BTC in longs and 100 BTC in shorts (1:1). Consider a scenario in which a trader decides to open a long position for 1 BTC at a price of HKEX:30 ,000. For this long order to be executed, a counterparty must take the opposite side of the contract by placing an order to short 1 BTC at the same price of HKEX:30 ,000. When both the long and short orders are matched and executed, the open interest increases by 1 BTC, reflecting the addition of this new contract to the market.
Changes in Open Interest essentially tell us 3 things:
- OI Increase - new positions entered the market (both longs and shorts!)
- OI Decrease - positions exited the market (both longs and shorts!)
- OI Flat - no change in open positions due to low activity or simply lots of transfers of contracts
However, different concepts can be used to analyze sentiment, aggressiveness, and activity in the market by analyzing data such as Open Interest, price, volume, etc. This indicator combines Open Interest data and price action to simplify the visualization of positions entering and exiting the market. It is based on the following concept:
Increase in Open Interest + Increase in price = Longs Opening
Decrease in Open Interest + Decrease in price = Longs Closing
Increase in Open Interest + Decrease in price = Shorts Opening
Decrease in Open Interest + Increase in price = Shorts Closing
When "Longs Opening" occurs, the OI Delta value is added to the running total of Net Longs, and when "Longs Closing" occurs, the OI Delta value is subtracted from the running total of Net Longs.
When "Shorts Opening" occurs, the OI Delta value is added to the running total of Net Shorts, and when "Shorts Closing" occurs, the OI Delta value is subtracted from the running total of Net Shorts.
To summarize:
Net Longs: Cumulative value of Longs Opening and Longs Closing (LO - LC)
Net Shorts: Cumulative value of Shorts Opening and Shorts Closing (SO - SC)
Net Delta: Net Longs - Net Shorts
Net Ratio: Net Longs / Net Shorts
This is the fundamental logic of how this script functions, but it also includes several other tools and options. Here is an overview of the settings:
Type:
- Net Positions (display values of Net Longs, Net Shorts, Net Delta, Net Ratio as described above)
- Relative Strength (display Net Longs, Net Shorts, Net Delta, Net Ratio in the form of a momentum oscillator that measures the speed and change of movements. Same logic as RSI for price)
Display as:
- Candles (display the data in the form of candlesticks)
- Lines (display the data in the form of candlesticks)
- Columns (display the data in the form of columns)
Cumulation:
- Visible Range (data is cumulated from the first visible bar on your chart)
- Full Data (data is cumulated from the beginning)
Quoted in:
- Base Currency (all data is presented in the pair’s base currency eg. BTC)
- Quote Currency (all data is presented in the pair’s quote currency eg USDT)
OI Sources
- Pick the sources from where the data is collected (if available).
Net Positions:
- NET LONGS (show/hide Net Longs plot, choose candle colors, choose line color)
- NET SHORTS (show/hide Net Shorts plot, choose candle colors, choose line color)
- NET DELTA (show/hide Net Delta plot, choose candle colors, choose line color)
- NET RATIO (show/hide Net Ratio plot, choose candle colors, choose line color)
Moving Averages:
- Type (choose between EMA and Volume Weighted Moving Average)
- NET LONGS (show/hide NL moving average plot, choose length, choose color)
- NET SHORTS (show/hide NS moving average plot, choose length, choose color)
- NET DELTA (show/hide ND moving average plot, choose length, choose color)
- NET RATIO (show/hide NR moving average plot, choose length, choose color)
Profile:
- Profile Data (choose the source data of the profile)
- Value Area % (set the percentage width of profile’s value area)
- Positions (set the position of the profile to left or right of the visible range)
- Node Size (set the relative size of nodes to make them appear smaller or larger)
- Rows (select the amount of rows displayed by the profile to control granularity)
- POC (show/hide POC- Point Of Control and select its color)
- VA (show/hide VA- Value Area and select its color)
Divergence finder
- Source (choose the source data used by the script to compare it with price pivot points)
- Maximum distance (the maximum distance between two divergent pivot points)
- Lookback Bars Left (the number of bars to the left of the current bar that the function will consider when looking for a pivot point)
- Lookback Bars Right (the number of bars to the right of the current bar that the function will consider when looking for a pivot point)
Stats:
- Show/Hide the Stats table
- Bars Back (choose the length of data analyzed for stats in number of bars)
- Position (choose the position of the Stats table)
- Select Data you want to display in the Stats table
Additional Settings:
- Volume Heatmap (show/hide volume heatmap and select its color)
- Label Offset (select how much the plot label is shifted to the right
- Position Relative Strength Length (select the length used in the calculation)
- Value Label (show/hide OI Delta values when candles are displayed)
- Plot Labels (show/hide the labels next to the plot)
- Wicks (show/hide wick when candles are displayed)
Code used for generating profiles is taken from @KioseffTrading's "Profile Any Indicator" script (used with author's permission)

RF+ Replay for Heikin AshiRF+ Replay for Heikin Ashi
RF+ Replay for Heikin Ashi generates fully customisable Heikin Ashi candlesticks presented on a standard chart, enabling traders to utilise the Tradingview Replay feature with Heikin Ashi candlesticks when analysing and backtesting HA style strategies.
The features of this indicator include:
- Fully customisable Heikin Ashi Candles, including custom colour options for candle bodies, borders and wicks.
- Optional real-time, real-price close dots painted onto each candlestick.
- A optional set of 2 x Range Filters designed to indicate short term trend identification upon color change, ideal for low timeframe scalping.
- A optional set of 3 x fully customisable Moving Averages.
- An option to enable Heikin Ashi calculated data for the Range Filters and Moving Averages, so they present as they would on a Heikin Ashi non-standard chart type, without having to use an actual Heikin Ashi chart. Enabled by default.
- An optional sessions indicator, to highlight your prefered trading session for the purpose of backtesting.
- An optional watermark featuring customisable text and well as symbol and timeframe information, as seen in the screenshot of this indicator.
Instructions for use:
1) Because this indicator generates candlesticks and presents them onto your chart, you will need to hide the existing candlesticks so you do not see two sets of candles. You can do this by going into your Tradingview chart settings and making the candle bodies, borders and wicks fully transparent. You can then save this as a layout template. You can access your Chart Settings by clicking on the cog icon, or by right clicking on the chart itself and selecting 'Chart Settings' from the list.
2) Ensure you have the standard chart type selected - you do not need to select a Heikin Ashi type chart.
3) You will now be able to analyise and even backtest your Heikin Ashi style strategies including the use of the Tradingview Replay feature found at the top of the chart.
Heikin Ashi means 'average bar' in Japanese, which speaks to the fact that Heikin Ashi candles are calculated differently to standard Japanese candlesticks. The general idea of Heikin Ashi candles is to 'smooth' the appearance of price movement, by the use of averages within their calculation. It is important to understand that the Open and Close values of a Heikin Ashi candlestick do not reflect real Open and Close prices. You can use the real price dots feature to clearly see the real time and real price Close of each candle.
The formula for calculating a Heikin Ashi candlestick is as follows:
High = Maximum of High, Open, or Close (whichever is highest)
Low = Minimum of Low, Open, or Close (whichever is lowest)
Open = Open (previous bar) + Close (previous bar) /2
Close = (Open + High + Low + Close) / 4
If you found this useful, be sure to leave a like, comment and subscribe to show your support.
Until next time.

Distance From Moving AverageThis indicator shows the distance between the current price and the Moving Average price.
Key Features:
Show the distance between price and Moving Average (Read Distance Calculation for more information)
Show Historic Highs and Lows
Show Highest High and Lowest Low
Show current Highest High, current Lowest Low and current distance
Key Indicator Settings:
1. Distance Calculation
There are two ways to calculate the distance:
Spread - Calculate the difference between the price and the moving average
Percentage - Calculate the percentage change between the price and the moving average
2. Moving Average Types
There are 5 different Moving Averages:
EMA
SMA
WMA
VWMA
HMA
3. Highest High and Lowest Low
You can show or hide the Highest High and the Lowest Low plots of the series
4. Historic Highs and Lows
You can show or hide past Highs and Lows of the series
Lookback Length - Let's you adjust the frequency of local highs and lows of the series
5. Current Values
You can show or hide current value labels

Scalping The BullNome: Scalping The Bull (Indicatore)
Categoria: Scalping, Trend Following, Mean Reversion.
Timeframe: 1M, 5M, 30M, 1D, secondo la conformazione specifica.
(follow description in english)
Analisi tecnica: l’indicatore supporta le operatività descritte nei video di YouTube del canale “Scalping The Bull”. Di norma si basa su price action e medie mobili esponenziali.
Le varie tecniche che possono essere usate insieme all’indicatore sono sintetizzate nei settaggi dell’indicatore e si può fare riferimento ai video specifici per la spiegazione completa.
Utilizzo consigliato: Altcoin che presentano forti trend per scalping e operazioni intra-day.
Configurazione: È possibile configurare lo strumento in maniera semplice e completa.
Medie:
Medie per mercato: e’ possibile utilizzare le medie mobili esponenziali (EMA) esclusivamente per il mercato Crypto (5/10/60/223).
Media addizionale: e’ possibile visualizzare una media aggiuntiva, e.g. a 20 periodi.
Elementi del grafico:
Sfondo: segnala con lo sfondo del grafico in verde una situazione di uptrend ( EMA 60 > EMA 223) e in rosso sfondo rosso una situazione di downtrend (EMA 60 < EMA 223).
Separatori di sessioni: indica l’inizio della sessione corrente.
Punti Trigger:
Massimi e minimi di oggi: disegna sul grafico il prezzo di apertura della candela daily e i massimi e i minimi di giornata.
Massimi minimi di ieri: disegna sul grafico il prezzo di apertura della candela daily, i massimi e i minimi del giorno prima.
(English description)
Name: Scalping The Bull (Indicator)
Category: Scalping, Trend Following, Mean Reversion.
Timeframe: 1M, 5M, 30M, 1D depending on the specific signal.
Technical Analysis: The indicator supports the operations described in the YouTube videos of the channel "Scalping The Bull". Usually it is based on price action and exponential moving averages.
The various techniques that can be used in conjunction with the indicator are summarized in the indicator settings and you can refer to the specific videos for the full explanation.
Suggested usage: Altcoin showing strong trends for scalping and intra-day trades.
Configuration:
Exponential Moving Averages
Per market: you can display averages exclusively for the Crypto market (5/10/60/223).
Additional Average: You can display an additional average, e.g. 20-period average.
Chart elements:
Session Separators: indicates the beginning of the current session.
Background: signals with the background in green an uptrend situation ( 60 > 223) and in red background a downtrend situation (60 < 223).
Trigger points:
Today's highs and lows: draw on the chart the opening price of the daily candle and the highs and lows of the day.
Yesterday's highs and lows: draw on the chart the opening price of the daily candle, the highs and lows of the previous day.

Elder Impulse System + ATR BandsDisregard the above chart, I am not sure why it isn't showing the one I want, which is linked below:
This is as far as I can tell the closest representation to Dr. Alexander Elder's updated "Elder Impulse System" that has added ATR-volatility bands up to 3x deviations from price. I got the idea from watching this recent video (www.youtube.com) of Dr. Elder reviewing some recent trades and noticed he had updated his system from his original books. The Impulse System colour coding was inspired by AstralLoverFlow and LazyBear. ATR Bands are pre-programmed Keltner Channels with some modifications such as filing in the ATR Zones with user-selected colour bands and modifying the ATR value to better suit the volatility of the market being traded.
The script has several components, which I will detail below:
Exponential Moving Averages:
1) A 13-period EMA that is used as a staple in all of Dr. Elder's technical analysis. He uses this EMA as the basis for all of his indicators and why it is included here.
2) A 26-period EMA which can be used as a base-line of sorts to filter when to go long or when to go short. For instance, price over the 26-EMA, price is strong and the rally upwards is likely to continue, underneath it, price is weak and likely to continue downwards for a time.
Volatility Bands:
By definition these are nothing more than 3 separate Keltner Channels of a 13-period EMA each set to one additional multiplier from the moving average. This gives us a 1x, 2x, and 3x multiplier of average volatility from the 13-period EMA based on a 14-period Average True Range (ATR) reading. The ATR was chosen as it accommodates price gaps and also is the standard formula calculation in TradingView. The values of the bands cannot be adjusted but the colour coding of them can be.
Elder Impulse System:
These colour-coded bars show you the strength and direction of the current chart resolution, calculated by the slope of a 13-period EMA and the slope of a MACD histogram. These are used not as a buying or selling recommendation alone but as trend filters, as per Dr. Elder's own description of them.
Green Bars = The 13-period EMA is sloping positively and the MACD histogram is rising compared to previous bars. The trader should only consider buying/long opportunities when a green bar is most recent.
Red Bars = The 13-period EMA is sloping negatively and the MACD histogram is falling compared to previous bars. The trader should only consider selling/short opportunities when a red bar is most recent.
Blue Bars = The 13-period EMA and the MACD histogram are not aligned. One of the indicators is sloping opposite to the other indicator. These are known as indecision bars and are typically seen near the end of a previously established trend. The trader can choose to wait for either a green or red bar to shape their trading bias if they are more risk-averse while a counter-trend trader may decide to try opening a position against the currently-established trend.
How To Trade the System:
This system is unique in that it is so versatile and will fit the styles of many traders, be it trend following traders (generally the original Elder Impulse System design) or mean-reversion/counter-trend trading (the original Keltner Channel design). None of the examples below or in the chart above are financial advice and are just there for demonstration purposes only.
1) The most basic signal given would be the moving average cross up or down. A cross of the 13-EMA over the 26-EMA signals upward trend strength and the trader could look for buying opportunities. Conversely, the 13-EMA under the 26-EMA shows downward trend strength and the trader could look for selling opportunities.
2) Following the Elder Impulse system in conjunction with the EMAs. Look for long opportunities when a green bar is printed and price is over both of the 13- and 26-period EMAs. Look for short opportunities when a red bar is printed and price is below both of the 13- and 26-period EMAs. Keep in mind this does not necessarily need a moving average cross to be viable, a green or red bar over both EMAs is a valid signal in this system, usually. Examine price more closely for better entry signals when a blue bar is printed and price is either above or below both EMAs if you are a trend trader. This is how Dr. Elder originally intended the system to be used in conjunction with his famous Triple Screen Trading System. I am not going into detail here as it is a deep subject but I would suggest an interested trader to examine this Triple Screen System further as it is widely accepted as a strong strategy.
3) Mean Reversion and Counter-Trend Trading. Dr. Elder mentions that the zone between the two EMAs is called the Value Zone. A mean reversion trader could look for buying opportunities if price has generally been in an uptrend and falls back to value, conversely, they could look for shorting opportunities if price has generally been in a downtrend and rises back to value. These are your very basic pull backs found in trends that create your higher lows in an uptrend or your lower highs in a downtrend. A mean reversion/scalper trader may also look to use the upper and lower most ATR bands as an indication of price being overbought or oversold and could look to enter a counter-trend trade here once a blue indecision bar is printed and to ride that move back down to the Value Zone.
Taking Profits and Risk Management
This system again is very versatile and will fit a wide range of trading styles. It has built in take profit levels and risk management depending on your style of trading.
1a) In original Triple Screen Trading (and the original Elder Impulse system), a trader was to place a buy order one tick above a newly printed green bar with a stop loss one tick below the most recent 2-day low, and vice-versa for red bars on short selling. as long as other criteria were met, that I will not go into. It is all over YouTube and in his books and on Investopedia if you want more information. The general idea is to continue the trend in the direction if price is strong and you are bought into that move with a close stop, or if price falls back a little bit, you can get in at a better price. This would be a system typically better suited to a scalper.
1b) The updated risk management according to the above video is to place a stop loss at least 2ATR away from price. These bands already have calculated these values so a trader can place a stop one tick below the 2 or even 3ATR zones depending on their risk appetite. This is assuming you have already received a strong buy signal based on the system you follow. This would be a system typically better suited to a trend-trader.
2a) Taking profits if you are a trend trader has several possibilities. The first, as Dr. Elder suggests, is to place a price target 2ATR values away from your entry giving you approximately a 1:1 risk-reward ratio.
2b) The second possibility if the trade is successful is to ride the trend upwards until a blue bar is printed, suggesting indecision in the market. A modified version of this that could let a winning trade run longer is to wait for the price to close under the 13-EMA in fast markets, or close under the 26-EMA in slightly slower markets to maximize potential winnings.
2c) A scalper trader may wish to have a target at either the value zone if they are playing an extended buy/short back to the mean, or if they are being at the mean, to sell or cover when price extends back out to the 2x or 3x zone.
3) Trend traders can additionally use the ATR zones as a sort of safety guidelines for entering a trade. Anything within the 1ATR zone is typically a safer entry as the market is less volatile at this time. Entering when price has gone into the 2ATR zone is signaled as a strong momentum move and can signal a stronger move in the direction of the current closing bar. While not always the case, it is suggested by Dr. Elder to not enter trend trades at the 3ATR zone as this is where you will be likely looking for a counter-trend retracement back to value and a trader entering here in the direction of the trade has a higher chance of being stopped out or not getting in at the best possible price.

Dskyz (DAFE) Adaptive Regime - Quant Machine ProDskyz (DAFE) Adaptive Regime - Quant Machine Pro:
Buckle up for the Dskyz (DAFE) Adaptive Regime - Quant Machine Pro, is a strategy that’s your ultimate edge for conquering futures markets like ES, MES, NQ, and MNQ. This isn’t just another script—it’s a quant-grade powerhouse, crafted with precision to adapt to market regimes, deliver multi-factor signals, and protect your capital with futures-tuned risk management. With its shimmering DAFE visuals, dual dashboards, and glowing watermark, it turns your charts into a cyberpunk command center, making trading as thrilling as it is profitable.
Unlike generic scripts clogging up the space, the Adaptive Regime is a DAFE original, built from the ground up to tackle the chaos of futures trading. It identifies market regimes (Trending, Range, Volatile, Quiet) using ADX, Bollinger Bands, and HTF indicators, then fires trades based on a weighted scoring system that blends candlestick patterns, RSI, MACD, and more. Add in dynamic stops, trailing exits, and a 5% drawdown circuit breaker, and you’ve got a system that’s as safe as it is aggressive. Whether you’re a newbie or a prop desk pro, this strat’s your ticket to outsmarting the markets. Let’s break down every detail and see why it’s a must-have.
Why Traders Need This Strategy
Futures markets are a gauntlet—fast moves, volatility spikes (like the April 28, 2025 NQ 1k-point drop), and institutional traps that punish the unprepared. Meanwhile, platforms are flooded with low-effort scripts that recycle old ideas with zero innovation. The Adaptive Regime stands tall, offering:
Adaptive Intelligence: Detects market regimes (Trending, Range, Volatile, Quiet) to optimize signals, unlike one-size-fits-all scripts.
Multi-Factor Precision: Combines candlestick patterns, MA trends, RSI, MACD, volume, and HTF confirmation for high-probability trades.
Futures-Optimized Risk: Calculates position sizes based on $ risk (default: $300), with ATR or fixed stops/TPs tailored for ES/MES.
Bulletproof Safety: 5% daily drawdown circuit breaker and trailing stops keep your account intact, even in chaos.
DAFE Visual Mastery: Pulsing Bollinger Band fills, dynamic SL/TP lines, and dual dashboards (metrics + position) make signals crystal-clear and charts a work of art.
Original Craftsmanship: A DAFE creation, built with community passion, not a rehashed clone of generic code.
Traders need this because it’s a complete, adaptive system that blends quant smarts, user-friendly design, and DAFE flair. It’s your edge to trade with confidence, cut through market noise, and leave the copycats in the dust.
Strategy Components
1. Market Regime Detection
The strategy’s brain is its ability to classify market conditions into five regimes, ensuring signals match the environment.
How It Works:
Trending (Regime 1): ADX > 20, fast/slow EMA spread > 0.3x ATR, HTF RSI > 50 or MACD bullish (htf_trend_bull/bear).
Range (Regime 2): ADX < 25, price range < 3% of close, no HTF trend.
Volatile (Regime 3): BB width > 1.5x avg, ATR > 1.2x avg, HTF RSI overbought/oversold.
Quiet (Regime 4): BB width < 0.8x avg, ATR < 0.9x avg.
Other (Regime 5): Default for unclear conditions.
Indicators: ADX (14), BB width (20), ATR (14, 50-bar SMA), HTF RSI (14, daily default), HTF MACD (12,26,9).
Why It’s Brilliant:
Regime detection adapts signals to market context, boosting win rates in trending or volatile conditions.
HTF RSI/MACD add a big-picture filter, rare in basic scripts.
Visualized via gradient background (green for Trending, orange for Range, red for Volatile, gray for Quiet, navy for Other).
2. Multi-Factor Signal Scoring
Entries are driven by a weighted scoring system that combines candlestick patterns, trend, momentum, and volume for robust signals.
Candlestick Patterns:
Bullish: Engulfing (0.5), hammer (0.4 in Range, 0.2 else), morning star (0.2), piercing (0.2), double bottom (0.3 in Volatile, 0.15 else). Must be near support (low ≤ 1.01x 20-bar low) with volume spike (>1.5x 20-bar avg).
Bearish: Engulfing (0.5), shooting star (0.4 in Range, 0.2 else), evening star (0.2), dark cloud (0.2), double top (0.3 in Volatile, 0.15 else). Must be near resistance (high ≥ 0.99x 20-bar high) with volume spike.
Logic: Patterns are weighted higher in specific regimes (e.g., hammer in Range, double bottom in Volatile).
Additional Factors:
Trend: Fast EMA (20) > slow EMA (50) + 0.5x ATR (trend_bull, +0.2); opposite for trend_bear.
RSI: RSI (14) < 30 (rsi_bull, +0.15); > 70 (rsi_bear, +0.15).
MACD: MACD line > signal (12,26,9, macd_bull, +0.15); opposite for macd_bear.
Volume: ATR > 1.2x 50-bar avg (vol_expansion, +0.1).
HTF Confirmation: HTF RSI < 70 and MACD bullish (htf_bull_confirm, +0.2); RSI > 30 and MACD bearish (htf_bear_confirm, +0.2).
Scoring:
bull_score = sum of bullish factors; bear_score = sum of bearish. Entry requires score ≥ 1.0.
Example: Bullish engulfing (0.5) + trend_bull (0.2) + rsi_bull (0.15) + htf_bull_confirm (0.2) = 1.05, triggers long.
Why It’s Brilliant:
Multi-factor scoring ensures signals are confirmed by multiple market dynamics, reducing false positives.
Regime-specific weights make patterns more relevant (e.g., hammers shine in Range markets).
HTF confirmation aligns with the big picture, a quant edge over simplistic scripts.
3. Futures-Tuned Risk Management
The risk system is built for futures, calculating position sizes based on $ risk and offering flexible stops/TPs.
Position Sizing:
Logic: Risk per trade (default: $300) ÷ (stop distance in points * point value) = contracts, capped at max_contracts (default: 5). Point value = tick value (e.g., $12.5 for ES) * ticks per point (4) * contract multiplier (1 for ES, 0.1 for MES).
Example: $300 risk, 8-point stop, ES ($50/point) → 0.75 contracts, rounded to 1.
Impact: Precise sizing prevents over-leverage, critical for micro contracts like MES.
Stops and Take-Profits:
Fixed: Default stop = 8 points, TP = 16 points (2:1 reward/risk).
ATR-Based: Stop = 1.5x ATR (default), TP = 3x ATR, enabled via use_atr_for_stops.
Logic: Stops set at swing low/high ± stop distance; TPs at 2x stop distance from entry.
Impact: ATR stops adapt to volatility, while fixed stops suit stable markets.
Trailing Stops:
Logic: Activates at 50% of TP distance. Trails at close ± 1.5x ATR (atr_multiplier). Longs: max(trail_stop_long, close - ATR * 1.5); shorts: min(trail_stop_short, close + ATR * 1.5).
Impact: Locks in profits during trends, a game-changer in volatile sessions.
Circuit Breaker:
Logic: Pauses trading if daily drawdown > 5% (daily_drawdown = (max_equity - equity) / max_equity).
Impact: Protects capital during black swan events (e.g., April 27, 2025 ES slippage).
Why It’s Brilliant:
Futures-specific inputs (tick value, multiplier) make it plug-and-play for ES/MES.
Trailing stops and circuit breaker add pro-level safety, rare in off-the-shelf scripts.
Flexible stops (ATR or fixed) suit different trading styles.
4. Trade Entry and Exit Logic
Entries and exits are precise, driven by bull_score/bear_score and protected by drawdown checks.
Entry Conditions:
Long: bull_score ≥ 1.0, no position (position_size <= 0), drawdown < 5% (not pause_trading). Calculates contracts, sets stop at swing low - stop points, TP at 2x stop distance.
Short: bear_score ≥ 1.0, position_size >= 0, drawdown < 5%. Stop at swing high + stop points, TP at 2x stop distance.
Logic: Tracks entry_regime for PNL arrays. Closes opposite positions before entering.
Exit Conditions:
Stop-Loss/Take-Profit: Hits stop or TP (strategy.exit).
Trailing Stop: Activates at 50% TP, trails by ATR * 1.5.
Emergency Exit: Closes if price breaches stop (close < long_stop_price or close > short_stop_price).
Reset: Clears stop/TP prices when flat (position_size = 0).
Why It’s Brilliant:
Score-based entries ensure multi-factor confirmation, filtering out weak signals.
Trailing stops maximize profits in trends, unlike static exits in basic scripts.
Emergency exits add an extra safety layer, critical for futures volatility.
5. DAFE Visuals
The visuals are pure DAFE magic, blending function with cyberpunk flair to make signals intuitive and charts stunning.
Shimmering Bollinger Band Fill:
Display: BB basis (20, white), upper/lower (green/red, 45% transparent). Fill pulses (30–50 alpha) by regime, with glow (60–95 alpha) near bands (close ≥ 0.995x upper or ≤ 1.005x lower).
Purpose: Highlights volatility and key levels with a futuristic glow.
Visuals make complex regimes and signals instantly clear, even for newbies.
Pulsing effects and regime-specific colors add a DAFE signature, setting it apart from generic scripts.
BB glow emphasizes tradeable levels, enhancing decision-making.
Chart Background (Regime Heatmap):
Green — Trending Market: Strong, sustained price movement in one direction. The market is in a trend phase—momentum follows through.
Orange — Range-Bound: Market is consolidating or moving sideways, with no clear up/down trend. Great for mean reversion setups.
Red — Volatile Regime: High volatility, heightened risk, and larger/faster price swings—trade with caution.
Gray — Quiet/Low Volatility: Market is calm and inactive, with small moves—often poor conditions for most strategies.
Navy — Other/Neutral: Regime is uncertain or mixed; signals may be less reliable.
Bollinger Bands Glow (Dynamic Fill):
Neon Red Glow — Warning!: Price is near or breaking above the upper band; momentum is overstretched, watch for overbought conditions or reversals.
Bright Green Glow — Opportunity!: Price is near or breaking below the lower band; market could be oversold, prime for bounce or reversal.
Trend Green Fill — Trending Regime: Fills between bands with green when the market is trending, showing clear momentum.
Gold/Yellow Fill — Range Regime: Fills with gold/aqua in range conditions, showing the market is sideways/oscillating.
Magenta/Red Fill — Volatility Spike: Fills with vivid magenta/red during highly volatile regimes.
Blue Fill — Neutral/Quiet: A soft blue glow for other or uncertain market states.
Moving Averages:
Display: Blue fast EMA (20), red slow EMA (50), 2px.
Purpose: Shows trend direction, with trend_dir requiring ATR-scaled spread.
Dynamic SL/TP Lines:
Display: Pulsing colors (red SL, green TP for Trending; yellow/orange for Range, etc.), 3px, with pulse_alpha for shimmer.
Purpose: Tracks stops/TPs in real-time, color-coded by regime.
6. Dual Dashboards
Two dashboards deliver real-time insights, making the strat a quant command center.
Bottom-Left Metrics Dashboard (2x13):
Metrics: Mode (Active/Paused), trend (Bullish/Bearish/Neutral), ATR, ATR avg, volume spike (YES/NO), RSI (value + Oversold/Overbought/Neutral), HTF RSI, HTF trend, last signal (Buy/Sell/None), regime, bull score.
Display: Black (29% transparent), purple title, color-coded (green for bullish, red for bearish).
Purpose: Consolidates market context and signal strength.
Top-Right Position Dashboard (2x7):
Metrics: Regime, position side (Long/Short/None), position PNL ($), SL, TP, daily PNL ($).
Display: Black (29% transparent), purple title, color-coded (lime for Long, red for Short).
Purpose: Tracks live trades and profitability.
Why It’s Brilliant:
Dual dashboards cover market context and trade status, a rare feature.
Color-coding and concise metrics guide beginners (e.g., green “Buy” = go).
Real-time PNL and SL/TP visibility empower disciplined trading.
7. Performance Tracking
Logic: Arrays (regime_pnl_long/short, regime_win/loss_long/short) track PNL and win/loss by regime (1–5). Updated on trade close (barstate.isconfirmed).
Purpose: Prepares for future adaptive thresholds (e.g., adjust bull_score min based on regime performance).
Why It’s Brilliant: Lays the groundwork for self-optimizing logic, a quant edge over static scripts.
Key Features
Regime-Adaptive: Optimizes signals for Trending, Range, Volatile, Quiet markets.
Futures-Optimized: Precise sizing for ES/MES with tick-based risk inputs.
Multi-Factor Signals: Candlestick patterns, RSI, MACD, and HTF confirmation for robust entries.
Dynamic Exits: ATR/fixed stops, 2:1 TPs, and trailing stops maximize profits.
Safe and Smart: 5% drawdown breaker and emergency exits protect capital.
DAFE Visuals: Shimmering BB fill, pulsing SL/TP, and dual dashboards.
Backtest-Ready: Fixed qty and tick calc for accurate historical testing.
How to Use
Add to Chart: Load on a 5min ES/MES chart in TradingView.
Configure Inputs: Set instrument (ES/MES), tick value ($12.5/$1.25), multiplier (1/0.1), risk ($300 default). Enable ATR stops for volatility.
Monitor Dashboards: Bottom-left for regime/signals, top-right for position/PNL.
Backtest: Run in strategy tester to compare regimes.
Live Trade: Connect to Tradovate or similar. Watch for slippage (e.g., April 27, 2025 ES issues).
Replay Test: Try April 28, 2025 NQ drop to see regime shifts and stops.
Disclaimer
Trading futures involves significant risk of loss and is not suitable for all investors. Past performance does not guarantee future results. Backtest results may differ from live trading due to slippage, fees, or market conditions. Use this strategy at your own risk, and consult a financial advisor before trading. Dskyz (DAFE) Trading Systems is not responsible for any losses incurred.
Backtesting:
Frame: 2023-09-20 - 2025-04-29
Slippage: 3
Fee Typical Range (per side, per contract)
CME Exchange $1.14 – $1.20
Clearing $0.10 – $0.30
NFA Regulatory $0.02
Firm/Broker Commis. $0.25 – $0.80 (retail prop)
TOTAL $1.60 – $2.30 per side
Round Turn: (enter+exit) = $3.20 – $4.60 per contract
Final Notes
The Dskyz (DAFE) Adaptive Regime - Quant Machine Pro is more than a strategy—it’s a revolution. Crafted with DAFE’s signature precision, it rises above generic scripts with adaptive regimes, quant-grade signals, and visuals that make trading a thrill. Whether you’re scalping MES or swinging ES, this system empowers you to navigate markets with confidence and style. Join the DAFE crew, light up your charts, and let’s dominate the futures game!
(This publishing will most likely be taken down do to some miscellaneous rule about properly displaying charting symbols, or whatever. Once I've identified what part of the publishing they want to pick on, I'll adjust and repost.)
Use it with discipline. Use it with clarity. Trade smarter.
**I will continue to release incredible strategies and indicators until I turn this into a brand or until someone offers me a contract.
Created by Dskyz, powered by DAFE Trading Systems. Trade smart, trade bold.

Long Term Profitable Swing | AbbasA Story of a Profitable Swing Trading Strategy
Imagine you're sailing across the ocean, looking for the perfect wave to ride. Swing trading is quite similar—you're navigating the stock market, searching for the ideal moments to enter and exit trades. This strategy, created by Abbas, helps you find those waves and ride them effectively to profitable outcomes.
🌊 Finding the Perfect Wave (Entry)
Our journey begins with two simple signs that tell us a great trading opportunity is forming:
- Moving Averages: We use two lines that follow price trends—the faster one (EMA 16) reacts quickly to recent price moves, and the slower one (EMA 30) gives us a longer-term perspective. When the faster line crosses above the slower line, it's like a clear signal saying, "Hey! The wave is rising, and prices might move higher!"
- RSI Momentum: Next, we check a tool called the RSI, which measures momentum (how strongly prices are moving). If the RSI number is above 50, it means there's enough strength behind this rising wave to carry us forward.
When both signals appear together, that's our green light. It's time to jump on our surfboard and start riding this promising wave.
⚓ Safely Riding the Wave (Risk Management)
While we're riding this wave, we want to ensure we're safe from sudden surprises. To do this, we use something called the Average True Range (ATR), which measures how volatile (or bumpy) the price movements are:
- Stop-Loss: To avoid falling too hard, we set a safety line (stop-loss) 8 times the ATR below our entry price. This helps ensure we exit if the wave suddenly turns against us, protecting us from heavy losses.
- Take Profit: We also set a goal to exit the trade at 11 times the ATR above our entry. This way, we capture significant profits when the wave reaches a nice high point.
🌟 Multiple Rides, Bigger Adventures
This strategy allows us to take multiple positions simultaneously—like riding several waves at once, up to 5. Each trade we make uses only 10% of our trading capital, keeping risks manageable and giving us multiple opportunities to win big.
🗺️ Easy to Follow Settings
Here are the basic settings we use:
- Fast EMA**: 16
- Slow EMA**: 30
- RSI Length**: 9
- RSI Threshold**: 50
- ATR Length**: 21
- ATR Stop-Loss Multiplier**: 8
- ATR Take-Profit Multiplier**: 11
These settings are flexible—you can adjust them to better suit different markets or your personal trading style.
🎉 Riding the Waves of Success
This simple yet powerful swing trading approach helps you confidently enter trades, clearly know when to exit, and effectively manage your risk. It’s a reliable way to ride market waves, capture profits, and minimize losses.
Happy trading, and may you find many profitable waves to ride! 🌊✨
Please test, and take into account that it depends on taking multiple longs within the swing, and you only get to invest 25/30% of your equity.

Combined Support & Resistance IndicatorsPivot Points Calculation:
The script calculates the Pivot Point as the average of the high price (high), low price (low), and closing price (close) of the current bar.
The Pivot Point is plotted on the chart as a red line.
Support and Resistance Levels:
The Support Level is calculated as the lowest price over the last lookback bars.
The Resistance Level is calculated as the highest price over the last lookback bars.
These levels are displayed on the chart using horizontal lines: green for support and red for resistance.
Momentum Indicators:
RSI (Relative Strength Index): A momentum oscillator calculated based on the closing price over the last 14 bars. It is plotted as a yellow line.
MACD (Moving Average Convergence Divergence): An indicator consisting of the MACD line (blue) and the signal line (orange). It is calculated based on the closing price.
Moving Averages:
SMA 20: A simple moving average over the last 20 bars. It is plotted as a green line.
SMA 50: A simple moving average over the last 50 bars. It is plotted as a red line.
Dynamic Levels Drawing:
Instead of using hline (which does not support dynamic values), the script uses line.new to draw dynamic support and resistance levels. These lines are updated on each bar.

Triple Differential Moving Average BraidThe Triple Differential Moving Average Braid weaves together three distinct layers of moving averages—short-term, medium-term, and long-term—providing a structured view of market trends across multiple time horizons. It is an integrated construct optimized exclusively for the 1D timeframe. For multi-timeframe analysis and/or trading the lower 1h and 15m charts, it pairs well the Granular Daily Moving Average Ribbon ... adjust the visibility settings accordingly.
Unlike traditional moving average indicators that use a single moving average crossover, this braid-style system incorporates both SMAs and EMAs. The dual-layer approach offers stability and responsiveness, allowing traders to detect trend shifts with greater confidence.
Users can, of course, specify their own color scheme. The indicator consists of three layered moving average pairs. These are named per their default colors:
1. Silver Thread – Tracks immediate price momentum.
2. Royal Guard – Captures market structure and developing trends.
3. Golden Section – Defines major market cycles and overall trend direction.
Each layer is color-coded and dynamically shaded based on whether the faster-moving average is above or below its slower counterpart, providing a visual representation of market strength and trend alignment.
🧵 Silver Thread
The Silver Thread is the fastest-moving layer, comprising the 21D SMA and a 21D EMA. The choice of 21 is intentional, as it corresponds to approximately one full month of trading days in a 5-day-per-week market and is also a Fibonacci number, reinforcing its use in technical analysis.
· The 21D SMA smooths out recent price action, offering a baseline for short-term structure.
· The 21D EMA reacts more quickly to price changes, highlighting shifts in momentum.
· When the SMA is above the EMA, price action remains stable.
· When the SMA falls below the EMA, short-term momentum weakens.
The Silver Thread is a leading indicator within the system, often flipping direction before the medium- and long-term layers follow suit. If the Silver Thread shifts bearish while the Royal Guard remains bullish, this can signal a temporary pullback rather than a full trend reversal.
👑 Royal Guard
The Royal Guard provides a broader perspective on market momentum by using a 50D EMA and a 200D EMA. EMAs prioritize recent price data, making this layer faster-reacting than the Golden Section while still offering a level of stability.
· When the 50D EMA is above the 200D EMA, the market is in a confirmed uptrend.
· When the 50D EMA crosses below the 200D EMA, momentum has shifted bearish.
This layer confirms medium-term trend structure and reacts more quickly to price changes than traditional SMAs, making it especially useful for trend-following traders who need faster confirmation than the Golden Section provides.
If the Silver Thread flips bearish while the Royal Guard remains bullish, traders may be seeing a momentary dip in an otherwise intact uptrend. Conversely, if both the Silver Thread and Royal Guard shift bearish, this suggests a deeper pullback or possible trend reversal.
📜 Golden Section
The Golden Section is the slowest and most stable layer of the system, utilizing a 50D SMA and a 200D SMA—a classic combination used by long-term traders and institutions.
· When the 50D SMA is above the 200D SMA the market is in a strong, sustained uptrend.
· When the 50D SMA falls below the 200D SMA the market is structurally bearish.
Because SMAs give equal weight to past price data, this layer moves slowly and deliberately, ensuring that false breakouts or temporary swings do not distort the bigger picture.
Traders can use the Golden Section to confirm major market trends—when all three layers are bullish, the market is strongly trending upward. If the Golden Section remains bullish while the Royal Guard turns bearish, this may indicate a medium-term correction within a larger uptrend rather than a full reversal.
🎯 Swing Trade Setups
Swing traders can benefit from the multi-layered approach of this indicator by aligning their trades with the overall market structure while capturing short-term momentum shifts.
· Bullish: Look for Silver Thread and Royal Guard alignment before entering. If the Silver Thread flips bullish first, anticipate a momentum shift. If the Royal Guard follows, this confirms a strong medium-term move.
· Bearish: If the Silver Thread turns bearish first, it may signal an upcoming reversal. Waiting for the Royal Guard to follow adds confirmation.
· Confirmation: If the Golden Section remains bullish, a pullback may be an opportunity to enter a trend continuation trade rather than exit prematurely.
🚨 Momentum Shifts
· If the Silver Thread flips bearish but the Royal Guard remains bullish, traders may opt to buy the dip rather than exit their positions.
· If both the Silver Thread and Royal Guard turn bearish, traders should exercise caution, as this suggests a more significant correction.
· When all three layers align in the same direction the market is in a strong trending phase, making swing trades higher probability.
⚠️ Risk Management
· A narrowing of the shaded areas suggests trend exhaustion—consider tightening stop losses.
· When the Golden Section remains bullish, but the other two layers weaken, potential support zones to enter or re-enter positions.
· If all three layers flip bearish, this may indicate a larger trend reversal, prompting an exit from long positions and/or consideration of short setups.
The Triple Differential Moving Average Braid is layered, structured tool for trend analysis, offering insights across multiple timeframes without requiring traders to manually compare different moving averages. It provides a powerful and intuitive way to read the market. Swing traders, trend-followers, and position traders alike can use it to align their trades with dominant market trends, time pullbacks, and anticipate momentum shifts.
By understanding how these three moving average layers interact, traders gain a deeper, more holistic perspective of market structure—one that adapts to both momentum-driven opportunities and longer-term trend positioning.

SMA Crossover with RSI ConfirmationThis is a sniper entry indicator that provides Buy and Sell signals using other Indicators to give the best possible Entries
Moving Average Crossovers:
The indicator uses two moving averages: a short-term SMA (Simple Moving Average) and a long-term SMA.
When the short-term SMA crosses above the long-term SMA, it generates a buy signal (indicating potential upward momentum).
When the short-term SMA crosses below the long-term SMA, it generates a sell signal (indicating potential downward momentum).
RSI Confirmation:
The indicator incorporates RSI (Relative Strength Index) to confirm the buy and sell signals generated by the moving average crossovers.
RSI is used to gauge the overbought and oversold conditions of the market.
A buy signal is confirmed if RSI is below a specified overbought level, indicating potential buying opportunity.
A sell signal is confirmed if RSI is above a specified oversold level, indicating potential selling opportunity.
Dynamic Take Profit and Stop Loss:
The indicator calculates dynamic take profit and stop loss levels based on the Average True Range (ATR).
ATR is used to gauge market volatility, and the take profit and stop loss levels are adjusted accordingly.
This feature helps traders to manage their risk effectively by setting appropriate profit targets and stop loss levels.
Combining the information provided by these, the indicator will provide an entry point with a provided take profit and stop loss. The indicator can be applied to different asset classes. Risk management must be applied when using this indicator as it is not 100% guaranteed to be profitable.

Hull Suite by MRS**Hull Suite by MRS Strategy Indicator**
The Hull Suite by MRS Strategy is a technical analysis tool designed to provide insights into market trends using variations of the Hull Moving Average (HMA). This strategy aims to help traders identify optimal entry points for both long and short positions by utilizing multiple types of Hull-based indicators.
### Key Features:
1. **Hull Moving Average Variations**: The indicator offers three different Hull Moving Average variants:
- **HMA (Hull Moving Average)**: A fast-moving average that minimizes lag and reacts quickly to price changes.
- **EHMA (Enhanced Hull Moving Average)**: A smoother version of HMA with reduced noise, offering a clearer view of market trends.
- **THMA (Triple Hull Moving Average)**: A more complex Hull average that aims to provide a stronger confirmation of trend direction.
2. **Customizable Parameters**:
- **Source Selection**: Allows traders to choose the source for calculation (e.g., closing prices).
- **Length**: A configurable parameter to adjust the period over which the moving average is calculated (e.g., 55-period for swing entries).
- **Trend Coloring**: Users can enable automatic color-coding of the Hull moving average to reflect whether the market is in an uptrend (green) or downtrend (red).
- **Candle Color**: Option to color candles based on Hull's trend, further improving the visual clarity of trend direction.
3. **Entry and Exit Signals**:
- **Buy Signal**: Generated when the Hull moving average crosses above its historical value, indicating a potential upward price movement.
- **Sell Signal**: Triggered when the Hull moving average crosses below its historical value, signaling a potential downward price movement.
- The strategy can be customized to work with long, short, or both directions, making it adaptable for various market conditions.
4. **Visual Representation**:
- **Hull Bands**: The indicator can plot the Hull moving average as bands, with customizable transparency to suit individual preferences.
- **Band Filler**: The area between the two Hull moving averages is filled, making it easier to identify trends at a glance.
5. **Backtesting and Strategy Execution**: This strategy can be tested on historical data with adjustable backtest start and stop dates, providing traders with a better understanding of its performance before live trading.
### Purpose:
The Hull Suite by MRS Strategy is designed to assist traders in determining the optimal time to enter and exit the market based on robust Hull moving averages. With its flexibility, it can be used for trend-following, swing trading, or other strategic applications.

Multi-Step FlexiMA - Strategy [presentTrading]It's time to come back! hope I can not to be busy for a while.
█ Introduction and How It Is Different
The FlexiMA Variance Tracker is a unique trading strategy that calculates a series of deviations between the price (or another indicator source) and a variable-length moving average (MA). Unlike traditional strategies that use fixed-length moving averages, the length of the MA in this system varies within a defined range. The length changes dynamically based on a starting factor and an increment factor, creating a more adaptive approach to market conditions.
This strategy integrates Multi-Step Take Profit (TP) levels, allowing for partial exits at predefined price increments. It enables traders to secure profits at different stages of a trend, making it ideal for volatile markets where taking full profits at once might lead to missed opportunities if the trend continues.
BTCUSD 6hr Performance
█ Strategy, How It Works: Detailed Explanation
🔶 FlexiMA Concept
The FlexiMA (Flexible Moving Average) is at the heart of this strategy. Unlike traditional MA-based strategies where the MA length is fixed (e.g., a 50-period SMA), the FlexiMA varies its length with each iteration. This is done using a **starting factor** and an **increment factor**.
The formula for the moving average length at each iteration \(i\) is:
`MA_length_i = indicator_length * (starting_factor + i * increment_factor)`
Where:
- `indicator_length` is the user-defined base length.
- `starting_factor` is the initial multiplier of the base length.
- `increment_factor` increases the multiplier in each iteration.
Each iteration applies a **simple moving average** (SMA) to the chosen **indicator source** (e.g., HLC3) with a different length based on the above formula. The deviation between the current price and the moving average is then calculated as follows:
`deviation_i = price_current - MA_i`
These deviations are normalized using one of the following methods:
- **Max-Min normalization**:
`normalized_i = (deviation_i - min(deviations)) / range(deviations)`
- **Absolute Sum normalization**:
`normalized_i = deviation_i / sum(|deviation_i|)`
The **median** and **standard deviation (stdev)** of the normalized deviations are then calculated as follows:
`median = median(normalized deviations)`
For the standard deviation:
`stdev = sqrt((1/(N-1)) * sum((normalized_i - mean)^2))`
These values are plotted to provide a clear indication of how the price is deviating from its variable-length moving averages.
For more detail:
🔶 Multi-Step Take Profit
This strategy uses a multi-step take profit system, allowing for exits at different stages of a trade based on the percentage of price movement. Three take-profit levels are defined:
- Take Profit Level 1 (TP1): A small, quick profit level (e.g., 2%).
- Take Profit Level 2 (TP2): A medium-level profit target (e.g., 8%).
- Take Profit Level 3 (TP3): A larger, more ambitious target (e.g., 18%).
At each level, a corresponding percentage of the trade is exited:
- TP Percent 1: E.g., 30% of the position.
- TP Percent 2: E.g., 20% of the position.
- TP Percent 3: E.g., 15% of the position.
This approach ensures that profits are locked in progressively, reducing the risk of market reversals wiping out potential gains.
Local
🔶 Trade Entry and Exit Conditions
The entry and exit signals are determined by the interaction between the **SuperTrend Polyfactor Oscillator** and the **median** value of the normalized deviations:
- Long entry: The SuperTrend turns bearish, and the median value of the deviations is positive.
- Short entry: The SuperTrend turns bullish, and the median value is negative.
Similarly, trades are exited when the SuperTrend flips direction.
* The SuperTrend Toolkit is made by @EliCobra
█ Trade Direction
The strategy allows users to specify the desired trade direction:
- Long: Only long positions will be taken.
- Short: Only short positions will be taken.
- Both: Both long and short positions are allowed based on the conditions.
This flexibility allows the strategy to adapt to different market conditions and trading styles, whether you're looking to buy low and sell high, or sell high and buy low.
█ Usage
This strategy can be applied across various asset classes, including stocks, cryptocurrencies, and forex. The primary use case is to take advantage of market volatility by using a flexible moving average and multiple take-profit levels to capture profits incrementally as the market moves in your favor.
How to Use:
1. Configure the Inputs: Start by adjusting the **Indicator Length**, **Starting Factor**, and **Increment Factor** to suit your chosen asset. The defaults work well for most markets, but fine-tuning them can improve performance.
2. Set the Take Profit Levels: Adjust the three **TP levels** and their corresponding **percentages** based on your risk tolerance and the expected volatility of the market.
3. Monitor the Strategy: The SuperTrend and the FlexiMA variance tracker will provide entry and exit signals, automatically managing the positions and taking profits at the pre-set levels.
█ Default Settings
The default settings for the strategy are configured to provide a balanced approach that works across different market conditions:
Indicator Length (10):
This controls the base length for the moving average. A lower length makes the moving average more responsive to price changes, while a higher length smooths out fluctuations, making the strategy less sensitive to short-term price movements.
Starting Factor (1.0):
This determines the initial multiplier applied to the moving average length. A higher starting factor will increase the average length, making it slower to react to price changes.
Increment Factor (1.0):
This increases the moving average length in each iteration. A larger increment factor creates a wider range of moving average lengths, allowing the strategy to track both short-term and long-term trends simultaneously.
Normalization Method ('None'):
Three methods of normalization can be applied to the deviations:
- None: No normalization applied, using raw deviations.
- Max-Min: Normalizes based on the range between the maximum and minimum deviations.
- Absolute Sum: Normalizes based on the total sum of absolute deviations.
Take Profit Levels:
- TP1 (2%): A quick exit to capture small price movements.
- TP2 (8%): A medium-term profit target for stronger trends.
- TP3 (18%): A long-term target for strong price moves.
Take Profit Percentages:
- TP Percent 1 (30%): Exits 30% of the position at TP1.
- TP Percent 2 (20%): Exits 20% of the position at TP2.
- TP Percent 3 (15%): Exits 15% of the position at TP3.
Effect of Variables on Performance:
- Short Indicator Lengths: More responsive to price changes but prone to false signals.
- Higher Starting Factor: Slows down the response, useful for longer-term trend following.
- Higher Increment Factor: Widens the variability in moving average lengths, making the strategy adapt to both short-term and long-term price trends.
- Aggressive Take Profit Levels: Allows for quick profit-taking in volatile markets but may exit positions prematurely in strong trends.
The default configuration offers a moderate balance between short-term responsiveness and long-term trend capturing, suitable for most traders. However, users can adjust these variables to optimize performance based on market conditions and personal preferences.

MCDX+RSI+SMA[THANHCONG]### Detailed Analysis of the MCDX+RSI+SMA Indicator
The MCDX+RSI+SMA indicator is designed to help investors conduct a deeper analysis of market trends by combining multiple technical factors into a single chart. This integration of popular indicators such as RSI, SMA, and Stochastic RSI provides investors with a comprehensive view of market movements, particularly in distinguishing between "Banker" and "Hot Money"—representing large and small capital flows.
#### Key Components of the Indicator:
1. **RSI for Banker and Hot Money:**
- **RSI (Relative Strength Index)** is a momentum oscillator that measures the speed and change of price movements, indicating overbought or oversold conditions. In this indicator, there are two distinct RSI lines configured for Banker (large capital) and Hot Money (small capital).
- Investors can adjust parameters like the RSI calculation period, baseline levels, and sensitivity for each type of capital flow, providing flexibility to adapt to varying market conditions.
2. **Moving Average (MA) of RSI:**
- The indicator employs two common types of Moving Averages: **SMA (Simple Moving Average)** and **EMA (Exponential Moving Average)**. These help smooth the RSI signals for Banker, offering a clearer view of the long-term trend of large capital in the market.
- Investors can select the type and period of the MA, allowing them to optimize the indicator for their trading style.
3. **Stochastic RSI:**
- The **Stochastic RSI** is incorporated to monitor overbought and oversold conditions over a specified timeframe. Parameters related to %K and %D of the Stochastic can also be adjusted to refine the accuracy of market signal analysis.
- A notable feature is the normalization of %K and %D on a 0-20 scale, making these lines compatible with other RSI charts, thus providing consistency in evaluating market strength.
4. **Overbought and Oversold Levels:**
- The indicator includes reference lines for overbought and oversold levels, aiding investors in identifying potential reversal zones in the market. This helps to avoid buying at excessively high prices or selling at excessively low prices.
#### Benefits for Investors:
- **Comprehensive View:** The indicator combines insights from both large (Banker) and small (Hot Money) capital flows, enabling investors to analyze not just trends but also the participation of each type of capital in the market.
- **Enhanced Technical Analysis:** By integrating multiple technical indicators within a single chart, investors can track important factors such as market momentum, overbought/oversold conditions, and capital flow shifts without needing to switch between various charts.
- **Flexibility and Customization:** The indicator allows adjustment of key parameters like the RSI period, sensitivity, type of MA, and Stochastic RSI settings, enabling investors to tailor the indicator to their trading strategy and timeframe.
- **Higher Reliability:** The combination of indicators like RSI, Stochastic RSI, and MA helps investors confirm trading signals more confidently. For instance, when both RSI and Stochastic RSI indicate overbought conditions, the likelihood of a reversal may be higher, reducing risk for investors.
#### Unique Features of the Indicator:
The MCDX+RSI+SMA indicator is a unique tool that integrates various market analysis factors into a single framework. This not only provides investors with a complete view of capital flows but also aids in optimizing decision-making based on multiple market aspects. Furthermore, its customizable parameters make it suitable for various trading strategies, from short-term to long-term.
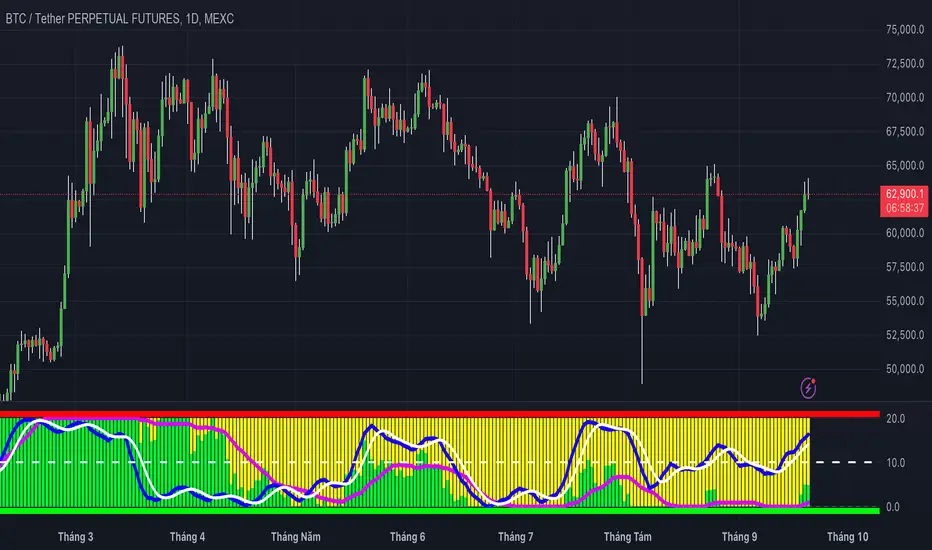
Kaiser Window MAKaiser Window Moving Average Indicator
The Kaiser Window Moving Average is a technical indicator that implements the Kaiser window function in the context of a moving average. This indicator serves as an example of applying the Kaiser window and the modified Bessel function of the first kind in technical analysis, providing an open-source implementation of these functions in the TradingView Pine Script ecosystem.
Key Components
Kaiser Window Implementation
This indicator incorporates the Kaiser window, a parameterized window function with certain frequency response characteristics. By making this implementation available in Pine Script, it allows for exploration and experimentation with the Kaiser window in the context of financial time series analysis.
Modified Bessel Function of the First Kind
The indicator includes an implementation of the modified Bessel function of the first kind, which is integral to the Kaiser window calculation. This mathematical function is now accessible within TradingView, potentially useful for other custom indicators or studies.
Customizable Alpha Parameter
The indicator features an adjustable alpha parameter, which directly influences the shape of the Kaiser window. This parameter allows for experimentation with the indicator's behavior:
Lower alpha values: The indicator's behavior approaches that of a Simple Moving Average (SMA)
Moderate alpha values: The behavior becomes more similar to a Weighted Moving Average (WMA)
Higher alpha values: Increases the weight of more recent data points
In signal processing terms, the alpha parameter affects the trade-off between main-lobe width and side lobe level in the frequency domain.
Centered and Non-Centered Modes
The indicator offers two operational modes:
Non-Centered (Real-time) Mode: Uses half of the Kaiser window, starting from the peak. This mode operates similarly to traditional moving averages, suitable for real-time analysis.
Centered Mode: Utilizes the full Kaiser window, resulting in a phase-correct filter. This mode introduces a delay equal to half the window size, with the plot automatically offset to align with the correct time points.
Visualization Options
The indicator includes several visualization features to aid in analysis:
Gradient Coloring: Offers three gradient options:
• Three-color gradient: Includes a neutral color
• Two-color gradient: Traditional up/down color scheme
• Solid color: For a uniform appearance
Glow Effect: An optional visual enhancement for the moving average line.
Background Fill: An option to fill the area between the moving average and the price.
Use Cases
The Kaiser Window Moving Average can be applied similarly to other moving averages. Its primary value lies in providing an example implementation of the Kaiser window and modified Bessel function in TradingView. It serves as a starting point for traders and analysts interested in exploring these mathematical concepts in the context of technical analysis.
Conclusion
The Kaiser Window Moving Average indicator demonstrates the application of the Kaiser window function in a moving average calculation. By providing open-source implementations of the Kaiser window and the modified Bessel function of the first kind, this indicator contributes to the expansion of available mathematical tools in the TradingView Pine Script environment, potentially facilitating further experimentation and development in technical analysis.

Moving Average Ratio [InvestorUnknown]Overview
The "Moving Average Ratio" (MAR) indicator is a versatile tool designed for valuation, mean-reversion, and long-term trend analysis. This indicator provides multiple display modes to cater to different analytical needs, allowing traders and investors to gain deeper insights into the market dynamics.
Features
1. Moving Average Ratio (MAR):
Calculates the ratio of the chosen source (close, open, ohlc4, hl2 …) to a longer-term moving average of choice (SMA, EMA, HMA, WMA, DEMA)
Useful for identifying overbought or oversold conditions, aiding in mean-reversion strategies and valuation of assets.
For some high beta asset classes, like cryptocurrencies, you might want to use logarithmic scale for the raw MAR, below you can see the visual difference of using Linear and Logarithmic scale on BTC
2. MAR Z-Score:
Computes the Z-Score of the MAR to standardize the ratio over chosen time period, making it easier to identify extreme values relative to the historical mean.
Helps in detecting significant deviations from the mean, which can indicate potential reversal points and buying/selling opportunities
3. MAR Trend Analysis:
Uses a combination of short-term (default 1, raw MAR) and long-term moving averages of the MAR to identify trend changes.
Provides a visual representation of bullish and bearish trends based on moving average crossings.
Using Logarithmic scale can improve the visuals for some asset classes.
4. MAR Momentum:
Measures the momentum of the MAR by calculating the difference over a specified period.
Useful for detecting changes in the market momentum and potential trend reversals.
5. MAR Rate of Change (ROC):
Calculates the rate of change of the MAR to assess the speed and direction of price movements.
Helps in identifying accelerating or decelerating trends.
MAR Momentum and Rate of Change are very similar, the only difference is that the Momentum is expressed in units of the MAR change and ROC is expressed as % change of MAR over chosen time period.
Customizable Settings
General Settings:
Display Mode: Select the display mode from MAR, MAR Z-Score, MAR Trend, MAR Momentum, or MAR ROC.
Color Bars: Option to color the bars based on the current display mode.
Wait for Bar Close: Toggle to wait for the bar to close before updating the MAR value.
MAR Settings:
Length: Period for the moving average calculation.
Source: Data source for the moving average calculation.
Moving Average Type: Select the type of moving average (SMA, EMA, WMA, HMA, DEMA).
Z-Score Settings:
Z-Score Length: Period for the Z-Score calculation.
Trend Analysis Settings:
Moving Average Type: Select the type of moving average for trend analysis (SMA, EMA).
Longer Moving Average: Period for the longer moving average.
Shorter Moving Average: Period for the shorter moving average.
Momentum Settings:
Momentum Length: Period for the momentum calculation.
Rate of Change Settings:
ROC Length: Period for the rate of change calculation.
Calculation and Plotting
Moving Average Ratio (MAR):
Calculates the ratio of the price to the selected moving average type and length.
Plots the MAR with a gradient color based on its Z-Score, aiding in visual identification of extreme values.
// Moving Average Ratio (MAR)
ma_main = switch ma_main_type
"SMA" => ta.sma(src, len)
"EMA" => ta.ema(src, len)
"WMA" => ta.wma(src, len)
"HMA" => ta.hma(src, len)
"DEMA" => ta.dema(src, len)
mar = (waitforclose ? src : src) / ma_main
z_col = color.from_gradient(z, -2.5, 2.5, color.green, color.red)
plot(disp_mode.mar ? mar : na, color = z_col, histbase = 1, style = plot.style_columns)
barcolor(color_bars ? (disp_mode.mar ? (z_col) : na) : na)
MAR Z-Score:
Computes the Z-Score of the MAR and plots it with a color gradient indicating the magnitude of deviation from the mean.
// MAR Z-Score
mean = ta.sma(math.log(mar), z_len)
stdev = ta.stdev(math.log(mar),z_len)
z = (math.log(mar) - mean) / stdev
plot(disp_mode.mar_z ? z : na, color = z_col, histbase = 0, style = plot.style_columns)
plot(disp_mode.mar_z ? 1 : na, color = color.new(color.red,70))
plot(disp_mode.mar_z ? 2 : na, color = color.new(color.red,50))
plot(disp_mode.mar_z ? 3 : na, color = color.new(color.red,30))
plot(disp_mode.mar_z ? -1 : na, color = color.new(color.green,70))
plot(disp_mode.mar_z ? -2 : na, color = color.new(color.green,50))
plot(disp_mode.mar_z ? -3 : na, color = color.new(color.green,30))
barcolor(color_bars ? (disp_mode.mar_z ? (z_col) : na) : na)
MAR Trend:
Plots the MAR along with its short-term and long-term moving averages.
Uses color changes to indicate bullish or bearish trends based on moving average crossings.
// MAR Trend - Moving Average Crossing
mar_ma_long = switch ma_trend_type
"SMA" => ta.sma(mar, len_trend_long)
"EMA" => ta.ema(mar, len_trend_long)
mar_ma_short = switch ma_trend_type
"SMA" => ta.sma(mar, len_trend_short)
"EMA" => ta.ema(mar, len_trend_short)
plot(disp_mode.mar_t ? mar : na, color = mar_ma_long < mar_ma_short ? color.new(color.green,50) : color.new(color.red,50), histbase = 1, style = plot.style_columns)
plot(disp_mode.mar_t ? mar_ma_long : na, color = mar_ma_long < mar_ma_short ? color.green : color.red, linewidth = 4)
plot(disp_mode.mar_t ? mar_ma_short : na, color = mar_ma_long < mar_ma_short ? color.green : color.red, linewidth = 2)
barcolor(color_bars ? (disp_mode.mar_t ? (mar_ma_long < mar_ma_short ? color.green : color.red) : na) : na)
MAR Momentum:
Plots the momentum of the MAR, coloring the bars to indicate increasing or decreasing momentum.
// MAR Momentum
mar_mom = mar - mar
// MAR Momentum
mom_col = mar_mom > 0 ? (mar_mom > mar_mom ? color.new(color.green,0): color.new(color.green,30)) : (mar_mom < mar_mom ? color.new(color.red,0): color.new(color.red,30))
plot(disp_mode.mar_m ? mar_mom : na, color = mom_col, histbase = 0, style = plot.style_columns)
MAR Rate of Change (ROC):
Plots the ROC of the MAR, using color changes to show the direction and strength of the rate of change.
// MAR Rate of Change
mar_roc = ta.roc(mar,len_roc)
// MAR ROC
roc_col = mar_roc > 0 ? (mar_roc > mar_roc ? color.new(color.green,0): color.new(color.green,30)) : (mar_roc < mar_roc ? color.new(color.red,0): color.new(color.red,30))
plot(disp_mode.mar_r ? mar_roc : na, color = roc_col, histbase = 0, style = plot.style_columns)
Summary:
This multi-purpose indicator provides a comprehensive toolset for various trading strategies, including valuation, mean-reversion, and trend analysis. By offering multiple display modes and customizable settings, it allows users to tailor the indicator to their specific analytical needs and market conditions.

Sniper Entry using RSI confirmationThis is a sniper entry indicator that provides Buy and Sell signals using other Indicators to give the best possible Entries (note: Entries will not be 100 percent accurate and analysis should be done to support an entry)
Moving Average Crossovers:
The indicator uses two moving averages: a short-term SMA (Simple Moving Average) and a long-term SMA.
When the short-term SMA crosses above the long-term SMA, it generates a buy signal (indicating potential upward momentum).
When the short-term SMA crosses below the long-term SMA, it generates a sell signal (indicating potential downward momentum).
RSI Confirmation:
The indicator incorporates RSI (Relative Strength Index) to confirm the buy and sell signals generated by the moving average crossovers.
RSI is used to gauge the overbought and oversold conditions of the market.
A buy signal is confirmed if RSI is below a specified overbought level, indicating potential buying opportunity.
A sell signal is confirmed if RSI is above a specified oversold level, indicating potential selling opportunity.
Dynamic Take Profit and Stop Loss:
The indicator calculates dynamic take profit and stop loss levels based on the Average True Range (ATR).
ATR is used to gauge market volatility, and the take profit and stop loss levels are adjusted accordingly.
This feature helps traders to manage their risk effectively by setting appropriate profit targets and stop loss levels.
Combining the information provided by these, the indicator will provide an entry point with a provided take profit and stop loss. The indicator can be applied to different asset classes. Risk management must be applied when using this indicator as it is not 100% guaranteed to be profitable.
Goodluck!
