Portfolio Strategy TesterThe Portfolio Strategy Tester is an institutional-grade backtesting framework that evaluates the performance of trend-following strategies on multi-asset portfolios. It enables users to construct custom portfolios of up to 30 assets and apply moving average crossover strategies across individual holdings. The model features a clear, color-coded table that provides a side-by-side comparison between the buy-and-hold portfolio and the portfolio using the risk management strategy, offering a comprehensive assessment of both approaches relative to the benchmark.
Portfolios are constructed by entering each ticker symbol in the menu, assigning its respective weight, and reviewing the total sum of individual weights displayed at the top left of the table. For strategy selection, users can choose between Exponential Moving Average (EMA), Simple Moving Average (SMA), Wilder’s Moving Average (RMA), Weighted Moving Average (WMA), Moving Average Convergence Divergence (MACD), and Volume-Weighted Moving Average (VWMA). Moving average lengths are defined in the menu and apply only to strategy-enabled assets.
To accurately replicate real-world portfolio conditions, users can choose between daily, weekly, monthly, or quarterly rebalancing frequencies and decide whether cash is held or redistributed. Daily rebalancing maintains constant portfolio weights, while longer intervals allow natural drift. When cash positions are not allowed, capital from bearish assets is automatically redistributed proportionally among bullish assets, ensuring the portfolio remains fully invested at all times. The table displays a comprehensive set of widely used institutional-grade performance metrics:
CAGR = Compounded annual growth rate of returns.
Volatility = Annualized standard deviation of returns.
Sharpe = CAGR per unit of annualized standard deviation.
Sortino = CAGR per unit of annualized downside deviation.
Calmar = CAGR relative to maximum drawdown.
Max DD = Largest peak-to-trough decline in value.
Beta (β) = Sensitivity of returns relative to benchmark returns.
Alpha (α) = Excess annualized risk-adjusted returns relative to benchmark.
Upside = Ratio of average return to benchmark return on up days.
Downside = Ratio of average return to benchmark return on down days.
Tracking = Annualized standard deviation of returns versus benchmark.
Turnover = Average sum of absolute changes in weights per year.
Cumulative returns are displayed on each label as the total percentage gain from the selected start date, with green indicating positive returns and red indicating negative returns. In the table, baseline metrics serve as the benchmark reference and are always gray. For portfolio metrics, green indicates outperformance relative to the baseline, while red indicates underperformance relative to the baseline. For strategy metrics, green indicates outperformance relative to both the baseline and the portfolio, red indicates underperformance relative to both, and gray indicates underperformance relative to either the baseline or portfolio. Metrics such as Volatility, Tracking Error, and Turnover ratio are always displayed in gray as they serve as descriptive measures.
In summary, the Portfolio Strategy Tester is a comprehensive backtesting tool designed to help investors evaluate different trend-following strategies on custom portfolios. It enables real-world simulation of both active and passive investment approaches and provides a full set of standard institutional-grade performance metrics to support data-driven comparisons. While results are based on historical performance, the model serves as a powerful portfolio management and research framework for developing, validating, and refining systematic investment strategies.
Pesquisar nos scripts por "moving average crossover"

7-Channel Trend Meter v3🔥 7-Channel Trend Meter – Ultimate Trend Confirmation Tool 💹
Purpose: Supplementary indicator used as confirmation
The 7-Channel Trend Meter offers an all-in-one confirmation system that combines 7 high-accuracy indicators into one easy-to-read visual tool. Say goodbye to guesswork and unnecessary tab-switching—just clear, actionable signals for smarter trades. Whether you're trading stocks, crypto, or forex, this indicator streamlines your decision-making process and enhances your strategy’s performance.
⚙️ What’s Inside The Box?
Here is each tool that the Trend Meter uses, and why/how they're used:
Average Directional Index: Confirms market strength ✅
Directional Movement Index: Confirms trend direction ✅
EMA Cross: Confirms reversals in trend through average price ✅
Relative Strength Index: Confirms trend through divergences ✅
Stochastic Oscillator: Confirms shifts in momentum ✅
Supertrend: Confirms trend-following using ATR calculations ✅
Volume Delta: Confirms buying/selling pressure weight by finding differences ✅
🧾 How To Read It:
🟨 Bar 1 – Market Strength Meter:
Light Gold 🟡: Strong market with trending conditions.
Dark Gold 🟤: Weakening market or consolidation—proceed with caution.
📊 Bars 2 to 7 – Trend Direction Confirmations:
🟩 Green: Bullish signal, uptrend likely.
🟥 Red: Bearish signal, downtrend likely.
💯 Why it's helpful to traders:
✅ 7 Confirmations in 1 View: No need to flip between multiple charts.
✅ Visual Clarity: Spot trends instantly with a quick glance.
✅ Perfect for Entry Confirmation: Confirm trade signals before pulling the trigger.
✅ Boosts Your Win Rate: Make data-backed decisions, not guesses.
✅ Works Across Multiple Markets: Stocks, crypto, forex—you name it 🌍.
🤔 "What's with the indicator mashup/How do these components work together? 🤔
The 7-Channel Trend Meter is designed as an original and useful tool that integrates multiple indicators to enhance trading decisions, rather than merely combining existing tools without logical coherence. This strategic mashup creates a comprehensive analysis framework that offers deeper insights into market conditions by capitalizing on each component's unique strengths. The careful integration of seven indicators creates a unified system that eliminates conflicting signals and enhances the decision-making process. Rather than simply merging indicators for the sake of it, the 7-Channel Trend Meter is designed to streamline trading strategies, making it a practical tool for traders across various markets. By leveraging the combined strengths of these indicators, traders can act with greater confidence, backed by comprehensive data rather than fragmented insights. Here’s how they synergistically work together:
Average Directional Index (ADX) and Directional Movement Index (DMI): The reason for this mashup is because ADX indicates the strength of the prevailing trend, while the DMI pinpoints its direction. Together, they equip traders with a dual framework that not only identifies whether to engage with a trend but also quantifies its strength, allowing for more decisive trading strategies.
EMA Cross: The reason for this addition to the mashup is because this tool signals potential trend reversals by identifying moving average crossovers. When combined with the ADX and DMI, traders can better differentiate between genuine trend shifts and market noise, leading to more accurate entries.
Relative Strength Index (RSI) and Stochastic Oscillator: The reason for this mashup is because by using both momentum indicators, traders gain a multifaceted view of market dynamics. The RSI assesses overbought or oversold conditions, while the Stochastic Oscillator confirms momentum shifts. When both agree with the trend signals from the DMI, it enhances the reliability of reversal or continuation strategies.
Supertrend: The reason for this addition to the mashup is because as a trailing stop based on market volatility, the Supertrend indicator works hand-in-hand with the ADX’s strength assessment, allowing traders to ride strong trends while managing risk. This cohesion prevents premature exits during minor pullbacks.
Volume Delta: The reason for this addition to the mashup is because integrating volume analysis helps validate signals from the price action indicators. Significant volume behind a price movement reinforces the likelihood of its continuation, ensuring that traders can act on well-supported signals.
🔍 How it does what it says it does 🔍
While the exact calculations remain proprietary, the following outlines how the components synergistically work to aid traders in making informed decisions:
Market Strength Assessment: Average Directional Index (ADX)
This component is used as confirmation by measuring the strength of the market trend on a scale from 0 to 100. A reading above 20 generally indicates a strong trend, while readings below 20 suggest sideways movement. The Trend Meter flags strong trends, effectively helping traders identify optimal conditions for entering positions.
Trend Direction Confirmation: Directional Movement Index (DMI)
This component is used as confirmation by distinguishing between bullish and bearish trends by evaluating price movements. This combination allows traders to confirm not only if a trend exists but also its direction, informing whether to buy or sell.
Trend Reversal Detection: Exponential Moving Average (EMA) Cross
This component is used as confirmation by calculating two EMAs (one shorter and one longer) to identify potential reversal points. When the shorter EMA crosses above the longer EMA, it signals a bullish reversal, and vice versa for bearish reversals. This helps traders pinpoint optimal entry or exit points.
Momentum Analysis: Relative Strength Index (RSI) and Stochastic Oscillator
These components are used as confirmation by providing insights into momentum. The RSI assesses the speed and change of price movements, indicating overbought or oversold conditions. The Stochastic Oscillator compares a particular closing price to a range of prices over a specified period. This helps identify whether momentum is slowing or speeding up, offering a clear view of potential reversal points. When both the RSI and Stochastic Oscillator converge on signals, it increases the reliability of those signals in trading decisions.
Volatility-Based Trend Following: Supertrend
This component is used as confirmation by utilizing Average True Range (ATR) calculations to help traders stay in momentum-driven trades by providing dynamic support and resistance levels that adapt to volatility. This enables better risk management while allowing traders to capture stronger trends.
Volume Confirmation: Volume Delta
This component is used as confirmation by analyzing buying and selling pressure by measuring the difference between buy and sell volumes, offering critical insights into market sentiment. Significant volume behind a price movement increases confidence in the sustainability of that move.
🧠 Pro Tip:
When all 7 bars line up in green or red, it’s time to take action: load up for a confirmed move or sit back and wait for market confirmation. Let the Trend Meter guide your strategy with precision.
Conclusion:
Integrate the 7-Channel Trend Meter as useful confirmation for your TradingView strategy and stop trading like the average retail trader. This tool eliminates the noise and helps you stay focused on high-confidence trades.

Quantum Momentum FusionPurpose of the Indicator
"Quantum Momentum Fusion" aims to combine the strengths of RSI (Relative Strength Index) and Williams %R to create a hybrid momentum indicator tailored for volatile markets like crypto:
RSI: Measures the strength of price changes, great for understanding trend stability but can sometimes lag.
Williams %R: Assesses the position of the price relative to the highest and lowest levels over a period, offering faster responses but sensitive to noise.
Combination: By blending these two indicators with a weighted average (default 50%-50%), we achieve both speed and reliability.
Additionally, we use the indicator’s own SMA (Simple Moving Average) crossovers to filter out noise and generate more meaningful signals. The goal is to craft a simple yet effective tool, especially for short-term trading like scalping.
How Signals Are Generated
The indicator produces signals as follows:
Calculations:
RSI: Standard 14-period RSI based on closing prices.
Williams %R: Calculated over 14 periods using the highest high and lowest low, then normalized to a 0-100 scale.
Quantum Fusion: A weighted average of RSI and Williams %R (e.g., 50% RSI + 50% Williams %R).
Fusion SMA: 5-period Simple Moving Average of Quantum Fusion.
Signal Conditions:
Overbought Signal (Red Background):
Quantum Fusion crosses below Fusion SMA (indicating weakening momentum).
And Quantum Fusion is above 70 (in the overbought zone).
This is a sell signal.
Oversold Signal (Green Background):
Quantum Fusion crosses above Fusion SMA (indicating strengthening momentum).
And Quantum Fusion is below 30 (in the oversold zone).
This is a buy signal.
Filtering:
The background only changes color during crossovers, reducing “fake” signals.
The 70 and 30 thresholds ensure signals trigger only in extreme conditions.
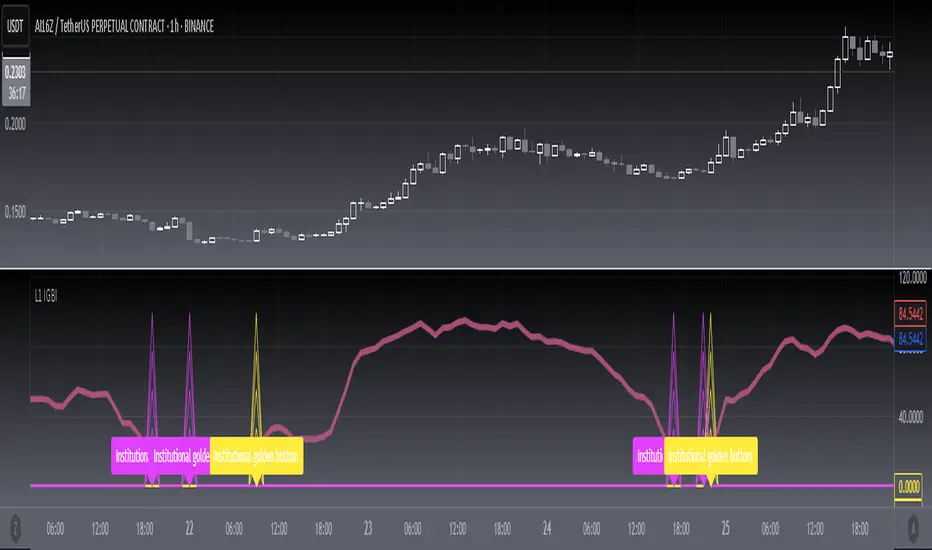
On the chart:
Purple line: Quantum Fusion.
Yellow line: Fusion SMA.
Red background: Sell signal (overbought confirmation).
Green background: Buy signal (oversold confirmation).
Overall Assessment
This indicator can be a fast-reacting tool for scalping. However:
Volatility Warning: Sudden crypto pumps/dumps can disrupt signals.
Confirmation: Pair it with price action (candlestick patterns) or another indicator (e.g., volume) for validation.
Timeframe: Works best on 1-5 minute charts.
Suggested Settings for Long Timeframes
Here’s a practical configuration for, say, a 4-hour chart:
RSI Period: 20
Williams %R Period: 20
RSI Weight: 60%
Williams %R Weight: 40% (automatically calculated as 100 - RSI Weight)
SMA Period: 15
Overbought Level: 75
Oversold Level: 25

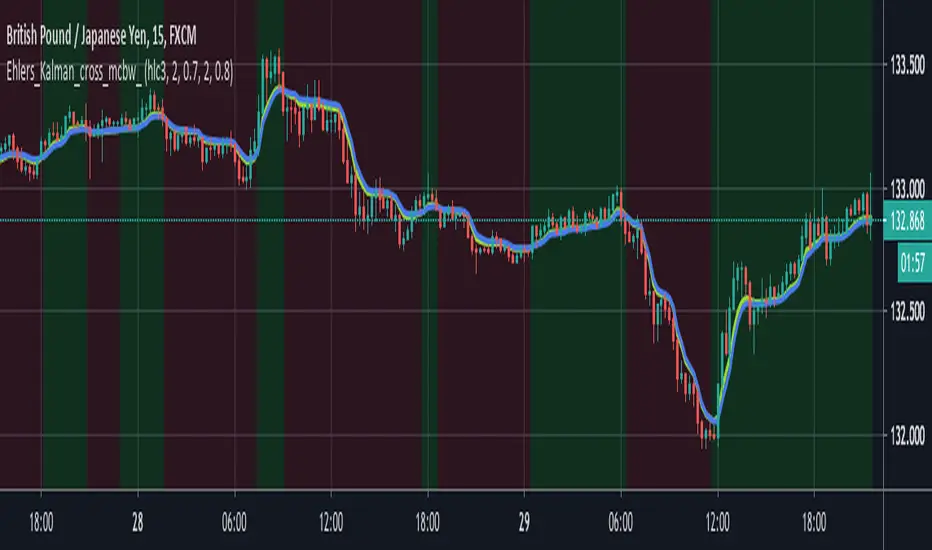
Moving Average Cross; Linear RegressionThis Pine Script is designed to display smoothed linear regression lines on a chart, with an option to adjust the regression period lengths and smoothing factor. The script calculates short-term and long-term linear regression lines based on the selected timeframe. These regression lines act as a regressed moving average cross , visually representing the interaction between the two smoothed linear regressions.
Short Regression Line: A linear regression line based on a short lookback period, colored blue for an uptrend and orange for a downtrend .
Long Regression Line: A linear regression line based on a longer lookback period, similarly colored blue for an uptrend and orange for a downtrend .
The script provides input options to adjust:
The length of short and long regression periods.
The smoothing length for the regression lines.
The timeframe for the linear regression calculations.
This tool can help traders observe the crossovers between the two smoothed linear regression lines, which are similar to moving average crossovers, but with the added benefit of regression-based smoothing to reduce noise. The color-coding allows for easy trend identification, with blue indicating an uptrend and orange indicating a downtrend.

[blackcat] L1 Institutional Golden Bottom Indicator█ OVERVIEW
The script " L1 Institutional Golden Bottom Indicator" is an indicator designed to identify potential institutional buying interest or a "golden bottom" in the market. It calculates a series of values based on price movements and plots them on a chart to help traders make informed decisions.
█ LOGICAL FRAMEWORK
The script is structured into several main sections:
1 — Function Definitions: Custom functions xsa and calculate_institutional_golden_bottom are defined.
2 — Input Parameters: The user can set a threshold value for institutional interest.
3 — Calculations: The script calculates various indicators and conditions, including the institutional buy signal.
4 — Plotting: The results of the calculations are plotted on the chart.
5 — Labeling: When a golden bottom is detected, a label is placed on the chart.
The flow of data starts with the input parameters, proceeds through the calculation functions, and finally results in plotted outputs and labels.
█ CUSTOM FUNCTIONS
1 — xsa(src, len, wei)
• Purpose: To calculate a weighted moving average.
• Parameters:
– src: Source data (e.g., price).
– len: Length of the moving average.
– wei: Weighting factor.
• Return Value: The calculated weighted moving average.
2 — calculate_institutional_golden_bottom(close, high, low, threshold)
• Purpose: To determine the institutional golden bottom indicator.
• Parameters:
– close: Closing price.
– high: Highest price.
– low: Lowest price.
– threshold: User-defined threshold for institutional interest. By tuning the threshold value the user can properly identify the institutional golden bottom of the instrument. So, I can say this parameter is used to tune the "sensitivity" of this indicator.
• Return Value: An array containing the institutional indicator, golden bottom signal, and additional values (a1, b1, c1, d1).
█ KEY POINTS AND TECHNIQUES
• Weighted Moving Average (WMA): The xsa function implements a weighted moving average, which is useful for smoothing price data.
• Crossover Detection: The script uses a crossover condition to detect when the institutional indicator crosses above the threshold, indicating a potential buying opportunity.
• Conditional Logic: The script includes conditional statements to control the output of certain values only when specific conditions are met.
• Plotting and Labeling: The script uses plot and label.new functions to visualize the indicator and highlight significant events on the chart.
█ EXTENDED KNOWLEDGE AND APPLICATIONS
• Modifications: The script could be enhanced by adding more customizable parameters, such as different lengths for the moving averages or additional conditions for the golden bottom signal.
• Extensions: Similar techniques could be applied to other types of indicators, such as momentum oscillators or trend-following systems to identify market turning points.
• Related Concepts: Understanding weighted moving averages, crossover signals, and conditional plotting in Pine Script would be beneficial for enhancing this script and applying similar logic to other trading strategies.
Adjustable Bull Bear Candle Indicator (V1.2)Indicator Description: Adjustable Bull Bear Candle Indicator
This indicator, named "Adjustable Bull Bear Candle Indicator ," is designed to assist traders in identifying potential bullish and bearish signals within price charts. It combines candlestick pattern analysis, moving average crossovers, and RSI (Relative Strength Index) conditions to offer insights into potential trading opportunities.
Disclaimer:
Trading involves substantial risk and is not suitable for every investor. This indicator is a tool designed to aid in technical analysis, but it does not guarantee successful trades. Always exercise your own judgment and seek professional advice before making any trading decisions.
Key Features:
Preceding Candles Analysis:
The indicator examines the behavior of the previous 'n' candles to identify specific patterns that indicate bearish or bullish momentum.
Candlestick Pattern and Momentum:
It considers the relationship between the opening and closing prices of the current candle to determine if it's bullish or bearish. The indicator then assesses the absolute price difference and compares it to the cumulative absolute differences of preceding candles.
Moving Averages:
The indicator calculates two Simple Moving Averages (SMAs) – Close SMA and Far SMA – to help identify trends and crossovers in price movement.
Relative Strength Index (RSI):
RSI is used as an additional measure to gauge momentum. It analyzes the current price's magnitude of recent gains and losses and compares it to past data.
Time Constraint:
If enabled, the indicator operates within a specific time window defined by the user. This feature can help traders focus on specific market hours.
Customizable Alerts:
The indicator includes an alert system that can be enabled or disabled. You can also adjust the specific alert conditions to align with your trading strategy.
How to Use:
This indicator generates buy signals when specific conditions are met, including a bullish candlestick pattern, positive price difference, closing price above the SMAs, RSI above a threshold, preceding bearish candles, and optionally within a specified time window. Conversely, short signals are generated under conditions opposite to those of the buy signal.
Disclosure and Risk Warning:
Educational Tool: This indicator is meant for educational purposes and to aid traders in their technical analysis. It's not a trading strategy in itself.
Risk of Loss: Trading carries inherent risks, including the potential for substantial loss. Always manage risk and consider using proper risk management techniques.
Diversification: Do not rely solely on this indicator. A well-rounded trading approach includes fundamental analysis, risk management, and proper diversification.
Consultation: It's strongly advised to consult with a financial professional before making any trading decisions.
Conclusion:
The "Bullish Candle after Bearish Candles with Momentum Indicator" can be a valuable tool in your technical analysis toolkit. However, successful trading requires a deep understanding of market dynamics, risk management, and continual learning. Use this indicator in conjunction with other tools and strategies to enhance your trading decisions.
Remember that past performance is not indicative of future results. Always be cautious and informed when participating in the financial markets.

RSI Impact Heat Map [Trendoscope]Here is a simple tool to measure and display outcome of certain RSI event over heat map.
🎲 Process
🎯Event
Event can be either Crossover or Crossunder of RSI on certain value.
🎯Measuring Impact
Impact of the event after N number of bars is measured in terms of highest and lowest displacement from the last close price. Impact can be collected as either number of times of ATR or percentage of price. Impact for each trigger is recorded separately and stored in array of custom type.
🎯Plotting Heat Map
Heat map is displayed using pine tables. Users can select heat map size - which can vary from 10 to 90. Selecting optimal size is important in order to get right interpretation of data. Having higher number of cells can give more granular data. But, chart may not fit into the window. Having lower size means, stats are combined together to get less granular data which may not give right picture of the results. Default value for size is 50 - meaning data is displayed in 51X51 cells.
Range of the heat map is adjusted automatically based on min and max value of the displacement. In order to filter out or merge extreme values, range is calculated based on certain percentile of the values. This will avoid displaying lots of empty cells which can obscure the actual impact.
🎲 Settings
Settings allow users to define their event, impact duration and reference, and few display related properties. The description of these parameters are as below:
🎲 Use Cases
In this script, we have taken RSI as an example to measure impact. But, we can do this for any event. This can be price crossing over/under upper/lower bollinger bands, moving average crossovers or even complex entry or exit conditions. Overall, we can use this to plot and evaluate our trade criteria.
🎲 Interpretation
Q1 - If more coloured dots appear on the top right corner of the table, then the event is considered to trigger high volatility and high risk environment.
Q2 - If more coloured dots appear on the top left corner, then the events are considered to trigger bearish environment.
Q3 - If more coloured dots appear on the bottom left corner of the chart, then the events are considered insignificant as they neither generate higher displacement in positive or negative side. You can further alter outlier percentage to reduce the bracket and hence have higher distribution move towards
Q4 - If more coloured dots appear on the bottom right corner, then the events are considered to trigger bullish environment.
Will also look forward to implement this as library so that any conditions or events can be plugged into it.

AMACD - All Moving Average Convergence DivergenceThis indicator displays the Moving Average Convergane and Divergence ( MACD ) of individually configured Fast, Slow and Signal Moving Averages. Buy and sell alerts can be set based on moving average crossovers, consecutive convergence/divergence of the moving averages, and directional changes in the histogram moving averages.
The Fast, Slow and Signal Moving Averages can be set to:
Exponential Moving Average ( EMA )
Volume-Weighted Moving Average ( VWMA )
Simple Moving Average ( SMA )
Weighted Moving Average ( WMA )
Hull Moving Average ( HMA )
Exponentially Weighted Moving Average (RMA) ( SMMA )
Symmetrically Weighted Moving Average ( SWMA )
Arnaud Legoux Moving Average ( ALMA )
Double EMA ( DEMA )
Double SMA (DSMA)
Double WMA (DWMA)
Double RMA ( DRMA )
Triple EMA ( TEMA )
Triple SMA (TSMA)
Triple WMA (TWMA)
Triple RMA (TRMA)
Linear regression curve Moving Average ( LSMA )
Variable Index Dynamic Average ( VIDYA )
Fractal Adaptive Moving Average ( FRAMA )
If you have a strategy that can buy based on External Indicators use 'Backtest Signal' which returns a 1 for a Buy and a 2 for a sell.
'Backtest Signal' is plotted to display.none, so change the Style Settings for the chart if you need to see it for testing.

Swing EMAWhat is Swing EMA?
Swing EMA is an exponential moving average crossover-based indicator used for low-risk directional trading.
it's used for different types of Ema 20,50,100 and 200, 3 of them are plotted on chat 20,100,200.
100 and 200 Ema is used for showing support and resistance and it contains highlights area between them and its change color according to market crossover condition.
20 moving average is used for knowing Market Behaviour and changing its color according to crossover conditions of 50 and 20 Ema.
How does it work?
It contains 4 different types of moving averages 20,50,100, 200 out of 3 are plotted on the chart.
20 Ema is used for knowing current market behavior. Its changes its color based on the crossover of 50 Ema and 20 Ema, if 20 Ema is higher than 50 Ema then it changes its color to green, and its opposites are changed their color to red when 20 Ema is lower than 50 Ema.
100 and 200 Ema used as a support and resistance and is also contain highlighted areas between them its change their color based on the crossover if 100 Ema is higher than 200 Ema a then both of them are going to change color to Green and as an opposite, if 200 Ema is higher then 100 Ema is going to change its color to red.
So in simple word 100 and 200 Ema is used as support and resistance zone and 20 Ema is used to know current market behavior.
How to use it?
It is very easy to understand by looking at the example I gave where are the two different types of phrases. phrase bull phrase and bear phrase so 100 and 200 Ema is used as a support and resistance and to tell you which phrase is currently on the market on example there is a bull phrase on the left side and bear phrase on the right side by using your technical analysis you can find out a really good spot to buy your stocks on a bull phrase and too short on the bear phrase. 20 Ema is used as a knowing the current market behavior it doesn't make any difference on buying or selling as much as 100 Ema and 200 Ema.
Tips
Don't trade against the market.
Try trade on trending stocks rather than sideways stock.
The higher the area between 100 Ema and 200 Ema is the stronger the phrase.
Do Backtesting before real trading.
Enjoy Trading.

powerful moving average crossoverThis script is a simplified version of John Ehlers's adaption of Dr. Kalman's optimum estimator as applied to price action (More can be found on this here: www.dimensionetrading.com). Here I have adapted two of these optimum estimators to work together to provide crossover signals. The user can choose the input of this filter in the 'input source'. The 'Ratio of Uncertainties' controls how adaptive the moving averages are, increasing this number will increase adaptivity and vice versa for decreasing. The 'Kalman Gain' allows the user to choose how much error to let into the calculation. The smaller this number is the quicker the moving average will approach price action.
In practice this indicator is much smoother than most other moving averages and has significantly less whiplash while still getting very early entries. If anyone wants to adapt this script for their own uses please feel free. Message me what you make with it, I am very curious what this can do when in the right hands!
Happy trading!
Easy [CHE] Easy — Minimalist Pine Script for detecting EMA direction changes to define fixed price zones for simple support and resistance visualization, ideal for manual trading workflows.
Summary
This indicator's programming is kept minimalist and super simple, with core logic in under 20 lines for easy comprehension and modification. It creates fixed price zones based on divergences between a base exponential moving average and its smoother counterpart, helping traders spot potential consolidation or reversal areas without dynamic adjustments. By locking the zone at the high and low of the signal bar, it avoids over-expansion in volatile conditions, offering a stable reference line colored by price position relative to the zone. This approach differs from expanding channels by prioritizing simplicity and persistence until a new qualifying signal, reducing visual clutter while highlighting directional bias through midpoint coloring.
Motivation: Why this design?
Traders often face noisy signals from moving averages that flip frequently in sideways markets or lag during breakouts, leading to premature entries or missed opportunities. This indicator addresses that by focusing on confirmed direction shifts between the base and smoothed averages, then anchoring a non-expanding zone to capture the initial price range of the shift. The result is a cleaner tool for marking equilibrium levels, assuming price respects these bounds in ranging or mildly trending conditions.
What’s different vs. standard approaches?
- Reference baseline: Traditional moving average crossovers or simple channels that update every bar.
- Architecture differences:
- Zones are set only on new divergence signals and remain fixed until reset by a gap from the prior zone.
- No ongoing high-low expansion; relies on persistent variables to hold bounds across bars.
- Midpoint plotting with conditional coloring based on close position, plus a highlight for zone initiations.
- Practical effect: Charts show persistent horizontal references instead of drifting lines, making it easier to gauge if price is rejecting or embracing the zone—useful for avoiding false breaks in low-volatility setups.
How it works (technical)
The indicator first computes a base exponential moving average of closing prices over a user-defined length, then applies a second exponential moving average to smooth that base. It checks if both the base and smoothed values are increasing or decreasing compared to their prior values, indicating aligned direction. A signal triggers when this alignment breaks, marking a potential shift.
On a new signal, if the current bar's high and low fall outside any existing zone (or none exists), the zone bounds update to those extremes and persist via dedicated variables. The midpoint of these bounds becomes the primary plot line, colored green if below the close (bullish lean), red if above (bearish lean), or gray otherwise. A secondary thick line highlights the midpoint briefly when a zone first sets, aiding visual confirmation. No higher timeframe data or external fetches are used, so updates occur on each bar close without lookahead.
Parameter Guide
EMA Length — Sets the period for the base moving average; longer values smooth more, reducing signal frequency but increasing lag. Default: 50. Trade-offs/Tips: Shorter for faster response in intraday charts (risks noise); longer for daily trends (may miss early shifts).
Smoother Length — Defines the period for the secondary smoothing on the base average; higher values dampen minor wiggles for stabler direction checks. Default: 3. Trade-offs/Tips: Keep low (2–5) for sensitivity; increase to 7+ if zones trigger too often in choppy markets, at cost of delayed signals.
Reading & Interpretation
The main circle plot at the zone midpoint serves as a dynamic equilibrium line: green suggests price is above the zone (potential strength), red indicates below (potential weakness), and gray shows containment within bounds (neutral consolidation). A sudden thick foreground line at the midpoint flags a fresh zone start, prompting review of the prior bar's context. Absence of a plot means no active zone, implying reliance on price action alone until the next signal.
Practical Workflows & Combinations
- Trend following: Enter long on green midpoint after a higher low touches the zone lower bound, confirmed by structure like higher highs; filter shorts similarly on red with lower highs.
- Exits/Stops: Use the opposite zone bound as a conservative stop (e.g., below lower for longs); trail aggressively to midpoint on strong moves, tightening near gray neutrality.
- Multi-asset/Multi-TF: Defaults work across forex and stocks on 1H–Daily; for crypto volatility, shorten EMA Length to 20–30. Pair with volume oscillators for confirmation, avoiding isolated use.
Behavior, Constraints & Performance
- Repaint/confirmation: Plots update on bar close using historical closes, so confirmed signals hold; live bars may shift until close but without future references.
- security()/HTF: Not used, eliminating related repaint risks.
- Resources: Minimal overhead—no loops, arrays, or bar limits exceeded; suitable for real-time on any timeframe.
- Known limits: Fixed zones may lag in strong trends (price drifts away without reset); signals skip if no gap from prior zone, potentially missing clustered shifts. Assumes standard OHLC data; untested on non-equity assets.
Sensible Defaults & Quick Tuning
Start with EMA Length at 50 and Smoother Length at 3 for balanced daily charts. If signals fire too frequently (e.g., in ranges), extend EMA Length to 100 for fewer but stabler zones. For sluggish response in trends, drop Smoother Length to 2 and EMA Length to 30, monitoring for added noise. In high-vol setups, widen both to 75/5 to filter extremes, trading speed for reliability.
What this indicator is—and isn’t
This is a lightweight visualization layer for EMA-driven zones, aiding manual chart reading and basic signal spotting. It is not a standalone system, predictive model, or automated alert generator—integrate with broader analysis like market structure and risk rules. (Unknown/Optional: No built-in alerts or multi-timeframe scaling.)
Disclaimer
The content provided, including all code and materials, is strictly for educational and informational purposes only. It is not intended as, and should not be interpreted as, financial advice, a recommendation to buy or sell any financial instrument, or an offer of any financial product or service. All strategies, tools, and examples discussed are provided for illustrative purposes to demonstrate coding techniques and the functionality of Pine Script within a trading context.
Any results from strategies or tools provided are hypothetical, and past performance is not indicative of future results. Trading and investing involve high risk, including the potential loss of principal, and may not be suitable for all individuals. Before making any trading decisions, please consult with a qualified financial professional to understand the risks involved.
By using this script, you acknowledge and agree that any trading decisions are made solely at your discretion and risk.
Do not use this indicator on Heikin-Ashi, Renko, Kagi, Point-and-Figure, or Range charts, as these chart types can produce unrealistic results for signal markers and alerts.
Best regards and happy trading
Chervolino

Relative StrengthDescription:
This indicator provides a simplified yet powerful method for measuring a stock's momentum based on its proximity to its recent high. It is a direct implementation of a trading concept discussed in a lecture from the New York Institute of Finance.
Core Concept
The underlying theory, supported by academic research, is that a stock making a new high is one of the most bullish signals possible. Such stocks have a statistical tendency to continue making new highs in the near term.
Instead of requiring complex relative strength calculations against a universe of stocks, this indicator uses a simple and elegant ratio to act as a proxy for momentum:
Indicator Value = Current Close / Highest High of Lookback Period
A value approaching 1.0 indicates the stock is strong and nearing a new high. A value at 1.0 means a new high has just been made.
How to Use This Indicator
The indicator consists of two primary components:
RS Line (Teal): The core momentum calculation (Close / High).
Signal MA (Orange): A moving average of the NHRS Line, which acts as the trigger for signals.
The signals are generated based on the crossover between these two lines:
BUY Signal: When the RS Line crosses ABOVE its moving average. This suggests that short-term momentum is accelerating and a new uptrend may be starting. The background will turn green.
SELL Signal: When the RS Line crosses BELOW its moving average. This indicates that momentum is fading and it may be prudent to exit the position to avoid a decline. The background will turn red.
Indicator Settings
You can customize the indicator to fit your trading style and the timeframe you are analyzing:
High Lookback Period: Choose the period for the "Highest High" calculation. Options range from 1 Month to 12 Months (52 weeks), allowing you to measure short-term or long-term strength.
Moving Average Length: Adjust the length of the signal line's moving average. The lecturer defaults to 26 weeks for a six-month view.
Moving Average Type: Select the type of moving average for the signal line (SMA, EMA, WMA, HMA).
Credits and Inspiration
Proper credit is essential. This script is a practical application of a concept that builds upon foundational academic work.
The core idea that a stock's proximity to its 52-week high is an investable anomaly was detailed in the 2004 Journal of Finance paper:
"The 52 Week High and Momentum Investing" by Thomas J. George and Chuan-Yang Hwang.
The lecturer's contribution, which this script implements, was to simplify this concept into an actionable trading tool by applying a moving average crossover to generate clear and objective buy and sell signals.
Disclaimer: This tool is for educational and informational purposes only. It is not financial advice. All trading involves risk, and you should always perform your own research and backtesting before making any trading decisions.
Smart Buy/Sell Signal IndicatorOverview
The Smart Buy/Sell Signal Indicator is a multi-factor trading tool that i ntegrates Supertrend, Bollinger Bands, RSI, ADX, and Moving Averages to generate high-probability buy and sell signals. Unlike simple crossover-based strategies, this indicator leverages multiple layers of confirmation to reduce false signals and improve trade execution accuracy.
This indicator is designed for trend-following traders, scalpers, and swing traders, helping them identify key reversal points and momentum shifts with precise breakout conditions.
How It Works
The Smart Buy/Sell Signal Indicator filters out weak trade signals by combining trend, volatility, momentum, and strength indicators in the following manner:
✅ Supertrend-Based Trend Filtering:
• The script checks if the price is above or below the Supertrend level before confirming a buy or sell signal.
• Buy signals occur below the Supertrend Down level, confirming support.
• Sell signals occur above the Supertrend Up level, confirming resistance.
✅ Bollinger Bands for Overbought & Oversold Conditions:
• Buy signals are confirmed when price touches the Bollinger Lower Band (suggesting oversold conditions).
• Sell signals are confirmed when price touches the Bollinger Upper Band (suggesting overbought conditions).
• This ensures that trades occur at high-probability reversal zones, rather than random price action.
✅ RSI Momentum Confirmation:
• Buy trades trigger when RSI is below 50 (indicating strength building from an oversold region).
• Sell trades trigger when RSI is above 50 (indicating weakness forming in an overbought region).
• This ensures signals are momentum-backed and not counter-trend moves.
✅ ADX Strength Confirmation:
• The script filters signals using the ADX (Average Directional Index) to ensure that only trades with sufficient market strength are executed.
• If the ADX value is below a threshold (default: 15), the signal is ignored to prevent false breakouts in choppy markets.
✅ Confirmation Moving Average (MA) for Trend Validation:
• The script applies an additional confirmation filter using a Moving Average (SMA/EMA).
• Buy signals trigger only when the price is above the MA, aligning with trend direction.
• Sell signals trigger only when the price is below the MA, ensuring alignment with the broader market structure.
✅ Trade Cooldown Mechanism (Minimum Bars Between Signals):
• To avoid frequent signals in sideways markets, a cooldown period is implemented.
• Default: 5 bars between signals (adjustable).
• Prevents rapid consecutive trades, reducing false entries.
Key Features
✔️ Supertrend & Moving Average Confirmation – Ensures trades are taken only in the correct trend direction.
✔️ Bollinger Bands Integration – Helps identify high-probability reversal zones.
✔️ ADX Strength Filtering – Ensures trades are only executed when the market has enough strength.
✔️ Momentum-Based RSI Filtering – Avoids counter-trend trades and confirms directional strength.
✔️ Trade Cooldown Mechanism – Reduces overtrading and noise in sideways markets.
✔️ Webhook Alerts for Automation – Auto-execute trades or receive real-time notifications.
✔️ Customizable Inputs – Adjustable thresholds, EMA/SMA length, ADX filter, cooldown period for flexibility.
✔️ Works Across Multiple Timeframes – Suitable for scalping (5m, 15m), swing trading (1H, 4H), and position trading (Daily).
How to Use
📌 Scalping & Intraday Trading:
• Use on 5m, 15m, or 30m timeframes.
• Look for Bollinger Band touch + RSI confirmation + Supertrend support/resistance validation before entering trades.
📌 Swing Trading:
• Use on 1H or 4H timeframes.
• Enter only when ADX is strong and price aligns with Supertrend direction.
📌 Webhook Automation:
• Set up TradingView Alerts to auto-execute trades via Webhook-compatible platforms.
Why This Combination?
This indicator is not just a simple moving average crossover tool.
It is designed to filter out weak breakouts and only execute trades that have:
✅ Trend confirmation (Supertrend + Moving Average)
✅ Volatility filtering (Bollinger Bands for overbought/oversold confirmation)
✅ Momentum validation (RSI threshold filtering)
✅ Market strength requirement (ADX ensures sufficient momentum)
This multi-layered approach ensures that only the highest-quality setups are executed, improving both win rate and reliability.
Why It’s Worth Using?
🚀 Reduces False Breakouts – Avoids weak breakouts by requiring ADX confirmation.
🚀 Works in All Market Conditions – Trend-following logic for trending markets, volatility-based entries for reversals.
🚀 Customizable to Any Trading Style – Adjustable parameters for trend, momentum, and strength filtering.
🚀 Seamless Webhook Automation – Execute trades automatically with TradingView alerts.
🚀 Ready to trade smarter?
✅ Add the Smart Buy/Sell Signal Indicator to your TradingView chart today! 🎯🔥

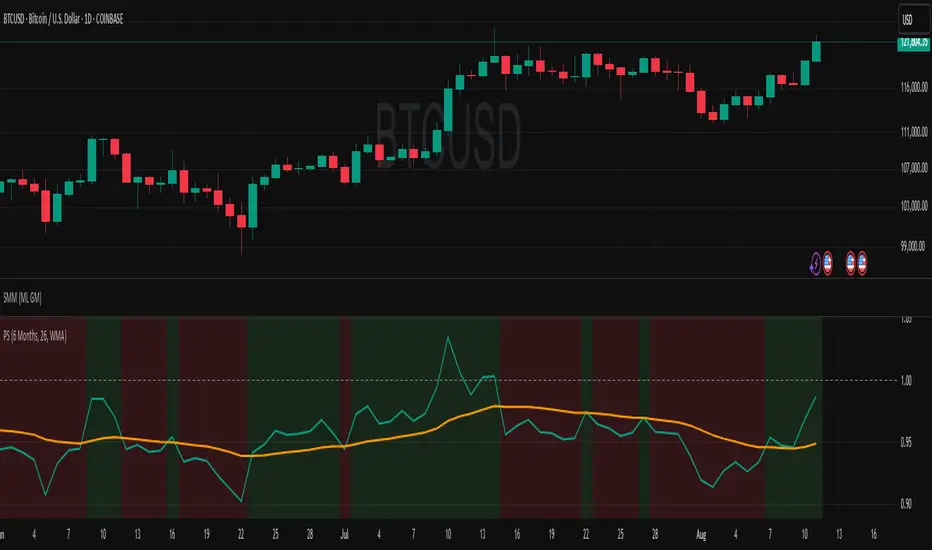
BTC Mercenary ModelBitcoin Market Cycle Evaluation Using Subjective Z-Scores
Introduction:
I've crafted a unique indicator for Bitcoin that synthesizes multiple market indicators into a single, actionable Z-score, aiming to offer insights into the current market cycle phase. Here's the methodology:
Methodology:
Alpha Validation: Each component indicator has been tested for its predictive power (alpha) against Bitcoin's market cycle peaks and troughs from at least the last two cycles. This ensures each indicator contributes meaningfully to our model.
Z-Score Synthesis: By converting each indicator's value into a Z-score, we normalize their contributions. The average of these Z-scores provides a refined signal, indicating whether Bitcoin is in an overbought or oversold state relative to historical norms.
Features:
Individual Indicator Customization: Users can tweak inputs to optimize each indicator's alpha, enhancing the model's predictive accuracy.
Historical Averages: The script provides visibility into how both technical and fundamental indicators have scored in the past, offering a benchmark for current conditions.
ROC Flexibility: Adjust the Rate of Change (ROC) period to suit your analysis timeframe, allowing for more personalized market cycle interpretation.
Indicators Integrated:
Fundamental:
MVRV (Market Value to Realized Value) - Measures market sentiment vs. actual value.
Bitcoin Thermocap - Relates Bitcoin's market cap to its transaction volume.
NUPL (Net Unrealized Profit/Loss) - Indicates holder's profit or loss status.
CVDD (Coin Days Destroyed) - Shows the movement of long-held coins.
SOPR (Spent Output Profit Ratio) - Highlights whether coins are being spent at a profit or loss.
Technical:
RSI (Relative Strength Index) - Identifies overbought/oversold conditions.
CCI (Commodity Channel Index) - Detects cyclical turns in Bitcoin's price.
Multiple Moving Averages - For trend analysis over various time frames.
Sharpe Ratio - Evaluates risk-adjusted return.
Pi Cycle Indicator - Predicts cycle tops based on moving average crossovers.
Hodrick-Prescott Filter - Separates trend from cycle in price data.
VWAP (Volume Weighted Average Price) - Provides a trading benchmark.
How It Works Together:
This model uses a weighted average of Z-scores from these indicators to give a comprehensive view of Bitcoin's market cycle. The Z-scores are not just summed but considered in context; for example, when fundamental indicators like MVRV suggest an overvaluation while technical ones like RSI indicate a near-term correction, the model's output reflects this nuanced interaction.
Future Developments:
The next step is to include sentiment analysis, potentially from social media or news sentiment, to further refine our cycle predictions.
Chart Example:
Symbol/Timeframe: BTCUSD on a daily chart.
Script Name: Bitcoin Cycle Z-Score Evaluator
Feedback Encouraged:
I'm eager to receive feedback on how this model could be further tailored or expanded for better market insights.
-CM

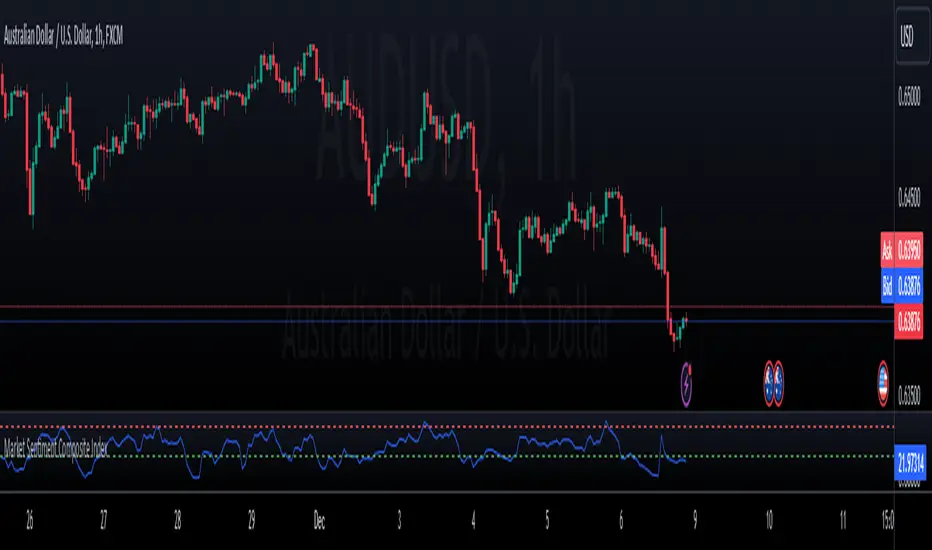
Market Sentiment Composite IndexDescription
The Market Sentiment Composite Index is an advanced indicator designed to provide traders with a comprehensive view of market sentiment by aggregating data from multiple key indicators. This tool helps traders identify potential overbought and oversold conditions, enabling more informed trading decisions.
How It Works
Indicator Components:
Relative Strength Index (RSI): Measures the magnitude of recent price changes to evaluate overbought or oversold conditions.
Average True Range (ATR): Gauges market volatility by analyzing the range of price movements.
MACD (Moving Average Convergence Divergence): Indicates momentum and potential buy/sell signals based on moving average crossovers.
Volume Score: Assesses trading volume in relation to its historical average to detect unusual activity.
Normalization: Each component is normalized to a 0-100 scale, ensuring consistency across different metrics.
Composite Calculation: The normalized values are averaged to form the Composite Sentiment Score. This score ranges from 0 to 100, providing a unified measure of market sentiment.
Visual Representation:
Sentiment Score Plot: The composite sentiment score is plotted on the chart.
Overbought/Oversold Levels: Default levels set at 70 (overbought) and 30 (oversold), customizable by the user.
Horizontal Lines: Dashed lines at the overbought and oversold levels for easy reference.
Alerts: Custom alerts notify traders when the sentiment score crosses the overbought or oversold thresholds, helping them stay informed of significant market conditions.
Usage
The Market Sentiment Composite Index is ideal for traders who seek a holistic view of market sentiment. By combining multiple indicators into a single score, it provides a robust tool to identify potential reversal points and confirm trends.
Key Benefits
Comprehensive Insight: Integrates multiple indicators for a well-rounded sentiment analysis.
Customization: Adjustable overbought and oversold levels to fit individual trading strategies.
User-Friendly: Clear visual representation and alerts to keep traders informed..
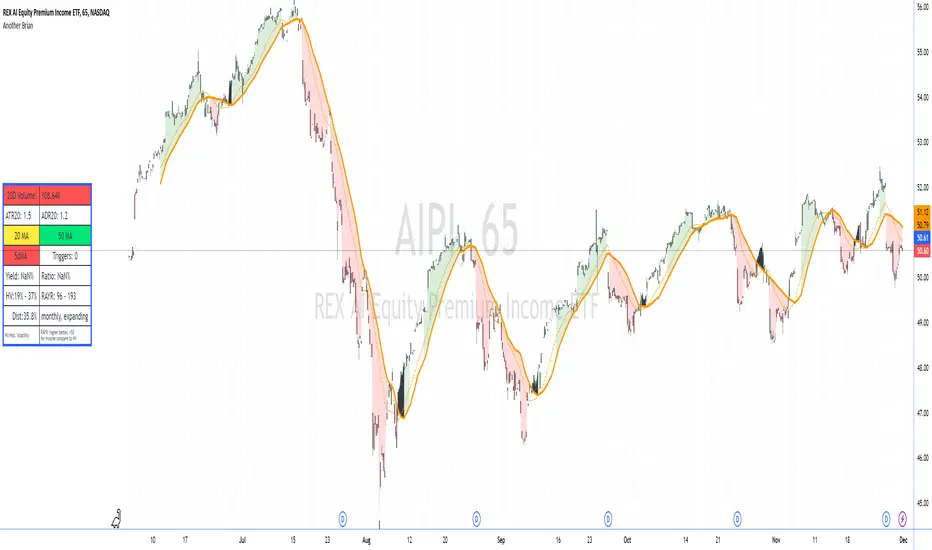
Another Brian"Another Brian" is an advanced TradingView indicator meticulously designed to offer traders a multifaceted analysis by integrating both technical and fundamental metrics. Unlike standard indicators, this script uniquely combines multi-period Moving Averages (SMA and WMA) with multi-day Volume-Weighted Average Prices (VWAPs) to accurately identify trend directions and potential support/resistance levels. It incorporates pivot points (S2 and R2) specifically calculated for intraday timeframes (1 to 14 minutes) to highlight key profit-taking areas tailored for day trading.
A standout feature of "Another Brian" is its dynamic background color coding, which changes based on the selected timeframe. This visual cue allows traders to instantly recognize the current trading context, enhancing situational awareness and decision-making efficiency.
On the fundamental side, the script evaluates dividend yield and dividend payout ratios, integrating these metrics with distribution data—crucial for ETFs where distributions may not appear as traditional dividends. By pulling and analyzing distribution information, "Another Brian" provides a more comprehensive yield assessment. This data is then compared to historical volatility (HV), enabling traders to gauge the stability and risk associated with their investments.
The indicator also features a comprehensive Risk-Adjusted Yield Ratio (RAYR), which compares the annualized distribution yield to its standard deviation. This ratio helps traders assess the efficiency of ETFs by balancing yield against volatility, highlighting investments that offer an optimal risk-return profile.
Central to the user experience is a dynamic data table that displays essential metrics such as 20-day Volume, ATR20, ADR20, moving averages status, yield ratios, and volatility measures. This table is color-coded for quick visual interpretation:
Setup : turn off the candle colors, the indicator draws price.
Red Indicators: Signal that a closer examination is needed, allowing traders to swiftly identify potential issues or opportunities.
Green and Yellow Indicators: Provide positive or neutral signals, aiding in the swift assessment of market conditions.
Additionally, "Another Brian" includes a trigger detection system that identifies potential bullish or bearish conditions based on the interaction between SMAs and WMAs across multiple timeframes. These triggers offer actionable trading signals, enhancing the tool's utility for both novice and experienced traders.
Key Features:
Moving Averages (MA):
Simple Moving Average (SMA): Calculates SMA over various periods (20-day, 50-day) to identify trend directions.
Weighted Moving Average (WMA): Computes WMA to give more significance to recent price data, aiding in trend detection.
Volume-Weighted Average Price (VWAP):
Multi-Day VWAPs: Plots VWAPs for 1-day, 2-day, and 3-day periods, helping traders identify potential support and resistance levels based on volume-weighted pricing.
Pivot Points:
Support (S2) and Resistance (R2): Calculates and plots key pivot points for intraday timeframes (1 to 14 minutes), assisting in identifying potential profit-taking zones for day trades.
Volatility Metrics:
Average True Range (ATR): Measures market volatility over a 20-day period.
Historical Volatility (HV): Assesses volatility over the past year, providing insights into price fluctuations.
Dividend and Distribution Analysis:
Dividend Yield & Payout Ratio: Displays current dividend yield and payout ratios as percentages.
Distribution Data: Integrates distribution information for ETFs, ensuring comprehensive yield analysis even when distributions don't appear as traditional dividends.
Risk-Adjusted Yield Ratio (RAYR):
RAYR Calculation: Compares the annualized distribution yield to its standard deviation, indicating the yield received for each unit of risk taken.
RAYR Indicators: Highlights ETFs with favorable RAYR values, aiding in identifying investments that offer a balanced risk-return profile.
Dynamic Data Table:
Comprehensive Metrics Display: Showcases key metrics such as 20-day Volume, ATR20, ADR20, moving averages status, yield ratios, and volatility measures.
Color-Coding: Utilizes color-coded elements to indicate the status of various metrics, enhancing visual interpretation and decision-making.
Quick View Alerts: Red indicators prompt traders to take a closer look, streamlining the analysis process.
Trigger Indicators:
Pre-Trigger Conditions: Identifies potential market triggers based on moving average crossovers and other predefined conditions.
Bullish and Bearish Conditions: Differentiates between bullish and bearish trends, providing visual cues for potential trade opportunities.
Background Color Coding:
Timeframe-Based Coloring: Changes the chart's background color based on the selected timeframe (e.g., yellow for 1-minute, blue for 5-minute), offering an immediate visual reference for the current trading context.
Usage Benefits:
Holistic Market Analysis: Combines technical indicators with fundamental metrics to provide a well-rounded view of stock performance.
Enhanced Decision-Making: Helps traders identify trends, volatility, and potential trade triggers, facilitating informed trading strategies.
Visual Clarity: Employs color-coded elements and a comprehensive data table to simplify complex data, making it easier to interpret market conditions at a glance.
Customization: Offers flexibility in selecting which VWAPs to display and allows for adjustments based on different timeframes and trading preferences.
Efficiency in Monitoring: The dynamic background and color-coded table enable quick assessments, saving traders time and enhancing responsiveness to market changes.
"Another Brian" is an invaluable tool for traders seeking to integrate multiple analytical perspectives into their trading routine. By providing deeper market insights through its unique combination of technical and fundamental metrics, along with intuitive visual cues, "Another Brian" empowers traders to make more informed and strategic decisions in the dynamic stock market environment.
Trade Rush IndicatorTrade Rush Indicator
The Trade Rush Indicator is a comprehensive tool designed for traders who seek a clear visualization of key moving averages, combined with Bollinger Bands to identify potential trading opportunities. This script provides a unique approach to trend analysis by combining multiple Exponential Moving Averages (EMA) and Simple Moving Averages (SMA) with varying lengths, along with Bollinger Bands set to both 1 and 2 standard deviations.
Key Features:
EMAs & SMAs: The indicator includes several EMAs (5, 9, 21, 50, 100, 120, 200, 400) and SMAs (21, 50, 100, 120, 200, 400), each serving a different timeframe perspective. The EMAs and SMAs are color-coded for quick reference, and some of the longer-period moving averages (50 EMA, 100 EMA, etc.) are hidden by default to reduce chart clutter but can be manually enabled.
Bollinger Bands: Bollinger Bands are set at 1 and 2 standard deviations to assist in visualizing price volatility. The space between the 1σ and 2σ bands is filled with a light cloud, making it easy to spot periods of higher volatility. This band configuration helps traders assess potential breakout or reversal zones.
Ichimoku Cloud Overlay: Although the Ichimoku cloud calculation is included, it is hidden by default and can be activated when additional trend confirmation is needed. The cloud’s opacity is set to be subtle, allowing it to enhance chart readability without overwhelming other indicators.
Usage:
The Trade Rush Indicator is ideal for swing traders and intraday traders who rely on moving average crossovers, Bollinger Band volatility signals, and trend confirmation through Ichimoku cloud analysis. By visualizing multiple moving averages and Bollinger Bands, traders can identify trend direction, support/resistance zones, and potential breakout areas.
Originality and Value:
This script is a tailored solution for traders who seek a blend of moving averages and Bollinger Bands to enhance their trend-following strategies. Unlike standard setups, the Trade Rush Indicator provides extensive customization options, allowing traders to enable/disable specific indicators based on their trading style and preferences. Its structure also provides unique insights into volatility and trend strength by layering various EMAs and SMAs, helping traders make more informed decisions.

TEMA For Loop | QuantumResearchThe TEMA for Loop indicator is a unique trend analysis tool designed to provide a more nuanced view of market movements by combining a custom EMA-based calculation with a scoring system. This indicator aims to offer traders a refined way to assess market momentum, using an approach that goes beyond typical moving average crossovers. Here’s how the indicator works and what makes it valuable:
Enhanced Smoothing with Triple EMA:
The core calculation uses three successive Exponential Moving Averages (EMA) to create a smoothed curve. This combination smooths out price data more effectively than a single EMA, reducing noise while still being responsive to market shifts.
The Triple Exponential Moving Average (TEMA) calculation, often used to minimize lag, is customized here to derive a composite EMA value. This results in a more dynamic yet stable trend line that reacts to significant price movements without being overly sensitive to minor fluctuations.
Unique Scoring System for Trend Assessment:
What sets this indicator apart is its custom scoring mechanism that evaluates the strength and direction of trends over a defined range of historical data. By comparing the current smoothed EMA value against previous values within a specified lookback period, the indicator calculates a trend score.
This scoring system helps to quantify the momentum of the trend. A positive score indicates consistent upward momentum, while a negative score suggests downward momentum. The use of this scoring method provides traders with a deeper insight into the trend's persistence over time, allowing for better decision-making.
Trend Visualization with Clear Signals:
Green represents a strong upward trend, indicating potential buying interest.
Red signals a strong downward trend, highlighting potential selling pressure.
Gray denotes a neutral market state, where neither buyers nor sellers dominate.
Why This Indicator Is Original and Useful:
Unlike many traditional TEMA indicators, the TEMA for Loop incorporates a custom blend of multi-layered EMAs with a unique scoring system that offers a more granular view of market dynamics. The combination of TEMA smoothing with a trend scoring mechanism makes this indicator particularly useful for traders who want to identify sustained trends while avoiding false signals caused by market noise.
This enhanced approach to trend detection provides a level of analysis that is not readily available in most open-source TEMA scripts, justifying its unique value. The closed-source nature of this script protects its innovative scoring logic, which has been carefully optimized for accuracy and adaptability across various market conditions.
The TEMA for Loop is ideal for traders looking for a tool that provides a balanced blend of responsiveness and smoothness, making it an excellent choice for those who aim to ride strong trends while minimizing whipsaws. Its distinctive combination of methodologies offers traders a competitive edge in markets characterized by both sharp moves and periods of consolidation.

Uptrick: RSI Histogram
1. **Introduction to the RSI and Moving Averages**
2. **Detailed Breakdown of the Uptrick: RSI Histogram**
3. **Calculation and Formula**
4. **Visual Representation**
5. **Customization and User Settings**
6. **Trading Strategies and Applications**
7. **Risk Management**
8. **Case Studies and Examples**
9. **Comparison with Other Indicators**
10. **Advanced Usage and Tips**
---
## 1. Introduction to the RSI and Moving Averages
### **1.1 Relative Strength Index (RSI)**
The Relative Strength Index (RSI) is a momentum oscillator developed by J. Welles Wilder and introduced in his 1978 book "New Concepts in Technical Trading Systems." It is widely used in technical analysis to measure the speed and change of price movements.
**Purpose of RSI:**
- **Identify Overbought/Oversold Conditions:** RSI values range from 0 to 100. Traditionally, values above 70 are considered overbought, while values below 30 are considered oversold. These thresholds help traders identify potential reversal points in the market.
- **Trend Strength Measurement:** RSI also indicates the strength of a trend. High RSI values suggest strong bullish momentum, while low values indicate bearish momentum.
**Calculation of RSI:**
1. **Calculate the Average Gain and Loss:** Over a specified period (e.g., 14 days), calculate the average gain and loss.
2. **Compute the Relative Strength (RS):** RS is the ratio of average gain to average loss.
3. **RSI Formula:** RSI = 100 - (100 / (1 + RS))
### **1.2 Moving Averages (MA)**
Moving Averages are used to smooth out price data and identify trends by filtering out short-term fluctuations. Two common types are:
**Simple Moving Average (SMA):** The average of prices over a specified number of periods.
**Exponential Moving Average (EMA):** A type of moving average that gives more weight to recent prices, making it more responsive to recent price changes.
**Smoothed Moving Average (SMA):** Used to reduce the impact of volatility and provide a clearer view of the underlying trend. The RMA, or Running Moving Average, used in the USH script is similar to an EMA but based on the average of RSI values.
## 2. Detailed Breakdown of the Uptrick: RSI Histogram
### **2.1 Indicator Overview**
The Uptrick: RSI Histogram (USH) is a technical analysis tool that combines the RSI with a moving average to create a histogram that reflects momentum and trend strength.
**Key Components:**
- **RSI Calculation:** Determines the relative strength of price movements.
- **Moving Average Application:** Smooths the RSI values to provide a clearer trend indication.
- **Histogram Plotting:** Visualizes the deviation of the smoothed RSI from a neutral level.
### **2.2 Indicator Purpose**
The primary purpose of the USH is to provide a clear visual representation of the market's momentum and trend strength. It helps traders identify:
- **Bullish and Bearish Trends:** By showing how far the smoothed RSI is from the neutral 50 level.
- **Potential Reversal Points:** By highlighting changes in momentum.
### **2.3 Indicator Design**
**RSI Moving Average (RSI MA):** The RSI MA is a smoothed version of the RSI, calculated using a running moving average. This smooths out short-term fluctuations and provides a clearer indication of the underlying trend.
**Histogram Calculation:**
- **Neutral Level:** The histogram is plotted relative to the neutral level of 50. This level represents a balanced market where neither bulls nor bears have dominance.
- **Histogram Values:** The histogram bars show the difference between the RSI MA and the neutral level. Positive values indicate bullish momentum, while negative values indicate bearish momentum.
## 3. Calculation and Formula
### **3.1 RSI Calculation**
The RSI calculation involves:
1. **Average Gain and Loss:** Calculated over the specified length (e.g., 14 periods).
2. **Relative Strength (RS):** RS = Average Gain / Average Loss.
3. **RSI Formula:** RSI = 100 - (100 / (1 + RS)).
### **3.2 Moving Average Calculation**
For the USH indicator, the RSI is smoothed using a running moving average (RMA). The RMA formula is similar to that of the EMA but is based on averaging RSI values over the specified length.
### **3.3 Histogram Calculation**
The histogram value is calculated as:
- **Histogram Value = RSI MA - 50**
**Plotting the Histogram:**
- **Positive Histogram Values:** Indicate that the RSI MA is above the neutral level, suggesting bullish momentum.
- **Negative Histogram Values:** Indicate that the RSI MA is below the neutral level, suggesting bearish momentum.
## 4. Visual Representation
### **4.1 Histogram Bars**
The histogram is plotted as bars on the chart:
- **Bullish Bars:** Colored green when the RSI MA is above 50.
- **Bearish Bars:** Colored red when the RSI MA is below 50.
### **4.2 Customization Options**
Traders can customize:
- **RSI Length:** Adjust the length of the RSI calculation to match their trading style.
- **Bull and Bear Colors:** Choose colors for histogram bars to enhance visual clarity.
### **4.3 Interpretation**
**Bullish Signal:** A histogram bar that moves from red to green indicates a potential shift to a bullish trend.
**Bearish Signal:** A histogram bar that moves from green to red indicates a potential shift to a bearish trend.
## 5. Customization and User Settings
### **5.1 Adjusting RSI Length**
The length parameter determines the number of periods over which the RSI is calculated and smoothed. Shorter lengths make the RSI more sensitive to price changes, while longer lengths provide a smoother view of trends.
### **5.2 Color Settings**
Traders can adjust:
- **Bull Color:** Color of histogram bars indicating bullish momentum.
- **Bear Color:** Color of histogram bars indicating bearish momentum.
**Customization Benefits:**
- **Visual Clarity:** Traders can choose colors that stand out against their chart’s background.
- **Personal Preference:** Adjust settings to match individual trading styles and preferences.
## 6. Trading Strategies and Applications
### **6.1 Trend Following**
**Identifying Entry Points:**
- **Bullish Entry:** When the histogram changes from red to green, it signals a potential entry point for long positions.
- **Bearish Entry:** When the histogram changes from green to red, it signals a potential entry point for short positions.
**Trend Confirmation:** The histogram helps confirm the strength of a trend. Strong, consistent green bars indicate robust bullish momentum, while strong, consistent red bars indicate robust bearish momentum.
### **6.2 Swing Trading**
**Momentum Analysis:**
- **Entry Signals:** Look for significant shifts in the histogram to time entries. A shift from bearish to bullish (red to green) indicates potential for upward movement.
- **Exit Signals:** A shift from bullish to bearish (green to red) suggests a potential weakening of the trend, signaling an exit or reversal point.
### **6.3 Range Trading**
**Market Conditions:**
- **Consolidation:** The histogram close to zero suggests a range-bound market. Traders can use this information to identify support and resistance levels.
- **Breakout Potential:** A significant move away from the neutral level may indicate a potential breakout from the range.
### **6.4 Risk Management**
**Stop-Loss Placement:**
- **Bullish Positions:** Place stop-loss orders below recent support levels when the histogram is green.
- **Bearish Positions:** Place stop-loss orders above recent resistance levels when the histogram is red.
**Position Sizing:** Adjust position sizes based on the strength of the histogram signals. Strong trends (indicated by larger histogram bars) may warrant larger positions, while weaker signals suggest smaller positions.
## 7. Risk Management
### **7.1 Importance of Risk Management**
Effective risk management is crucial for long-term trading success. It involves protecting capital, managing losses, and optimizing trade setups.
### **7.2 Using USH for Risk Management**
**Stop-Loss and Take-Profit Levels:**
- **Stop-Loss Orders:** Use the histogram to set stop-loss levels based on trend strength. For instance, place stops below support levels in bullish trends and above resistance levels in bearish trends.
- **Take-Profit Targets:** Adjust take-profit levels based on histogram changes. For example, lock in profits as the histogram starts to shift from green to red.
**Position Sizing:**
- **Trend Strength:** Scale position sizes based on the strength of histogram signals. Larger histogram bars indicate stronger trends, which may justify larger positions.
- **Volatility:** Consider market volatility and adjust position sizes to mitigate risk.
## 8. Case Studies and Examples
### **8.1 Example 1: Bullish Trend**
**Scenario:** A trader notices a transition from red to green histogram bars.
**Analysis:**
- **Entry Point:** The transition indicates a potential bullish trend. The trader decides to enter a long position.
- **Stop-Loss:** Set stop-loss below recent support levels.
- **Take-Profit:** Consider taking profits as the histogram moves back towards zero or turns red.
**Outcome:** The bullish trend continues, and the histogram remains green, providing a profitable trade setup.
### **8.2 Example 2: Bearish Trend**
**Scenario:** A trader observes a transition from green to red histogram bars.
**Analysis:**
- **Entry Point:** The transition suggests a potential
bearish trend. The trader decides to enter a short position.
- **Stop-Loss:** Set stop-loss above recent resistance levels.
- **Take-Profit:** Consider taking profits as the histogram approaches zero or shifts to green.
**Outcome:** The bearish trend continues, and the histogram remains red, resulting in a successful trade.
## 9. Comparison with Other Indicators
### **9.1 RSI vs. USH**
**RSI:** Measures momentum and identifies overbought/oversold conditions.
**USH:** Builds on RSI by incorporating a moving average and histogram to provide a clearer view of trend strength and momentum.
### **9.2 RSI vs. MACD**
**MACD (Moving Average Convergence Divergence):** A trend-following momentum indicator that uses moving averages to identify changes in trend direction.
**Comparison:**
- **USH:** Provides a smoothed RSI perspective and visual histogram for trend strength.
- **MACD:** Offers signals based on the convergence and divergence of moving averages.
### **9.3 RSI vs. Stochastic Oscillator**
**Stochastic Oscillator:** Measures the level of the closing price relative to the high-low range over a specified period.
**Comparison:**
- **USH:** Focuses on smoothed RSI values and histogram representation.
- **Stochastic Oscillator:** Provides overbought/oversold signals and potential reversals based on price levels.
## 10. Advanced Usage and Tips
### **10.1 Combining Indicators**
**Multi-Indicator Strategies:** Combine the USH with other technical indicators (e.g., Moving Averages, Bollinger Bands) for a comprehensive trading strategy.
**Confirmation Signals:** Use the USH to confirm signals from other indicators. For instance, a bullish histogram combined with a moving average crossover may provide a stronger buy signal.
### **10.2 Customization Tips**
**Adjust RSI Length:** Experiment with different RSI lengths to match various market conditions and trading styles.
**Color Preferences:** Choose histogram colors that enhance visibility and align with personal preferences.
### **10.3 Continuous Learning**
**Backtesting:** Regularly backtest the USH with historical data to refine strategies and improve accuracy.
**Education:** Stay updated with trading education and adapt strategies based on market changes and personal experiences.

US M2### Relevance and Functionality of the "US M2" Indicator
#### Relevance
The "US M2" indicator is relevant for several reasons:
1. **Macro-Economic Insight**: The M2 money supply is a critical indicator of the amount of liquidity in the economy. Changes in M2 can significantly impact financial markets, including equities, commodities, and cryptocurrencies.
2. **Trend Identification**: By analyzing the M2 money supply with moving averages, the indicator helps identify long-term and short-term trends, providing insights into economic conditions and potential market movements.
3. **Trading Signals**: The indicator generates bullish and bearish signals based on moving average crossovers and the difference between current M2 values and their moving averages. These signals can be useful for making informed trading decisions.
#### How It Works
1. **Data Input**:
- **US M2 Money Supply**: The indicator fetches the US M2 money supply data using the "USM2" symbol with a monthly resolution.
2. **Moving Averages**:
- **50-Period SMA**: Calculates the Simple Moving Average (SMA) over 50 periods (months) to capture short-term trends.
- **200-Period SMA**: Calculates the SMA over 200 periods to identify long-term trends.
3. **Difference Calculation**:
- **USM2 Difference**: Computes the difference between the current M2 value and its 50-period SMA to highlight deviations from the short-term trend.
4. **Amplification**:
- **Amplified Difference**: Multiplies the difference by 100 to make the deviations more visible on the chart.
5. **Bullish and Bearish Conditions**:
- **Bullish Condition**: When the current M2 value is above the 50-period SMA, indicating a positive short-term trend.
- **Bearish Condition**: When the current M2 value is below the 50-period SMA, indicating a negative short-term trend.
6. **Short-Term SMA of Amplified Difference**:
- **14-Period SMA**: Applies a 14-period SMA to the amplified difference to smooth out short-term fluctuations and provide a clearer trend signal.
7. **Plots and Visualizations**:
- **USM2 Plot**: Plots the US M2 data for reference.
- **200-Period SMA Plot**: Plots the long-term SMA to show the broader trend.
- **Amplified Difference Histogram**: Plots the amplified difference as a histogram with green bars for bullish conditions and red bars for bearish conditions.
- **SMA of Amplified Difference**: Plots the 14-period SMA of the amplified difference to track the trend of deviations.
8. **Moving Average Cross Signals**:
- **Bullish Cross**: Plots an upward triangle when the 50-period SMA crosses above the 200-period SMA, signaling a potential long-term uptrend.
- **Bearish Cross**: Plots a downward triangle when the 50-period SMA crosses below the 200-period SMA, signaling a potential long-term downtrend.
### Summary
The "US M2" indicator provides a comprehensive view of the US M2 money supply, highlighting significant trends and deviations. By combining short-term and long-term moving averages with amplified difference analysis, it offers valuable insights and trading signals based on macroeconomic liquidity conditions.

Smart Money Analysis with Golden/Death Cross [YourTradingSensei]Description of the script "Smart Money Analysis with Golden/Death Cross":
This TradingView script is designed for market analysis based on the concept of "Smart Money" and includes the detection of Golden Cross and Death Cross signals.
Key features of the script:
Moving Averages (SMA):
Two moving averages are calculated: a short-term (50 periods) and a long-term (200 periods).
The intersections of these moving averages are used to determine Golden Cross and Death Cross signals.
High Volume:
The current trading volume is analyzed.
Periods of high volume are identified when the current volume exceeds the average volume by a specified multiplier.
Support and Resistance Levels:
Key support and resistance levels are determined based on the highest and lowest prices over a specified period.
Buy and Sell Signals:
Buy and sell signals are generated based on moving average crossovers, high volume, and the closing price relative to key levels.
Golden Cross and Death Cross:
A Golden Cross occurs when the short-term moving average crosses above the long-term moving average.
A Death Cross occurs when the short-term moving average crosses below the long-term moving average.
These signals are displayed on the chart with text color changes for better visualization.
Using the script:
The script helps traders visualize key signals and levels, aiding in making informed trading decisions based on the behavior of major market players and technical analysis.
Custom candle lighting(CCL) © 2024 by YourTradingSensei is licensed under CC BY-NC-SA 4.0. To view a copy of this license.

Coiled Moving AveragesThis indicator detects when 3 moving averages converge and become coiled. This indicates volatility contraction which often leads to volatility expansion, i.e. large price movements.
Moving averages are considered coiled when the percent difference from each moving average to the others is less than the Coil Tolerance % input value.
This indicator is unique in that it detects when moving averages converge within a specified percent range. This is in contrast to other indicators that only detect moving average crossovers, or the distance between price and a moving average.
This indicator includes options such as:
- % difference between the MAs to be considered coiled
- type and length of MAs
- background color to indicate when the MAs are coiled
- arrows to indicate if price is above or below the MAs when they become coiled
While coiling predicts an increased probability for volatility expansion, it does not necessarily predict the direction of expansion. However, the arrows which indicate whether price is above or below the moving average coil may increase the odds of a move in that direction. Bullish alignment of the moving averages (faster MAs above the slower MAs) may also increase the odds of a bullish break, while bearish alignment may increase the odds of a bearish break.
Note that mean reversion back to the MA coil is common after initial volatility expansion. This can present an entry opportunity for traders, as mean reversion may be followed by continuation in the direction of the initial break.
Experiment with different settings and timeframes to see how coiled MAs can help predict the onset of volatility.

Moving Average CandlesInspired by Ricardo Santos's " Multiple Moving Average Candle System V0" ()
This script plots 6 moving averages using the plotcandle function rather than the normal plot function. Result is a stylish indicator that shows moving average crossovers in a more visual way. Moving average type options available are , or Simple, Exponential, Hull, Relative, Volume Weighted, and Arnaud Legoux Moving Averages, Linear Regression Curve, and Median. Lengths for each can be set in settings along with selection specific parameters. Good for plotting/visualizing potential entry/exit points based on your preferred moving averages crossing over, or just as some eye candy.
