Liquidity Absorption OscillatorDescription:
The Liquidity Absorption Oscillator (LAO) is a sophisticated momentum indicator that measures how efficiently price moves relative to trading range while confirming momentum with volume-based liquidity flows. By combining price efficiency analysis with volume velocity, the LAO provides earlier and more reliable signals than traditional price-only oscillators, helping traders identify high-probability trend initiations and reversals.
🔍 Core Technology & Innovation:
Tri-Component Signal Processing:
Price Efficiency Ratio (PER): Measures how "cleanly" price moves by comparing net displacement to total trading range over the lookback period. High PER indicates trending markets with directional conviction.
Volume Velocity Ratio (VVR): Combines price momentum with volume confirmation, normalized by ATR to ensure consistent behavior across different instruments and volatility regimes.
Adaptive Smoothing: Dynamically adjusts responsiveness based on market conditions - becoming more stable during noisy periods and more responsive in clean trends.
Multi-Layer Signal Detection:
Confirmed Crossovers: Traditional zero-line crosses filtered by efficiency thresholds
Early Momentum Signals: Detects momentum shifts BEFORE zero-line crosses for optimal entry timing
Smart Divergence Detection: Identifies hidden bullish/bearish divergences with built-in quality filters
🎯 Trading Signals & Interpretation:
🟢 BULLISH SIGNALS:
Strong Buy: LAO crosses above zero line with medium/high efficiency (PER)
Early Buy: Momentum accelerates while LAO is still negative (anticipates reversal)
Divergence Buy: Price makes lower low while LAO forms higher low
🔴 BEARISH SIGNALS:
Strong Sell: LAO crosses below zero line with medium/high efficiency
Early Sell: Momentum decelerates while LAO is still positive (anticipates top)
Divergence Sell: Price makes higher high while LAO forms lower high
⚪ SIGNAL QUALITY FILTERING:
Automatic signal suppression during low-efficiency (choppy) market conditions
Configurable PER threshold ensures only high-quality signals are considered
📊 Visual Features:
Clean Oscillator Display: Smooth line plot with gradient fills above/below zero line
Multiple Coloring Options: Choose between no coloring, trend-based, or slope-based bar coloring
Professional Styling: Inspired by institutional-grade indicator design with subtle visual cues
Non-Repainting Logic: All signals confirmed on bar close for reliable backtesting
⚙️ Input Parameters:
Core Settings:
Lookback Period: Base period for efficiency and velocity calculations (default: 24)
Base Smooth Period: Starting point for adaptive smoothing (default: 8)
Min Efficiency for Signals: PER threshold for signal validation (default: 35)
Divergence Lookback: Bars to search for divergence patterns (default: 5)
UI Options:
Bar Coloring: Choose visual style (None, Trend, Slope)
🔔 Alert Conditions:
Buy/Sell Signal: Traditional zero-line crosses with quality filtering
Early Buy/Early Sell: Momentum-based signals before traditional crosses
All alerts use confirmed, non-repainting logic
Pesquisar nos scripts por "momentum"

Force DashboardScalping Dashboard - Complete User Guide
Overview
This scalping system consists of two complementary TradingView indicators designed for intraday trading with no overnight holds:
Force Dashboard - Single-row table showing real-time market bias and entry signals
Large Order Detection - Visual diamonds showing institutional order flow
Together, they provide a complete at-a-glance view of market conditions optimized for quick entries and exits.
Recommended Timeframes
Primary Scalping Timeframes
1-minute chart: Ultra-fast scalps (30 seconds - 3 minutes hold time)
2-minute chart: Quick scalps (2-5 minutes hold time)
5-minute chart: Standard scalps (5-15 minutes hold time)
Best Practices
Use 1-2 minute for highly liquid instruments (ES, NQ, major forex pairs)
Use 5-minute for less liquid markets or if you prefer fewer signals
Never hold past the last hour of trading to avoid overnight risk
Set hard stop times (e.g., exit all positions by 3:45 PM EST)
Dashboard Components Explained
Core Indicators (Circles ●)
MACD (5/13/5)
Green ● = Bullish momentum (MACD histogram positive)
Red ● = Bearish momentum (MACD histogram negative)
Gray ● = No clear momentum
Use: Confirms trend direction and momentum shifts
EMA (9/20/50)
Green ● = Price > EMA9 > EMA20 (uptrend)
Red ● = Price < EMA9 < EMA20 (downtrend)
Gray ● = Choppy/sideways
Use: Identifies the immediate micro-trend
Stoch (5-period Stochastic)
Green ● = Oversold (<20) - potential reversal up
Red ● = Overbought (>80) - potential reversal down
Gray ● = Neutral zone (20-80)
Use: Spots reversal opportunities at extremes
RSI (7-period)
Green ● = Oversold (<30)
Red ● = Overbought (>70)
Gray ● = Neutral
Use: Confirms overbought/oversold conditions
CVD (Cumulative Volume Delta)
Green ● = CVD above its moving average (buying pressure)
Red ● = CVD below its moving average (selling pressure)
Gray ● = Neutral
Use: Shows overall buying vs selling pressure
ΔCVD (Delta CVD - Rate of Change)
Green ● = CVD accelerating upward (buying acceleration)
Red ● = CVD accelerating downward (selling acceleration)
Gray ● = No acceleration
Use: Detects momentum shifts in order flow
Imbal (Order Flow Imbalance)
Green ● = Buy pressure >2x sell pressure
Red ● = Sell pressure >2x buy pressure
Gray ● = Balanced
Use: Identifies extreme one-sided order flow
Vol (Volume Strength)
Green ● = Volume >1.5x average (strong interest)
Red ● = Volume <0.7x average (low interest)
Gray ● = Normal volume
Yellow background = Volume surge (>2x average) - BIG MOVE ALERT
Use: Confirms conviction behind price moves
Tape (Tape Speed)
Green ● = Fast order flow (>1.3x normal)
Red ● = Slow order flow (<0.7x normal)
Gray ● = Normal speed
Yellow background = Very fast tape (>1.5x) - RAPID EXECUTION ALERT
Use: Measures urgency and speed of orders
Key Levels
Support (Supp)
Shows the nearest high-volume support level below current price
Bright Green background = Price is AT support (within 0.3%) - BOUNCE ZONE
Green background = Price above support (healthy)
Red background = Price below support (broken support, now resistance)
Resistance (Res)
Shows the nearest high-volume resistance level above current price
Bright Orange background = Price is AT resistance (within 0.3%) - REJECTION ZONE
Red background = Price below resistance (facing overhead supply)
Green background = Price above resistance (breakout)
These levels update automatically every 3 bars based on volume profile
Entry Signal Components
Score
Displays format: "6L" (6 long indicators) or "4S" (4 short indicators)
Bright Green = 6-7 indicators aligned for long
Light Green = 5 indicators aligned for long
Yellow = 4 indicators aligned (weaker setup)
Gray = No alignment
Red/Orange colors = Same scale for short setups
Score of 5+ indicates high-probability setup
SCALP (Main Entry Signal)
BRIGHT GREEN "LONG" = High-quality long scalp (Score 5+)
Green "LONG" = Decent long scalp (Score 4)
BRIGHT ORANGE "SHORT" = High-quality short scalp (Score 5+)
Red "SHORT" = Decent short scalp (Score 4)
Gray "WAIT" = No clear setup - STAY OUT
Entry Strategies
Strategy 1: High-Probability Scalps (Conservative)
When to Enter:
SCALP column shows BRIGHT GREEN "LONG" or BRIGHT ORANGE "SHORT"
Score is 5 or higher
Vol or Tape has yellow background (volume surge)
Example Long Setup:
SCALP = BRIGHT GREEN "LONG"
Score = 6L
Vol = Yellow background
Price AT Support (bright green Supp cell)
EMA, MACD, CVD, ΔCVD, Imbal all green
Entry: Enter immediately on next candle
Target: 0.5-1% move or resistance level
Stop: Below support or -0.3%
Hold Time: 2-10 minutes
Strategy 2: Momentum Scalps (Aggressive)
When to Enter:
Tape has yellow background (fast tape)
Vol has yellow background (volume surge)
ΔCVD is green (for longs) or red (for shorts)
Imbal shows strong imbalance in your direction
Score is 4+
Example Short Setup:
Tape & Vol = Yellow backgrounds
ΔCVD = Red, Imbal = Red
Price AT Resistance (bright orange)
Score = 5S
Entry: Enter immediately
Target: Quick 0.3-0.7% move
Stop: Tight -0.2%
Hold Time: 1-5 minutes
Strategy 3: Reversal Scalps (Mean Reversion)
When to Enter:
Stoch shows oversold (green) or overbought (red)
RSI confirms the extreme
Price is AT Support (for longs) or AT Resistance (for shorts)
ΔCVD and Imbal start reversing direction
Score is 4+
Example Long Setup:
Stoch = Green (oversold)
RSI = Green (oversold)
Supp = Bright green (at support)
ΔCVD turns green
Imbal turns green
Score = 4L or 5L
Entry: Wait for confirmation candle
Target: Move back to EMA9 or mid-range
Stop: Below the low
Hold Time: 3-8 minutes
Large Order Detection Usage
Diamond Signals
Green diamonds below bar = Large buy orders (institutional buying)
Red diamonds above bar = Large sell orders (institutional selling)
Size matters: Larger diamonds = larger order flow
How to Use with Dashboard
Confirmation Entries
Dashboard shows "LONG" signal
Green diamond appears
Enter immediately - institutions are buying
Divergence Alerts (CAUTION)
Dashboard shows "LONG" signal
RED diamond appears (institutions selling)
DO NOT ENTER - conflicting order flow
Cluster Patterns
Multiple green diamonds in row = Strong accumulation, stay long
Multiple red diamonds in row = Strong distribution, stay short
Alternating colors = Chop, avoid trading
Risk Management Rules
Position Sizing
Risk 0.5-1% of account per scalp
Maximum 3 concurrent positions
Reduce size after 2 consecutive losses
Stop Loss Guidelines
Tight stops: 0.2-0.3% for 1-2 min charts
Standard stops: 0.3-0.5% for 5 min charts
Always use stop loss - no exceptions
Place stops below support (longs) or above resistance (shorts)
Take Profit Targets
Target 1: 0.3-0.5% (take 50% off)
Target 2: 0.7-1% (take remaining 50%)
Move stop to breakeven after Target 1 hit
Trail stop if Score remains high
Time-Based Exits
Exit immediately if:
SCALP changes from LONG/SHORT to WAIT
Score drops below 3
Large diamond appears in opposite direction
Maximum hold time: 15 minutes (even if profitable)
Hard exit time: 30 minutes before market close
Trading Sessions
Best Times to Scalp
High-Liquidity Sessions
9:30-11:00 AM EST (Market open, highest volume)
2:00-3:30 PM EST (Afternoon session, good moves)
Avoid
11:30 AM-1:30 PM EST (Lunch, low volume)
Last 30 minutes (unpredictable, don't initiate new trades)
News releases (wait 5 minutes for volatility to settle)
Common Patterns & Setups
The Perfect Storm (Highest Probability)
Score = 6L or 7L
SCALP = BRIGHT GREEN
Vol + Tape = Yellow backgrounds
Green diamond appears
Price AT Support
Win rate: ~70-80%
The Fade Setup (Counter-Trend)
Price hits resistance (bright orange)
Stoch + RSI overbought (red)
Red diamond appears
CVD starts turning red
SCALP shows "SHORT"
Win rate: ~60-70%
The Breakout Continuation
Price breaks resistance (Res turns green)
EMA, MACD green
Vol surge (yellow)
Multiple green diamonds
SCALP = "LONG"
Win rate: ~65-75%
Warning Signs - DO NOT TRADE
Red Flags
❌ SCALP shows "WAIT"
❌ Score below 3
❌ Vol and Tape both gray (no volume)
❌ Conflicting signals (dashboard says LONG but red diamonds appearing)
❌ Alternating green/red circles (choppy market)
❌ Support and Resistance very close together (tight range)
Market Conditions to Avoid
Low volume periods
Major news releases (first 5 minutes after)
First 2 minutes after market open
Wide spreads
Consecutive losing trades (take a break after 2 losses)
Quick Reference Checklist
Before Taking ANY Trade:
☑ SCALP shows LONG or SHORT (not WAIT)
☑ Score is 4 or higher
☑ Vol or Tape shows activity
☑ No conflicting diamond signals
☑ Stop loss level identified
☑ Target profit level identified
☑ Not in restricted time periods
After Entering:
☑ Set stop loss immediately
☑ Set profit targets
☑ Watch SCALP column - exit if changes to WAIT
☑ Watch for opposite-colored diamonds
☑ Move stop to breakeven after first target
☑ Exit all by market close
Advanced Tips
Scalping Psychology
Be patient: Wait for Score 5+ setups
Be decisive: When signal appears, act immediately
Be disciplined: Follow your stop loss always
Be flexible: Exit quickly if dashboard reverses
Optimization
Backtest on your specific instrument
Adjust RSI/Stoch levels for your market
Fine-tune volume thresholds
Keep a trade journal to track which setups work best
Multi-Timeframe Confirmation
Use 5-min dashboard as "trend filter"
Take 1-min trades only in direction of 5-min SCALP signal
Increases win rate by ~10-15%
Troubleshooting
Q: Dashboard shows WAIT most of the time
Normal - scalping is about patience. Quality > Quantity
3-8 good setups per day is excellent
Q: Too many false signals
Increase minimum Score requirement to 5 or 6
Only trade with volume surge (yellow backgrounds)
Add large order detection confirmation
Q: Signals too slow
You may be on too high a timeframe
Try 1-minute chart for faster signals
Ensure real-time data feed is active
Q: Support/Resistance not updating
Normal - updates every 3 bars
If completely stuck, remove and re-add indicator
Summary
This scalping system works best when:
✅ Multiple indicators align (Score 5+)
✅ Volume and tape speed confirm the move
✅ Order flow (diamonds) confirms direction
✅ Price is at key levels (support/resistance)
✅ You manage risk strictly
✅ You exit before market close
The golden rule: When SCALP says WAIT, you WAIT. Discipline beats frequency.

Composite Buy/Sell Score [-100 to +100] by LMComposite Buy/Sell Score (Stabilized + Sensitivity) by LM
Description:
This indicator calculates a composite trend strength score ranging from -100 to +100 by combining multiple popular technical indicators into a single, smoothed metric. It is designed to give traders a clear view of bullish and bearish trends, while filtering out short-term noise.
The score incorporates signals from:
PPO (Percentage Price Oscillator) – measures momentum via the difference between fast and slow EMAs.
ADX (Average Directional Index) – detects trend strength.
RSI (Relative Strength Index) – identifies short-term momentum swings.
Stochastic RSI – measures RSI momentum and speed of change.
MACD (Moving Average Convergence Divergence) – detects momentum shifts using EMA crossovers.
Williams %R – highlights overbought/oversold conditions.
Each component is weighted, smoothed, and optionally confirmed across a configurable number of bars, producing a stabilized composite score that reacts more reliably to significant trend changes.
Key Features:
Smoothed Composite Score
The final score is smoothed using an EMA to reduce volatility and emphasize meaningful trends.
A Sensitivity Multiplier allows traders to exaggerate the score for stronger trend signals or dampen it for quieter markets.
Customizable Inputs
You can adjust each indicator’s parameters, smoothing lengths, and confirm bars to suit your preferred timeframe and trading style.
The sensitivity multiplier allows fine-tuning the responsiveness of the trend line without changing underlying indicator calculations.
Visual Representation
Score Line: Green for positive (bullish) trends, red for negative (bearish) trends, gray near neutral.
Reference Lines:
0 = neutral
+100 = maximum bullish
-100 = maximum bearish
Adaptive Background: Optionally highlights the background intensity proportional to trend strength. Strong green for bullish trends, strong red for bearish trends.
Multi-Indicator Integration
Combines momentum, trend, and overbought/oversold signals into a single metric.
Helps identify clear entry/exit trends while avoiding whipsaw noise common in individual indicators.
Recommended Use:
Trend Identification: Look for sustained movement above 0 for bullish trends and below 0 for bearish trends.
Exaggerated Trends: Use the Sensitivity Multiplier to emphasize strong trends.
Filtering Noise: The smoothed score and confirmBars settings help reduce false signals from minor price fluctuations.
Inputs Overview:
Input Purpose
PPO Fast EMA / Slow EMA / Signal Controls PPO momentum sensitivity
ADX Length / Threshold Detects trend strength
RSI Length / Overbought / Oversold Measures short-term momentum
Stoch RSI Length / %K / %D Measures speed of RSI changes
MACD Fast / Slow / Signal Measures momentum crossover
Williams %R Length Detects overbought/oversold conditions
Final Score Smoothing Length EMA smoothing for final composite score
Confirm Bars for Each Signal Number of bars used to confirm individual indicator signals
Sensitivity Multiplier Scales the final composite score for exaggerated trend response
Highlight Background by Trend Strength Enables adaptive background coloring
This indicator is suitable for traders looking for a single, clear trend metric derived from multiple indicators. It can be applied to any timeframe and can help identify both strong and emerging trends in the market.

Momentum ContinuationMomentum Continuation - By racy_1
The Momentum Continuation indicator helps traders identify high-probability continuation points in established trends — where momentum is likely to resume after a controlled pullback or brief pause.
Concept
At its core, the indicator tracks the relationship between two EMAs (fast and slow) to define the local trend direction, then checks whether multiple higher-timeframe trends support that trend.
When alignment occurs across all selected timeframes, and price confirms a continuation move, the script highlights the corresponding bar — signalling potential momentum re-entry opportunities.
Key Features
Dual EMA Band: Visual representation of short- and medium-term trend structure, with optional shading for clarity.
Multi-Timeframe Alignment: Up to 3 configurable higher timeframes ensure trend agreement before signalling continuation.
Continuation Triggers: Highlights candles where momentum resumes after a pullback or reclaim, confirming that trend structure remains intact.
Optional Distance Filter: Adds a configurable minimum distance (by % or ATR multiples) from the fast EMA to improve signal quality.
Pierce-and-Reclaim Logic: Optionally allows signals where price briefly violated the EMA band but reclaimed direction without breaking alignment.
No-Repaint Option: Choose between *Closed-Bar HTF Mode* (safer, slightly delayed) and *Live HTF Mode* (faster, may flicker).
Built-in Alerts: Receive notifications for both continuation triggers and trend-state changes (e.g., Trending Up / Trending Down).
How to Use
Select your fast and slow EMA lengths (default 8 / 24).
Configure HTF1–3 to define which higher timeframes must align (or leave any blank to ignore).
Enable “Continuation Logic” to activate triggers, bar highlights, and alerts.
Optionally enable Pierce-and-Reclaim or apply a distance filter for stricter setups.
Look for highlighted bars (and alerts) confirming momentum continuation in the prevailing trend direction.
Tips
Works on any asset and timeframe, but performs best on clean, trending instruments.
Combine with market structure or liquidity analysis to time entries more precisely.
The HTF Closed-Bar option is recommended for backtesting and signal reliability.
Disclaimer
This script is for educational and informational purposes only.
It does not constitute financial advice. Always manage risk appropriately before making any trading decision.

MomentumMap — Relative Strength Visual Quadrant (RRG-Inspired)🔍 What is MomentumMap?
MomentumMap brings the concept of Relative Rotation Graphs (RRG) directly to your chart.
It helps you instantly see whether a symbol is leading, improving, weakening, or lagging — without scanning dozens of charts.
Unlike traditional RS indicators, this tool plots RS Ratio and RS Momentum together, classifying the current condition into clear quadrants.
🧩 Quadrant Logic
Zone Conditions Market Behavior
🟢 Power Zone RS > 1, Momentum > 0 Strong, leading, expanding trend
🟡 Drift Zone RS > 1, Momentum < 0 Cooling off after leadership
🔵 Lift Zone RS < 1, Momentum > 0 Early signs of strength emerging
🔴 Dead Zone RS < 1, Momentum < 0 Weak and lagging phase
Each bar’s background color reflects the active zone — giving instant visual feedback on rotation strength.
⚙️ Key Features
Benchmark-based RS Ratio & RS Momentum mapping
Auto-classified quadrant display with live background coloring
Optional Power Zone alert (with volume confirmation)
Adjustable RS smoothing and momentum periods
Works on all instruments and timeframes
💡 How to Use
Apply the indicator to any chart.
Choose your benchmark symbol (default: NSE:CNX500).
Observe the color-coded zones to assess strength rotation.
Use transitions between zones to identify:
New leadership → 🟢 Power Zone
Early rotation → 🔵 Lift Zone
Loss of strength → 🟡 Drift Zone
Weak performers → 🔴 Dead Zone
⚠️ Notes & Disclaimer
MomentumMap is an analytical visualization tool, not a buy/sell signal generator.
Choose benchmarks and timeframes that match your trading universe.
The script does not repaint and uses only confirmed bar data.
Past quadrant behavior does not guarantee future results.
Complies with TradingView’s open-source and originality guidelines.
📚 Credits
Concept inspired by Julius de Kempenaer’s RRG framework
Implementation and logic developed independently by Paritosh Gupta

Momentum Volume Analyzer [CHE] Momentum Volume Analyzer — Adaptive momentum with volume-gated signals and expressive visual cues
Summary
This indicator combines a normalized momentum oscillator with a volume Z-score gate and adaptive gradient visuals. The oscillator centers around a midline and scales between a lower and an upper bound. Intensity is derived from the distance to the midline and is normalized inside a rolling window, which helps keep contrast consistent across regimes. Volume pressure is compressed to a discrete level between one and ten and is used to qualify momentum flips and extremes. Layered “burst” markers and optional background gradients provide immediate visual emphasis without adding new data sources. Pine version is v6. The script runs in a separate pane.
Motivation: Why this design?
Common oscillators flip rapidly during noisy conditions or flatten during calm periods, which obscures actionable shifts. A rolling normalization keeps the visual intensity stable across different regimes, and a volume gate reduces reactions when participation is weak. The goal is clearer momentum shifts that are supported by measurable activity rather than cosmetic smoothing alone.
What’s different vs. standard approaches?
Baseline reference: Classical RSI-style oscillators or simple filtered momentum without volume gating.
Architecture differences:
Local window normalization with gamma control for contrast.
Volume converted to a Z-score and compressed into a discrete level between one and ten with a configurable cap.
Directional color gradients that intensify with distance from the midline.
Layered glow markers with optional trail and an internal label budget to avoid UI overload.
Practical effect: Signals are visually stronger only when both momentum and volume align; background and line colors convey regime strength at a glance.
How it works (technical)
Momentum core: A high-pass path with automatic gain control produces a bounded oscillator centered around a midline. A simple moving average smooths the result over a short window.
Normalization and contrast: The absolute distance from the midline is scaled inside a rolling window and limited between zero and one. Two gamma parameters separately shape contrast for the line and for labels.
Coloring: When the oscillator is above the midline, a green gradient is used; below the midline, a red gradient is used. Intensity increases with normalized distance. Optional area fill to the midline and a background gradient reinforce strength.
Volume levels: Volume is standardized over a lookback window, clipped by a user cap, and mapped to a level between one and ten. Only positive excursions are considered; non-positive values map to zero.
Event markers: When the oscillator reaches extreme zones and the volume level is positive, the script spawns layered circular labels at fixed y-positions. A small trail can extend behind the event. An internal queue discards the oldest labels when a user-defined maximum is exceeded.
Alerts: Alerts fire on overbought and oversold spikes, midline shifts with minimum intensity and volume, and continuation patterns inside strong zones.
Parameter Guide
TFRSI length (default six): Core momentum lookback. Shorter values react faster but are less stable.
Signal SMA (default two): Light smoothing of the oscillator. Larger values reduce jitter.
Gradient window (default one hundred): Normalization window for intensity. Longer values produce steadier contrast but slower adaptation.
Line/marker transparency (default zero): Visual prominence of drawings. Higher values reduce dominance.
Background on and BG transparency (defaults true and eighty-five): Enables and tunes the pane background gradient.
Area fill to fifty and Fill transparency (defaults true and eighty): Fills between the oscillator and the midline.
Gamma bars/labels and Gamma plot (defaults zero point seven and zero point eight): Contrast shapers for markers and line. Higher values compress low intensities.
Bottom marker and Show last N (defaults true and three hundred thirty-three): Optional compact heat markers with a display cap.
Up/Down colors: Dark and neon pairs for positive and negative regimes.
Lookback (default two hundred) and Z cap (default five): Volume standardization window and clipping level before scaling to one through ten.
Enable bursts, Layers, Trail, Trail transparency, Max live labels, Size scale: Control the layered glow effect, trail length, opacity, label budget, and size multiplier. Reducing the size scale lowers visual dominance.
Spike min level, Shift min level, Min intensity, Rise/Fall length: Gates for alerts; adjust to balance sensitivity and false positives.
Reading & Interpretation
Line color and intensity: Green shades above the midline indicate bullish pressure; red shades below indicate bearish pressure. Stronger color corresponds to stronger normalized distance.
Background and fill: Reinforce regime strength; consider reducing transparency when the pane feels too busy.
Bursts and trails: Emphasize volume-backed extremes. Larger bursts reflect stronger volume levels or scaling choices.
Volume level: Internal level between one and ten. Levels near the upper bound signal exceptional activity.
Practical Workflows & Combinations
Trend following: Use midline cross upward with minimum shift level and intensity as a trigger. Confirm with structure such as higher highs and higher lows. For shorts, reverse the conditions.
Exits and risk: Fade exposure when intensity weakens toward the midline or when volume level drops below the shift threshold. Consider disabling bursts when monitoring many symbols.
Multi-asset and multi-timeframe: Defaults are designed to travel across liquid futures, large-cap equities, and major crypto pairs. For higher timeframes, increase the lookback window and consider reducing the Z cap.
Behavior, Constraints & Performance
Repaint and confirmation: Signals are evaluated on the live bar. They can appear and withdraw before bar close. For confirmed signals, require closed-bar alerts or manual confirmation.
Higher-timeframe sources: Not used. No `security` calls.
Resources: `max_bars_back` is two thousand. The script uses arrays and label objects, including loops for trails. The label budget mitigates clutter.
Known limits: Very illiquid symbols with unstable volume can reduce the usefulness of the Z-score. Sharp regime changes can still produce brief flips.
Sensible Defaults & Quick Tuning
Starting point: TFRSI length six, Signal two, Gradient window one hundred, Z cap five, Spike level six, Shift level four, Min intensity zero point four, Rise length three, Size scale zero point five.
Too many flips: Increase Signal, increase Gradient window, or raise Shift level.
Too sluggish: Decrease TFRSI length or reduce Gradient window.
Bursts too dominant: Lower Size scale or reduce Layers; increase Trail transparency or set Trail length to zero.
What this indicator is—and isn’t
This is a visualization and signal layer that couples momentum with a volume gate and adaptive visuals. It is not a complete trading system, optimizer, or predictor. Use it together with market structure, risk controls, and position management.
Disclaimer
The content provided, including all code and materials, is strictly for educational and informational purposes only. It is not intended as, and should not be interpreted as, financial advice, a recommendation to buy or sell any financial instrument, or an offer of any financial product or service. All strategies, tools, and examples discussed are provided for illustrative purposes to demonstrate coding techniques and the functionality of Pine Script within a trading context.
Any results from strategies or tools provided are hypothetical, and past performance is not indicative of future results. Trading and investing involve high risk, including the potential loss of principal, and may not be suitable for all individuals. Before making any trading decisions, please consult with a qualified financial professional to understand the risks involved.
By using this script, you acknowledge and agree that any trading decisions are made solely at your discretion and risk.
Best regards and happy trading
Chervolino

Momentum Concepts [A1TradeHub]ℹ️ General Information — TSI + Stochastic Z-Score (Momentum Duo)
Purpose: A two-oscillator stack that blends trend strength (TSI) with extreme-move normalization (Stochastic Z-Score) to time entries with confirmation instead of guessing tops/bottoms.
Components
Stochastic Z-Score (SZ): Converts price stretch into a bounded curve.
Red zone ≈ overbought supply, Green zone ≈ oversold demand.
The hook out of a band often marks turning points.
True Strength Index (TSI): Measures momentum quality and direction.
Signal/line cross = timing, Zero-line = trend filter, slope = acceleration.
Core Read
Alignment = edge: SZ leaves a band and TSI agrees (cross/slope).
Divergences: Higher-low on SZ/TSI vs lower-low in price (bullish). Lower-high on SZ/TSI vs higher-high in price (bearish). Best when near bands.
Mid-range = chop: Avoid trades when SZ is centered and TSI is flat.
Best Practices
Use structure (PDH/PDL, EMAs 13/48/200, trendlines) as context.
Scale profits into opposing SZ band or on TSI flatten/cross-back.
Place stops beyond the last swing or key EMA; skip high-volatility news.
Timeframes
Works on intraday (e.g., 5–15m) and swings (1h/4h). Use higher TF for bias, lower TF for entries.
This combo is designed to keep you on the right side of momentum, act at band hooks with TSI confirmation, and stand down when conditions are indecisive.
I. 🔴🟢 TSI Oscillator — Quick Guide
What you’re seeing
Lines: Fast TSI + slow Signal (both EMA-smoothed momentum).
Zones: 🟢 Green = oversold, 🔴 Red = overbought, 0-line = trend regime.
Long: 🟢 hook up → fast crosses above slow → ideally reclaim 0.
Short: 🔴 roll down → fast crosses below slow → ideally lose 0.
Exits: Trim into the opposite zone or on a cross back.
Divergence: TSI ↑ vs price ↓ = bullish; TSI ↓ vs price ↑ = bearish.
Avoid: Both lines chopping around 0.
II. Stochastic Z-Score — Quick Guide
Zones: 🔴 Red = overbought/supply, 🟢 Green = oversold/demand.
Curve: Watch the hook out of a zone for the turn.
Signals
🟢 Green Arrow (from Green zone): Momentum turns up → call/long bias. Enter on first pullback; stop under last swing/13-EMA.
🔻 Red/Bearish Arrow (from Red zone): Momentum rolls down → put/short bias. Enter on first lower-high; stop above last swing/13-EMA.
⚪ Ball = Momentum Shift: Early heads-up (slope change). Use as confirmation/add-on, not a standalone entry.

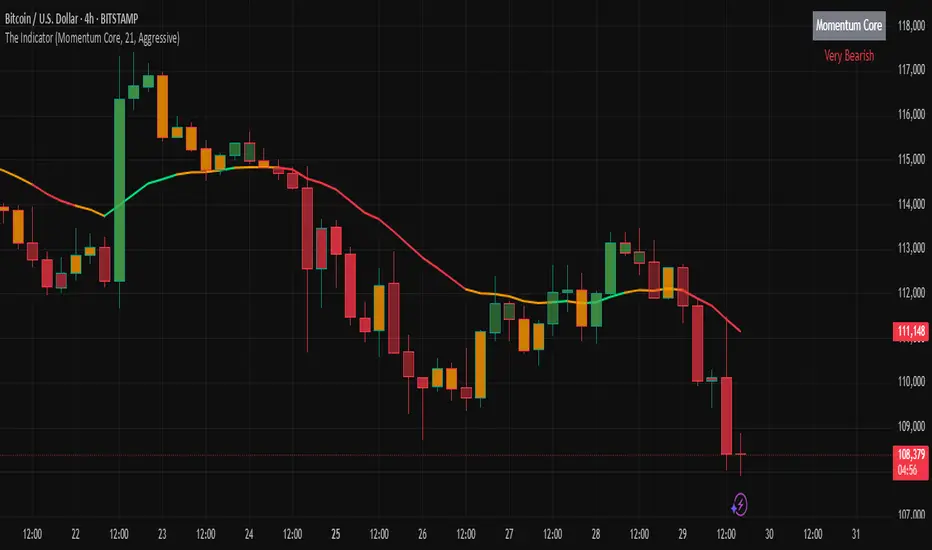
The IndicatorThe Indicator is a real-time, near zero-lag momentum tool. It shows when the market is Balanced, Bullish or Bearish. The signals are not buy or sell prints but are instead visuals for underlying strength.
The Indicator is powered by two engines that work in tandem. The first is the Bias Engine. It continuously evaluates 25+ factors to show whether the market is Bullish (green), Bearish (red), or Balanced (orange). This bias is displayed directly on the EMA line and is always active — it’s the foundation of the system.
The second is the Heatmap Engine. It reacts to shifts in buying and selling pressure, painting bars green, red, or orange to show who has control in real time. Users can adjust the sensitivity to see fast reactions (Aggressive), a steady middle ground (Balanced), or only stronger moves (Strict).
The Momentum Core, which is on by default, combines both engines into one. By blending the Bias Engine with the Heatmap, it delivers a faster, clearer output that highlights conviction as soon as it appears. This helps you see not just direction, but the moment momentum truly takes over.
“The engines use a series of colors to display market bias. GREEN = Bullish bias, RED = Bearish bias, ORANGE = Balanced bias. It is important to expect more noise in a Balanced zone. The Indicator does the heavy lifting by processing 25+ factors in real time, so you don’t have to guess what side has control. Instead of juggling multiple indicators or signals, you get a single, unified read of momentum as it’s happening.”
WA-%Chg with BackgroundDescription
The WA-%Chg with Background indicator measures the percentage change in a selected price source over a user-defined period. It allows traders to visually and quickly assess bullish and bearish momentum through dynamic color coding and background shading.
Percentage Change Calculation – Uses ta.roc to determine the rate of change over the chosen length.
Customizable Alerts – Set upper (HiAlert) and lower (LoAlert) thresholds to get notified when momentum crosses bullish or bearish trigger levels.
Dynamic Line Coloring – Blue when above the bullish threshold, red when below the bearish threshold, and gray when in neutral territory.
Background Highlighting – Light blue shading for bullish zones, light red shading for bearish zones.
User Customization – Modify calculation length, colors, and alert thresholds to suit your trading style.
This tool is useful for identifying breakout conditions, momentum shifts, and potential reversals at a glance. Traders can combine it with other indicators for confirmation.
Disclaimer
This indicator is provided for educational purposes only and should not be considered financial advice. Past performance of any indicator or strategy is not indicative of future results. Trading in financial markets involves significant risk, including the risk of losing capital. Always perform your own analysis and consult with a qualified financial advisor before making any investment decisions. The author assumes no liability for any losses incurred from the use of this tool.

Momentum Candlestick TerakhirThis indicator highlights momentum candlesticks based on breakout behavior from previous highs/lows and draws real-time boxes and labels when momentum shifts occur.
It also includes an optional CMP (Current Market Position) table that categorizes price position into Bawah(low), Tengah(mid), Atas(high), or Luar Zone(Outside), with multitimeframe (MTF) logic to assess different timeframes in one view.
Additional features:
• Momentum Box & Label Drawing
• S/R Labeling using Pivot Points
• MTF Momentum & CMP Table Display
• Alerts for Buy/Sell Momentum Candles
Built for traders who rely on visual momentum tracking and want to quickly assess price position in any timeframe.
This script is intended for educational and analytical use only.
for entry, if weekly's current momentum is momentum buy, timeframe h4 also must be momentum buy.
weekly - H4
Daily - H1
H4 - M30
H1 - M15
weekly - 300/500 pips
daily - 100/150 pips
H4 - 70/80 pips
H1 - 20/30 pips

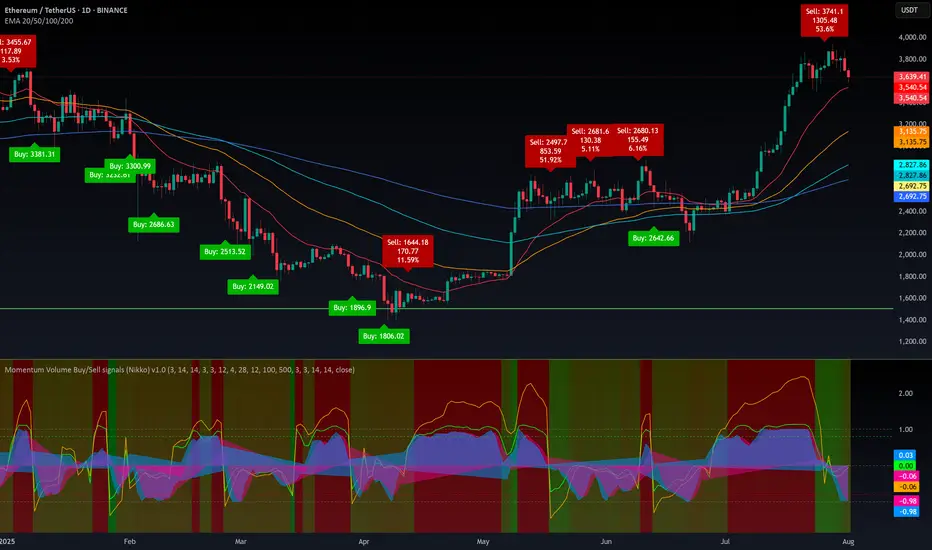
Momentum Buy/Sell signals (Nikko) v1.0📊 Momentum Volume Box Range Buy/Sell Signals (Nikko) v1.0
This indicator is a multi-factor momentum-based tool that helps identify potential Buy and Sell signals:
🔍 What it does
It combines several well-known indicators into a hybrid signal system and displays heatmaps, momentum lines, and Buy/Sell labels.
📈 How to use it
Buy Signals are shown when the hybrid K line crosses above D line in strong downward zones (oversold).
Sell Signals appear when K crosses below D, but only if a minimum profit % is reached since the last Buy.
The background heatmap color changes based on combined RSI and Vortex intensity:
Greenish = Bullish strength
Reddish = Bearish weakness
🟢 Buy/Sell Labels
Buy Labels: Triggered when strong downward momentum reverses (or price drops deeply).
Sell Labels: Only shown if price has moved up by the user-defined % profit since the last Buy.
🔧 Customization Options
You can toggle on/off:
Heatmap
Hybrid signal lines
Buy/Sell labels
Stochastic RSI area plot
Volume range and profile
EMA overlays (20, 50, 100, 200)
All major color elements are adjustable for visual clarity.
💡 Best Practices
Use on any timeframe, but it works best with higher timeframes (1H+).
Look for convergence between strong heatmap color and hybrid signal crossover.
Combine with price action or EMA trend context for better accuracy.
Note: This indicator is designed as a trading companion, not a standalone strategy. It combines multiple timeframes and parameters that would be difficult to monitor manually. Its purpose is to visually simplify complex signals, helping reduce the risk of poor entries.
However, it's essential to also consider macroeconomic factors, news events, and overall market sentiment, as they can significantly impact price action. Always use proper risk management and do your own research (DYOR).
Momentum Oscillator ModifiedThis indicator is a custom momentum oscillator enhanced with True Range-adjusted price logic and dynamic Bollinger Bands, offering a refined way to track price strength, momentum shifts, and overbought/oversold extremes with reduced noise.
Key Features:
Dynamic Price Oscillator:
Measures momentum using both price change and a volatility-adjusted price for greater accuracy.
Smoothing factor lets you fine-tune the balance between responsiveness and noise filtering.
True Range-Based Volatility Adjustment:
Integrates true range calculations to adapt to current volatility, making signals more robust during different market conditions.
Adaptive Bollinger Bands:
Two sets of custom Bollinger Bands (standard and expanded) are drawn around the oscillator, adapting over time.
These bands help identify when momentum is exceptionally strong or weak relative to recent history.
Special fills dynamically highlight when the oscillator breaks above/below the bands, signaling potential trend extremes.
Customization:
Easily adjust lookback length and smoothing factor to fit your personal trading style (e.g., scalping or swing trading).
How to Use:
Watch for the oscillator crossing above the green Bollinger Bands or below the red bands for potential overbought/oversold or breakout scenarios.
Expanded bands provide a "super extreme" zone which may hint at exhaustion or trend climax.
The dynamic mean (black line) gives a visual reference for the normalized momentum level.

MACD-RSI Divergence OscillatorMACD-RSI Divergence Oscillator: Dual Confirmation with Momentum + Divergence Signals
This powerful oscillator combines MACD and RSI into a single normalized visual tool, enriched with automatic divergence detection and smart signal alerts. It’s designed to give traders advanced insights into momentum shifts and trend reversals.
Key Features:
• MACD + RSI Combo: Both indicators are scaled and merged into one oscillator for clearer interpretation.
• Automatic Divergence Detection:
• Bullish & Bearish divergences on both MACD and RSI
• Highlights strong divergences when both confirm
• Trading Signals:
• Detects MACD crossovers and RSI reversals
• Smart buy/sell signals based on momentum + divergence
• Custom Oscillator View:
• Plots MACD and RSI on the same scale
• Visual zero-line, overbought/oversold levels, and customizable colors
• Optional Dashboard Table:
• Displays live indicator values, signal states, and divergence status
Ideal For:
• Spotting early trend reversals
• Confirming trade entries/exits
• Avoiding false signals using dual indicator logic
Highly customizable and suitable for all timeframes and asset types.

Momentum Trajectory Suite📈 Momentum Trajectory Suite
🟢 Overview
Momentum Trajectory Suite is a multi-faceted indicator designed to help traders evaluate trend direction, volatility conditions, and behavioral sentiment in a single consolidated view.
By combining a customizable Trajectory EMA, adaptive Bollinger Bands, and a Greed vs. Fear heatmap, this tool empowers traders to identify directional bias, measure momentum strength, and spot potential reversals or continuation setups.
🧠 Concept
This indicator merges three classic techniques:
Trend Analysis: Trajectory EMA highlights the prevailing directional momentum by smoothing price action over a customizable period.
Volatility Envelopes: Bollinger Bands adapt to dynamic price swings, showing overbought/oversold extremes and periods of contraction or expansion.
Behavioral Sentiment: A Greed vs. Fear heatmap combines RSI and MACD Histogram readings to visualize when markets are dominated by buying enthusiasm or selling pressure.
The combination is designed to help traders interpret market context more effectively than using any single component alone.
🛠️ How to Use the Indicator
Trajectory EMA:
Use the blue EMA line to assess overall trend direction.
Price closing above the EMA may indicate bullish momentum; closing below may indicate bearish bias.
Buy/Sell Signals:
Green circles appear when price crosses above the EMA (potential long entry).
Red circles appear when price crosses below the EMA (potential exit or short entry).
Bollinger Bands:
Monitor upper/lower bands for overbought and oversold price extremes.
Narrowing bands may signal upcoming volatility expansion.
Greed vs. Fear Heatmap:
Green histogram bars indicate bullish sentiment when RSI exceeds 60 and MACD Histogram is positive.
Red histogram bars indicate bearish sentiment when RSI is below 40 and MACD Histogram is negative.
Gray bars indicate neutral or mixed conditions.
Background Color Zones:
The chart background shifts to green when EMA slope is positive and red when negative, providing quick directional cues.
All inputs are adjustable in settings, including EMA length, Bollinger Band parameters, and oscillator configurations.
📊 Interpretation
Bullish Conditions:
Price above the Trajectory EMA, background green, and Greed heatmap active.
May signal trend continuation and increased buying pressure.
Bearish Conditions:
Price below the Trajectory EMA, background red, and Fear heatmap active.
May signal momentum breakdown or potential continuation to the downside.
Volatility Clues:
Wide Bollinger Bands = trending, volatile market.
Narrow Bollinger Bands = low volatility and possible breakout setup.
Signal Confirmation:
Consider combining signals (e.g., EMA crossover + Greed/Fear heatmap + Bollinger Band touch) for higher-confidence entries.
📝 Notes
The script does not repaint or use future data.
Suitable for multiple timeframes (intraday to daily).
May be combined with other confirmation tools or price action analysis.
⚠️ Disclaimer
This script is for educational and informational purposes only and does not constitute financial advice. Trading carries risk and past performance is not indicative of future results. Always perform your own due diligence before making trading decisions.

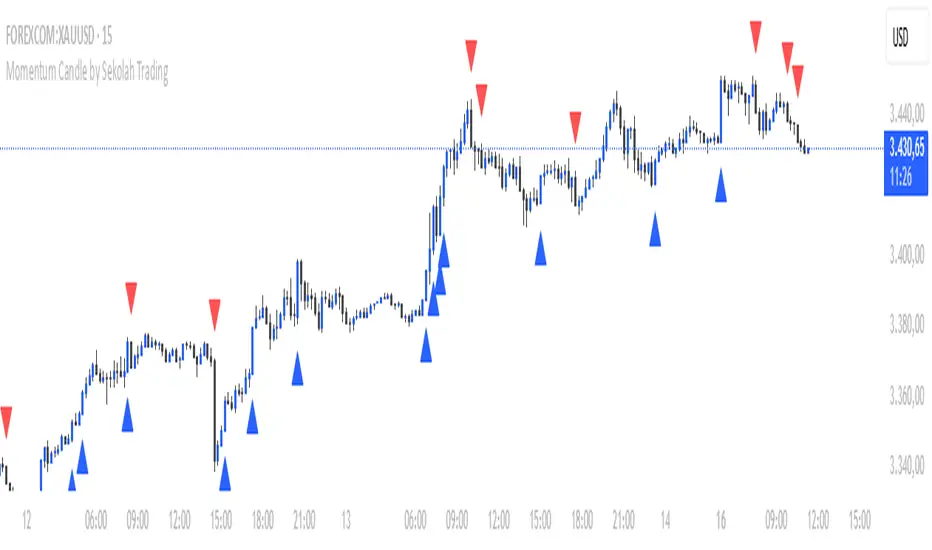
Momentum Candle by Sekolah Trading## 🔷 Introduction
**Momentum Candle by Sekolah Trading** is a proprietary price action tool that identifies high-conviction candles with large bodies and minimal wicks, based on dynamically adjusted thresholds tailored to each pair and timeframe. This script helps traders recognize moments of price acceleration that often precede breakouts, trend continuation, or sharp reversals.
---
## 🔷 What Makes This Script Unique (Originality & Utility)
Unlike traditional candle filters that rely on static size comparisons, this indicator uses:
- **Instrument-specific pip sensitivity**: Automatically detects if the pair is XAUUSD, JPY-based, or other Forex instruments.
- **Timeframe-based calibration**: Adjusts body size thresholds dynamically for 5m, 15m, 30m, and 1h.
- **Wick ratio control**: Validates only candles with short wicks (<30%), filtering indecisive moves.
- **Non-repainting logic**: Signals appear after candle close, with no future data lookahead.
This logic has been tested and refined internally by **Sekolah Trading**, designed for scalpers and intraday traders who rely on clean price action structure.
---
## 🔷 How It Works
1. **Pair & Timeframe Detection**
Adjusts `minRange` dynamically based on:
- Gold (XAUUSD), JPY pairs, or other Forex
- Timeframe: 5m to 1h
2. **Candle Structure Analysis**
- Calculates body = `abs(open - close)`
- Wick = `upper + lower shadows`
- Valid only if wick is under 30% of total candle
3. **Conditions for Signal**
- Body ≥ minRange
- Wick ≤ 30%
- Clear bullish or bearish direction
4. **Plots**
- 🔺 Blue triangle = Bullish momentum candle
- 🔻 Red triangle = Bearish momentum candle
---
## 🔷 How to Use
1. **Add to any 5m–1h chart**, ideally on XAUUSD or major Forex pairs
2. **Wait for signal triangle** to appear at the close of a candle
3. Use with:
- Trend indicators (MA, Supertrend, etc.)
- Support/resistance zones
- Breakout levels
4. **Set alerts** using:
`Momentum Candle (Body)`
---
## 🔷 Why This Script is Closed-Source
This indicator includes proprietary logic created by **Sekolah Trading** for professional and community use:
- Original dynamic pip sensitivity calibration
- Custom multi-condition filtering
- Non-reused, non-public logic with adaptive precision
The source is protected to prevent unauthorized duplication. However, all relevant logic and intent have been clearly explained above as required by TradingView’s House Rules.
---
## 🔷 Disclaimer
This indicator does not provide financial advice or guaranteed signals. Always combine with your own analysis and risk management. Historical performance does not guarantee future results.
---
## 🔷 Suggested Tags
`momentum`, `price action`, `breakout`, `forex`, `xauusd`, `jpy`, `scalping`, `candle`, `non-repainting`, `trend confirmation`
Fibo Normalized RSI & RSI RibbonPlots both standard and Z-score normalized RSI ribbons using Fibonacci-based periods. Supports adjustable normalization, optional 0–100 scaling, and multi-line visualizations for momentum and deviation analysis.
This tool is designed for traders who want to go beyond standard RSI by adding:
Statistical normalization (Z-score)
Multi-period analysis (Fibonacci structure)
Advanced divergence and exhaustion detection
It gives you both classical momentum context and mathematically rigorous deviation insight, making it ideal for:
Swing traders
Quant-inclined discretionary traders
Multi-timeframe analysts
Trend Confirmation
When both RSI and normalized RSI across short and long periods are stacked in the same direction (e.g., above 50 or with high Z-scores), the trend is likely strong.
Disagreement between the two ribbons (e.g., RSI high but normalized RSI flat) may indicate late-stage trend or false strength.
Mean Reversion Trades
Look for normalized RSI values > +2 or < -2 (i.e., ~2 standard deviations).
Cross-check with standard RSI to see if the move aligns with a traditional overbought/oversold level.
Great for fade/reversal setups when Z-score RSI is extreme but classic RSI is just beginning to turn.
Divergence Detection
Compare the slope of RSI vs. normalized RSI over same period:
If RSI is rising but normalized RSI is falling → momentum is fading despite apparent strength.
Excellent for early warnings before reversals.
Multi-Timeframe Confluence
Use short-period ribbons (e.g., 3–13) for tactical entries/exits.
Use long-period ribbons (e.g., 55–233) for macro trend bias.
Alignment across both = high-confidence zone.

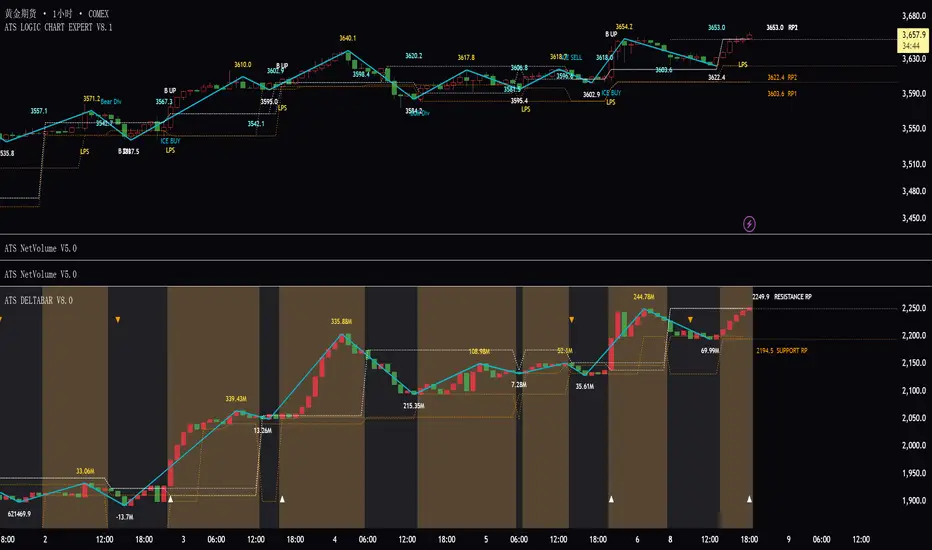
ATS DELTABAR V5.0ATS DeltaBar Indicator: Volume Trend Momentum Analysis System
——Precisely Capturing "Price-Volume Resonance" Signals for Trend Reversals
Core Positioning
The ATS DeltaBar is a sub-chart indicator focused on the synergy between volume trends and price action. It dynamically monitors changes in volume momentum and price deviations to identify trend strengthening, exhaustion, and reversal signals. Its core value lies in:
Red/Green Bars: Visually reflect volume increases/decreases, revealing capital flow direction.
Divergence Signals: Warn of potential trend reversals (top/bottom divergence).
Resonance Breakouts/Breakdowns: Confirm high-probability trend continuation signals.
Red/Green Zones: Clearly define bullish/bearish phases (red = bearish, green = bullish).
I. Core Logic & Algorithm
1. Volume Trend Visualization
Bar Color Volume State Market Implication
Green Bar Volume ↑ vs. prior period Capital inflow, trend momentum strengthens
Red Bar Volume ↓ vs. prior period Capital outflow, trend momentum weakens
Bar Height Magnitude of volume change Quantifies intensity (higher = stronger shift)
📌 Key Insight:
Green bars + rising price = Healthy uptrend.
Red bars + price新高 = Potential top divergence risk.
2. Divergence Detection
Top Divergence: Price makes higher highs, but DeltaBar peaks lower (red bars accumulate) → Bullish exhaustion.
Bottom Divergence: Price makes lower lows, but DeltaBar troughs rise (green bars accumulate) → Bearish exhaustion.
3. Resonance Signal System
Resonance Breakout: Price breaks resistance + DeltaBar green volume spike → Confirmed uptrend acceleration.
Resonance Breakdown: Price breaks support + DeltaBar red volume spike → Confirmed downtrend weakness.
4. Bullish/Bearish Zone划分
Green Zone: DeltaBar consistently above neutral line → Bullish dominance (favor longs).
Red Zone: DeltaBar consistently below neutral line → Bearish dominance (caution for downside).
II. Signal Types & Practical Applications
1. Basic Trading Signals
Signal Type DeltaBar Behavior Trading Suggestion
Green Zone + Green Bar Price & volume rise together Hold/add to longs
Red Zone + Red Bar Price & volume decline together Short/exit longs
Top Divergence Price ↑ + DeltaBar peaks ↓ (red bars) Reduce longs/test shorts
Bottom Divergence Price ↓ + DeltaBar troughs ↑ (green bars) Prepare for reversal/cover shorts
2. Advanced Resonance Strategies
Breakout Trade: Enter when price breaks a key level + DeltaBar shows green volume spike (resonance breakout) → High-probability long.
Breakdown Trade: Enter when price breaks support + DeltaBar shows red volume spike (resonance breakdown) → High-probability short.
III. Comparison with Traditional Indicators
Aspect Traditional Volume (e.g., OBV) ATS DeltaBar
Signal Dimension Single cumulative volume direction 3D analysis: divergence + resonance + zone划分
Visualization Monotonic curve Dynamic dual-color bars + zones + threshold lines
Practicality Lags price action Real-time捕捉 divergence/resonance points
IV. Usage Scenarios & Tips
1. Trend Following
In Green Zone: Price above MA + DeltaBar green bars expanding → Hold longs.
In Red Zone: Price below MA + DeltaBar red bars expanding → Stay short/avoid longs.
2. Reversal Trading
Top Divergence + Bearish candlestick (e.g., Evening Star) + red bars → Short.
Bottom Divergence + Bullish engulfing + green bars → Long.
3. Breakout Filtering
Only trade breakouts where price and DeltaBar confirm共振 (avoids false breakouts).
V. Case Study (BTC/USDT 1H Chart)
Successful Long: Price broke resistance + DeltaBar green volume spike → 15% rally.
Successful Short: Price consolidated with red bar accumulation (top divergence) → 8% drop.
VI.注意事项
Combine with price structure (support/resistance) for higher accuracy.
Prioritize divergence in ranging markets; focus on共振 signals in trending markets.
"Volume is the fuel of price" — ATS DeltaBar quantifies this relationship to pinpoint trend ignition and reversal points.
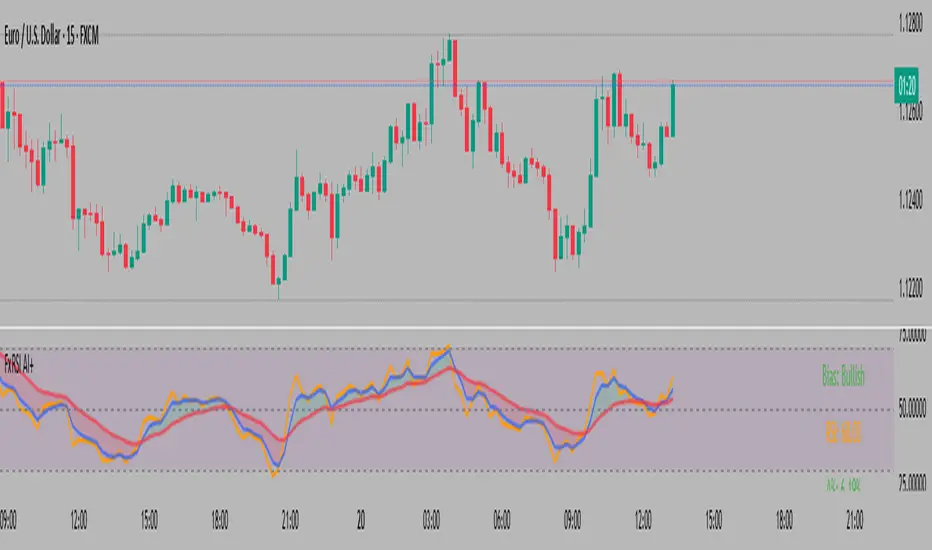
FxAST RSI Enhanced Plus [ALLDYN]
## 🟩 FxAST RSI Enhanced — Smoothed RSI Momentum with Dynamic Confluence Table
### 🔹 WHAT THIS SCRIPT DOES
This RSI enhancement script builds upon the classic Relative Strength Index by integrating:
* A **dual-layer EMA smoothing system** for RSI, allowing traders to observe fast vs. slow RSI movements
* **Real-time crossover signals** to detect early momentum shifts
* **Buy/Sell label plotting** when smoothed RSI crosses over/under with configurable thresholds
* An **optional smoothing toggle** to switch between swing and intraday trading styles
### 🔹 HOW IT WORKS
* RSI is calculated using a classic `rma` approach
* The script applies two separate EMAs (configurable lengths) to the RSI, serving as fast/slow signal lines
* Buy/Sell signals are generated when:
* The fast EMA crosses above the slow EMA (Buy) and RSI is above 40
* The fast EMA crosses below the slow EMA (Sell) and RSI is below 60
* RSI line, smoothed EMAs, and their fill are plotted for visual confirmation
**Original Feature** *(highlighting IP for protection)*:
A **confluence table** dynamically summarizes:
* The RSI fast/slow values
* The % delta between the smoothed EMAs
* A **directional bias reading** : Bullish, Bearish, or Neutral based on RSI behavior
* All values are color-coded and updated in real time to assist in fast market assessment
This table replaces cluttered on-chart signals with a **clean, structured summary** of RSI state and direction — ideal for both scalpers and swing traders.
### 🔹 HOW TO USE
1. Add the script to your chart (non-overlay).
2. Configure RSI/EMA lengths for your strategy (default: RSI 14, Fast EMA 3, Slow EMA 13).
3. Toggle “Smooth RSI?”:
* `ON` = For swing traders (smoother, slower signals)
* `OFF` = For intraday/momentum scalping (raw signals)
4. Use the **Buy/Sell labels** and **bias table** as confirmation tools, not sole entry triggers.
5. Alerts are available for both Buy and Sell crossover conditions.
### 🔹 WHAT MAKES IT ORIGINAL
While traditional RSI indicators only show the raw line or apply basic levels (30/70), this script offers:
* A **modular RSI smoothing engine** that adapts to swing or intraday preferences
* A **dual-EMA logic structure** for signal reliability
* A **real-time RSI bias assessment table**, designed to visualize RSI-based trend bias and magnitude
* The entire presentation is **decluttered** , avoiding redundant overlays while improving decision-making through the integrated data table
This script does not simply restyle RSI — it **restructures how RSI behavior is interpreted** , offering an objective confluence framework built around RSI’s smoothed motion and delta tracking.
---
Consecutive Green Candles + 20% Move ScreenerConsecutive Green Candles Momentum Tracker
This indicator identifies powerful bullish momentum streaks in stocks, highlighting opportunities where consistent buying pressure has driven significant price increases.
The script tracks sequences of consecutive green (bullish) candles that collectively move a stock's price by more than 20%. It marks both the beginning of such streaks with a green label and their conclusion with a red arrow when price momentum finally reverses.
Perfect for traders looking to:
- Identify stocks experiencing strong directional momentum
- Spot potential reversal points after extended rallies
- Screen for securities with recent bullish strength
- Understand the magnitude of recent price runs
Simply adjust the minimum number of candles and percentage threshold to match your preferred momentum criteria.

Momentum Wave Oscillator📈 Momentum Wave Oscillator (MWO) 📈
The Momentum Wave Oscillator (MWO) is a precision-designed tool for traders who want early, reliable insight into market shifts — before they fully appear on price charts.
Instead of reacting late to moves, MWO is engineered to anticipate changes in momentum by tracking market pressure within a dynamic range.
Its built-in bands and visual cues make it simple to spot key moments where momentum exhaustion, reversals, or fresh breakouts are most likely to occur.
How to Use:
Buy Zones: When the oscillator moves up from lower regions (typically below 20), it may indicate momentum building to the upside.
Sell Zones: When the oscillator moves down from upper regions (typically above 80), it may suggest momentum starting to weaken.
Dynamic Bands:
Unlike conventional fixed levels like 20 and 80, MWO features dynamic adaptive bands that better reflect real-time changes in market behavior.
Markets are fluid — volatility and momentum strength vary from cycle to cycle. Static zones can miss important shifts or produce false signals.
The dynamic bands allow the indicator to adapt naturally to changing conditions, offering more precise context for overbought, oversold, or breakout environments.
Background Colors and Labels:
Automatic highlights appear when potential turning points are detected, allowing traders to act quickly without chart clutter.
Best Practices:
Use the MWO as a confirmation tool alongside your existing strategy (trendlines, support/resistance, volume spikes, etc.).
Look for agreement between the MWO and price action for higher probability entries.
Avoid relying on it in isolation during extremely low-volume periods, where momentum may appear artificially weak or strong.
Adjust sensitivity settings depending on your trading style (scalping vs swing trading).
Important Note:
The MWO is designed for educational and informational purposes. No indicator can predict the future with certainty. Always combine it with proper risk management and your personal trading plan.

RSI Strength & Consolidation Zones (Zeiierman)█ Overview
RSI Strength & Consolidation Zones (Zeiierman) is a hybrid momentum and volatility visualization tool that blends enhanced RSI interpretation with ADX-driven consolidation detection. This indicator doesn't just show where RSI is trending — it interprets how strong that trend is, when that strength changes, and where the market may be consolidating in anticipation of breakout movement.
Using a combination of Kalman-filtered RSI, custom-built DMI/ADX, and low-volatility zone recognition, it gives traders a dynamic RSI with strength-based coloring, while also highlighting consolidation zones to spot breakout opportunities.
█ Its uniqueness
Traditional RSI indicators lack context. They may show you when the market is overbought or oversold, but they won’t tell you how strong that condition is, or whether it’s likely to result in continuation or consolidation.
This tool aims to solve that by introducing adaptive strength metrics and structural compression zones, allowing traders to anticipate when the market is likely preparing for a move.
█ How It Works
⚪ Enhanced RSI
Combines traditional RSI and a custom RSI implementation
Smooths both through a Kalman filter for trend direction
Final RSI line reflects smoothed consensus between manual and built-in RSI
Adds an RSI + Strength overlay to show when the directional conviction is increasing
⚪ ADX-Driven Strength Layer
Directional Movement Index (DMI) is calculated both manually and with built-in smoothing
The average ADX value is used to calculate a strength modifier
When ADX exceeds 20, RSI is dynamically enhanced or dampened to reflect directional force
Resulting visual: RSI appears stronger or weaker based on confirmed trend conditions
⚪ Consolidation Zone Detection
When ADX falls below 20, the indicator enters a consolidation zone state
Boxes are drawn dynamically to contain the price within these low-volatility structures
Once the price breaks out of the zone, the indicator plots a breakout signal (▲ or ▼)
⚪ Breakouts
Breakout markers are placed at the first close outside the consolidation box
These signals serve as early indicators for potential trend continuation or reversal
█ How to Use
⚪ Confirm Momentum Strength
Use the RSI + Strength line to determine whether current momentum is backed by trend conviction. If strength expands alongside rising RSI, the move has confirmation.
⚪ Consolidations Zones
When RSI is around the midline, and a consolidation box appears, expect lower volatility and a range-bound market, followed by a breakout.
⚪ Use Breakout Signals for Entry
Look for ▲ or ▼ markers as early triggers. These often coincide with volume expansions or structural breaks.
█ Settings Explained
RSI Length – Number of bars used for RSI. Shorter = more sensitive.
DMI Length – Used in both custom and built-in ADX/DI calculations.
ADX Smoothing – Smooths the trend strength signal. Higher values = smoother strength detection.
Trend Confirmation (Filter Strength) – Adjusts the responsiveness of the Kalman filter.
-----------------
Disclaimer
The content provided in my scripts, indicators, ideas, algorithms, and systems is for educational and informational purposes only. It does not constitute financial advice, investment recommendations, or a solicitation to buy or sell any financial instruments. I will not accept liability for any loss or damage, including without limitation any loss of profit, which may arise directly or indirectly from the use of or reliance on such information.
All investments involve risk, and the past performance of a security, industry, sector, market, financial product, trading strategy, backtest, or individual's trading does not guarantee future results or returns. Investors are fully responsible for any investment decisions they make. Such decisions should be based solely on an evaluation of their financial circumstances, investment objectives, risk tolerance, and liquidity needs.

Dskyz Options Flow Flux (OFF) - FuturesDskyz Options Flow Flux (OFF) - Futures
*This is a repost due to moderator intervention on use of ™ in my scripts. I'm in the process of getting this rectified. This was originally posted around mid-night CDT.
🧠 The Dskyz Options Flow Flux (OFF) - Futures indicator is a game changer for futures traders looking to tap into institutional activity with limited resources. Designed for TradingView this tool simulates options flow data (call/put volume and open interest) for futures contracts like MNQ MES NQ and ES giving u actionable insights through volume spike detection volatility adjustments and stunning visuals like aurora flux bands and round number levels. Whether u’re a beginner learning the ropes or a pro hunting for an edge this indicator delivers real time market sentiment and key price levels to boost ur trading game
Key Features
⚡ Simulated Options Flow: Breaks down call/put volume and open interest using market momentum and volatility
📈 Spike Detection: Spots big moves in volume and open interest with customizable thresholds
🧠 Volatility Filter: Adapts to market conditions using ATR for smarter spike detection
✨ Aurora Flux Bands: Glows with market sentiment showing u bullish or bearish vibes at a glance
🎯 Round Number Levels: Marks key psychological levels where big players might step in
📊 Interactive Dashboard: Real time metrics like sentiment score and volatility factor right on ur chart
🚨 Alerts: Get notified of bullish or bearish spikes so u never miss a move
How It Works
🧠 This indicator is built to make complex options flow analysis simple even with the constraints of Pine Script. Here’s the step by step:
Simulated Volume Data (Dynamic Split):
Pulls daily volume for ur chosen futures contract (MNQ1! MES1! NQ1! ES1!)
Splits it into call and put volume based on momentum (ta.mom) and volatility (ATR vs its 20 period average)
Estimates open interest (OI) for calls and puts (1.15x for calls 1.1x for puts)
Formula: callRatio = 0.5 + (momentum / close) * 10 + (volatility - 1) * 0.1 capped between 0.3 and 0.7
Why It Matters: Mimics how big players might split their trades giving u a peek into institutional sentiment
Spike Detection:
Compares current volume/OI to short term (lookbackShort) and long term (lookbackLong) averages
Flags spikes when volume/OI exceeds the average by ur set threshold (spikeThreshold for regular highConfidenceThreshold for strong)
Adjusts for volatility so u’re not fooled by choppy markets
Output: optionsSignal (2 for strong bullish -2 for strong bearish 1 for bullish -1 for bearish 0 for neutral)
Why It Matters: Pinpoints where big money might be stepping in
Volatility Filter:
Uses ATR (10 periods) and its 20 period average to calculate a volatility factor (volFactor = ATR / avgAtr)
Scales spike thresholds based on market conditions (volAdjustedThreshold = spikeThreshold * max(1 volFactor * volFilter))
Why It Matters: Keeps ur signals reliable whether the market is calm or wild
Sentiment Score:
Calculates a call/put ratio (callVolume / putVolume) and adjusts for volatility
Converts it to a 0 to 100 score (higher = bullish lower = bearish)
Formula: sentimentScore = min(max((volAdjustedSentiment - 1) * 50 0) 100)
Why It Matters: Gives u a quick read on market bias
Round Number Detection:
Finds the nearest round number (e.g. 100 for MNQ1! 50 for MES1!)
Checks for volume spikes (volume > 3 period SMA * spikeThreshold) and if price is close (within ATR * atrMultiplier)
Updates the top activity level every 15 minutes when significant activity is detected
Why It Matters: Highlights psychological levels where price often reacts
Visuals and Dashboard:
Combines aurora flux bands glow effects round number lines and a dashboard to make insights pop (see Visual Elements below)
Plots triangles for call/put spikes (green/red for strong lime/orange for regular)
Sets up alerts for key market moves
Why It Matters: Makes complex data easy to read at a glance
Inputs and Customization
⚙️ Beginners can tweak these settings to match their trading style while pros can dig deeper for precision:
Futures Symbol (symbol): Pick ur contract (MNQ1! MES1! NQ1! ES1!). Default: MNQ1!
Short Lookback (lookbackShort): Days for short term averages. Smaller = more sensitive. Range: 1+. Default: 5
Long Lookback (lookbackLong): Days for long term averages. Range: 5+. Default: 10
Spike Threshold (spikeThreshold): How big a spike needs to be (e.g. 1.1 = 10% above average). Range: 1.0+. Default: 1.1
High Confidence Threshold (highConfidenceThreshold): For strong spikes (e.g. 3.0 = 3x average). Range: 2.0+. Default: 3.0
Volatility Filter (volFilter): Adjusts for market volatility (e.g. 1.2 = 20% stricter in volatile markets). Range: 1.0+. Default: 1.2
Aurora Flux Transparency (glowOpacity): Controls band transparency (0 = solid 100 = invisible). Range: 0 to 100. Default: 65
Show Show OFF Dashboard (showDashboard): Toggles the dashboard with key metrics. Default: true
Show Nearest Round Number (showRoundNumbers): Displays round number levels. Default: true
ATR Multiplier for Proximity (atrMultiplier): How close price needs to be to a round number (e.g. 1.5 = within 1.5x ATR). Range: 0.5+. Default: 1.5
Functions and Logic
🧠 Here’s the techy stuff pros will love:
Simulated Volume Data : Splits daily volume into call/put volume and OI using momentum and volatility
Volatility Filter: Scales thresholds with volFactor = atr / avgAtr for adaptive detection
Spike Detection: Flags spikes and assigns optionsSignal (2, -2, 1, -1, 0) for sentiment
Sentiment Score: Converts call/put ratio into a 0-100 score for quick bias reads
Round Number Detection: Identifies key levels and significant activity for trading zones
Dashboard Display: Updates real time metrics like sentiment score and volatility factor
Visual Elements
✨ These visuals make data come alive:
Gradient Background: Green (bullish) red (bearish) or yellow (neutral/choppy) at 95% transparency to show trend
Aurora Flux Bands: Stepped bands (linewidth 3) around a 14 period EMA ± ATR * 1.8. Colors shift with sentiment (green red lime orange gray) with glow effects at 85% transparency
Round Number Visualization: Stepped lines (linewidth 2) at key levels (solid if active dashed if not) with labels (black background white text size.normal)
Visual Signals: Triangles above/below bars for spikes (size.small for strong size.tiny for regular)
Dashboard: Bottom left table (2 columns 10 rows) with a black background (29% transparency) gray border and metrics:
⚡ Round Number Activity: “Detected” or “None”
📈 Trend: “Bullish” “Bearish” or “Neutral” (colored green/red/gray)
🧠 ATR: Current 10 period ATR
📊 ATR Avg: 20 period SMA of ATR
📉 Volume Spike: “YES” (green) or “NO” (red)
📋 Call/Put Ratio: Current ratio
✨ Flux Signal: “Strong Bullish” “Strong Bearish” “Bullish” “Bearish” or “Neutral” (colored green/red/gray)
⚙️ Volatility Factor: Current volFactor
📈 Sentiment Score: 0-100 score
Usage and Strategy Recommendations
🎯 For Beginners: Use high confidence spikes (green/red triangles) for easy entries. Check the dashboard for a quick market read (sentiment score above 60 = bullish below 40 = bearish). Watch round number levels for support/resistance
💡 For Pros: Combine flux signals with round number activity for high probability setups. Adjust lookbackShort/lookbackLong for trending vs choppy markets. Use volFactor for position sizing (higher = smaller positions)

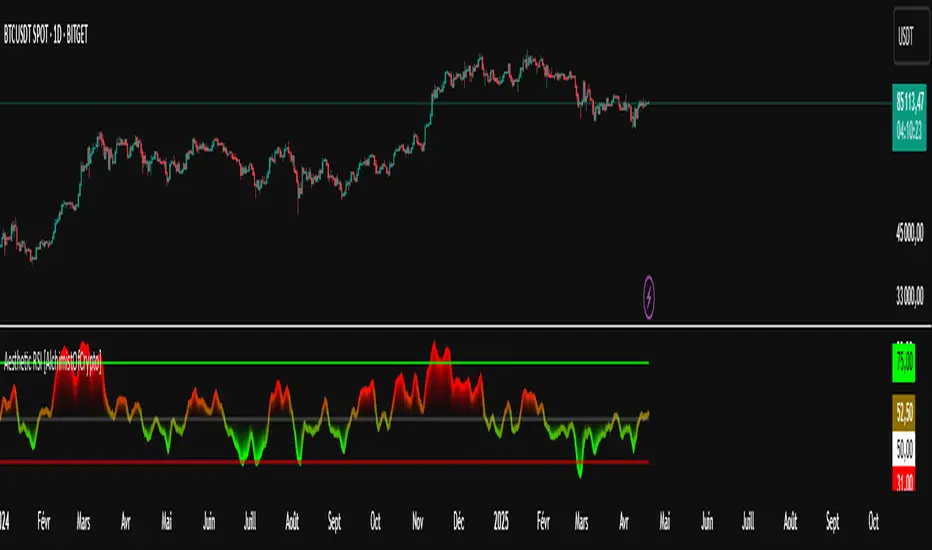
Aesthetic RSI [AlchimistOfCrypto]🌌 Aesthetic RSI – Unveiling the Fractal Forces of Markets 🌌
Category: Momentum Indicators 📈
"The RSI oscillator, formalized through an advanced mathematical prism, reveals the underlying fractal structures of price movements. This indicator draws inspiration from quantum principles of divergence-convergence where the probability of a return to equilibrium increases proportionally to the distance from the median point. Our implementation employs sophisticated algorithmic smoothing to filter out the stochastic noise inherent in financial markets, allowing visualization of the true momentum forces according to thermodynamic entropy principles applied to trading systems."
📊 Professional Trading Application
The Aesthetic RSI is a visually stunning and mathematically refined take on the classic Relative Strength Index. With customizable settings, advanced smoothing, and eight unique visual palettes, it empowers traders to detect momentum shifts and divergences with unparalleled clarity.
⚙️ Indicator Configuration
- Length 📏
The core parameter (default: 20) that determines the calculation period.
- Lower values (8-14): Increase sensitivity for short-term trading.
- Higher values (21-34): Provide stronger signals for position trading.
- OverBought/OverSold Thresholds 🎯
Customizable boundaries (default: 75/25) to identify extreme market conditions.
- Calibrate based on asset volatility: Higher volatility assets may need wider thresholds (80/20) to reduce false signals.
- Style 🎨
Eight meticulously crafted visual palettes optimized for pattern recognition:
- Miami Vice (default): High-contrast cyan/magenta scheme for spotting divergences.
- Cyberpunk: Yellow/purple combo to highlight momentum shifts.
- Classic: Traditional green/red for conventional analysis.
- High Contrast: Maximum visual separation for traders with visual impairments.
- Specialized palettes (Forest, Ocean, Fire, Monochrome): Tailored for diverse market conditions.
- Mode Selection 🔄
- Full: Displays a complete gradient spectrum across the RSI range, emphasizing momentum transitions between 35-65.
- OverZone: Focuses on actionable extreme zones, reducing noise in ranging markets.
🚀 How to Use
1. Adjust Length ⏰: Set the period based on your trading style (short-term or long-term).
2. Fine-Tune Thresholds 🎚️: Customize overbought/oversold levels to match the asset’s volatility.
3. Select a Palette 🌈: Choose a visual style that enhances your pattern recognition.
4. Choose Mode 🔍: Use "Full" for detailed momentum analysis or "OverZone" for extreme zone focus.
5. Spot Divergences ✅: Look for price-RSI divergences to anticipate reversals.
6. Trade with Precision 🛡️: Combine with other indicators for high-probability setups.
📅 Release Notes (April 2025)
Aesthetic RSI blends quantum-inspired mathematics with artistic visualization, redefining momentum analysis. Stay tuned for future enhancements! ✨
🏷️ Tags
#Trading #TechnicalAnalysis #RSI #Momentum #Divergence #MultiTimeframe #TradingStrategy #RiskManagement #Forex #Stocks #Crypto #Bitcoin #AlgoTrading #DayTrading #SwingTrading #TheAlchimist #QuantumTrading #VisualTrading #PatternRecognition