HTF OverlayThe "HTF Overlay" indicator provides a fully customizable higher timeframe (HTF) candle overlay on your current chart, designed to enhance your analysis and trading strategies. This tool is particularly useful for traders utilizing ICT's AMD power of three strategies, focusing on key candle OHLC/OLHC expansions, or those who need a quick reference to a higher timeframe without switching charts.
Originality and Usefulness:
The "HTF Overlay" script stands out due to its seamless integration of HTF candles onto lower timeframe charts. It ensures the current developing candle is left untouched, preserving the clarity of ongoing market activity. This feature is crucial for traders who need to analyze market structure on a smaller timeframe within the context of a larger timeframe candle.
Functionality:
Dynamic HTF Candle Display:
The script overlays HTF candles, updating them in real-time as new HTF candles form. This allows traders to see historical price behavior and trends alongside the current price action.
Visual Customization:
Users can adjust various aspects of the HTF candles, including the number of candles displayed, body colors, wick colors, wick thickness, and transparency levels for both body and wick. This ensures the overlay fits seamlessly with any chart setup.
Real-time Updates:
The indicator updates dynamically, ensuring that the HTF candles remain relevant to the current market conditions without affecting the developing candle.
How It Works:
Data Retrieval: The script uses the request.security function to fetch HTF data, including open, high, low, close, time, and time close values.
Candle Overlay: It calculates the visual parameters for the HTF candles (body and wick positions, colors, and transparency) and overlays them on the chart.
Update Mechanism: The script differentiates between new and ongoing candles, updating the current candle in real-time without disrupting its development.
How to Use:
Setup:
Select the higher timeframe you want to overlay (e.g., 240 minutes for 4-hour candles).
Specify the number of HTF candles to display.
Customize the appearance of the HTF candles, including colors and transparency settings for both the body and wicks.
Interpretation:
Use the HTF overlay to validate trading decisions by analyzing price action from a broader perspective.
Identify key support and resistance levels, trend directions, and potential reversal points by comparing current price action with HTF structures.
Integration:
Combine this indicator with other tools your strategy may use for a more comprehensive analysis.
Use it in conjunction with the first and last candle highlight feature to quickly identify key reference points and enhance your trading strategy.
Conclusion:
The "HTF Overlay" indicator is a versatile and essential tool for traders who need to incorporate higher timeframe analysis into their trading strategies. Its customizable features and real-time updates provide a deeper insight into market dynamics, helping traders make more informed decisions. Whether used for trend confirmation, breakout identification, or support/resistance analysis, this indicator enhances your ability to navigate the markets effectively.
Pesquisar nos scripts por "market structure"

ICT Turtle Soup | Flux Charts💎 GENERAL OVERVIEW
Introducing our new ICT Turtle Soup Indicator! This indicator is built around the ICT "Turtle Soup" model. The strategy has 5 steps for execution which are described in this write-up. For more information about the process, check the "HOW DOES IT WORK" section.
Features of the new ICT Turtle Soup Indicator :
Implementation of ICT's Turtle Soup Strategy
Adaptive Entry Method
Customizable Execution Settings
Customizable Backtesting Dashboard
Alerts for Buy, Sell, TP & SL Signals
📌 HOW DOES IT WORK ?
The ICT Turtle Soup strategy may have different implementations depending on the selected method of the trader. This indicator's implementation is described as :
1. Mark higher timerame liquidity zones.
Liquidity zones are where a lot of market orders sit in the chart. They are usually formed from the long / short position holders' "liquidity" levels. There are various ways to find them, most common one being drawing them on the latest high & low pivot points in the chart, which this indicator does.
2. Mark current timeframe market structure.
The market structure is the current flow of the market. It tells you if the market is trending right now, and the way it's trending towards. It's formed from swing higs, swing lows and support / resistance levels.
3. Wait for market to make a liquidity grab on the higher timeframe liquidity zone.
A liquidity grab is when the marked liquidity zones have a false breakout, which means that it gets broken for a brief amount of time, but then price falls back to it's previous position.
4. Buyside liquidity grabs are "Short" entries and Sellside liquidity grabs are "Long" entries by default.
5. Wait for the market-structure shift in the current timeframe for entry confirmation.
A market-structure shift happens when the current market structure changes, usually when a new swing high / swing low is formed. This indicator uses it as a confirmation for position entry as it gives an insight of the new trend of the market.
6. Place Take-Profit and Stop-Loss levels according to the risk ratio.
This indicator uses "Average True Range" when placing the stop-loss & take-profit levels. Average True Range calculates the average size of a candle and the indicator places the stop-loss level using ATR times the risk setting determined by the user, then places the take-profit level trying to keep a minimum of 1:1 risk-reward ratio.
This indicator follows these steps and inform you step by step by plotting them in your chart.
🚩UNIQUENESS
This indicator is an all-in-one suit for the ICT's Turtle Soup concept. It's capable of plotting the strategy, giving signals, a backtesting dashboard and alerts feature. It's designed for simplyfing a rather complex strategy, helping you to execute it with clean signals. The backtesting dashboard allows you to see how your settings perform in the current ticker. You can also set up alerts to get informed when the strategy is executable for different tickers.
⚙️SETTINGS
1. General Configuration
MSS Swing Length -> The swing length when finding liquidity zones for market structure-shift detection.
Higher Timeframe -> The higher timeframe to look for liquidity grabs. This timeframe setting must be higher than the current chart's timeframe for the indicator to work.
Breakout Method -> If "Wick" is selected, a bar wick will be enough to confirm a market structure-shift. If "Close" is selected, the bar must close above / below the liquidity zone to confirm a market structure-shift.
Entry Method ->
"Classic" : Works as described on the "HOW DOES IT WORK" section.
"Adaptive" : When "Adaptive" is selected, the entry conditions may chance depending on the current performance of the indicator. It saves the entry conditions and the performance of the past entries, then for the new entries it checks if it predicted the liquidity grabs correctly with the current setup, if so, continues with the same logic. If not, it changes behaviour to reverse the entries from long / short to short / long.
2. TP / SL
TP / SL Method -> If "Fixed" is selected, you can adjust the TP / SL ratios from the settings below. If "Dynamic" is selected, the TP / SL zones will be auto-determined by the algorithm.
Risk -> The risk you're willing to take if "Dynamic" TP / SL Method is selected. Higher risk usually means a better winrate at the cost of losing more if the strategy fails. This setting is has a crucial effect on the performance of the indicator, as different tickers may have different volatility so the indicator may have increased performance when this setting is correctly adjusted.

Quicksilver Master Terminal [Institutional]Overview
The Quicksilver Master Terminal is a comprehensive data visualization interface designed to bring institutional-grade market awareness to the retail chart. It replaces the need for multiple cluttered indicators by consolidating Trend, Momentum, Volatility, and Structure into a single Heads-Up Display (HUD).
Designed by Quicksilver Algo Systems, this tool is engineered for precision scalpers and prop firm traders who require instant situational awareness without switching timeframes.
Features
1. The Institutional HUD (Heads-Up Display)
Located in the top-right corner, this live dashboard provides real-time metrics on:
Market Structure: Instantly identifies if the asset is in a Bullish or Bearish regime relative to the 200 EMA.
Momentum Status: Tracks overbought/oversold conditions using smoothed Stochastic logic.
Volatility (ATR): Displays live Average True Range data for precise Stop Loss placement.
Volume Flow: Detects institutional volume spikes (1.5x average).
2. The Trend Cloud
A dynamic visual ribbon that fills the space between the Fast EMA (50) and Slow EMA (200).
Green Cloud: Strong Bullish Trend (Look for Longs).
Red Cloud: Strong Bearish Trend (Look for Shorts).
Cross: Visual warning of trend reversals.
3. Sniper Signal Logic
The script paints "INSTITUTIONAL BUY" and "INSTITUTIONAL SELL" labels only when high-probability confluence occurs:
Exhaustion: Stochastic RSI breaches extreme levels (<20 or >80).
Confirmation: Price action aligns with Heikin Ashi smoothing to filter noise.
Momentum: Fast %K crosses Slow %D.
How to Use
For Scalping (1m - 5m): Wait for the Trend Cloud to align with the Signal. Take "BUY" signals only when the Cloud is Green.
For Risk Management: Use the live "Volatility" number in the HUD to set your Stop Loss (e.g., 1.5x the current Volatility value).
About the Developer
This script is part of the Quicksilver Ecosystem. We build algorithmic solutions focused on capital preservation and risk management for funded traders.
Disclaimer: This tool is for educational market analysis only. Past performance is not indicative of future results.

🟡 GOLD 4H HUD v8.9 — Loose ICT OB + Strong/Weak + FVG/HVN/LVNGOLD 4H HUD v8.9 is a clean, structured Smart Money Concepts (SMC)–based analysis tool designed exclusively for XAUUSD on the 4-hour timeframe.
It focuses on the three most important elements for institutional orderflow analysis:
✔ Loose ICT Order Blocks (Demand/Supply)
✔ Fair Value Gaps (FVG)
✔ Volume Profile Zones (HVN/LVN/POC)
The script builds a professional-style HUD that displays the key institutional regions and structural levels that matter most for gold traders.
📌 Key Features
1 — Market Structure Engine (HH/HL & BOS)
The indicator detects:
Minor swing Highs and Lows
Last confirmed HH / HL levels
Break of Structure (BOS) for directional bias
EMA-200 trend filter (UP / DOWN / NEUTRAL)
This gives traders a clean structural read without clutter or noise.
2 — Loose FVG Engine (Tolerance-Based ICT Gaps)
A soft-threshold FVG engine detects “loose” Fair Value Gaps using a 0.1% price tolerance.
This method ensures:
Fewer missed imbalances
Cleaner OB/FVG alignment
Higher accuracy on 4H gold displacement legs
FVGs automatically shift to the right side of the chart for clean visualization.
3 — Order Block Engine (Demand/Supply + Strong/Weak Classification)
A simplified ICT-style OB engine scans the past few candles whenever BOS is detected.
It identifies:
Demand OB during bullish BOS
Supply OB during bearish BOS
Strong OB if fully nested inside an active FVG
Weak OB otherwise
OB boxes include:
Clear color coding (strong vs. weak)
Price range labels inside each box
Automatic right-shift for visual clarity
4 — Volume Profile Engine (POC / HVN / LVN / VAH / VAL)
Based on a rolling window (default 120 bars), the script builds a lightweight volume distribution.
It displays:
POC (Point of Control)
HVN (High Volume Node)
LVN (Low Volume Node)
Value Area High / Low
HVN/LVN zones are shown as right-shifted colored boxes with price labels.
These zones help identify:
Institutional accumulation
Low-liquidity rejection points
Areas where price tends to react strongly
5 — Support / Resistance Mapping
The script automatically generates:
OB-based support/resistance
Swing-high/swing-low levels
HVN/LVN structural levels
These are displayed in the HUD for fast reference.
6 — Professional HUD Panel
A compact, easy-to-read HUD summarizes:
Trend direction
Latest HH/HL
OB ranges (Strong/Weak)
HVN/LVN price zones
POC
Multi-layer support & resistance
This turns the script into a fully functional analysis dashboard.
📌 What This Indicator Is NOT
To avoid misunderstanding:
It does not take entries or generate buy/sell signals
It does not auto-detect CHOCH, MSS, SMT, or sweeps
It is not a trading bot
This tool is designed as an institutional-style map and analysis HUD, not a strategy.
📌 Best Use Case
This indicator is ideal for traders who want to:
Read institutional structure on XAUUSD
Identify clean Demand/Supply zones
Visualize FVG/OB/HVN interactions
Track high-value liquidity levels
Build directional bias on 4H before dropping to execution timeframes
⚠ Important Note
This tool is designed exclusively for the 4H timeframe.
Using it on lower timeframes will display a warning.

Fibonacci Zones and RejectionsThis tool combines swing structure, Fibonacci retracements and candle-wick rejection logic to highlight high-probability reversal or continuation zones.
What it does
Tracks market structure automatically
Detects swing highs and swing lows based on a user-defined Structure Period.
Marks bullish shifts in structure and bearish shifts with CHoCH labels and Break of Structure (BoS) lines.
Optionally draws a dotted swing trend line between the active swing high and swing low and can show price labels at those swing points.
Draws dynamic Fibonacci retracements on the latest swing
Automatically anchors a Fibonacci retracement between the current swing high and swing low.
Lets you enable/disable individual Fibonacci levels and customize their values, colors and line width.
Can extend Fib levels forward to the latest bar and optionally keep previous Fib structures on the chart for context.
Optionally fills the “Golden Zone” (by default the first two levels, e.g. 0.50 and 0.618) so the core pullback area is visually obvious.
Defines an OTE / “Gold Zone” band from the active Fib levels
Uses the first two Fib lines (by default 0.50 and 0.618 or set another zone such as 61.8% to 78.6%) to form a live “Optimal Trade Entry” band.
Continuously updates this band as new structure forms and swings develop.
Detects rejection candles inside the Fib OTE band
Breaks each candle into upper wick, lower wick, body and total range.
A bullish rejection is a candle where:
Price trades into the OTE band,
The lower wick is a large portion of the bar’s range, and
The body is not tiny (minimum body-to-range ratio is configurable).
A bearish rejection is the mirror condition using the upper wick.
Only candles whose range overlaps the OTE band are considered; this filters for true reactions to the Fib zone.
Plots clear signals and alerts
Bullish OTE rejection is plotted as a large cross at the low of the candle.
Bearish OTE rejection is plotted as a large cross at the high of the candle.
Built-in alertcondition calls allow you to set alerts for:
Bullish OTE Rejection
Bearish OTE Rejection
Optional “debug” markers can show all raw rejection candles and all bars that sit inside the OTE band, to help you understand how the logic behaves.
Use cases
Identify pullback entries into the desired Fib zone after a clear structural move.
Confirm reversals or continuations using wick-based rejection inside a pre-defined Fib discount/premium zone.
Combine with your own higher-timeframe bias or ICT / SMC tools to refine entry timing around key levels.

Simulated Liquidation Heatmap [QuantAlgo]🟢 Overview
This indicator visualizes where clusters of stop-loss orders and liquidation levels are likely located, displayed as a 'heatmap'. It's based on the concept of market structure liquidity: large groups of stop orders tend to gather around obvious technical levels (like swing highs and lows), and these pools of orders often attract price movement from institutional traders. The indicator uses a fractal-based algorithm to identify these high-probability liquidation zones and displays them as dynamic, color-coded boxes.
The key feature is the thermal color gradient, which indicates the freshness (age) and therefore the relative relevance of the liquidity zone. Hot colors (e.g., Red/Yellow) represent fresh clusters that have just formed, suggesting strong and immediate liquidity interest. Cold colors (e.g., Blue/Purple) represent aged or decaying clusters that are becoming less relevant over time. This visualization allows traders to anticipate potential liquidity sweeps (stop hunts) and understand areas of significant retail and institutional positioning.
🟢 Key Features
1. Liquidity Zone Heatmap
The core function is the identification of swing high and swing low price points using a user-defined Lookback period. These points are where retail traders are statistically most likely to place their stop-loss orders. The indicator simulates the clustering of these orders by drawing a zone (box) around the detected swing point, with the vertical size controlled by the Stop/Liquidation Zone Width (%) setting.
▶ Cluster Lookback: Defines the sensitivity of swing point detection. Lower values detect frequent, minor zones (scalping/intraday); higher values detect major, stronger swing points (swing trading).
▶ Zone Width (%): Sets the percentage range above and below the swing point where stops are simulated to cluster, accounting for slippage and typical stop placement spread.
▶ Liquidity Decay: Zones gradually fade in color intensity and are eventually removed after the user-defined Liquidity Decay Period (Bars), ensuring the heatmap only displays relevant, current liquidity areas.
▶ Round Number Filter: An optional filter that limits the display to liquidity zones occurring only at psychologically significant round numbers (e.g., $100, $1,500.00), which typically attract higher concentrations of orders.
2. Thermal Color Gradient
The heatmap's color is a direct function of the zone's age, providing a visual proxy for immediate relevance.
▶ Freshness: Newly created zones are displayed in the Hot Color (high relevance).
▶ Decay: As bars pass, the zone color transitions along the gradient toward the Cold Color and increased transparency (lower relevance), until it is removed entirely.
▶ Color Schemes: Multiple pre-configured and custom color schemes are available to optimize the visualization for different chart themes and color preferences.
3. Liquidity Heat Thermometer
An optional visual thermometer is displayed on the chart to provide an instant, overall assessment of the current liquidation heat level in the immediate vicinity of the price.
▶ Calculation: The thermometer calculates an aggregate heat score based on the age and proximity of all liquidity zones within a user-defined Zone Detection Range (%) of the current price.
▶ Visual Feedback: A marker (triangle) points to the corresponding level on the thermometer's color gradient (Hot to Cold). A high reading indicates price is close to fresh, dense stop clusters, suggesting high volatility or an imminent liquidity sweep is probable. A low reading indicates price is in a low-density or aged liquidity area.
▶ Customization: The thermometer's resolution, position, and text size are fully customizable for optimal chart placement and readability.
🟢 Practical Applications
▶ Anticipate Sweeps: Prioritize trading in the direction of Hot (fresh) liquidity zones. For example, a hot low-side zone suggests strong sell-side liquidity (stop-losses) is available for large buyers to sweep.
▶ Filter Noise: Use the Round Number Filter to focus only on the highest probability liquidation zones, which are often at clean, psychological price levels.
▶ Validate Entries: Combine the Heat Thermometer with price action analysis. A rising heat level indicates increasing proximity to a major stop cluster, signaling a potential turn or an aggressive market move to sweep those stops.
▶ Risk Management: Understand that price often acts dynamically around these zones. High heat levels imply high risk/reward setups; stops should be placed strategically beyond the defined Liquidation Zone Width.
▶ Multi-Timeframe Context: Higher timeframes (e.g., Daily, 4-Hour) often reveal more significant, major liquidity zones. Use this indicator on lower timeframes (e.g., 5-min, 15-min) for execution, but prioritize zones that align with higher-timeframe structures.

Price Volume Heatmap [MHA Finverse]Price Volume Heatmap - Advanced Volume Profile Analysis
Unlock the power of institutional-level volume analysis with the Price Volume Heatmap indicator. This sophisticated tool visualizes market structure through volume distribution across price levels, helping you identify key support/resistance zones, high-probability reversal areas, and optimal entry/exit points.
🎯 What Makes This Indicator Unique?
Unlike traditional volume indicators that only show volume over time, this heatmap displays volume distribution across price levels , revealing where the most significant trading activity occurred. The gradient coloring system instantly highlights high-volume nodes (areas of strong interest) and low-volume nodes (potential breakout zones).
📊 Core Features
1. Dynamic Volume Heatmap
- Visualizes volume concentration across 250 customizable price levels
- Gradient color scheme from high volume (white) to low volume (teal/green)
- Adjustable brightness multiplier for enhanced contrast and clarity
- Real-time updates as market conditions evolve
2. Point of Control (POC)
- Automatically identifies the price level with the highest traded volume
- Acts as a magnetic price level where markets often return
- Critical for identifying fair value areas and potential reversal zones
- Customizable line style, width, and color
3. Flexible Lookback Settings
- Lookback Bars: Set any value from 1-5000 bars to control analysis depth
- Visible Range Mode: Analyze only what's currently visible on your chart
- Timeframe-Specific Settings: Different lookback periods for 1m, 5m, 15m, 30m, 1h, Daily, and Weekly charts
- Adapts to your trading style - scalping to position trading
4. Session Separation Analysis
- Tokyo Session: 00:00-09:00 UTC
- London Session: 07:00-16:00 UTC
- New York Session: 13:00-22:00 UTC
- Sydney Session: 21:00-06:00 UTC
- Daily Reset: Analyze each trading day independently
Session separation allows you to understand volume distribution specific to each major trading session, revealing institutional order flow patterns and session-specific support/resistance levels.
5. Profile Width Options
- Dynamic: Profile width adjusts based on lookback period
- Fixed Bars: Set a specific bar count for consistent profile width
- Extend Forward: Project the profile into future bars for planning trades
6. Smart Alerts
- POC crossover/crossunder alerts
- New session start notifications
- Never miss critical price action at high-volume nodes
📈 How to Use This Indicator Professionally
Understanding Market Structure:
High Volume Nodes (HVN):
- Appear as bright/white areas in the heatmap
- Represent price levels where significant trading occurred
- Act as strong support/resistance zones
- Markets often consolidate or bounce from these levels
- Trading Strategy: Look for entries when price tests HVN areas with confluence from other indicators
Low Volume Nodes (LVN):
- Appear as darker/teal areas in the heatmap
- Represent price levels with minimal trading activity
- Price tends to move quickly through these areas
- Often form "gaps" in the volume profile
- Trading Strategy: Expect rapid price movement through LVN zones; avoid placing stop losses here
Point of Control (POC):
- The single most important price level in your analysis window
- Represents the fairest price where maximum volume traded
- Price gravitates toward POC like a magnet
- Trading Strategy:
* When price is above POC: bullish bias, POC acts as support
* When price is below POC: bearish bias, POC acts as resistance
* POC breaks often lead to significant trend changes
Session-Based Analysis:
Use session separation to understand how different market participants trade:
Asian Session (Tokyo/Sydney):
- Typically lower volatility and range-bound
- Volume profiles often show tight, balanced distribution
- Use for identifying overnight ranges and gap fill zones
London Session:
- Highest volume session for forex pairs
- Often shows strong directional bias
- Look for breakouts from Asian ranges during London open
New York Session:
- Maximum participation when overlapping with London
- Institutional order flow most visible
- POC during NY session often becomes key level for following sessions
🎯 Practical Trading Applications
1. Identifying Support & Resistance:
High volume nodes from the heatmap are far more reliable than traditional swing highs/lows. When price approaches an HVN, expect reaction - either a bounce or a significant breakout if breached.
2. Trend Confirmation:
- Healthy uptrend: POC rising over time, HVN forming at higher levels
- Healthy downtrend: POC falling over time, HVN forming at lower levels
- Consolidation: POC relatively flat, volume balanced across range
3. Breakout Trading:
When price breaks through a Low Volume Node with momentum, it often continues to the next High Volume Node. Use LVN areas as measured move targets.
4. Reversal Zones:
Multiple HVN stacking on top of each other creates a "volume shelf" - an extremely strong support/resistance zone where reversals are highly probable.
5. Risk Management:
- Place stops beyond HVN areas (not within LVN zones)
- Size positions based on distance to nearest HVN
- Use POC as trailing stop level in trending markets
⚙️ Recommended Settings
For Day Trading (Scalping/Intraday):
- Lookback: 200-500 bars
- Rows: 200-250
- Enable session separation for your primary trading session
- Profile Width: Dynamic or Fixed Bars (30-50)
For Swing Trading:
- Lookback: 500-1000 bars
- Rows: 250
- Session separation: Daily Reset
- Profile Width: Dynamic
For Position Trading:
- Lookback: 1000-3000 bars
- Rows: 250
- Use timeframe-specific settings
- Profile Width: Extend Forward (20-50 bars)
💡 Pro Tips
1. Combine this indicator with price action analysis - volume confirms what price is telling you
2. Watch for POC convergence with other technical levels (fibonacci, pivot points, moving averages)
3. Volume at extremes (tops/bottoms of heatmap) often indicates exhaustion
4. Session POC from previous sessions often acts as magnet for current session
5. Increase brightness multiplier (1.5-2.5) for clearer visualization on busy charts
6. Use "Number of Sessions to Display" to analyze consistency of volume levels across multiple sessions
🎨 Customization
Fully customizable visual appearance:
- Gradient colors for volume visualization
- POC line thickness, color, and style
- Session line colors and visibility
- All settings organized in intuitive groups
⚠️ Disclaimer
This indicator is a technical analysis tool and should not be used as the sole basis for trading decisions. Always combine volume analysis with proper risk management, fundamental analysis, and other technical indicators. Past performance does not guarantee future results.
---
Support & Updates
Regular updates and improvements are made to enhance functionality. For questions, suggestions, or bug reports, please use the comments section below.
Happy Trading! 📊💹

One for AllOne for All (OFA) - Complete ICT Analysis Suite
Version 3.3.0 by theCodeman
📊 Overview
One for All (OFA) is a comprehensive TradingView indicator designed for traders who follow Inner Circle Trader (ICT) concepts. This all-in-one tool combines essential ICT analysis features—sessions, kill zones, previous period levels, and higher timeframe candles with Fair Value Gaps (FVGs) and Volume Imbalances (VIs)—into a single, highly customizable indicator. Whether you're a beginner learning ICT concepts or an experienced trader refining your edge, OFA provides the visual structure needed for precise market analysis and execution.
✨ Key Features
- 🏷️ Customizable Watermark**: Display your trading identity with customizable titles, subtitles, symbol info, and full style control
- 🌍 Trading Sessions**: Visualize Asian, London, and New York sessions with high/low lines, range boxes, and open/close markers
- 🎯 Kill Zones**: Highlight 5 critical ICT kill zones with precise timing and visual boxes
- 📈 Previous Period H/L**: Track Daily, Weekly, and Monthly highs/lows with customizable styles and lookback periods
- 🕐 Higher Timeframe Candles**: Display up to 5 HTF timeframes with OHLC trace lines, timers, and interval labels
- 🔍 FVG & VI Detection**: Automatically detect and visualize Fair Value Gaps and Volume Imbalances on HTF candles
- ⚙️ Universal Timezone Support**: Works globally with GMT-12 to GMT+14 timezone selection
- 🎨 Full Customization**: Control colors, styles, visibility, and layout for every feature
🚀 How to Use
Watermark Setup
The watermark overlay helps you identify your charts and maintain focus on your trading principles:
1. Enable/disable watermark via "Show Watermark" toggle
2. Customize the title (default: "Name") to display your trading name or account identifier
3. Set up to 3 subtitles (default: "Patience", "Confidence", "Execution") as trading reminders
4. Choose position (9 locations available), size, color, and transparency
5. Toggle symbol and timeframe display as needed
Use Case: Display your trading principles or account name for multi-monitor setups or content creation.
Trading Sessions Analysis
Sessions define market character and liquidity availability:
1. Enable "Show All Sessions" to visualize all three sessions
2. Adjust timezone to match your local market (default: UTC-5 for EST)
3. Customize session times if needed (defaults cover standard hours)
4. Enable session range boxes to see consolidation zones
5. Use session high/low lines to identify key levels for the current session
6. Enable open/close markers to track session transitions
Use Case: Identify which session you're trading in, track session highs/lows for liquidity, and anticipate session transition volatility.
Kill Zones Trading
Kill zones are ICT's high-probability trading windows:
1. Enable individual kill zones or use "Show All Kill Zones"
2. **Asian Kill Zone** (2000-0000 GMT): Early positioning and smart money accumulation
3. **London Kill Zone** (0300-0500 GMT): European market opening volatility
4. **NY AM Kill Zone** (0930-1100 EST): Post-NYSE open expansion
5. **NY Lunch Kill Zone** (1200-1300 EST): Midday consolidation or manipulation
6. **NY PM Kill Zone** (1330-1600 EST): Afternoon positioning and closes
7. Customize colors and times to match your trading style
8. Set max days display to control historical visibility (default: 30 days)
Use Case: Focus entries during high-probability windows. Watch for liquidity sweeps at kill zone openings and institutional positioning.
Previous Period High/Low Levels
Previous period levels act as magnetic price targets and support/resistance:
1. Enable Daily (PDH/PDL), Weekly (PWH/PWL), or Monthly (PMH/PML) levels individually
2. Set lookback period (how many previous periods to display)
3. Choose line style: Solid (current emphasis), Dashed (standard), or Dotted (subtle)
4. Customize colors per timeframe for visual hierarchy
5. Adjust line width (1-5) for visibility preference
6. Enable gradient effect to fade older periods
7. Position labels left or right based on chart layout
8. Customize label text for your preferred notation
Use Case: Identify key levels where price is likely to react. Daily levels work on intraday timeframes, Weekly on daily charts, Monthly for swing trading.
Higher Timeframe (HTF) Candles
HTF candles reveal the larger market context while trading lower timeframes:
1. Enable up to 5 HTF slots simultaneously (default: 5m, 15m, 1H, 4H, Daily)
2. Choose display mode: "Below Chart" (stacked rows) or "Right Side" (compact column)
3. Customize timeframe, colors (bull/bear), and titles for each slot
4. **OHLC Trace Lines**: Visual lines connecting HTF candle levels to chart bars
5. **HTF Timer**: Countdown showing time remaining until HTF candle close
6. **Interval Labels**: Display day of week (Daily+) or time (intraday) on each candle
7. For Daily candles: Choose open time (Midnight, 8:30, 9:30) to match your market structure preference
Use Case: Trade lower timeframes while respecting higher timeframe structure. Watch for HTF candle closes to confirm directional bias.
FVG & VI Detection
Fair Value Gaps and Volume Imbalances highlight inefficiencies that price often revisits:
1. **Fair Value Gaps (FVGs)**: Detected when HTF candle wicks don't overlap between 3 consecutive candles
- Bullish FVG: Gap between candle 1 high and candle 3 low (green box by default)
- Bearish FVG: Gap between candle 1 low and candle 3 high (red box by default)
2. **Volume Imbalances (VIs)**: Similar detection but focuses on body gaps
- Bullish VI: Gap between candle 1 close and candle 3 open
- Bearish VI: Gap between candle 1 open and candle 3 close
3. Enable FVG/VI detection per HTF slot individually
4. Customize colors and transparency for each imbalance type
5. Boxes appear on chart at formation and remain visible as retracement targets
**Use Case**: Identify high-probability retracement zones. Price often returns to fill FVGs and VIs before continuing the trend. Use as entry zones or profit targets.
🎨 Customization
OFA is built for flexibility. Every feature includes extensive customization options:
Visual Customization
- **Colors**: Independent color control for every element (sessions, kill zones, lines, labels, FVGs, VIs)
- **Transparency**: Adjust box and label transparency (0-100%) for clean charts
- **Line Styles**: Choose Solid, Dashed, or Dotted for previous period lines
- **Sizes**: Control text size, line width, and box borders
- **Positions**: Place watermark in 9 positions, labels left/right
Layout Control
- **HTF Display Mode**: "Below Chart" for detailed analysis, "Right Side" for space efficiency
- **Drawing Limits**: Set max days for sessions/kill zones to manage chart clutter
- **Lookback Periods**: Control how many previous periods to display (1-10)
- **Gradient Effects**: Enable fading for older previous period lines
Timing Adjustments
- **Timezone**: Universal GMT offset selector (-12 to +14) for global markets
- **Session Times**: Customize each session's start/end times
- **Kill Zone Times**: Adjust kill zone windows to match your market's characteristics
- **Daily Open**: Choose Midnight, 8:30, or 9:30 for Daily HTF candle open time
💡 Best Practices
1. Start Simple: Enable one feature at a time to learn how each element affects your analysis
2. Match Your Timeframe: Use Daily levels on intraday charts, Weekly on daily charts, HTF candles one or two levels above your trading timeframe
3. Kill Zone Focus: Concentrate your trading activity during kill zones for higher probability setups
4. HTF Confirmation: Wait for HTF candle closes before committing to directional bias
5. FVG/VI Entries: Look for price to return to unfilled FVGs/VIs for entry opportunities with favorable risk/reward
6. Customize Colors: Use a consistent color scheme that matches your chart theme and reduces visual fatigue
7. Reduce Clutter: Disable features you're not actively using in your current trading plan
8. Session Context: Understand which session controls the market—trade with session direction or anticipate reversals at session transitions
⚙️ Settings Guide
OFA organizes settings into logical groups for easy navigation:
- **═══ WATERMARK ═══**: Title, subtitles, position, style, symbol/timeframe display
- **═══ SESSIONS ═══**: Enable/disable sessions, times, colors, high/low lines, boxes, markers
- **═══ KILL ZONES ═══**: Individual kill zone toggles, times, colors, max days display
- **═══ PREVIOUS H/L - DAILY ═══**: Daily high/low lines, style, color, lookback, labels
- **═══ PREVIOUS H/L - WEEKLY ═══**: Weekly high/low lines, style, color, lookback, labels
- **═══ PREVIOUS H/L - MONTHLY ═══**: Monthly high/low lines, style, color, lookback, labels
- **═══ HTF CANDLES ═══**: Global display mode, layout settings
- **═══ HTF SLOT 1-5 ═══**: Individual HTF configuration (timeframe, colors, title, FVG/VI detection, trace lines, timer, interval labels)
Each setting includes tooltips explaining its function. Hover over any input for detailed guidance.
📝 Final Notes
One for All (OFA) represents a complete ICT analysis toolkit in a single indicator. By combining watermark customization, session visualization, kill zone highlighting, previous period levels, and higher timeframe candles with FVG/VI detection, OFA eliminates the need for multiple indicators cluttering your chart.
**Version**: 3.3.0
**Author**: theCodeman
**Pine Script**: v6
**License**: Mozilla Public License 2.0
Start with default settings to learn the indicator's structure, then customize extensively to match your personal trading style. Remember: tools provide information, but your edge comes from disciplined execution of a proven strategy.
Happy Trading! 📈

The Oracle: Dip & Top Adaptive Sniper [Hakan Yorganci]█ OVERVIEW
The Oracle: Dip & Top Adaptive Sniper is a precision-focused trend trading strategy designed to solve the biggest problem in swing trading: Timing.
Most trend-following strategies chase price ("FOMO"), buying when the asset is already overextended. The Oracle takes a different approach. It adopts a "Sniper" mentality: it identifies a strong macro trend but patiently waits for a Mean Reversion (pullback) to execute an entry at a discounted price.
By combining the structural strength of Moving Averages (SMA 50/200) with the momentum precision of RSI and the volatility filtering of ADX, this script filters out noise and targets high-probability setups.
█ HOW IT WORKS
This strategy operates on a strictly algorithmic protocol known as "The Yorganci Protocol," which involves three distinct phases: Filter, Target, and Execute.
1. The Macro Filter (Trend Identification)
* SMA 200 Rule: By default, the strategy only scans for buy signals when the price is trading above the 200-period Simple Moving Average. This ensures we are always trading in the direction of the long-term bull market.
* Adaptive Switch: A new feature allows users to toggle the Only Buy Above SMA 200? filter OFF. This enables the strategy to hunt for oversold bounces (dead cat bounces) even during bearish or neutral market structures.
2. The Volatility Filter (ADX Integration)
* Sideways Protection: One of the main weaknesses of moving average strategies is "whipsaw" losses during choppy, ranging markets.
* Solution: The Oracle utilizes the ADX (Average Directional Index). It will BLOCK any trade entry if the ADX is below the threshold (Default: 20). This ensures capital is only deployed when a genuine trend is present.
3. The Sniper Entry (Buying the Dip)
* Instead of buying on breakout strength (e.g., RSI > 60), The Oracle waits for the RSI Moving Average to dip into the "Value Zone" (Default: 45) and cross back up. This technique allows for tighter stops and higher Risk/Reward ratios compared to traditional breakout systems.
█ EXIT STRATEGY
The Oracle employs a dynamic dual-exit mechanism to maximize gains and protect capital:
* Take Profit (The Peak): The strategy monitors RSI heat. When the RSI Moving Average breaches the Overbought Threshold (Default: 75), it signals a "Take Profit", securing gains near the local top before a potential reversal.
* Stop Loss (Trend Invalidated): If the market structure fails and the price closes below the 50-period SMA, the position is immediately closed to prevent deep drawdowns.
█ SETTINGS & CONFIGURATION
* Moving Averages: Fully customizable lengths for Support (SMA 50) and Trend (SMA 200).
* Trend Filter: Checkbox to enable/disable the "Bull Market Only" rule.
* RSI Thresholds:
* Sniper Buy Level: Adjustable (Default: 45). Lower values = Deeper dips, fewer trades.
* Peak Sell Level: Adjustable (Default: 75). Higher values = Longer holds, potentially higher profit.
* ADX Filter: Checkbox to enable/disable volatility filtering.
█ BEST PRACTICES
* Timeframe: Designed primarily for 4H (4-Hour) charts for swing trading. It can also be used on 1H for more frequent signals.
* Assets: Highly effective on trending assets such as Bitcoin (BTC), Ethereum (ETH), and high-volume Altcoins.
* Risk Warning: This strategy is designed for "Long Only" spot or leverage trading. Always use proper risk management.
█ CREDITS
* Original Concept: Inspired by the foundational work of Murat Besiroglu (@muratkbesiroglu).
* Algorithm Development & Enhancements: Developed by Hakan Yorganci (@hknyrgnc).
* Modifications include: Integration of ADX filters, Mean Reversion entry logic (RSI Dip), and Dynamic Peak Profit taking.

Super-AO with Risk Management Strategy Template - 11-29-25Super-AO Strategy with Advanced Risk Management Template
Signal Lynx | Free Scripts supporting Automation for the Night-Shift Nation 🌙
1. Overview
Welcome to the Super-AO Strategy. This is more than just a buy/sell indicator; it is a complete, open-source Risk Management (RM) Template designed for the Pine Script community.
At its core, this script implements a robust swing-trading strategy combining the SuperTrend (for macro direction) and the Awesome Oscillator (for momentum). However, the real power lies under the hood: a custom-built Risk Management Engine that handles trade states, prevents repainting, and manages complex exit conditions like Staged Take Profits and Advanced Adaptive Trailing Stops (AATS).
We are releasing this code to help traders transition from simple indicators to professional-grade strategy structures.
2. Quick Action Guide (TL;DR)
Best Timeframe: 4 Hours (H4) and above. Designed for Swing Trading.
Best Assets: "Well-behaved" assets with clear liquidity (Major Forex pairs, BTC, ETH, Indices).
Strategy Type: Trend Following + Momentum Confirmation.
Key Feature: The Risk Management Engine is modular. You can strip out the "Super-AO" logic and insert your own strategy logic into the template easily.
Repainting: Strictly Non-Repainting. The engine calculates logic based on confirmed candle closes.
3. Detailed Report: How It Works
A. The Strategy Logic: Super-AO
The entry logic is based on the convergence of two classic indicators:
SuperTrend: Determines the overall trend bias (Green/Red).
Awesome Oscillator (AO): Measures market momentum.
The Signal:
LONG (+2): SuperTrend is Green AND AO is above the Zero Line AND AO is Rising.
SHORT (-2): SuperTrend is Red AND AO is below the Zero Line AND AO is Falling.
By requiring momentum to agree with the trend, this system filters out many false signals found in ranging markets.
B. The Risk Management (RM) Engine
This script features a proprietary State Machine designed by Signal Lynx. Unlike standard strategies that simply fire orders, this engine separates the Signal from the Execution.
Logic Injection: The engine listens for a specific integer signal: +2 (Buy) or -2 (Sell). This makes the code a Template. You can delete the Super-AO section, write your own logic, and simply pass a +2 or -2 to the RM_EngineInput variable. The engine handles the rest.
Trade States: The engine tracks the state of the trade (Entry, In-Trade, Exiting) to prevent signal spamming.
Aggressive vs. Conservative:
Conservative Mode: Waits for a full trend reversal before taking a new trade.
Aggressive Mode: Allows for re-entries if the trend is strong and valid conditions present themselves again (Pyramiding Type 1).
C. Advanced Exit Protocols
The strategy does not rely on a single exit point. It employs a "Layered Defense" approach:
Hard Stop Loss: A fixed percentage safety net.
Staged Take Profits (Scaling Out): The script allows you to set 3 distinct Take Profit levels. For example, you can close 10% of your position at TP1, 10% at TP2, and let the remaining 80% ride the trend.
Trailing Stop: A standard percentage-based trailer.
Advanced Adaptive Trailing Stop (AATS): This is a highly sophisticated volatility stop. It calculates market structure using Hirashima Sugita (HSRS) levels and Bollinger Bands to determine the "floor" and "ceiling" of price action.
If volatility is high: The stop loosens to prevent wicking out.
If volatility is low: The stop tightens to protect profit.
D. Repainting Protection
Many Pine Script strategies look great in backtesting but fail in live trading because they rely on "real-time" price data that disappears when the candle closes.
This Risk Management engine explicitly pulls data from the previous candle close (close , high , low ) for its calculations. This ensures that the backtest results you see match the reality of live execution.
4. For Developers & Modders
We encourage you to tear this code apart!
Look for the section titled // Super-AO Strategy Logic.
Replace that block with your own RSI, MACD, or Price Action logic.
Ensure your logic outputs a 2 for Buy and -2 for Sell.
Connect it to RM_EngineInput.
You now have a fully functioning Risk Management system for your custom strategy.
5. About Signal Lynx
Automation for the Night-Shift Nation 🌙
This code has been in action since 2022 and is a known performer in PineScript v5. We provide this open source to help the community build better, safer automated systems.
If you are looking to automate your strategies, please take a look at Signal Lynx in your search.
License: Mozilla Public License 2.0 (Open Source). If you make beneficial modifications, please release them back to the community!

Double MOST with Pivot and EMAMOST Long Strategy with Multi-Filter Confirmation (Pivot + VAR Trend Filter)
This strategy combines a custom MOST stop-line structure with a moving average trend filter (EMA / VAR / ZLMA), daily pivot levels, and a 9-period VAR filter to generate clean long-only entries.
It aims to capture early trend continuations while avoiding reversals and false breakouts.
✔ Buy Conditions
A long position is opened only if all of the conditions below occur simultaneously:
MA (ort) > MOST Line (s2)
– Confirms that momentum is on the long side.
Price > Daily Pivot (pvt_gun)
– Ensures the market is trading above the day’s fair-value level.
Price > VAR(9)
– Short-term VAR filter to confirm trend strength and reduce noise.
Only the first bar where all conditions turn true generates a position.
✔ Sell Condition
A long position is closed when:
MOST Line (s2) crosses above MA (ort)
– Indicates a momentum shift against the long position.
✔ Execution Style (MetaStock-like)
Strategy operates long-only
Orders are filled on the next bar open, not on the signal bar
Commission: 0.03% (3 bps / on-binde 3)
Position size: 100% of equity per trade
This makes the behavior comparable to classical MetaStock backtesting logic.
✔ Chart Markers
Only actual trade entries and exits are drawn
No repeated signals or overlapping markers
Clean visual trade history
Purpose
This strategy is ideal for traders who want:
A structured long-only trend model
A multi-layer confirmation filter
Clean execution without repaint
High-quality entries above market structure levels

LETHINH-Swing pa,smc🟦 📌 Title (English)
Swing High / Swing Low – 3-Candle Fractal (5-Bar Pivot) | Auto Alerts
⸻
🟩 📌 Short Description
A clean and reliable swing high / swing low detector based on the classic 3-candle (5-bar) fractal pivot. Automatically marks SH/SL and triggers alerts when a swing is confirmed. No repainting after confirmation.
⸻
🟧 📌 Full Description (for TradingView Publishing)
🔶 Swing High / Swing Low – 3-Candle Fractal (5-Bar Pivot)
This indicator identifies Swing Highs (SH) and Swing Lows (SL) using the classic 3-candle fractal pattern, also known as the 5-bar pivot.
It marks swing points only after full confirmation, making it highly reliable and suitable for structure-based trading.
⸻
🔶 📍 How It Works
A swing is confirmed when the center candle is higher (or lower) than the two candles on each side:
Swing High (SH)
high > high , high , high
Swing Low (SL)
low < low , low , low
The confirmation occurs after 2 right candles close, so the indicator does not repaint once a swing is identified.
⸻
🔶 📍 Key Features
• Detects clean and accurate swings
• Uses pure price action — no indicators, no lag
• Marks swing high (SH) and swing low (SL) directly on the chart
• Non-repainting after confirmation
• Works on all timeframes and all markets
• Extremely lightweight and fast
• Includes alert conditions for both SH and SL
Perfect for traders using:
• Market Structure (BOS / CHoCH)
• Order Blocks (OB)
• Smart Money Concepts (SMC)
• Liquidity hunts
• Wyckoff
• Support/Resistance
• Price Action entries
⸻
🔶 📍 Why This Indicator Is Useful
Swing points are the foundation of market structure.
Accurately detecting them helps traders:
• Identify trend shifts
• Spot BOS / CHoCH correctly
• Find key zones (OB, liquidity levels, supply/demand)
• Time entries more precisely
• Avoid fake structure breaks
This indicator ensures swings are plotted only when fully confirmed, reducing noise and confusion.
⸻
🔶 📍 Alerts
You can create alerts for both conditions:
• Swing High Confirmed
• Swing Low Confirmed
Recommended settings:
• Once per bar close
• Open-ended alert
With alerts enabled, TradingView will automatically notify you every time a new swing forms.
⸻
🔶 📍 No Repainting
Once a swing is confirmed and plotted, it will not change or disappear.
This makes the indicator reliable for real-time alerts and backtesting.
⸻
🔶 📍 Pine Script (v5)
Paste your indicator code here if you want it visible.
Or leave the code hidden if you are publishing as protected.
⸻
🔶 📍 Final Notes
• This indicator focuses on confirmation, not prediction
• It is designed for clean structure reading
• All markets supported: Forex, Crypto, Stocks, Indexes, Commodities
• Suitable for scalping, intraday, swing, and even higher-timeframe trading
If you find this tool helpful, feel free to give it a like and add it to your favorites ❤️
Your support helps me share more tools with the community!

Hardwaybets' Protected Highs / Protected Lows TradingProtected Highs & Lows – Multi-Condition Structural Marker
This indicator identifies specific candle formations where price breaks a previous candle’s high or low, fails to maintain that break, and confirms the rejection with an additional condition involving prior candles. These marked locations offer a visual reference for areas where price attempted directional expansion but did not sustain it. All levels remain visible until later invalidated by price movement.
Protected High – Detection Logic
A Protected High is marked only when all three of the following conditions occur:
1. Break of Previous High
The current candle trades above the prior candle’s high.
2. Close Back Inside Range
The current candle closes within the high-to-low range of the previous candle, indicating the upward expansion was not sustained.
3. Reversal Through Prior Bullish Structure
After forming the high, price closes below the opening price of one or more bullish candles that were part of the upward movement into that high.
This reflects a shift away from the prior upward structure.
When all three conditions are met, the high of the candle that created the event is marked on the chart.
Protected Low – Detection Logic
A Protected Low is marked only when all three of the following conditions occur:
1. Break of Previous Low
The current candle trades below the prior candle’s low.
2. Close Back Inside Range
The current candle closes within the high-to-low range of the previous candle, indicating the downward expansion was not sustained.
3. Reversal Through Prior Bearish Structure
After forming the low, price closes above the opening price of one or more bearish candles that were part of the downward movement into that low.
This reflects a shift away from the prior downward structure.
When all three conditions are met, the low of the candle that created the event is marked on the chart.
Level Management
* Marked highs and lows remain active as long as price does not trade beyond them.
* If price moves past a marked level, that level is removed.
* Only active, unviolated structural reference points remain displayed.
Market Structure Context (Strictly Non-Signaling)
Protected highs and lows can help traders observe areas where:
* Price briefly exceeded a previous high or low
* That expansion was not maintained
* Price then moved back through recent candles associated with the prior direction
These observations can be used by traders to understand how price interacts with nearby structural reference points.
The indicator itself does not provide trade entries, exits, or directional guidance.
Customization Options
The indicator provides adjustable settings for:
* Marker style (labels or shapes)
* Shape type (circle, square, diamond, etc.)
* Colors for highs and lows
* Vertical spacing between markers and candles
These options help maintain clarity on different chart types and timeframes.
Intended Use
The indicator does not generate forecasts or trading signals.
Its purpose is to visually highlight multi-condition candle formations where price briefly exceeded a prior high or low, failed to sustain that expansion, and later reversed through nearby structural points.
Compatibility
Suitable for all assets and timeframes.
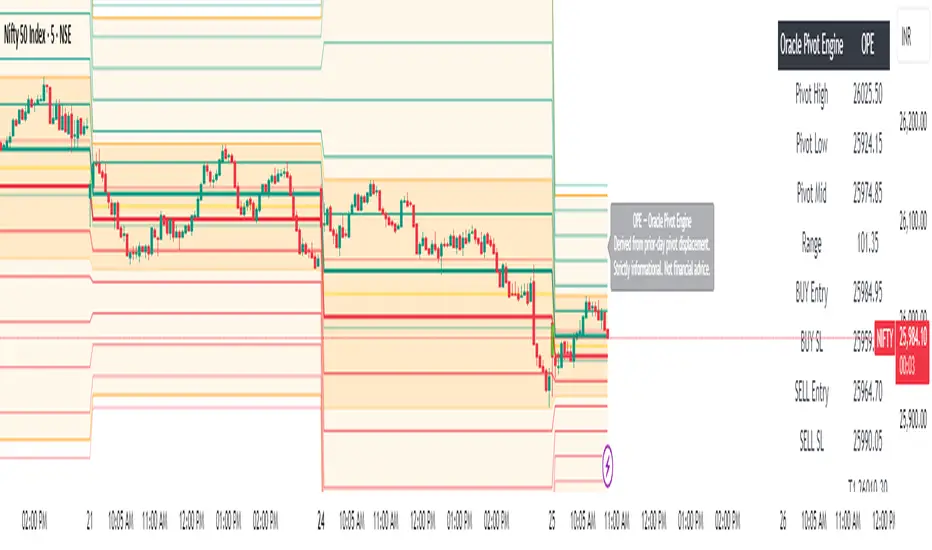
Oracle Pivot Engine (OPE) — @darshaksscThe Oracle Pivot Engine (OPE) is a market-structure visualization tool that derives all its levels exclusively from historical price data — specifically, the previous day’s high, low, and mid-range.
It does not provide signals, alerts, entries, exits, predictions, or trade recommendations.
Instead, it creates a non-repainting reference framework that helps users observe how the current session interacts with the prior session’s completed price structure.
All calculations are analytical, static, and based on fully closed candles.
🧠 How It Works (Core Logic Explained)
OPE computes the following values from the completed prior daily candle:
Prior-Day High
Prior-Day Low
Prior-Day Midpoint
Displacement Range = High − Low
This displacement range is used to generate symmetrical upward and downward reference zones.
These levels do not update during the session.
They refresh only once per day when a new daily candle closes.
This ensures the indicator remains fully non-repainting and stable on every intraday chart.
📐 Reference Levels Generated
Using the fixed prior-day displacement range, OPE plots:
1. BUY-Side Reference Map (Upward Bias)
BUY Reference Entry
BUY Reference Stop
BUY T1
BUY T2
BUY T3
BUY T4
BUY T5
BUY T6
These are not trade signals — they are mathematical extensions above the prior-day midpoint for structural interpretation only.
2. SELL-Side Reference Map (Downward Bias)
SELL Reference Entry
SELL Reference Stop
SELL T1
SELL T2
SELL T3
SELL T4
SELL T5
SELL T6
Again, these levels are not directives.
They are mirrored displacement extensions below the prior-day midpoint.
📊 Pivot Zone & Bands
The indicator includes optional visual layers derived from the same prior-day pivots:
Pivot High–Low Zone Shading → shows the prior-day full range
Pivot Midline → prior-day mid-price
Outer Displacement Bands → extended contextual boundaries
These are purely visual boundaries meant to improve market context.
🧾 Dashboard / HUD Explanation
A compact on-chart HUD summarizes all values.
It displays:
Section | Information (All Historical)
Prior-Day Pivots | High, Low, Mid, Range
BUY Map | Entry, Stop, T1–T6
SELL Map | Entry, Stop, T1–T6
The HUD allows you to quickly review:
Where the current price is relative to the previous day’s structure
How far price is from each level
Whether the session is operating inside or outside the prior-day displacement zones
Everything shown is static, non-repainting , and for reference only .
📊 How to Analyze It
✔ 1. Contextual Awareness
OPE helps users visually compare current intraday price to prior daily structure.
You can observe whether price is:
Inside yesterday’s high/low zone
Above the prior-day displacement
Below the prior-day displacement
This offers a clearer understanding of daily context and volatility.
✔ 2. Structural Symmetry
The BUY-side and SELL-side maps extend from the same pivot logic.
This can help visualize:
Expansion away from the prior-day midpoint
Compression within the prior-day range
Symmetrical displacement around key reference levels
Again — these are observational insights , not signals.
✔ 3. Range Interaction
As the session unfolds, users often study:
How price reacts around prior-day midpoint
Whether price is gravitating toward or away from the displacement levels
How intraday swings behave within these historical boundaries
This type of analysis is contextual , not predictive.
⚠️ Important Disclosures
This script does NOT generate trading signals.
It does NOT predict future price movement.
It does NOT contain advice, instructions, recommendations, or strategies.
All levels are derived exclusively from historical daily candle data .
This is strictly an informational visualization tool meant to support chart analysis.
Past price levels do not guarantee any future price behavior.
🛑 Disclaimer
This indicator is provided solely for educational and informational purposes.
It should not be interpreted as financial advice or a call to action of any kind.
Users should apply independent judgment and discretion when analyzing markets.
Day-Type Detector — Rejection / FNL / Outside / StopRun (Clean)Day-Type Detector — Rejection / FNL / Outside / Stop-Run (Clean Version)
This indicator identifies four high-impact candlestick day-types commonly used in professional price-action and auction-market trading: Rejection Days, Failed New Low (FNL) Days, Outside Days, and Stop-Run Days. These patterns often precede major directional moves, reversals, and absorption events, making them particularly valuable for swing traders, positional traders, and short-term discretionary traders.
The script is designed to work across all timeframes and is built around volatility-adjusted measurements using Average Daily Range (ADR) for accuracy and consistency.
What This Indicator Detects
1. Rejection Day (Bullish & Bearish)
A Rejection Day is a wide-range bar that rejects a previous extreme.
The indicator identifies rejection based on:
Range > ADR × threshold
Long lower wick (for bullish) or long upper wick (for bearish)
Close located in the strong zone of the day’s range
These conditions highlight areas where aggressive counter-orderflow entered the market.
2. Failed New Low (FNL) / Failed New High
An FNL day traps traders who attempted breakout selling or buying.
The indicator checks for:
A break beyond the previous session’s low or high
Immediate rejection back inside
Midpoint recapture conditions
ADR-normalized range requirements
These days often trigger powerful directional reversals.
3. Outside Day (Bullish & Bearish)
An Outside Day is a statistically significant expansion day that breaks both the previous high and low.
The script validates:
High > previous high and low < previous low
Range > ADR threshold
Close beyond prior session extreme to complete the rejection sequence
Outside Days often represent stop runs, shakeouts, or trend accelerations.
4. Stop-Run Day (Bullish & Bearish)
Stop-Run Days are aggressive volatility expansions and tend to be the largest ranges within short windows.
This detector identifies them using:
Range > ADR × multiplier
Close located near the extreme of the day (top for bullish, bottom for bearish)
Strong body relative to total range
Break above/below previous session extreme
These patterns indicate capitulation or forced liquidation and are often followed by continuation or sharp counter-rotation.
Key Features
✔ Historical Pattern Marking
All qualifying bars are marked on the chart using plotshape() in global scope, ensuring full historical visibility.
✔ Event Logging & Table Display
A table (top-right of the chart) displays the most recent pattern detections, including:
Timestamp
Pattern type
Bar index
This allows users to monitor and study past pattern occurrences without scanning the chart manually.
✔ ADR-Adjusted Detection
Volatility uncertainty is removed by anchoring all thresholds to ADR.
This ensures consistency across:
Different symbols
Different timeframes
Different market regimes
✔ Alerts Included
Alerts are preconfigured for:
Rejection Day Bull / Bear
FNL Bull / Bear
Outside Day Bull / Bear
Stop-Run Bull / Bear
This allows the user to receive real-time notifications when major day-type structures develop.
How to Use
Add the indicator to any timeframe chart.
Enable or disable:
Historical markers
History table
ADR diagnostics
Watch for shape markers or use alerts for real-time signals.
Use the history table to review recent occurrences.
Combine these day-types with:
Market structure levels
High/low volume nodes (LVNs)
Support/resistance zones
Trend context
These day-types are most effective when they occur near meaningful structural levels because they show where strong order-flow entered the market.
Best Practices
Use higher timeframes (1H–1D) for swing entries.
Confirm signals with market structure or volume profile.
Treat these day-types as context, not standalone signals.
Observe follow-through behavior in the next 1–3 bars after detection.
Credits
This script is based on concepts commonly seen in auction-market theory and professional price-action frameworks, such as Rejection Days, Failed New Lows, Outside Days, and Stop-Run behaviors.
All calculations and logic have been rebuilt from scratch to ensure clean, reliable, and optimized Pine Script v6 execution.

Forever ModelForever Model is a comprehensive trading framework that visualizes market structure through Fair Value Gaps (FVGs), Smart Money Technique (SMT) divergences, and order block confirmations. The indicator identifies potential price rotations by tracking internal liquidity zones, correlation breaks between assets, and confirmation signals across multiple timeframes.
Designed for clarity and repeatability, the model presents a structured visual logic that supports manual analysis while maintaining flexibility across different assets and timeframes. All components are non-repainting, ensuring historical accuracy and reliable backtesting.
Description
The model operates through a three-part sequence that forms the visual foundation for identifying potential market rotations:
Fair Value Gaps (FVGs)
FVGs are price imbalances detected on higher timeframes—areas where price moved rapidly between candles, leaving an inefficiency that may be revisited. The indicator identifies both bullish and bearish FVGs, displaying them with color-coded levels that extend until mitigated.
: Chart showing FVG detection with colored lines indicating bullish (green) and bearish (red) gaps
Smart Money Technique (SMT)
SMT detects divergence between the current chart asset and a correlated pair. When one asset makes a higher high while the other forms a lower high (or vice versa), it indicates a potential shift in delivery. The indicator draws visual lines connecting these divergence points and can filter SMTs to only display those occurring within FVG ranges.
: Chart showing SMT divergence lines between two correlated assets with labels indicating the pair name]
Order Block Confirmations (OB)
When price confirms a signal by crossing a pivot level, an Order Block is created. The confirmation line extends from the pivot point, labeled as "OB+" for bullish signals or "OB-" for bearish signals. The latest OB extends to the current bar, while previous OBs remain fixed at their confirmation points.
: Chart showing OB confirmation lines with OB+ and OB- labels at confirmation points]
Key Features
Higher Timeframe (HTF) Detection
FVGs are detected on a higher timeframe than the current chart, with automatic HTF selection based on the current timeframe or manual override options. This ensures that internal liquidity zones are identified from the appropriate structural context.
External Range Liquidity (ERL)
Tracks the latest higher timeframe pivot highs and lows, marking external liquidity levels that may be revisited. ERL levels are displayed as horizontal lines with optional labels, providing context for potential continuation targets.
: Chart showing ERL lines at recent HTF pivot points
Signal Creation and Confirmation System
The model creates pending signals when FVG levels are mitigated. Signals confirm when price closes beyond a pivot level, creating the OB confirmation line. Stop levels are automatically calculated from the maximum (bearish) or minimum (bullish) price between signal creation and confirmation.
SMT Filtering Options
Display all SMTs or only those within FVG ranges
Require SMT for signal confirmation (optional filter)
Automatic or manual SMT pair selection
Support for both correlated and inverse correlated pairs
Directional Bias Filter
Filter FVG detection to show only bullish bias, bearish bias, or both. This allows analysts to align with higher timeframe structure or focus on unidirectional setups.
Confirmation Line Management
Toggle to extend only the latest confirmation line or all confirmation lines
Transparent label backgrounds with colored text (red for bearish, green for bullish)
Automatic cleanup of old confirmation lines (keeps last 50)
Labels positioned at line end (latest) or middle (older lines)
Position Sizing Calculator
Optional position sizing based on account balance, risk percentage or fixed amount, and instrument-specific contract sizes. Supports prop firm calculations and can display position size, entry, and stop levels in the dashboard.
Information Dashboard
A customizable floating table displays:
Current timeframe and HTF
Remaining time in current bar
Current bias direction
Latest confirmed signal details (type, size, entry, stop)
Pending signal status
The dashboard can be repositioned, resized, and styled to match your preferences.
Special Range Creation
When signals confirm, the model can automatically create special range levels from stop prices. These levels persist on the chart as important reference points, even after mitigation, serving as potential reversal zones for future signals.
Label and Visualization Controls
Toggle FVG labels on/off
Toggle confirmation lines on/off
Customizable colors for bullish and bearish FVGs
ERL color customization
SMT line width adjustment
Order Flow Integration (Optional)
The indicator includes optional Open Interest (OI) based special range detection, allowing integration with order flow analysis for enhanced context.
Technical Notes
All components are non-repainting—once formed, they remain on the chart
FVGs cannot be mitigated on their creation bar
Signal-based special ranges persist even after mitigation (important stop levels)
SMT detection supports both HTF and chart timeframe modes
Maximum 50 confirmation lines are maintained for performance
The model is designed to work across all asset classes and timeframes, providing a consistent framework for identifying potential market rotations through the interaction of internal liquidity, correlation breaks, and confirmation signals, this does not constitute as trading advice, past performance is no indication of future performance , this is entirely done for entertainment and educational purposes

ZigZagZigZag Indicator – Overview
This ZigZag indicator highlights the most important swing highs and swing lows on the chart, helping traders see market structure more clearly by filtering out minor price movements. It connects significant turning points with straight lines, creating a clean visual representation of trend direction and major reversals.
How It Works
Price constantly moves up and down, but not every movement is meaningful. The ZigZag indicator waits for price to make a move large enough to be considered a true swing point. Once such a movement occurs, the indicator identifies it as either a swing high or a swing low and draws a line connecting it to the previous swing.
This produces a simplified outline of market structure, making it easier to recognize trends, corrections, and major turning points.
Settings
ZigZag Length
Controls the sensitivity of the indicator.
Lower values produce more frequent swing points.
Higher values show only major swings and reduce noise.
Show ZigZag
Enables or disables the visual lines. When disabled, the indicator continues tracking swing points internally.
What You See on the Chart
Every time the market creates a confirmed swing high or swing low, the indicator draws a line to the previous swing in the opposite direction.
After a major low is confirmed, a line is drawn to the most recent high.
After a major high is confirmed, a line is drawn to the most recent low.
This creates a clear, continuous zigzag that outlines the dominant movements of the market without reacting to every small fluctuation.
Why This ZigZag Is Useful
It does not repaint once a swing is confirmed.
It provides a clean and simplified view of price structure.
It helps identify trend direction, structure breaks, impulses, and corrections.
It is useful for traders who follow price action, smart money concepts, and swing-based strategies.
Recommended Use Cases
This ZigZag indicator is suited for traders who rely on market structure analysis, including:
Swing trading
Smart Money Concepts (BOS/CHOCH detection)
Identifying impulses and pullbacks
Finding strong highs and lows
Studying overall trend direction

Range Oscillator Strategy + Stoch Confirm🔹 Short summary
This is a free, educational long-only strategy built on top of the public “Range Oscillator” by Zeiierman (used under CC BY-NC-SA 4.0), combined with a Stochastic timing filter, an EMA-based exit filter and an optional risk-management layer (SL/TP and R-multiple exits). It is NOT financial advice and it is NOT a magic money machine. It’s a structured framework to study how range-expansion + momentum + trend slope can be combined into one rule-based system, often with intentionally RARE trades.
────────────────────────
0. Legal / risk disclaimer
────────────────────────
• This script is FREE and public. I do not charge any fee for it.
• It is for EDUCATIONAL PURPOSES ONLY.
• It is NOT financial advice and does NOT guarantee profits.
• Backtest results can be very different from live results.
• Markets change over time; past performance is NOT indicative of future performance.
• You are fully responsible for your own trades and risk.
Please DO NOT use this script with money you cannot afford to lose. Always start in a demo / paper trading environment and make sure you understand what the logic does before you risk any capital.
────────────────────────
1. About default settings and risk (very important)
────────────────────────
The script is configured with the following defaults in the `strategy()` declaration:
• `initial_capital = 10000`
→ This is only an EXAMPLE account size.
• `default_qty_type = strategy.percent_of_equity`
• `default_qty_value = 100`
→ This means 100% of equity per trade in the default properties.
→ This is AGGRESSIVE and should be treated as a STRESS TEST of the logic, not as a realistic way to trade.
TradingView’s House Rules recommend risking only a small part of equity per trade (often 1–2%, max 5–10% in most cases). To align with these recommendations and to get more realistic backtest results, I STRONGLY RECOMMEND you to:
1. Open **Strategy Settings → Properties**.
2. Set:
• Order size: **Percent of equity**
• Order size (percent): e.g. **1–2%** per trade
3. Make sure **commission** and **slippage** match your own broker conditions.
• By default this script uses `commission_value = 0.1` (0.1%) and `slippage = 3`, which are reasonable example values for many crypto markets.
If you choose to run the strategy with 100% of equity per trade, please treat it ONLY as a stress-test of the logic. It is NOT a sustainable risk model for live trading.
────────────────────────
2. What this strategy tries to do (conceptual overview)
────────────────────────
This is a LONG-ONLY strategy designed to explore the combination of:
1. **Range Oscillator (Zeiierman-based)**
- Measures how far price has moved away from an adaptive mean.
- Uses an ATR-based range to normalize deviation.
- High positive oscillator values indicate strong price expansion away from the mean in a bullish direction.
2. **Stochastic as a timing filter**
- A classic Stochastic (%K and %D) is used.
- The logic requires %K to be below a user-defined level and then crossing above %D.
- This is intended to catch moments when momentum turns up again, rather than chasing every extreme.
3. **EMA Exit Filter (trend slope)**
- An EMA with configurable length (default 70) is calculated.
- The slope of the EMA is monitored: when the slope turns negative while in a long position, and the filter is enabled, it triggers an exit condition.
- This acts as a trend-protection exit: if the medium-term trend starts to weaken, the strategy exits even if the oscillator has not yet fully reverted.
4. **Optional risk-management layer**
- Percentage-based Stop Loss and Take Profit (SL/TP).
- Risk/Reward (R-multiple) exit based on the distance from entry to SL.
- Implemented as OCO orders that work *on top* of the logical exits.
The goal is not to create a “holy grail” system but to serve as a transparent, configurable framework for studying how these concepts behave together on different markets and timeframes.
────────────────────────
3. Components and how they work together
────────────────────────
(1) Range Oscillator (based on “Range Oscillator (Zeiierman)”)
• The script computes a weighted mean price and then measures how far price deviates from that mean.
• Deviation is normalized by an ATR-based range and expressed as an oscillator.
• When the oscillator is above the **entry threshold** (default 100), it signals a strong move away from the mean in the bullish direction.
• When it later drops below the **exit threshold** (default 30), it can trigger an exit (if enabled).
(2) Stochastic confirmation
• Classic Stochastic (%K and %D) is calculated.
• An entry requires:
- %K to be below a user-defined “Cross Level”, and
- then %K to cross above %D.
• This is a momentum confirmation: the strategy tries to enter when momentum turns up from a pullback rather than at any random point.
(3) EMA Exit Filter
• The EMA length is configurable via `emaLength` (default 70).
• The script monitors the EMA slope: it computes the relative change between the current EMA and the previous EMA.
• If the slope turns negative while the strategy holds a long position and the filter is enabled, it triggers an exit condition.
• This is meant to help protect profits or cut losses when the medium-term trend starts to roll over, even if the oscillator conditions are not (yet) signalling exit.
(4) Risk management (optional)
• Stop Loss (SL) and Take Profit (TP):
- Defined as percentages relative to average entry price.
- Both are disabled by default, but you can enable them in the Inputs.
• Risk/Reward Exit:
- Uses the distance from entry to SL to project a profit target at a configurable R-multiple.
- Also optional and disabled by default.
These exits are implemented as `strategy.exit()` OCO orders and can close trades independently of oscillator/EMA conditions if hit first.
────────────────────────
4. Entry & Exit logic (high level)
────────────────────────
A) Time filter
• You can choose a **Start Year** in the Inputs.
• Only candles between the selected start date and 31 Dec 2069 are used for backtesting (`timeCondition`).
• This prevents accidental use of tiny cherry-picked windows and makes tests more honest.
B) Entry condition (long-only)
A long entry is allowed when ALL the following are true:
1. `timeCondition` is true (inside the backtest window).
2. If `useOscEntry` is true:
- Range Oscillator value must be above `entryLevel`.
3. If `useStochEntry` is true:
- Stochastic condition (`stochCondition`) must be true:
- %K < `crossLevel`, then %K crosses above %D.
If these filters agree, the strategy calls `strategy.entry("Long", strategy.long)`.
C) Exit condition (logical exits)
A position can be closed when:
1. `timeCondition` is true AND a long position is open, AND
2. At least one of the following is true:
- If `useOscExit` is true: Oscillator is below `exitLevel`.
- If `useMagicExit` (EMA Exit Filter) is true: EMA slope is negative (`isDown = true`).
In that case, `strategy.close("Long")` is called.
D) Risk-management exits
While a position is open:
• If SL or TP is enabled:
- `strategy.exit("Long Risk", ...)` places an OCO stop/limit order based on the SL/TP percentages.
• If Risk/Reward exit is enabled:
- `strategy.exit("RR Exit", ...)` places an OCO order using a projected R-multiple (`rrMult`) of the SL distance.
These risk-based exits can trigger before the logical oscillator/EMA exits if price hits those levels.
────────────────────────
5. Recommended backtest configuration (to avoid misleading results)
────────────────────────
To align with TradingView House Rules and avoid misleading backtests:
1. **Initial capital**
- 10 000 (or any value you personally want to work with).
2. **Order size**
- Type: **Percent of equity**
- Size: **1–2%** per trade is a reasonable starting point.
- Avoid risking more than 5–10% per trade if you want results that could be sustainable in practice.
3. **Commission & slippage**
- Commission: around 0.1% if that matches your broker.
- Slippage: a few ticks (e.g. 3) to account for real fills.
4. **Timeframe & markets**
- Volatile symbols (e.g. crypto like BTCUSDT, or major indices).
- Timeframes: 1H / 4H / **1D (Daily)** are typical starting points.
- I strongly recommend trying the strategy on **different timeframes**, for example 1D, to see how the behaviour changes between intraday and higher timeframes.
5. **No “caution warning”**
- Make sure your chosen symbol + timeframe + settings do not trigger TradingView’s caution messages.
- If you see warnings (e.g. “too few trades”), adjust timeframe/symbol or the backtest period.
────────────────────────
5a. About low trade count and rare signals
────────────────────────
This strategy is intentionally designed to trade RARELY:
• It is **long-only**.
• It uses strict filters (Range Oscillator threshold + Stochastic confirmation + optional EMA Exit Filter).
• On higher timeframes (especially **1D / Daily**) this can result in a **low total number of trades**, sometimes WELL BELOW 100 trades over the whole backtest.
TradingView’s House Rules mention 100+ trades as a guideline for more robust statistics. In this specific case:
• The **low trade count is a conscious design choice**, not an attempt to cherry-pick a tiny, ultra-profitable window.
• The goal is to study a **small number of high-conviction long entries** on higher timeframes, not to generate frequent intraday signals.
• Because of the low trade count, results should NOT be interpreted as statistically strong or “proven” – they are only one sample of how this logic would have behaved on past data.
Please keep this in mind when you look at the equity curve and performance metrics. A beautiful curve with only a handful of trades is still just a small sample.
────────────────────────
6. How to use this strategy (step-by-step)
────────────────────────
1. Add the script to your chart.
2. Open the **Inputs** tab:
- Set the backtest start year.
- Decide whether to use Oscillator-based entry/exit, Stochastic confirmation, and EMA Exit Filter.
- Optionally enable SL, TP, and Risk/Reward exits.
3. Open the **Properties** tab:
- Set a realistic account size if you want.
- Set order size to a realistic % of equity (e.g. 1–2%).
- Confirm that commission and slippage are realistic for your broker.
4. Run the backtest:
- Look at Net Profit, Max Drawdown, number of trades, and equity curve.
- Remember that a low trade count means the statistics are not very strong.
5. Experiment:
- Tweak thresholds (`entryLevel`, `exitLevel`), Stochastic settings, EMA length, and risk params.
- See how the metrics and trade frequency change.
6. Forward-test:
- Before using any idea in live trading, forward-test on a demo account and observe behaviour in real time.
────────────────────────
7. Originality and usefulness (why this is more than a mashup)
────────────────────────
This script is not intended to be a random visual mashup of indicators. It is designed as a coherent, testable strategy with clear roles for each component:
• Range Oscillator:
- Handles mean vs. range-expansion states via an adaptive, ATR-normalized metric.
• Stochastic:
- Acts as a timing filter to avoid entering purely on extremes and instead waits for momentum to turn.
• EMA Exit Filter:
- Trend-slope-based safety net to exit when the medium-term direction changes against the position.
• Risk module:
- Provides practical, rule-based exits: SL, TP, and R-multiple exit, which are useful for structuring risk even if you modify the core logic.
It aims to give traders a ready-made **framework to study and modify**, not a black box or “signals” product.
────────────────────────
8. Limitations and good practices
────────────────────────
• No single strategy works on all markets or in all regimes.
• This script is long-only; it does not short the market.
• Performance can degrade when market structure changes.
• Overfitting (curve fitting) is a real risk if you endlessly tweak parameters to maximise historical profit.
Good practices:
- Test on multiple symbols and timeframes.
- Focus on stability and drawdown, not only on how high the profit line goes.
- View this as a learning tool and a basis for your own research.
────────────────────────
9. Licensing and credits
────────────────────────
• Core oscillator idea & base code:
- “Range Oscillator (Zeiierman)”
- © Zeiierman, licensed under CC BY-NC-SA 4.0.
• Strategy logic, Stochastic confirmation, EMA Exit Filter, and risk-management layer:
- Modifications by jokiniemi.
Please respect both the original license and TradingView House Rules if you fork or republish any part of this script.
────────────────────────
10. No payments / no vendor pitch
────────────────────────
• This script is completely FREE to use on TradingView.
• There is no paid subscription, no external payment link, and no private signals group attached to it.
• If you have questions, please use TradingView’s comment system or private messages instead of expecting financial advice.
Use this script as a tool to learn, experiment, and build your own understanding of markets.
────────────────────────
11. Example backtest settings used in screenshots
────────────────────────
To avoid any confusion about how the results shown in screenshots were produced, here is one concrete example configuration:
• Symbol: BTCUSDT (or similar major BTC pair)
• Timeframe: 1D (Daily)
• Backtest period: from 2018 to the most recent data
• Initial capital: 10 000
• Order size type: Percent of equity
• Order size: 2% per trade
• Commission: 0.1%
• Slippage: 3 ticks
• Risk settings: Stop Loss and Take Profit disabled by default, Risk/Reward exit disabled by default
• Filters: Range Oscillator entry/exit enabled, Stochastic confirmation enabled, EMA Exit Filter enabled
If you change any of these settings (symbol, timeframe, risk per trade, commission, slippage, filters, etc.), your results will look different. Please always adapt the configuration to your own risk tolerance, market, and trading style.

Smarter Money Volume Rejection Blocks [PhenLabs]📊 Smarter Money Volume Rejection Blocks – Institutional Rejection Zone Detection
The Smarter Money Volume Rejection Blocks indicator combines high-volume analysis with statistical confidence intervals to identify where institutional traders are actively defending price levels through volume spikes and rejection patterns.
🔥 Core Methodology
Volume Spike Detection analyzes when current volume exceeds moving average by configurable multipliers (1.0-5.0x) to identify institutional activity
Rejection Candle Analysis uses dual-ratio system measuring wick percentage (30-90%) and maximum body ratio (10-60%) to confirm genuine rejections
Statistical Confidence Channels create three-level zones (upper, center, lower) based on ATR or Standard Deviation calculations
Smart Invalidation Logic automatically clears zones when price significantly breaches confidence levels to maintain relevance
Dynamic Channel Projection extends confidence intervals forward up to 200 bars with customizable length
Support Zone Identification detects bullish rejections where smart money absorbs selling pressure with high volume and strong lower wicks
Resistance Zone Mapping identifies bearish rejections where institutions defend price levels with volume spikes and pronounced upper wicks
Visual Information Dashboard displays real-time status table showing volume spike conditions and active support/resistance zones
⚙️ Technical Configuration
Dual Confidence Interval Methods: Choose between ATR-Based for trend-following environments or StdDev-Based for range-bound statistical precision
Volume Moving Average: Configurable period (default 20) for baseline volume comparison calculations
Volume Spike Multiplier: Adjustable threshold from 1.0 to 5.0 times average volume to filter institutional activity
Rejection Wick Percentage: Set minimum wick size from 30% to 90% of candle range for valid rejection detection
Maximum Body Ratio: Configure body-to-range ratio from 10% to 60% to ensure genuine rejection structures
Confidence Multiplier: Statistical multiplier (default 1.96) for 95% confidence interval calculations
Channel Projection Length: Extend confidence zones forward from 10 to 200 bars for anticipatory analysis
ATR Period: Customize Average True Range lookback from 5 to 50 bars for volatility-based calculations
StdDev Period: Adjust Standard Deviation period from 10 to 100 bars for statistical precision
🎯 Real-World Trading Applications
Identify high-probability support zones where institutional buyers have historically defended price with significant volume
Map resistance levels where smart money sellers consistently reject higher prices with volume confirmation
Combine with price action analysis to confirm breakout validity when price approaches confidence channel boundaries
Use invalidation signals to exit positions when smart money zones are definitively breached
Monitor the real-time dashboard to quickly assess current market structure and active rejection zones
Adapt strategy based on calculation method: ATR for trending markets, StdDev for ranging conditions
Set alerts on confidence level breaches to catch potential trend reversals or continuation patterns
📈 Visual Interpretation Guide
Green Zones indicate bullish rejection blocks where buyers defended with high volume and lower wicks
Red Zones indicate bearish rejection blocks where sellers defended with high volume and upper wicks
Solid Center Lines represent the core rejection price level where maximum volume activity occurred
Dashed Confidence Boundaries show upper and lower statistical limits based on volatility calculations
Zone Opacity decreases as channels extend forward to indicate decreasing confidence over time
Dashboard Color Coding provides instant visual feedback on active volume spike and zone conditions
⚠️ Important Considerations
Volume-based indicators identify historical rejection zones but cannot predict future price action with certainty
Market conditions change rapidly and institutional activity patterns evolve continuously
High volume does not guarantee level defense as market structure can shift without warning
Confidence intervals represent statistical probabilities, not guaranteed price boundaries

LibPvotLibrary "LibPvot"
This is a library for advanced technical analysis, specializing
in two core areas: the detection of price-oscillator
divergences and the analysis of market structure. It provides
a back-end engine for signal detection and a toolkit for
indicator plotting.
Key Features:
1. **Complete Divergence Suite (Class A, B, C):** The engine detects
all three major types of divergences, providing a full spectrum of
analytical signals:
- **Regular (A):** For potential trend reversals.
- **Hidden (B):** For potential trend continuations.
- **Exaggerated (C):** For identifying weakness at double tops/bottoms.
2. **Advanced Signal Filtering:** The detection logic uses a
percentage-based price tolerance (`prcTol`). This feature
enables the practical detection of Exaggerated divergences
(which rarely occur at the exact same price) and creates a
"dead zone" to filter insignificant noise from triggering
Regular divergences.
3. **Pivot Synchronization:** A bar tolerance (`barTol`) is used
to reliably match price and oscillator pivots that do not
align perfectly on the same bar, preventing missed signals.
4. **Signal Invalidation Logic:** Features two built-in invalidation
rules:
- An optional `invalidate` parameter automatically terminates
active divergences if the price or the oscillator breaks
the level of the confirming pivot.
- The engine also discards 'half-pivots' (e.g., a price pivot)
if a corresponding oscillator pivot does not appear within
the `barTol` window.
5. **Stateful Plotting Helpers:** Provides helper functions
(`bullDivPos` and `bearDivPos`) that abstract away the
state management issues of visualizing persistent signals.
They generate gap-free, accurately anchored data series
ready to be used in `plotshape` functions, simplifying
indicator-side code.
6. **Rich Data Output:** The core detection functions (`bullDiv`, `bearDiv`)
return a comprehensive 9-field data tuple. This includes the
boolean flags for each divergence type and the precise
coordinates (price, oscillator value, bar index) of both the
starting and the confirming pivots.
7. **Market Structure & Trend Analysis:** Includes a
`marketStructure` function to automatically identify pivot
highs/lows, classify their relationship (HH, LH, LL, HL),
detect structure breaks, and determine the current trend
state (Up, Down, Neutral) based on pivot sequences.
---
**DISCLAIMER**
This library is provided "AS IS" and for informational and
educational purposes only. It does not constitute financial,
investment, or trading advice.
The author assumes no liability for any errors, inaccuracies,
or omissions in the code. Using this library to build
trading indicators or strategies is entirely at your own risk.
As a developer using this library, you are solely responsible
for the rigorous testing, validation, and performance of any
scripts you create based on these functions. The author shall
not be held liable for any financial losses incurred directly
or indirectly from the use of this library or any scripts
derived from it.
bullDiv(priceSrc, oscSrc, leftLen, rightLen, depth, barTol, prcTol, persist, invalidate)
Detects bullish divergences (Regular, Hidden, Exaggerated) based on pivot lows.
Parameters:
priceSrc (float) : series float Price series to check for pivots (e.g., `low`).
oscSrc (float) : series float Oscillator series to check for pivots.
leftLen (int) : series int Number of bars to the left of a pivot (default 5).
rightLen (int) : series int Number of bars to the right of a pivot (default 5).
depth (int) : series int Maximum number of stored pivot pairs to check against (default 2).
barTol (int) : series int Maximum bar distance allowed between the price pivot and the oscillator pivot (default 3).
prcTol (float) : series float The percentage tolerance for comparing pivot prices. Used to detect Exaggerated
divergences and filter out market noise (default 0.05%).
persist (bool) : series bool If `true` (default), the divergence flag stays active for the entire duration of the signal.
If `false`, it returns a single-bar pulse on detection.
invalidate (bool) : series bool If `true` (default), terminates an active divergence if price or oscillator break
below the confirming pivot low.
Returns: A tuple containing comprehensive data for a detected bullish divergence.
regBull series bool `true` if a Regular bullish divergence (Class A) is active.
hidBull series bool `true` if a Hidden bullish divergence (Class B) is active.
exgBull series bool `true` if an Exaggerated bullish divergence (Class C) is active.
initPivotPrc series float Price value of the initial (older) pivot low.
initPivotOsz series float Oscillator value of the initial pivot low.
initPivotBar series int Bar index of the initial pivot low.
lastPivotPrc series float Price value of the last (confirming) pivot low.
lastPivotOsz series float Oscillator value of the last pivot low.
lastPivotBar series int Bar index of the last pivot low.
bearDiv(priceSrc, oscSrc, leftLen, rightLen, depth, barTol, prcTol, persist, invalidate)
Detects bearish divergences (Regular, Hidden, Exaggerated) based on pivot highs.
Parameters:
priceSrc (float) : series float Price series to check for pivots (e.g., `high`).
oscSrc (float) : series float Oscillator series to check for pivots.
leftLen (int) : series int Number of bars to the left of a pivot (default 5).
rightLen (int) : series int Number of bars to the right of a pivot (default 5).
depth (int) : series int Maximum number of stored pivot pairs to check against (default 2).
barTol (int) : series int Maximum bar distance allowed between the price pivot and the oscillator pivot (default 3).
prcTol (float) : series float The percentage tolerance for comparing pivot prices. Used to detect Exaggerated
divergences and filter out market noise (default 0.05%).
persist (bool) : series bool If `true` (default), the divergence flag stays active for the entire duration of the signal.
If `false`, it returns a single-bar pulse on detection.
invalidate (bool) : series bool If `true` (default), terminates an active divergence if price or oscillator break
above the confirming pivot high.
Returns: A tuple containing comprehensive data for a detected bearish divergence.
regBear series bool `true` if a Regular bearish divergence (Class A) is active.
hidBear series bool `true` if a Hidden bearish divergence (Class B) is active.
exgBear series bool `true` if an Exaggerated bearish divergence (Class C) is active.
initPivotPrc series float Price value of the initial (older) pivot high.
initPivotOsz series float Oscillator value of the initial pivot high.
initPivotBar series int Bar index of the initial pivot high.
lastPivotPrc series float Price value of the last (confirming) pivot high.
lastPivotOsz series float Oscillator value of the last pivot high.
lastPivotBar series int Bar index of the last pivot high.
bullDivPos(regBull, hidBull, exgBull, rightLen, yPos)
Calculates the plottable data series for bullish divergences. It manages
the complex state of a persistent signal's plotting window to ensure
gap-free and accurately anchored visualization.
Parameters:
regBull (bool) : series bool The regular bullish divergence flag from `bullDiv`.
hidBull (bool) : series bool The hidden bullish divergence flag from `bullDiv`.
exgBull (bool) : series bool The exaggerated bullish divergence flag from `bullDiv`.
rightLen (int) : series int The same `rightLen` value used in `bullDiv` for correct timing.
yPos (float) : series float The series providing the base Y-coordinate for the shapes (e.g., `low`).
Returns: A tuple of three `series float` for plotting bullish divergences.
regBullPosY series float Contains the static anchor Y-value for Regular divergences where a shape should be plotted; `na` otherwise.
hidBullPosY series float Contains the static anchor Y-value for Hidden divergences where a shape should be plotted; `na` otherwise.
exgBullPosY series float Contains the static anchor Y-value for Exaggerated divergences where a shape should be plotted; `na` otherwise.
bearDivPos(regBear, hidBear, exgBear, rightLen, yPos)
Calculates the plottable data series for bearish divergences. It manages
the complex state of a persistent signal's plotting window to ensure
gap-free and accurately anchored visualization.
Parameters:
regBear (bool) : series bool The regular bearish divergence flag from `bearDiv`.
hidBear (bool) : series bool The hidden bearish divergence flag from `bearDiv`.
exgBear (bool) : series bool The exaggerated bearish divergence flag from `bearDiv`.
rightLen (int) : series int The same `rightLen` value used in `bearDiv` for correct timing.
yPos (float) : series float The series providing the base Y-coordinate for the shapes (e.g., `high`).
Returns: A tuple of three `series float` for plotting bearish divergences.
regBearPosY series float Contains the static anchor Y-value for Regular divergences where a shape should be plotted; `na` otherwise.
hidBearPosY series float Contains the static anchor Y-value for Hidden divergences where a shape should be plotted; `na` otherwise.
exgBearPosY series float Contains the static anchor Y-value for Exaggerated divergences where a shape should be plotted; `na` otherwise.
marketStructure(highSrc, lowSrc, leftLen, rightLen, srcTol)
Analyzes the market structure by identifying pivot points, classifying
their sequence (e.g., Higher Highs, Lower Lows), and determining the
prevailing trend state.
Parameters:
highSrc (float) : series float Price series for pivot high detection (e.g., `high`).
lowSrc (float) : series float Price series for pivot low detection (e.g., `low`).
leftLen (int) : series int Number of bars to the left of a pivot (default 5).
rightLen (int) : series int Number of bars to the right of a pivot (default 5).
srcTol (float) : series float Percentage tolerance to consider two pivots as 'equal' (default 0.05%).
Returns: A tuple containing detailed market structure information.
pivType series PivType The type of the most recently formed pivot (e.g., `hh`, `ll`).
lastPivHi series float The price level of the last confirmed pivot high.
lastPivLo series float The price level of the last confirmed pivot low.
lastPiv series float The price level of the last confirmed pivot (either high or low).
pivHiBroken series bool `true` if the price has broken above the last pivot high.
pivLoBroken series bool `true` if the price has broken below the last pivot low.
trendState series TrendState The current trend state (`up`, `down`, or `neutral`).

Daily Levels: PD / PM / OR (RTH/Pre)# Daily Levels: PD / PM / OR (RTH/Pre)
## Overview
This indicator displays key intraday support and resistance levels for US equity markets, specifically designed for traders who use Previous Day, Pre-Market, and Opening Range levels in their trading strategy.
## Key Features
**Seven Critical Levels Displayed:**
- **PDH (Previous Day High)** - Blue line: The highest price from yesterday's regular trading hours (9:30 AM - 4:00 PM ET)
- **PDL (Previous Day Low)** - Blue line: The lowest price from yesterday's regular trading hours
- **PDC (Previous Day Close)** - Orange line: The closing price from yesterday's regular trading hours
- **PMH (Pre-Market High)** - Yellow line: The highest price during today's pre-market session (4:00 AM - 9:30 AM ET)
- **PML (Pre-Market Low)** - Yellow line: The lowest price during today's pre-market session
- **ORH (Opening Range High)** - Red line: The highest price during the first 30 minutes of trading (9:30 AM - 10:00 AM ET)
- **ORL (Opening Range Low)** - Red line: The lowest price during the first 30 minutes of trading
## How It Works
**At 9:30 AM ET (Market Open):**
- PDH, PDL, PDC levels appear (from previous day's RTH)
- PMH, PML levels appear (from today's pre-market session)
- All lines begin at the 9:30 AM bar and extend right
**At 10:00 AM ET (Opening Range Close):**
- ORH, ORL levels appear (from today's first 30 minutes)
- Lines begin at the 9:30 AM bar and extend right
**Level Persistence:**
- All levels remain visible until the next trading day at 9:30 AM ET
- Levels reset daily for the new trading session
## Use Cases
**Day Trading:**
- Identify key support and resistance zones before placing trades
- Use PDH/PDL as potential profit targets or stop loss areas
- Monitor price reaction at pre-market levels for early trading signals
- Trade breakouts or rejections at opening range levels
**Swing Trading:**
- Assess daily momentum by observing breaks above/below previous day levels
- Use multiple timeframes while maintaining consistent reference points
**Market Structure:**
- Quickly identify if the market is trading above or below key levels
- Recognize accumulation/distribution patterns around these zones
## Technical Details
- **Timezone:** All times referenced are US Eastern Time (America/New_York)
- **Session Windows:**
- Pre-Market: 4:00 AM - 9:30 AM ET
- Regular Trading Hours: 9:30 AM - 4:00 PM ET
- Opening Range: 9:30 AM - 10:00 AM ET
- **Timeframe Agnostic:** Works on any chart timeframe
- **Visual Clarity:** Color-coded lines and labels for easy identification
## Color Scheme
- **Blue:** Previous Day levels (PDH, PDL)
- **Orange:** Previous Day Close (PDC)
- **Yellow:** Pre-Market levels (PMH, PML)
- **Red:** Opening Range levels (ORH, ORL)
## Best Practices
1. Use on US equity indices (SPY, QQQ, ES, NQ) and liquid US stocks
2. Combine with volume analysis for confirmation
3. Pay attention to how price reacts at these levels (bounce vs. break)
4. Most effective during the first 2 hours of trading when volatility is highest
5. Consider the market context (trending vs. ranging) when interpreting these levels
## Note
This indicator is specifically designed for US market hours. Results may vary when applied to international markets or instruments with different trading sessions.

Enhanced Holt-Winters RSI [BOSWaves]Enhanced Holt-Winters RSI – Next-Level Momentum Smoothing & Signal Precision
Overview
The Enhanced Holt-Winters RSI transforms the classic Relative Strength Index into a robust, lag-minimized momentum oscillator through Holt-Winters triple exponential smoothing. By modeling the level, trend, and cyclical behavior of the RSI series, this indicator delivers smoother, more responsive signals that highlight overbought/oversold conditions, momentum shifts, and high-conviction trading setups without cluttering the chart with noise.
Unlike traditional RSI, which reacts to historical data and produces frequent whipsaws, the Enhanced Holt-Winters RSI filters transient price fluctuations, enabling traders to detect emerging momentum and potential reversal zones earlier.
Theoretical Foundation
The traditional RSI measures relative strength by comparing average gains and losses, but suffers from:
Lag in trend recognition : Signals often arrive after momentum has shifted.
Noise sensitivity : High-frequency price movements generate unreliable crossovers.
Limited insight into structural market shifts : Standard RSI cannot contextualize cyclical or momentum patterns.
The Enhanced Holt-Winters RSI addresses these limitations by applying triple exponential smoothing directly to the RSI series. This decomposes the series into:
Level (Lₜ) : Represents the smoothed central tendency of RSI.
Trend (Tₜ) : Captures rate-of-change in smoothed momentum.
Seasonal Component (Sₜ) : Models short-term cyclical deviations in momentum.
By incorporating these elements, the oscillator produces smoothed RSI values that react faster to emerging trends while suppressing erratic noise. Its internal forecast is mathematical, influencing the smoothed RSI output and signals, rather than being directly plotted.
How It Works
The Enhanced Holt-Winters RSI builds its signal framework through several layers:
1. Base RSI Calculation
Computes standard RSI over the selected period as the primary momentum input.
2. Triple Exponential Smoothing (Holt-Winters)
The RSI is smoothed recursively to extract underlying momentum structure:
Level, trend, and seasonal components are combined to produce a smoothed RSI.
This internal smoothing reduces lag and enhances signal reliability.
3. Momentum Analysis
Short-term momentum shifts are tracked via a moving average of the smoothed RSI, highlighting acceleration or deceleration in directional strength.
4. Volume Confirmation (Optional)
Buy/sell signals can be filtered through a configurable volume threshold, ensuring only high-conviction moves trigger alerts.
5. Visual Output
Colored Candles : Represent overbought (red), oversold (green), or neutral (yellow) conditions.
Oscillator Panel : Plots the smoothed RSI with dynamic color coding for immediate trend context.
Signals : Triangular markers indicate bullish or bearish setups, with stronger signals flagged in extreme zones.
Interpretation
The Enhanced Holt-Winters RSI provides a multi-dimensional perspective on price action:
Trend Strength : Smoothed RSI slope and color coding reflect the direction and momentum intensity.
Momentum Shifts : Rapid changes in the smoothed RSI indicate emerging strength or weakness.
Overbought/Oversold Zones : Highlight areas where price is stretched relative to recent momentum.
High-Conviction Signals : Combined with volume filtering, markers indicate optimal entries/exits.
Cycle Awareness : Smoothing reveals structural patterns, helping traders avoid reacting to noise.
By combining these elements, traders gain early insight into market structure and momentum without relying on raw, lag-prone RSI data.
Strategy Integration
The Enhanced Holt-Winters RSI can be applied across trading styles:
Trend Following
Enter when RSI is aligned with price momentum and color-coded signals confirm trend direction.
Strong slope in the smoothed RSI signals trend continuation.
Reversal Trading
Look for RSI extremes with momentum shifts and strong signal markers.
Compression in oscillator values often precedes reversal setups.
Breakout Detection
Oscillator flattening in neutral zones followed by directional expansion indicates potential breakout conditions.
Multi-Timeframe Confluence
Higher timeframes provide directional bias; lower timeframes refine entry timing using smoothed RSI dynamics.
Technical Implementation Details
Input Source : Close, open, high, low, or price.
Smoothing : Holt-Winters triple exponential smoothing applied to RSI.
Parameters :
Level (α) : Controls smoothing of RSI.
Trend (β) : Adjusts responsiveness to momentum changes.
Seasonal Length : Defines cycles for short-term adjustments.
Delta Smoothing : Reduces choppiness in smoothed RSI difference.
Outputs :
Smoothed RSI
Colored candles and oscillator panel
Buy/Sell signal markers (with optional strength filtering)
Volume Filtering : Optional threshold to confirm signals.
Optimal Application Parameters
Asset-Specific Guidance:
Forex : Use moderate smoothing (α, β) to capture medium-term momentum swings while filtering minor price noise. Works best when combined with volume or volatility filters.
Equities : Balance responsiveness and smoothness to identify sustained sector momentum or rotational shifts; ideal for capturing clean directional transitions.
Cryptocurrency : Increase smoothing parameters slightly to stabilize RSI during extreme volatility; optional volume confirmation can help filter false signals.
Futures/Indices : Lower smoothing sensitivity emphasizes macro momentum and structural trend durability over short-term fluctuations.
Timeframe Optimization:
Scalping (1-5m) : Use higher sensitivity (lower smoothing factors) to react quickly to micro-momentum reversals.
Intraday (15m-1h) : Balance smoothing and responsiveness for detecting short-term acceleration and exhaustion zones.
Swing (4h-Daily) : Apply moderate smoothing to reveal underlying directional persistence and cyclical reversals.
Position (Daily-Weekly) : Use stronger smoothing to isolate dominant momentum trends and filter temporary pullbacks.
Integration Guidelines
Combine with trend filters (EMAs, SuperSmoother MA, ATR-based tools) for confirmation.
Use volume and signal strength markers to filter low-conviction trades.
Slope, color, and signal alignment can guide entry, stop placement, and scaling.
Disclaimer
The Enhanced Holt-Winters RSI is a technical analysis tool, not a guaranteed profit system. Effectiveness depends on proper settings, market structure, and disciplined risk management. Always backtest before live trading.

Options levelsOverview
Options Levels 🎯 plots 13 key institutional and options-based levels directly on your chart — including Call Wall, Put Wall, Gamma Flip, Whales Pivot, five Whale levels, and Sigma deviation bands (σ¹ / σ²).
It’s designed for both intraday and swing traders, offering a clean visual structure with elegant emoji labels, flexible visibility controls, and precise right-edge extensions for each line.
✨ Key Features
Single structured input with 13 ordered levels:
CallWall, PutWall, GammaFlip, Whales Pivot, Whale1..Whale5, Upperσ1, Upperσ2, Lowerσ1, Lowerσ2
Expressive emoji labels (🟢, 🔴, ⚖️, 🌑, 🐋, σ¹/σ²) optimized for dark themes.
Right-edge alignment: each line extends exactly to its label — no infinite lines.
Group visibility toggles:
• Critical Levels → Call Wall, Put Wall, Gamma Flip, Whales Pivot
• Whale Levels → Whale 1–5
• Sigma Bands → Upper/Lower σ¹ and σ²
Dynamic line-length multipliers that emphasize key levels.
Built-in alert conditions:
• Price crossing above the Call Wall
• Price crossing below the Put Wall
⚙️ Inputs & Settings
📋 Level List (string) : comma-separated list of 13 numeric values.
Example:
🎨 Appearance
• Base line length (bars)
• Label visibility toggle
• Line thickness
• Extend line and label to the right
• Distance (bars) between last candle and label
👁️ Visibility Controls
• Toggle Critical, Whale, or Sigma levels independently
🚀 How to Use
Paste your list of 13 ordered levels into the input field.
Adjust base length and thickness according to your timeframe.
Enable “Extend to the right” to position labels neatly beyond the last candle.
Use visibility toggles to focus on specific level groups (e.g., hide Whale Levels for short-term setups).
Optionally enable alerts to track price breakouts above/below Call and Put Walls.
The plotted levels are derived from aggregated options flow data, institutional positioning, and volatility-based deviations (σ). They serve as reference zones rather than predictive signals, helping visualize where liquidity and dealer hedging pressure may cluster.
📖 Level Definitions
Call Wall 🟢 — The strike with the highest call open interest; potential resistance area.
Put Wall 🔴 — The strike with the highest put open interest; potential support area.
Gamma Flip ⚖️ — Level where total gamma exposure changes sign; may reflect a shift in dealer hedging behavior.
Whales Pivot 🌑 — Represents the average institutional positioning from the previous trading day, reflecting where large option flows were most concentrated.
Whale Levels 🐋 — High-premium or large-volume strikes typically linked to institutional activity.
Upper σ¹ / σ² 📈 — One and two standard deviations above spot; potential overextension zones.
Lower σ¹ / σ² 📉 — One and two standard deviations below spot; potential mean-reversion zones.
Levels are manually input by the user. This script is a visual reference, not a predictive model.
⚠️ Notes
Levels are user-provided (not calculated by this script).
The indicator does not issue buy/sell signals or provide performance guarantees.
Designed purely as a visual aid for contextual market reference.
Optimized with barstate.islast for performance (draws only at the latest bar).
Disclaimer:
This indicator is for educational and visual purposes only. It does not generate buy/sell signals or guarantee future results. User-provided levels are meant for contextual reference only.
Developed for traders who rely on market structure and options flow context. Feedback and suggestions are welcome.
