MACD signal with alert (long/short/close) for TV free accountSend MACD alert through email (available for free/pro user):
// 3 - buy
// -2 - short
// 0 - close position
// 1 - ignore
Example buy signal
Alert: STRAT3. BINANCE:BTCUSDTPERP, price = 31080
Example sell signal
Alert: STRAT-2. BINANCE:BTCUSDTPERP, price = 31080
Example close signal
Alert: STRAT0. BINANCE:BTCUSDTPERP, price = 31080
Example ignore signal
Alert: STRAT1. BINANCE:BTCUSDTPERP, price = 31080
Pesquisar nos scripts por "macd"
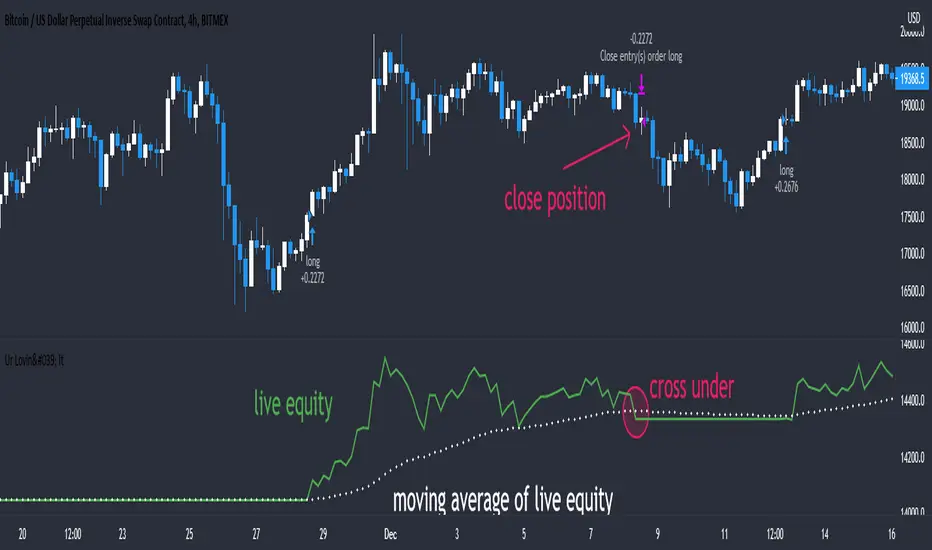
MACD controlled risk strategy exampleUsing a basic MACD as a signal this code is an example of how to base strategies around stops and calculated risk per trade rather than the more common approach of 'equity flipping' long and short for every trade and using an arbitrary %age stop which can leave you a bit exposed, lead to excessive drawdown and miss out on bigger sized positions for more profits.
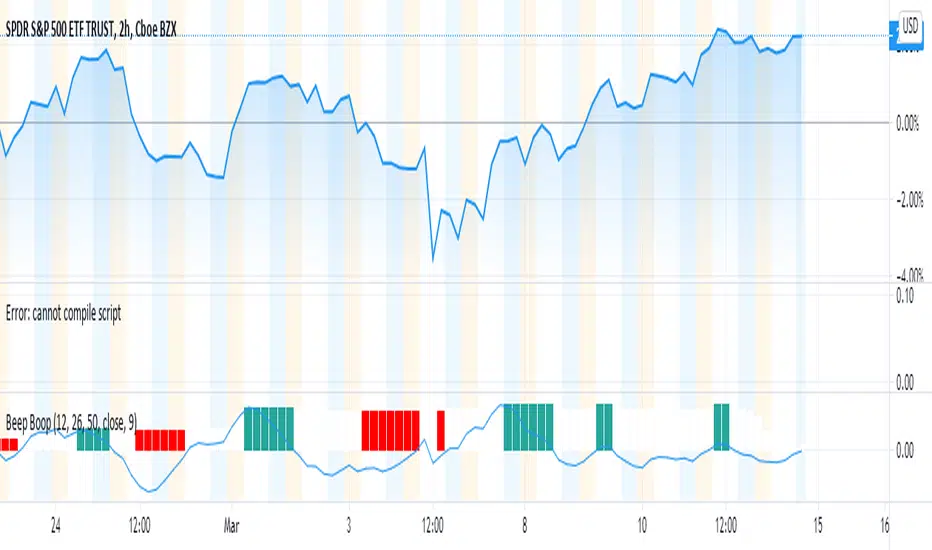
Beep Boop(Improved) Beep Boop Indicator for Trending Markets originally written by Trading Rush.
It is originally based on the MACD 12-26 and the 50 bar EMA.
The macd hist is color coded with green as buy and sell as red.
I added an option to use a couple of lower lag ema's (See line 13 - ema_signal).
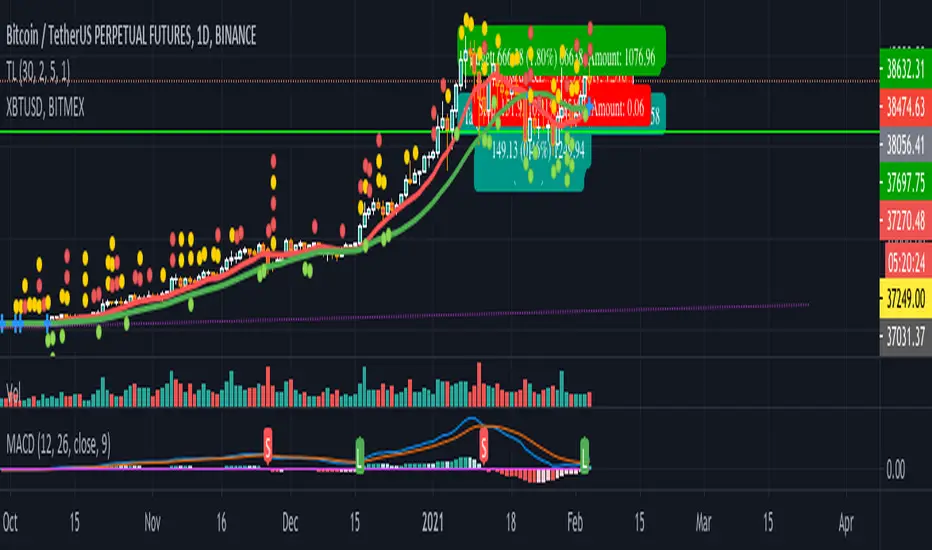
BTC and ETH Long strategy - version 2I wrote my first article in May 2020. See below
BTC and ETH Long strategy - version1
After 6 months, it is now time to check the result of my script for the last 6 months.
XBTUSD (4H): 14/05/2020 --> 22/11/2020 = +78% in 4 trades
ETHXBT (4H): 14/05/2020 --> 22/11/2020 = +21% in 9 trades
ETHUSD (4H): 14/05/2020 --> 22/11/2020 = +90% in 6 trades
Using the signals from this strategy to trade manually has shown that this was a bit frustrating because of the low rate of winning trades.
If you have to enter 100 trades and see 75% of them failing and 25% winning, this is frustrating. For sure the strategy makes good money but it is difficult to hold this mentality.
So, I have reviewed and modified it to get a higher winning rate.
After few days of work, tests and validation, I managed to get a wining rate close to 60%.
The key element was also to decrease the number of trades by using a higher time frame. (4H candles instead of 2H candles).
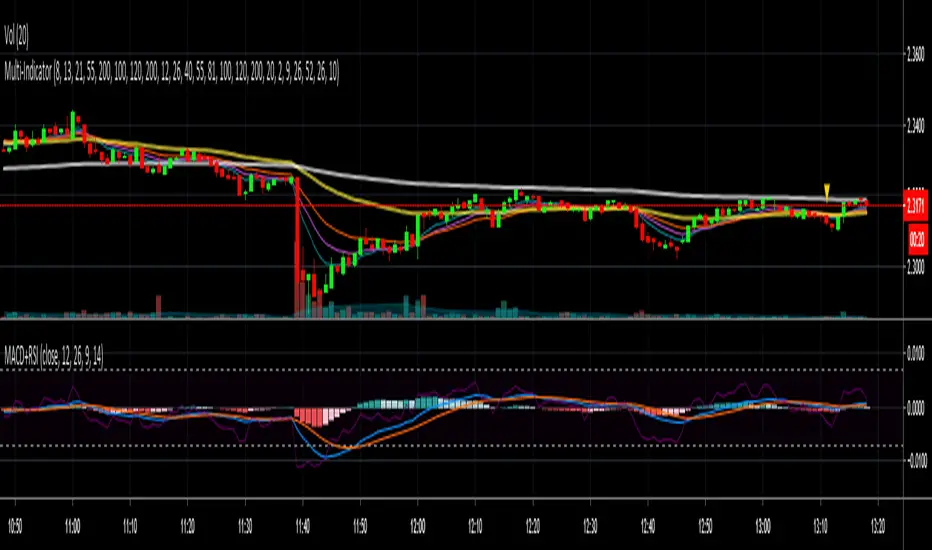
- Entry in position is based on
MACD, EMA (20), SMA (100), SMA (200) moving up
AND EMA (20) > SMA (100)
AND SMA (100) > SMA (200)
- Exit the position if: Stoploss is reached OR EMA (20) crossUnder SMA (100)
The goal of this new script is to be able to follow the signals manually and only make few trades per years.
I have also validated it against some other altcoins where some are giving very good results.
Here are some results for 2020 (from 01/01/2020 until now (22/11/2020). Those results are the one I get when using 4H candles.
ETH/USD: +144% in 8 trades.
BTC/USD: +120% in 7 trades.
ETH/BTC: +33% in 9 trades.
ICX/USD: +123% in 10 trades.
LINK/USD: +155% in 11 trades.
MLN/USD: +388% in 8 trades.
ADA/USD: +180% in 7 trades.
LINK/BTC: +97% in 10 trades.
The best is that above results are without considering compound effect. If you re-invest all gains done in each new trade, this will give you the below results :)
ETH/USD: +189% in 8 trades.
BTC/USD: +260% in 7 trades.
ETH/BTC: +29% in 9 trades.
ICX/USD: +112% in 10 trades.
LINK/USD: +222% in 11 trades.
MLN/USD: +793% in 8 trades.
ADA/USD: +319% in 7 trades.
LINK/BTC: +103% in 10 trades.
As you can see, the results are good and the number of trades for 11 months is not big, which allows the trader to place orders manually.
But still, I'm lazy :), so, I have also coded this strategy in HaasScript language which allows you to automate this strategy using the HaasOnline software specialized in automated crypto trading.
I hope that this strategy will give you ideas or will be the starting point for your own strategy.
Let me know if you need more details.

MA MTF Momentum HistogramMy own interpretation indicator which i call multi time frame moving averages momentum with NO LAG EMA support (Optional).
The indicator is calculated by subtracting the long-term EMA from the short-term EMA .
This pretty much resembles the MACD moving averages calculation but without the smoothing of the histogram.
Can also be used to find divergences.
The background shows the main trend with higher time frame which can be set in the settings.
Aimed to use with Higher time frame (Double or more) but can also work with lower time frame.
How to use the indicator?
==Histogram==
Green: Momentum of asset is positive and increasing.
Lighter Green: Momentum of asset is still positive but decreasing and can revert to negative momentum.
Red: Momentum of asset is negative and increasing.
Lighter Red: Momentum of asset is still negative but increasing and revert to positive momentum.
==Background Color - Main Trend==
Green: HTF (Higher time frame) momentum is positive.
RED: HTF momentum is negative.
Feel free to comment and Follow to stay updated with upcoming scripts: www.tradingview.com
NOTE: BARS ARE COLORED BY DEFAULT WITH HISTOGRAM COLORS! (Can be changed in settings)

Hull MACDMACD constructed using Hull MA and triangular MA.
HMA overshoots while TMA lags, producing an interesting MACD even when the two MAs have the same period.
Coloring shows tops, bots, and inflections.

MACD ProMoving average convergence divergence pro.
Original MACD with new features, Including...
1. Three different modes.
Basic, Logarithmic, Percent (calculates difference of oscillator MAs in percent)
2. Additional moving averages for oscillator, signal and even histogram.
EMA, WMA (linearly weighted), LMA (logarithmically weighted), SMA
Volume Weighted RMA (I've been suggested to make a MACD with the VWEMA that I published recently but that was too fast, this almost 2 times slower because of using RMA instead of EMA)
VWRMA(s) (an alternative for VWRMA which uses candle formation to simulate the volume, can be useful when volume is not provided for the symbol or it is not proper)
And DEMA (Double Exponential MA)
3. Signal Displacement.
If you want to add some delay to signal, could help for extra confirmation of center crosses and removal of some falss ones.
4. Histogram Smoother.
For those who like the smooth curves. Can deliver a cleaner histogram even in volatile markets.
5. Bar color for more fun.

MACD Cross+MAStrategy MACD cross + Ma cross
การเข้าจะเข้าต่อเมื่อมีการ Cross ของ MACD ก่อน แล้วมีการ Cross ของเส้น ma 9,26 ตามมา
จากการ Backtest ของผมถือว่าเป้น Indicator ที่ค่อนข้างบอกให้เข้าช้าเลยทีเดียว แต่ใช้ Follow เทรนพอใช้ได้อยู่ครับ
แนะนำให้ใช้ในช่วงที่ตลาดเป็นขาขึ้นนะครับ ช่วงหมียาวอย่างปี 2018 Indicator ตั้วนี้ไม่เวิร์คอย่างแรงเลยครับ
ในภาพ backtest ตั้งแต่ปี 2019 - ปัจจุบันนะครับ
ใช้ใน TF Day จะเห็นผลดีที่สุด

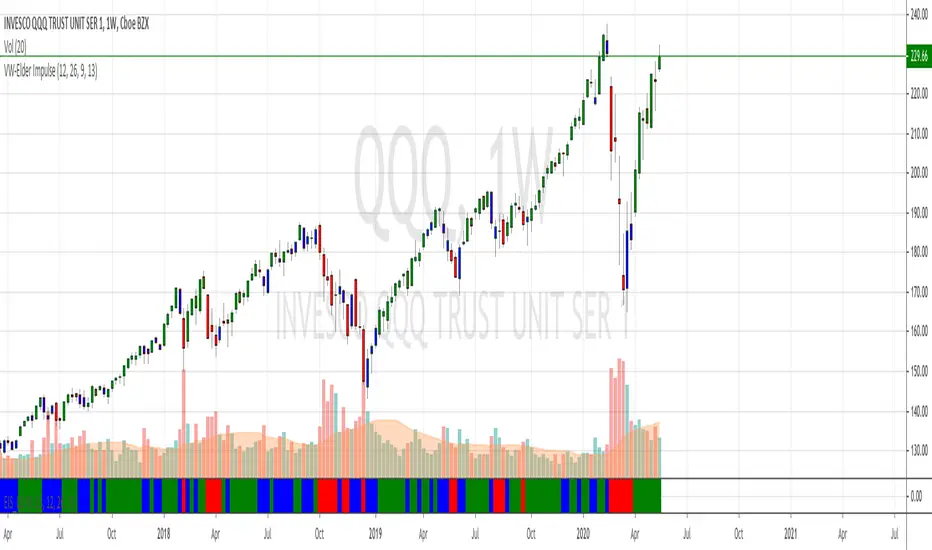
Volume-Weighted Elder Impulse SystemThis is a volume-weighted version of the Elder Impulse System. The Elder Impulse System utilizes the MACD along with EMA13(in general) to find the optimal entry and exit points. In this version, the MACD and EMA have both been changed into a Volume-weighted version. With volume involved, the indicator is, in general, faster than the original Elder Impulse system, in showing entry and exit points.
AverageTrueRangeConvergenceDivergenceV1sloth288Simple indicator with the thought of merging MACD and ATR. The idea has come from trying to find a way to define sideways markets. Whipped this up quickly to explore the idea.
Feel free to throw in suggestions or even mention other open source indicators that define sideways markets well.
Simple instructions
If histogram green, breakouts/trade zone.
If histogram red, sideways/keep out.

Macd CloudsDisplays a 4C Macd as a cloud ribbon to act as a chart overlay to quickly visually identify MACD trends.

MACD + RSI togetheryou will have both MACD and RSI together in front of each other. best for tile windows or small monitors. enjoy
MACD by James_BlI use the space between MACD and Signal.
If you want to use a couple of indicators in the same area you do not need to display the histogramm.
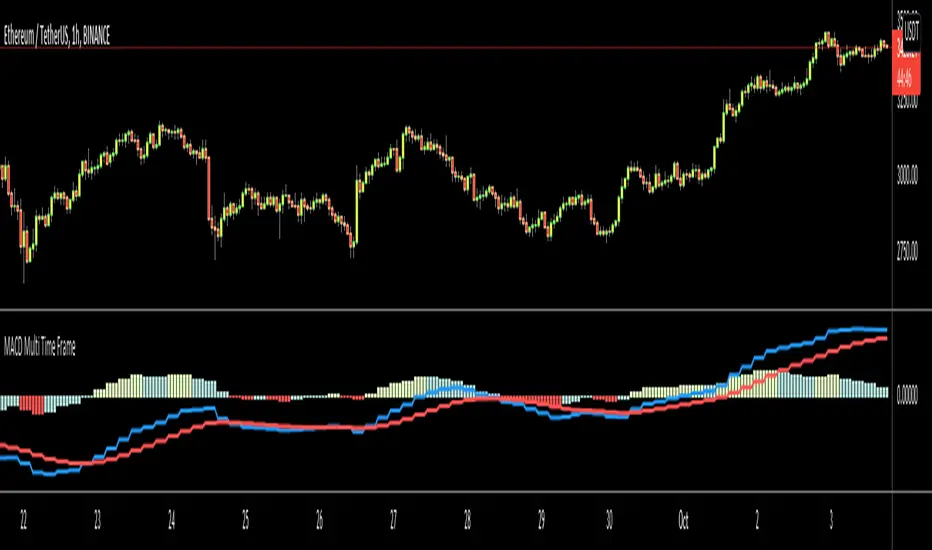
MACD Multi Time FrameThis is non-repainting multi time frame MACD script. You can choose HTF manually or HTF is calculated automatically if HTF Mode is "Auto" that is default.

Normalized Smoothed MACDMACD normalized with its highest and lowest values over the last “Normalization period”
- includes alerts

VMACDIntended to be used in exactly the same way as the built-in MACD, but uses volume-weighted moving averages instead. This gives it a tiny edge for spotting high volume breakouts.


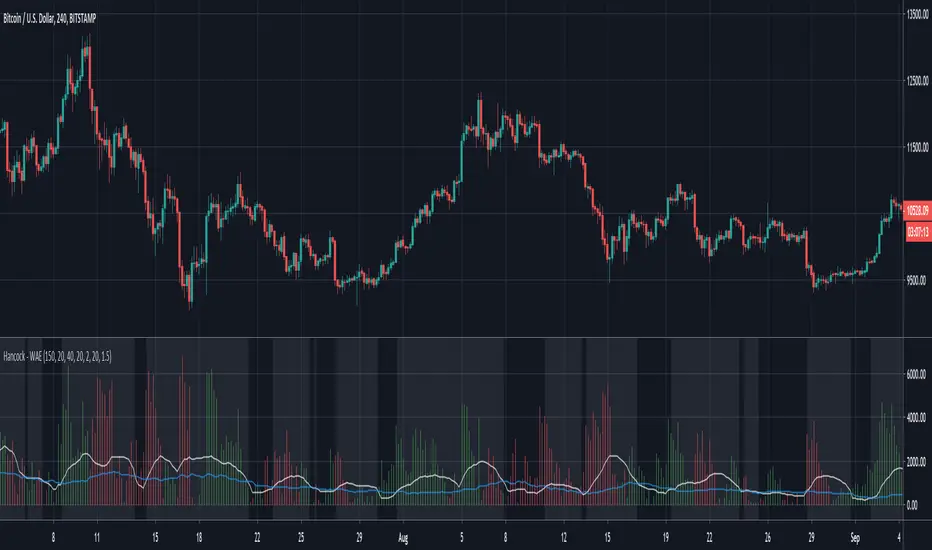
Hancock - WAEThis is a version of the LazyBear Waddah Attar Explosion indicator that incorporates the LazyBear Squeeze Momentum Indicator. Full credit goes to LazyBear for this and i've added links to his indicators used for a further explanation.
This histogram is a plot of the difference between the current and previous MACD multiplier by the sensitivity value. Green indicates an up trend and red indicates a down trend.
The white line is the lower BB subtracted from the upper BB and signals should be taken when the histogram is greater than this line.
The blue line is taken from the Squeeze Indicator and is the Keltner Channel. If the white line is less than the blue line it can be considered a squeeze and the background color of the indicator is coloured to indicate when not in a squeeze.
Happy trading folks!
Hancock
MACD SMOOTH - A ZULU_KILO INDICATORHey Tradingviewers!
Another Zulu_Kilo indicator coming at ya!
This will be an open source script as the base code comes from another Tradingview user, their original info is in the script.
This is a revision of an MACD smoothed script which mostly adds the capability for the indicator to show you bullish/bearish crosses in red/maroon background colors.
Use this along with other indicators as a confirmation of price action. It is recommended to confirm candles with it.
-Happy Trading!

ANN MACD : 25 IN 1 SCRIPTIn this script, I tried to fit deep learning series to 1 command system up to the maximum point.
After selecting the ticker, select the instrument from the menu and the system will automatically turn on the appropriate ann system.
Listed instruments with alternative tickers and error rates:
WTI : West Texas Intermediate (WTICOUSD , USOIL , CL1! ) Average error : 0.007593
BRENT : Brent Crude Oil (BCOUSD , UKOIL , BB1! ) Average error : 0.006591
GOLD : XAUUSD , GOLD , GC1! Average error : 0.012767
SP500 : S&P 500 Index (SPX500USD , SP1!) Average error : 0.011650
EURUSD : Eurodollar (EURUSD , 6E1! , FCEU1!) Average error : 0.005500
ETHUSD : Ethereum (ETHUSD , ETHUSDT ) Average error : 0.009378
BTCUSD : Bitcoin (BTCUSD , BTCUSDT , XBTUSD , BTC1!) Average error : 0.01050
GBPUSD : British Pound (GBPUSD,6B1! , GBP1!) Average error : 0.009999
USDJPY : US Dollar / Japanese Yen (USDJPY , FCUY1!) Average error : 0.009198
USDCHF : US Dollar / Swiss Franc (USDCHF , FCUF1! ) Average error : 0.009999
USDCAD : Us Dollar / Canadian Dollar (USDCAD) Average error : 0.012162
SOYBNUSD : Soybean (SOYBNUSD , ZS1!) Average error : 0.010000
CORNUSD : Corn (ZC1! ) Average error : 0.007574
NATGASUSD : Natural Gas (NATGASUSD , NG1!) Average error : 0.010000
SUGARUSD : Sugar (SUGARUSD , SB1! ) Average error : 0.011081
WHEATUSD : Wheat (WHEATUSD , ZW1!) Average error : 0.009980
XPTUSD : Platinum (XPTUSD , PL1! ) Average error : 0.009964
XU030 : Borsa Istanbul 30 Futures ( XU030 , XU030D1! ) Average error : 0.010727
VIX : S & P 500 Volatility Index (VX1! , VIX ) Average error : 0.009999
YM : E - Mini Dow Futures (YM1! ) Average error : 0.010819
ES : S&P 500 E-Mini Futures (ES1! ) Average error : 0.010709
GAZP : Gazprom Futures (GAZP , GZ1! ) Average error : 0.008442
SSE : Shangai Stock Exchange Composite (Index ) ( 000001 ) Average error : 0.011287
XRPUSD : Ripple (XRPUSD , XRPUSDT ) Average error : 0.009803
Note 1 : Australian Dollar (AUDUSD , AUD1! , FCAU1! ) : Instrument has been removed because it has an average error rate of over 0.13.
The average error rate is 0.1850.
I didn't delete it from the menu just because there was so much request,
You can use.
Note 2 : Friends have too many requests, it took me a week in total and 1 other script that I'll share in 2 days.
Reaching these error rates is a very difficult task, and when I keep at a low learning rate, they are trained for a very long time.
If I don't see the error rate at an average low, I increase the layers and go back into a longer process.
It takes me 45 minutes per instrument to command artificial neural networks, so I'll release one more open source, and then we'll be laying 70-80 percent of the world trade volume with artificial neural networks.
Note 3 :
I would like to thank wroclai for helping me with this script.
This script is subject to MIT License on behalf of both of us.
You can review my original idea scripts from my Github page.
You can use it free but if you are going to modify it, just quote this script .
I hope it will help everyone, after 1-2 days I will share another ann script that I think is of the same importance as this, stay tuned.
Regards , Noldo .

Range Force Impulse The "Range Force Impulse" indicator combines 4 useful indicators into one, freeing up chart real-estate and giving the trader insight into trend health, bull/bear commitment, range and volatility all at a glance.
The indicator consists of the following:
Direction - True Range and Average True Range columns shown above and below 0 depending on direction of the period's price
-- TR (gray) shows the current period's trading volatility
-- ATR (Impulse colors, see below) shows an EMA of TR over a specified length
-- Can be used to determine stops and targets (Example: Stop loss at prev close - ATR, Target at 2x ATR)
Index - Alexander Elder's EMA of (change(close) * volume), shows crosses above 0 (green) and below 0 (red), and intermediate signals
-- Shows bull vs. bear interest/commitment/dominance
-- Elder recommends EMA length of 2 for daily chart buy/sell signals, and 13 for weekly chart bull/bear dominance & trend direction signals
-- Intermediate signals are shown above 0 when falling (salmon), or below 0 when rising (pale yellow)
System - Range columns are colored using Alexander Elder's censorship system (green: do not short, red: do not long, blue: is up to you)
-- Shows overall trend health (Macd histogram and EMA up/down changes)
