Percentile Rank of Moving Average Convergence DivergenceThis simple indicator provides you three useful information of the Moving Average Convergence Divergence (MACD) indicator:
The percentile rank of the current value of the MACD line, displayed by the bright blue line.
The percentile rank of the current value of the Signal line, displayed by the dark blue line.
The percentile rank of the current value of the Histogram line, displayed by the olive histogram.
This indicator can be useful to identify the strength of trend. This indicator makes the assumption that market tends to revert into the opposite direction. If the market has been trending a lot, it should consolidate for a while later. If the market has been consolidating for a long time, it would begin trending real soon.
When we see a low percentile rank, no matter which line it is, this tells that the market hasn't been moving much, or there is little momentum. If the percentile rank stays below the median or even below the first quartile for a long time, this could suggest that the market is ready for the next trend since it has stored quite some energy.
When we see a high percentile rank, no matter which line it is, this tells that the market has been trending a lot, or there is much momentum. If the percentile rank stays above the median or even above the third quartile for a long time, it is probable that the market has used up much of its energy and is going to take a rest (consolidate).
Pesquisar nos scripts por "macd"
Divergence Cheat Sheet'Divergence Cheat Sheet' helps in understanding what to look for when identifying divergences between price and an indicator. The strength of a divergence can be strong, medium, or weak. Divergences are always most effective when references prior peaks and on higher time frames. The most common indicators to identify divergences with are the Relative Strength Index (RSI) and the Moving average convergence divergence (MACD).
Regular Bull Divergence: Indicates underlying strength. Bears are exhausted. Warning of a possible trend direction change from a downtrend to an uptrend.
Hidden Bull Divergence: Indicates underlying strength. Good entry or re-entry. This occurs during retracements in an uptrend. Nice to see during the price retest of previous lows. “Buy the dips."
Regular Bear Divergence: Indicates underlying weakness. The bulls are exhausted. Warning of a possible trend direction change from an uptrend to a downtrend.
Hidden Bear Divergence: Indicates underlying weakness. Found during retracements in a downtrend. Nice to see during price retests of previous highs. “Sell the rallies.”
Divergences can have different strengths.
Strong Bull Divergence
Price: Lower Low
Indicator: Higher Low
Medium Bull Divergence
Price: Equal Low
Indicator: Higher Low
Weak Bull Divergence
Price: Lower Low
Indicator: Equal Low
Hidden Bull Divergence
Price: Higher Low
Indicator: Higher Low
Strong Bear Divergence
Price: Higher High
Indicator: Lower High
Medium Bear Divergence
Price: Equal High
Indicator: Lower High
Weak Bear Divergence
Price: Higher High
Indicator: Equal High
Hidden Bull Divergence
Price: Lower High
Indicator: Higher High

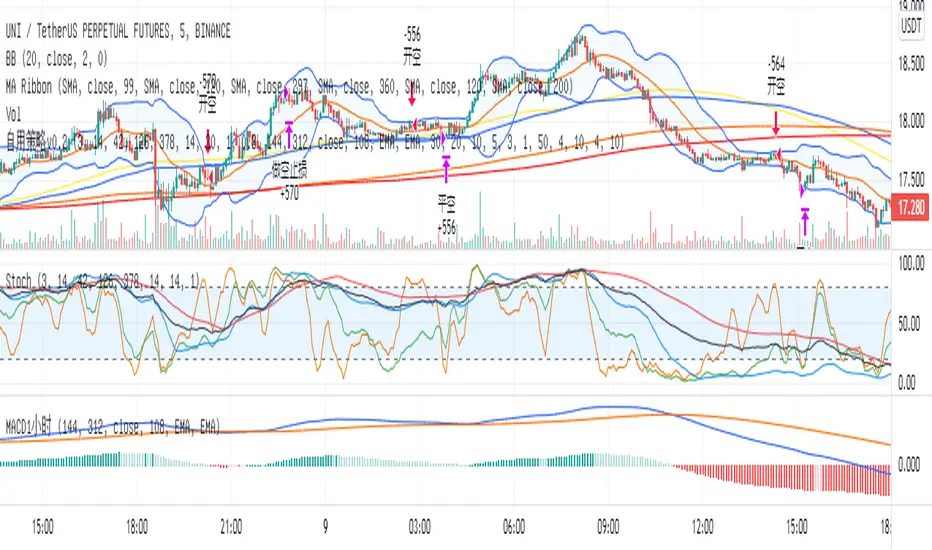
DCA After Downtrend v2 (by BHD_Trade_Bot)The purpose of the strategy is to identify the end of a short-term downtrend . So that you can easily to DCA certain amount of money for each month.
ENTRY
The buy orders are placed on a monthly basis for assets at the end of a short-term downtrend:
- Each month condition: In 1-hour time frame, each month has 24 * 30 candles
- The end of short-term downtrend condition: use MACD for less delay
CLOSE
The sell orders are placed when:
- Is last bar
The strategy use $1000 and trading fee is 1.1% for each order.
Pro tip: The 1-hour time frame has the best results on average:
- Total spent: $1000 x 33 = $33,000
- Total profit: $65,578

DCA After Downtrend (by BHD_Trade_Bot)The purpose of the strategy is to identify the end of a short-term downtrend . So that you can easily to DCA certain amount of money for each month.
ENTRY
The buy orders are placed on a monthly basis for assets at the end of a short-term downtrend:
- Each month condition: In 1-hour time frame, each month has 240 candles
- The end of short-term downtrend condition: use MACD for less delay
CLOSE
The sell orders are placed when:
- Is last bar
The strategy use $1000 and trading fee is 0.1% for each order.
Pro tip: The 1-hour time frame for TSLA has the best results on average:
- Total spent: $1000 x 85 = $85,000
- Total profit: $790,556

Variety Moving Average Waddah Attar Explosion (WAE) [Loxx]Variety Moving Average Waddah Attar Explosion is a Waddah Attar Explosion after the original version created over a decade ago. This version has ATR and Pips calculated dead-zone as well as 35+ moving averages to choose from for all moving average calculations.
What is Waddah Attar Explosion?
Waddah Attar Explosion is a momentum indicator that accounts for volatility in the market. It is the combination of MACD and Bollinger Bands with volatility cutoffs to determine entry and exit points.
How to use:
Strong uptrend when dark green arrow points up
Weak uptrend when light green arrow points up
Strong downtrend when dark red arrow points down
Weak downtrend when light red arrow points down
Included:
35+ moving averages
Controls over explosion and trend filtering
Bar coloring
Dead-zone coloring
ATR and Pips-based dead zone cutoffs
Alerts

MACD StrategyBTCUSD -- 5 min
BUY POSITION
1 : The price is above the EMA
2 : The macd line crosses above the line signal below 0
SELL POSITION
1 : The price is bellow the EMA
2 : The macd line crosses below the signal line above 0

MACD Multiple AlertsThis script help traders to catch bullish and bearish momentum. It creates an alert for 40 altcoins based on the MACD cross over and cross under.
The MACD input are adjustable in the settings and you can choose your favorite assets.
Simply add this indicator to the chart wait that if finish to load and then create an alert on the time frame of your choice.
Enjoy your trading
F_rank_01

FinancialWisdom Breakout IndicatorBreakout is detected when:
1- Price is higher than previous 6 bars
2- price is above 1% of previous high and below 20%
3- price is above 20 week moving average
4- Volume is higher by 30% of 1 candle before.
5-MACD is positive
Remember indicators/strategies are there to help you in your trading and not to trade based on them solely.
Not a financial advise.
Hulk Strategy x35 Leverage 5m chart w/Alerts This strategy is a pullback strategy that utilizes 2 EMAs as a way of identifying trend, MACD as an entry signal, and RSI and ADX to filter bad trades. By using the confirmation of all of these indicators the strategy attempts to catch pullbacks, and it is optimized to wait for high probability setups. Take not that the strategy is optimized for use on BTCUSDT along with 35 times leverage(Using leverage is risky). The Hulk Strategy waits for strong trend confirmation and then attempts to identify pullbacks using MACD and RSI. By using these it identifies strong short term movement against the trend(hence the name Hulk). To use the strategy wait for the strategy to make an entry, and then enter with a stop loss of 1.1% and a take profit of 1.35% with respect to if it is a long or short position. The trade frequency of this strategy is high as it is made for use on the 5m timeframe. But this does not mean you will have to be staring at your computer constantly as an average of 1 trade takes place each day. This will vary a lot though, somedays the strategy enters up to 4 times. I wish you good trading and hope that you like this strategy!
P.S. The indicators on my chart are visualizations of the indicators used in the strategy, they are not necessary for the strategy to work though. Also the colored in cloud on the price chart is an EMA cloud and it comes with the strategy when you add it to your chart. This EMA cloud consists of two EMAs a 50 and a 200 EMA.

MACD+RSI FerrantelliSe trata de la suma de la línea lenta del indicador MACD mas el RSI. De modo que acentuar el momento en que ambos muestran sobre venta o sobre compra.


MACD + DMI Scalping with Volatility Stop by (Coinrule)Trend-following strategies are cool because they allow you to catch potential high returns.
The main limit of such strategies are:
False signals > the asset is not experiencing a strong trend. The strategy gets stuck with a sideways move or, worst, with the beginning of a downtrend.
The sell signal may come later than the actual top, leading in some cases to turn a trade in profit into a loss.
This strategy tries to address these limitations to develop a trading system that optimises the entry and closes trade once the profit achieves a pre-set level.
ENTRY
The trading system uses the MACD and the DMI to confirm when is the best time for buying. Combining these two indicators prevents trading during downtrends and reduces the likelihood of getting stuck in a market with low volatility.
The system confirms the entry when:
The MACD histogram turns bullish.
When the positive DMI is greater than the negative DMI, there are more chances that the asset is trading in a sustained uptrend.
EXIT
The strategy comes with a fixed take profit combined with a volatility stop, which acts as a trailing stop to adapt to the trend's strength. Depending on your long term confidence in the asset, you can edit the fixed take profit to be more conservative or aggressive.
The position is closed when:
The price increases by 3%
The price crosses below the volatility stop.
The best time frame for this strategy based on our backtest is the 3-hr . The 4-hr can work well. In general, this approach suits medium to long term strategies
The strategy assumes each order to trade 30% of the available capital to make the results more realistic. A trading fee of 0.1% is taken into account. The fee is aligned to the base fee applied on Binance, which is the largest cryptocurrency exchange.

MACD RSI 2021-6-27This combines a trend based setting (MACD) and an oscillator (RSI) into one, creating a little extra room to add something else. Everything is colored based on whether RSI above/below 50. Adjust the parameters to your liking. Of course, this setting works best when used on multiple time frames: Enter on one time frame, take profits on a lower one.

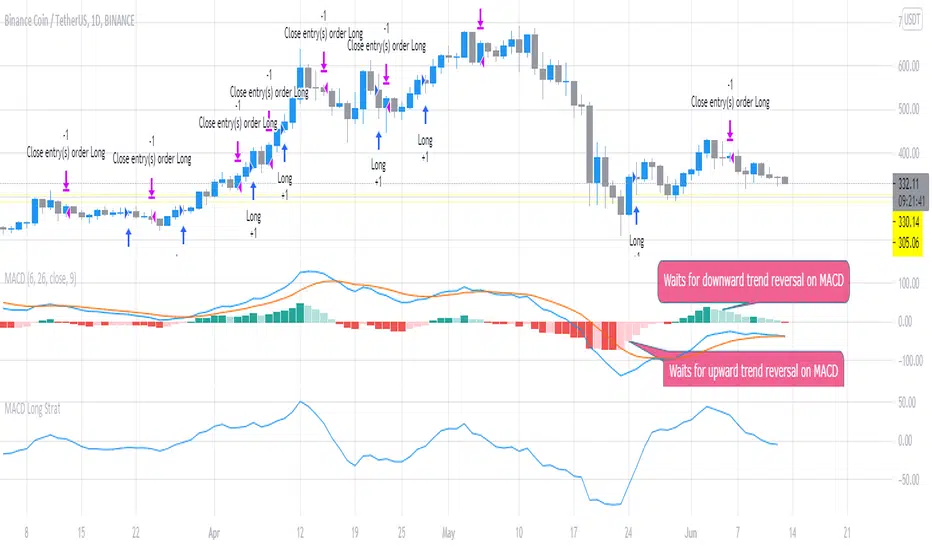
MACD Long StratFirst script I've written, but the concept is pretty simple. This uses the MACD with settings fast_SMA = 6 and slow SMA=16 and uses the distance between the 2 (histogram) to look for potential trend reversals to flag potential entries for Long trades. It waits for the confirmation looking backward 2 x timeframes (to reduce false calls slightly). You can adjust it to open / close quicker (1 timeframe instread of 2) but backtesting shows 2 timeframe delay is best to avoid false signals.
The script suggests Long entry points based on this criteria and uses the converse (reducing histogram / SMA difference delayed by 2 timeframes) to suggest exit or trade close points for downward reversal. It was originally written looking at 1m scalps but backtesting shows this is even more effective on higher timeframes (1D).
SimpleScalper2.0MACDThis indicator should be implemented with more indicators, by itself it is not recommended. SimpleScalper 2.0 MACD its strong are the negative values during the major corrections or waves of impulse of downtrend and see divergences with better visibility

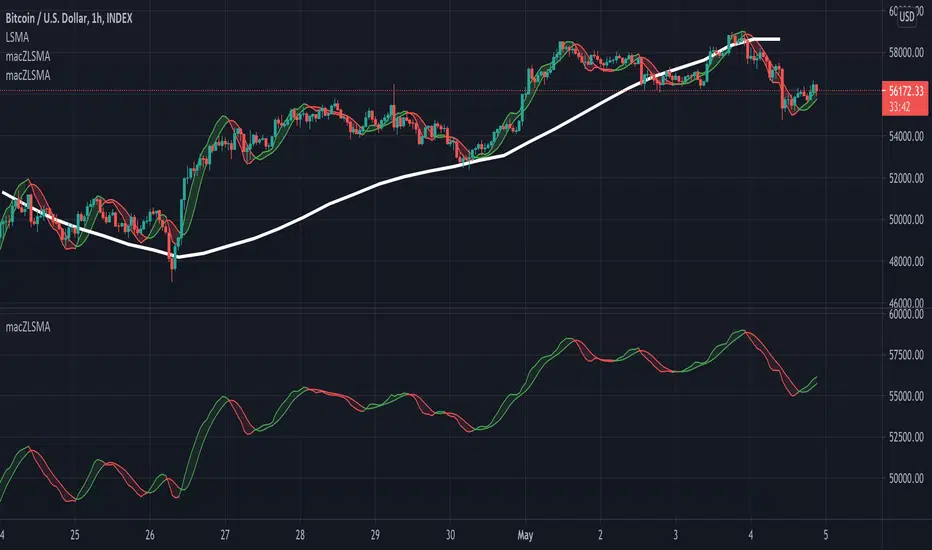
macZLSMA - Overlay**Overlay Version** Macd that shows instantaneous trend using ZLSMA. This crossover has the ability to reveal trend directions before it happens. With multi time frame option.
Above image shows 1 hour timeframe using 12hour setting on indicator
Example with 1 hour timeframe:
Example with 1 hour timeframe using daily setting on indicator:
Non overlay version available here:
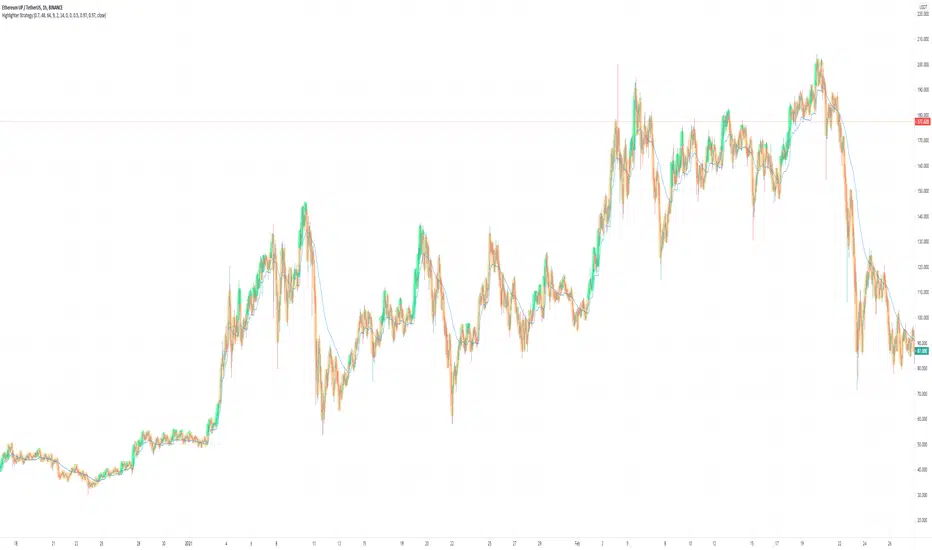
Highlighter Strategy V2// Based on Normalized Smoothed MACD by Dreadblitz
Old one was just an oscillator, I changed a few things
1) It now paints the line green/orange
2) The trigger (green/red) is now based on a signal
3) The signal is basically isUp, but with some additional controls, e.g.
4) (new) There is an embedded stoploss. This is a growth/decay function that decays slower than it grows.
5) Signal is filtered additionally by the stoploss (no green under the decaying line)
Highlighter StrategyOG COINBASE:BTCUSD
Based on Normalized Smoothed MACD by Dreadblitz
Updated slightly the rules about when it'll take a signal, and made it an overlay so that you see "green" and "red" on the price bar.
Things you might want to do when using it.
- Add a stoploss/trailing stop probably a MA of your choosing.
- Check different time frames to confirm a strong entry

MACD BTC Long/Short Strategy v1.0This strategy will use only default MACD with Simple MA(Signal Line) mode 'ON' to determine when it's time to long/short using its histogram value.
Current version has 2 more entries added to increase more trades and profits along the way while maintaining low 'max drawdown' and high returns.
Entry will be opened when macd line(blue) crossed with signal line(red).
Entry will be closed when histogram increased/decreased opposite its previous histogram.
Re-enter will opened a position when histogram continues after X delay (Re-enter Delay setting).
Sculp will opened a position when histogram is still in light colors for X delay (Sculp Delay setting).

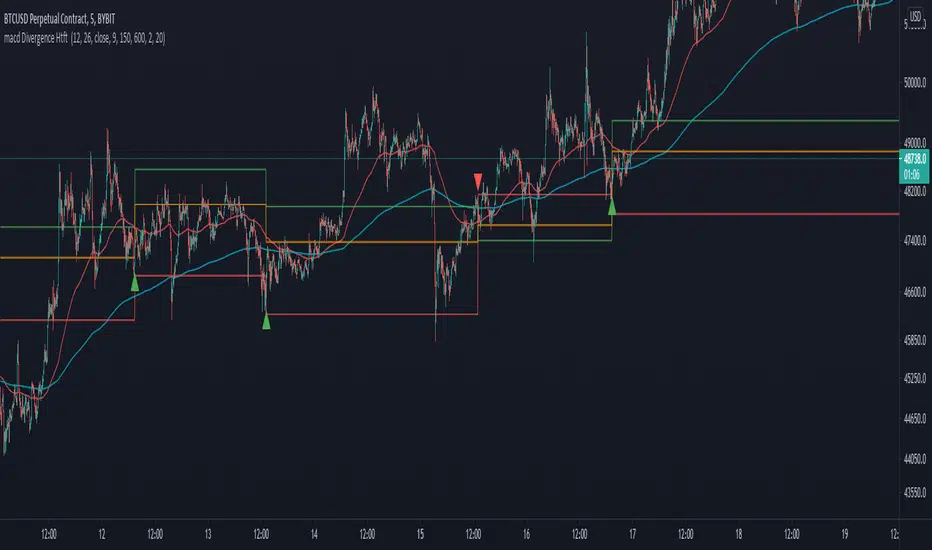
Macd Divergence with higher timeframe trendThis script Uses Ma`s for Trend confluence and looks for macd divergence where the macd is below the Zero line on a long and doesnt cross back up before the divergence happens.
Also added Tp as preeset 2:1RR in green. SL in red and 1:1 RR in orange.
Alerts are included too.