Liquidity Engulfing & Displacement [MsF]Japanese below / 日本語説明は英文の後にあります。
-------------------------
*This indicator is based on upslidedown's "Liquidity Engulfing Candles ". It's a very cool indicator. thank you.
It has 2 functions: show the Liquidity Engulfing on HTF and candle color change when displacement occurs.
=== Function description ===
1. Liquidity Engulfing on HTF
This indicator gives Liquidity Engulfing signals not only for the current candle, but also for H4 and H1 on HTF.
You can use that a bullish engulfing on H1 is a BOS on m5 and on H4 is a BOS on m15. It uses the theory of stop hunt from ICT.
Also, It's possible to fire alert.
2. Displacement
Change the color display of the candlesticks when a bullish candleStick or bearish candleStick is attached. Furthermore, by enabling the "Require FVG" option, you can easily discover the FVG (Fair Value Gap). It is a very useful function for ICT trading.
When H1 candle takes liquidity from one side and moves with an explosive move to the other side of the previous candle (displacement), it creates break of market structure on M5. Entry on discount FVG or OTE with stop loss at or below the stop hunt wick.
=== Parameter description ===
- Liquidity engulfing candles(LEC) SETTING
- Show H1 LEC … Whether to show LEC for H1
- Show H4 LEC … Whether to show LEC for H4
- Show Current LEC … Whether to show LEC for current timeframe
- Apply Stop Hunt Wick Filter … Require candle wick into prior candle retracement zone
- Apply Close Filter … Require LL/HH on candle in order to print a valid engulfing signal
- DISPLACEMENT SETTING
- Require FVG … Draw only when FVG occurs
- Displacement Type … Displacement from open to close? or from high to low?
- Displacement Length … Period over which to calculate the standard deviation
- Displacement Strength … The larger the number, the stronger the displacement detected
-------------------------
2つの機能があります: 上位足のLiquidity engulfing(流動性獲得)を表示することと、大きな変位が発生したときにローソク足の色を変更することです。
=== 機能説明 ===
1. 上位足のLiquidity engulfing
このインジケーターは、現在のローソク足だけでなく、上位足の H4 および H1 に対してもLiquidity engulfingシグナルを提供します。
H1はm5、H4はm15での使用を推奨します。これはICTのストップハント理論を活用しています。また、アラートを発することも可能です。
2. 変位(DISPLACEMENT)
大きな陽線、陰線を付けた場合に、そのローソク足をカラー表示を変更します。
さらに"Require FVG"オプションを有効にすることで、FVG(Fair Value Gap)を容易に発見することができます。ICTトレードにを行うにあたり大変有用な機能となっています。
=== パラメータの説明 ===
- Liquidity engulfing candles(LEC) SETTING
- Show H1 LEC … H1のLECを表示するかどうか
- Show H4 LEC … H4のLECを表示するかどうか
- Show Current LEC … 現在の期間の LEC を表示するかどうか
- Apply Stop Hunt Wick Filter … ハラミ足、もしくは包み足になっている場合のみに検知させる
- Apply Close Filter … 1つ前のローソクよりも終値で超えていた場合のみに検知させる
- DISPLACEMENT SETTING
- Require FVG … FVG発生時のみ描画する
- Displacement Type … openからcloseまでの変位か?highからlowまでの変位か?
- Displacement Length … 標準偏差を計算する期間
- Displacement Strength … 変位の強さ(数字が大きいほど強い変位を検出)
Pesquisar nos scripts por "liquidity"

Liquidity Trap Detector Pro [PyraTime]The Problem: Why You Get Stopped Out
90% of retail traders place their stop-losses at obvious swing highs and lows. Institutional algorithms ("Smart Money") are programmed to push price through these levels to trigger liquidity, fill their heavy orders, and then immediately reverse the market.
If you have ever had your stop hit right before the market moves exactly where you predicted—you were the victim of a Liquidity Trap.
The Solution: Visualizing the "Stop Hunt"
Liquidity Trap Detector Pro is not just a support/resistance indicator. It is a comprehensive Reversal Scoring Engine.
Unlike standard indicators that spam signals on every wick, this tool uses a proprietary 5-Star Scoring System to analyze the quality of the trap. It validates every signal using Wick Symmetry, RSI Divergence, and Volume Analysis to separate a true reversal from a trend continuation.
Key Features (USP)
- 5-Star Scoring Engine: Every signal is rated from 1 to 5 stars. Stop guessing if a signal is valid; let the algorithm check the confluence for you.
- Glassmorphism Visuals: Gone are the messy lines. We use modern, semi-transparent "Liquidity Zones" that keep your chart clean and professional.
- Smart Terminology: Automatically identifies Bull Traps (Buyers trapped at highs) and Bear Traps (Sellers trapped at lows).
- Heads-Up Display (HUD): A professional dashboard monitors the market state, active filters, and recent trap statistics in real-time.
- Strict Non-Repainting: (Technical Note) This script uses strict non-repainting logic. All Higher Timeframe (HTF) data is confirmed and closed before a signal is generated, ensuring historical accuracy.
---
Tutorial: How to Trade This Indicator
1. Understanding the Signals
We use correct institutional terminology to describe the market mechanics:
GREEN Signal (BEAR TRAP):
- What happened: Price swept a Swing Low, enticing sellers (Bears) to enter. The candle then reversed and closed back inside the range, trapping those sellers.
- The Trade: This is a Bullish Reversal setup (Long).
RED Signal (BULL TRAP):
- What happened: Price swept a Swing High, enticing buyers (Bulls) to breakout. The candle reversed and closed lower, trapping the buyers.
- The Trade: This is a Bearish Reversal setup (Short).
2. The 5-Star Scoring System
Not all traps are created equal. The stars tell you how much "Confluence" exists:
- 1 Star: A basic structure sweep. Risky.
- 3 Stars: A solid setup backed by either Volume or Divergence.
- 5 Stars: The "Perfect" Trap. Structure Sweep + RSI Divergence + Volume Spike + Wick Symmetry. High Probability.
3. The Strategy
- Wait for the Zone: Watch price approach a coloured Liquidity Zone.
- Observe the Reaction: Do not trade blindly. Wait for the candle to close.
- Check the Stars: Look for at least 3 Stars before considering an entry.
- Confirm with HUD: Glance at the Dashboard to ensure the "RSI Filter" and "Vol Filter" agree with your analysis.
---
Settings Guide
Structure Settings:
- Pivot Lookback: Adjusts how sensitive the zones are (Default: 10/5).
- HTF Confirmation: Optional filter to only show traps that align with Higher Timeframe structure (e.g., 1H or 4H).
Quality Filters:
- RSI Divergence: Requires momentum to disagree with price (classic reversal sign).
- Volume Spike: Requires volume to be higher than average (Smart Money footprint).
Visuals:
- Clean Mode: A presenter-favorite feature. Hides all historical zones and leaves only the active setup—perfect for taking screenshots or sharing analysis.
Disclaimer
This tool is designed to assist with technical analysis and identifying potential areas of interest. It does not guarantee profits. Trading involves significant risk; always use proper risk management.

Liquidity Maxing [JOAT]Liquidity Maxing - Institutional Liquidity Matrix
Introduction
Liquidity Maxing is an open-source strategy for TradingView built around institutional market structure concepts. It identifies structural shifts, evaluates trades through multi-factor confluence, and implements layered risk controls.
The strategy is designed for swing trading on 4-hour timeframes, focusing on how institutional order flow manifests in price action through structure breaks, inducements, and liquidity sweeps.
Core Functionality
Liquidity Maxing performs three primary functions:
Tracks market structure to identify when control shifts between buyers and sellers
Scores potential trades using an eight-factor confluence system
Manages position sizing and risk exposure dynamically based on volatility and user-defined limits
The goal is selective trading when multiple conditions align, rather than frequent entries.
Market Structure Engine
The structure engine tracks three key events:
Break of Structure (BOS): Price pushes beyond a prior pivot in the direction of trend
Change of Character (CHoCH): Control flips from bullish to bearish or vice versa
Inducement Sweeps (IDM): Market briefly runs stops against trend before moving in the real direction
The structure module continuously updates strong highs and lows, labeling structural shifts visually. IDM markers are optional and disabled by default to maintain chart clarity.
The trade engine requires valid structure alignment before considering entries. No structure, no trade.
Eight-Factor Confluence System
Instead of relying on a single indicator, Liquidity Maxing uses an eight-factor scoring system:
Structure alignment with current trend
RSI within healthy bands (different ranges for up and down trends)
MACD momentum agreement with direction
Volume above adaptive baseline
Price relative to main trend EMA
Session and weekend filter (configurable)
Volatility expansion/contraction via ATR shifts
Higher-timeframe EMA confirmation
Each factor contributes one point to the confluence score. The default minimum confluence threshold is 6 out of 8, but you can adjust this from 1-8 based on your preference for trade frequency versus selectivity.
Only when structure and confluence agree does the strategy proceed to risk evaluation.
Dynamic Risk Management
Risk controls are implemented in multiple layers:
ATR-based stops and targets with configurable risk-to-reward ratio (default 2:1)
Volatility-adjusted position sizing to maintain consistent risk per trade as ranges expand or compress
Daily and weekly risk budgets that halt new entries once thresholds are reached
Correlation cooldown to prevent clustered trades in the same direction
Global circuit breaker with maximum drawdown limit and emergency kill switch
If any guardrail is breached, the strategy will not open new positions. The dashboard clearly displays risk state for transparency.
Market Presets
The strategy includes configuration presets optimized for different market types:
Crypto (BTC/ETH): RSI bands 70/30, volume multiplier 1.2, enhanced ATR scaling
Forex Majors: RSI bands 75/25, volume multiplier 1.5
Indices (SPY/QQQ): RSI bands 70/30, volume multiplier 1.3
Custom: Default values for user customization
For crypto assets, the strategy automatically applies ATR volatility scaling to account for higher volatility characteristics.
Monitoring and Dashboards
The strategy includes optional monitoring layers:
Risk Operations Dashboard (top-right):
Trend state
Confluence score
ATR value
Current position size percentage
Global drawdown
Daily and weekly risk consumption
Correlation guard state
Alert mode status
Performance Console (top-left):
Net profit
Current equity
Win rate percentage
Average trade value
Sharpe-style ratio (rolling 50-bar window)
Profit factor
Open trade count
Optional risk tint on chart background provides visual indication of "safe to trade" versus "halted" state.
All visualization elements can be toggled on/off from the inputs for clean chart viewing or full telemetry during parameter tuning.
Alerts and Automation
The strategy supports alert integration with two formats:
Standard alerts: Human-readable messages for long, short, and risk-halt conditions
Webhook format: JSON-formatted payloads ready for external execution systems (optional)
Alert messages are predictable and unambiguous, suitable for manual review or automated forwarding to execution engines.
Built-in Validation Suite
The strategy includes an optional validation layer that can be enabled from inputs. It checks:
Internal consistency of structure and confluence metrics
Sanity and ordering of risk parameters
Position sizing compliance with user-defined floors and caps
This validation is optional and not required for trading, but provides transparency into system operation during development or troubleshooting.
Strategy Parameters
Market Presets:
Configuration Preset: Choose between Crypto (BTC/ETH), Forex Majors, Indices (SPY/QQQ), or Custom
Market Structure Architecture:
Pivot Length: Default 5 bars
Filter by Inducement (IDM): Default enabled
Visualize Structure: Default enabled
Structure Lookback: Default 50 bars
Risk & Capital Preservation:
Risk:Reward Ratio: Default 2.0
ATR Period: Default 14
ATR Multiplier (Stop): Default 2.0
Max Drawdown Circuit Breaker: Default 10%
Risk per Trade (% Equity): Default 1.5%
Daily Risk Limit: Default 6%
Weekly Risk Limit: Default 12%
Min Position Size (% Equity): Default 0.25%
Max Position Size (% Equity): Default 5%
Correlation Cooldown (bars): Default 3
Emergency Kill Switch: Default disabled
Signal Confluence:
RSI Length: Default 14
Trend EMA: Default 200
HTF Confirmation TF: Default Daily
Allow Weekend Trading: Default enabled
Minimum Confluence Score (0-8): Default 6
Backtesting Considerations
When backtesting this strategy, consider the following:
Commission: Default 0.05% (adjustable in strategy settings)
Initial Capital: Default $100,000 (adjustable)
Position Sizing: Uses percentage of equity (default 2% per trade)
Timeframe: Optimized for 4-hour charts, though can be tested on other timeframes
Results will vary significantly based on:
Market conditions and volatility regimes
Parameter settings, especially confluence threshold
Risk limit configuration
Symbol characteristics (crypto vs forex vs equities)
Past performance does not guarantee future results. Win rate, profit factor, and other metrics should be evaluated in context of drawdown periods, trade frequency, and market conditions.
How to Use This Strategy
This is a framework that requires understanding and parameter tuning, not a one-size-fits-all solution.
Recommended workflow:
Start on 4-hour timeframe with default parameters and appropriate market preset
Run backtests and study performance console metrics: focus on drawdown behavior, win rate, profit factor, and trade frequency
Adjust confluence threshold to match your risk appetite—higher thresholds mean fewer but more selective trades
Set realistic daily and weekly risk budgets appropriate for your account size and risk tolerance
Consider ATR multiplier adjustments based on market volatility characteristics
Only connect alerts or automation after thorough testing and parameter validation
Treat this as a risk framework with an integrated entry engine, not merely an entry signal generator. The risk controls are as important as the trade signals.
Strategy Limitations
Designed for swing trading timeframes; may not perform optimally on very short timeframes
Requires sufficient market structure to identify pivots; may struggle in choppy or low-volatility environments
Crypto markets require different parameter tuning than traditional markets
Risk limits may prevent entries during favorable setups if daily/weekly budgets are exhausted
Correlation cooldown may delay entries that would otherwise be valid
Backtesting results depend on data quality and may not reflect live trading with slippage
Design Philosophy
Many indicators tell you when price crossed a moving average or RSI left oversold. This strategy addresses questions institutional traders ask:
Who is in control of the market right now?
Is this move structurally significant or just noise?
Do I want to add more risk given what I've already done today/week?
If I'm wrong, exactly how painful can this be?
The strategy provides disciplined, repeatable answers to these questions through systematic structure analysis, confluence filtering, and multi-layer risk management.
Technical Implementation
The strategy uses Pine Script v6 with:
Custom types for structure, confluence, and risk state management
Functional programming approach for reusable calculations
State management through persistent variables
Optional visual elements that can be toggled independently
The code is open-source and can be modified to suit individual needs. All important logic is visible in the source code.
Disclaimer
This script is provided for educational and informational purposes only. It is not intended as financial, investment, trading, or any other type of advice or recommendation. Trading involves substantial risk of loss and is not suitable for all investors. Past performance, whether real or indicated by historical tests of strategies, is not indicative of future results.
No representation is being made that any account will or is likely to achieve profits or losses similar to those shown. In fact, there are frequently sharp differences between backtested results and actual results subsequently achieved by any particular trading strategy.
The user should be aware of the risks involved in trading and should trade only with risk capital. The authors and publishers of this script are not responsible for any losses or damages, including without limitation, any loss of profit, which may arise directly or indirectly from use of or reliance on this script.
This strategy uses technical analysis methods and indicators that are not guaranteed to be accurate or profitable. Market conditions change, and strategies that worked in the past may not work in the future. Users should thoroughly test any strategy in a paper trading environment before risking real capital.
Commission and slippage settings in backtests may not accurately reflect live trading conditions. Real trading results will vary based on execution quality, market liquidity, and other factors not captured in backtesting.
The user assumes full responsibility for all trading decisions made using this script. Always consult with a qualified financial advisor before making investment decisions.
Enjoy - officialjackofalltrades

Liquidity Sniper V3 (ANTI-FAKEOUT)An advanced institutional trading indicator combining liquidity pool targeting, smart money concepts, and momentum-based entries with comprehensive risk management.
🎯 CORE FEATURES:
- Liquidity Sniper Module: Identifies and targets major liquidity pools (PDH/PDL, PWH/PWL, Equal Highs/Lows, HVN/LVN edges)
- Anti-Fakeout Stack: 10-layer confirmation system including VWAP reclaim, micro BOS, displacement, relative volume, and mitigation entries
- Momentum Engulf Add-On: Catches high-velocity impulsive moves with engulfing candles, volume spikes, and volatility breakouts
- GARCH Volatility Filter: Dynamic volatility analysis to avoid choppy conditions
- Multi-Timeframe Confirmation: Ensures alignment across timeframes before entries
📊 SIGNAL CLASSIFICATION:
- BEST (Green): Highest probability setups with all confirmations aligned - 6.0+ score
- BETTER (Medium Green): Strong setups with most confirmations - 4.5-6.0 score
- GOOD (Light Green): Valid setups with basic confirmations - 3.0-4.5 score
🔍 TRADE SCENARIOS:
S1: Liquidity Reversal - Sweeps + reversals at key levels with displacement
S2: Continuation - Trend following with VWAP mean reversion
S3: Mean Reversion - Extreme deviations (2σ+) with Fibonacci exhaustion
S4: Deep Sweep - 3σ sweeps at major liquidity with high confluence
⚡ MOMENTUM TRIGGERS:
- MET (Momentum Engulf): Bullish/bearish engulfing with 1.5x+ volume spike and ATR impulse
- VBT (Volatility Breakout): Range breakouts with sigma bursts and participation
🛡️ RISK MANAGEMENT:
- Dynamic TP/SL based on ATR, VWAP bands, and liquidity pools
- 3-tier targets (T1: VWAP, T2: Nearest pool, T3: 5R extension)
- Early invalidation tracking (0.5R movement monitoring)
- Minimum 2:1 RR requirement with cooldown periods
- RTH session filters and anti-spam protection
📈 TECHNICAL EDGE:
- SMT Divergence detection vs ES correlation
- CVD (Cumulative Volume Delta) divergence confirmation
- FVG (Fair Value Gap) and Order Block mitigation entries
- Equal highs/lows clustering analysis
- Volume profile HVN/LVN identification
⚙️ FULLY CUSTOMIZABLE:
All parameters adjustable including cooldowns, proximity thresholds, ATR multipliers, RR floors, and scenario weights.
Perfect for: ES/NQ futures, forex majors, and liquid stocks. Works on 1-15 min timeframes. Best results during NY session (9:35-11:00 AM & 1:30-3:30 PM ET).
Created for serious traders seeking institutional-grade edge with quantifiable risk/reward and high-probability setups

Liquidity Sweep ReversalOverview
The Liquidity Sweep Reversal indicator is a sophisticated intraday trading tool designed to identify high-probability reversal opportunities after liquidity sweeps occur at key market levels. Based on Smart Money Concepts (SMC) and Institutional Order Flow analysis, this indicator helps traders catch market reversals when stop-loss clusters are hunted.
Key Features
🎯 Multi-Level Liquidity Analysis
Previous Day High/Low (PDH/PDL) detection
Previous Week High/Low (PWH/PWL) tracking
Session highs/lows for Asian, London, and New York markets
Real-time level validation and usage tracking
⚡ Advanced Signal Generation
CISD (Change In State of Delivery) detection algorithm
Engulfing pattern recognition at key levels
Liquidity sweep confirmation system
Directional bias filtering to avoid false signals
⏰ Kill Zone Integration
Pre-configured optimal trading windows
Asian Kill Zone (20:00-00:00 EST)
London Kill Zone (02:00-05:00 EST)
New York AM/PM Kill Zones (08:30-11:00 & 13:30-16:00 EST)
Optional kill zone-only trading mode
🛠 Customization Options
Multiple timezone support (NY, London, Tokyo, Shanghai, UTC)
Flexible HTF (Higher Time Frame) selection
Adjustable signal sensitivity
Visual customization for all levels and signals
Hide historical signals option for cleaner charts
How It Works
The indicator continuously monitors price action around key liquidity levels
When price sweeps liquidity (stop-loss hunting), it marks potential reversal zones
Confirmation signals are generated through CISD or engulfing patterns
Trade signals appear as arrows with color-coded candles for easy identification
Best Suited For
Intraday traders focusing on 1m to 15m timeframes
Smart Money Concepts (SMC) practitioners
Scalpers looking for high-probability reversal entries
Traders who understand liquidity and market structure
Usage Tips
Works best on liquid forex pairs and major indices
Combine with volume analysis for stronger confirmation
Use proper risk management - not all signals will be winners
Monitor higher timeframe bias for better accuracy
==============================================
日内流动性掠夺反向开单指标
指标简介
这是一款基于Smart Money概念(SMC)开发的高级日内交易指标,专门用于识别市场在关键价格水平扫除流动性后的反转机会。通过分析机构订单流和流动性分布,帮助交易者精准捕捉止损扫单后的市场反转点。
核心功能
多维度流动性分析
前日高低点(PDH/PDL)自动标记
前周高低点(PWH/PWL)动态跟踪
亚洲、伦敦、纽约三大交易时段高低点识别
关键位使用状态实时监控,避免重复信号
智能信号系统
CISD(Change In State of Delivery)算法检测
关键位吞没形态识别
流动性扫除确认机制
方向过滤系统,大幅降低虚假信号
黄金交易时段
内置Kill Zone时间窗口
支持亚洲、伦敦、纽约AM/PM四个黄金时段
可选择仅在Kill Zone内交易
时区智能切换,全球交易者适用
个性化设置
支持多时区切换(纽约/伦敦/东京/上海/UTC)
HTF周期自动适配或手动选择
信号灵敏度可调
所有图表元素均可自定义样式
历史信号隐藏功能,保持图表整洁
适用人群
日内短线交易者(1分钟-15分钟)
SMC交易体系践行者
追求高胜率反转入场的投机者
理解流动性和市场结构的专业交易者
使用建议
推荐用于主流加密货币、外汇对和股指期货
配合成交量分析效果更佳
严格止损,理性对待每个信号
关注更高时间框架的趋势方向
风险提示: 任何技术指标都不能保证100%准确,请结合自己的交易系统和风险管理使用。

Liquidity-Weighted Business Cycle (Satoshi Global Base)🌍 BTC-Affinity Global Liquidity Business Cycle (MACD Model)
This indicator models Bitcoin’s macroeconomic business cycle using a BTC-weighted global liquidity index as its foundation. It adapts a MACD-based framework to visualize expansions and contractions in fiat liquidity across major economies with high Bitcoin affinity.
🔍 What It Does:
🧠 Constructs a Global M2 Liquidity Index from the top 10 most BTC-relevant fiat currencies
(USD, EUR, JPY, GBP, INR, CNY, KRW, BRL, CAD, AUD)
— each weighted by its Bitcoin adoption score and FX-converted into USD.
📊 Applies a MACD (Moving Average Convergence Divergence) signal to the index to detect macro liquidity trends.
🟢 Plots a histogram of business cycle momentum (red = expansion, green = contraction).
🔴 Marks potential cycle peaks, useful for macro trading alignment.
⚖️ BTC Affinity-Weighted Countries:
🇺🇸 United States
🇪🇺 Eurozone
🇯🇵 Japan
🇬🇧 United Kingdom
🇮🇳 India
🇨🇳 China
🇰🇷 South Korea
🇧🇷 Brazil
🇨🇦 Canada
🇦🇺 Australia
Weights are user-adjustable to reflect evolving capital controls, regulation, and real-world BTC adoption trends.
✅ Use Cases:
Confirm macro risk-on vs risk-off regimes for BTC and crypto.
Identify ideal entry and exit zones in macro pair trades (e.g., MSTR vs MSTY).
Monitor how global monetary expansion feeds into BTC valuations.

Liquidity + Internal Market Shift StrategyLiquidity + Internal Market Shift Strategy
This strategy combines liquidity zone analysis with the internal market structure, aiming to identify high-probability entry points. It uses key liquidity levels (local highs and lows) to track the price's interaction with significant market levels and then employs internal market shifts to trigger trades.
Key Features:
Internal Shift Logic: Instead of relying on traditional candlestick patterns like engulfing candles, this strategy utilizes internal market shifts. A bullish shift occurs when the price breaks previous bearish levels, and a bearish shift happens when the price breaks previous bullish levels, indicating a change in market direction.
Liquidity Zones: The strategy dynamically identifies key liquidity zones (local highs and lows) to detect potential reversal points and prevent trades in weak market conditions.
Mode Options: You can choose to run the strategy in "Both," "Bullish Only," or "Bearish Only" modes, allowing for flexibility based on market conditions.
Stop-Loss and Take-Profit: Customizable stop-loss and take-profit levels are integrated to manage risk and lock in profits.
Time Range Control: You can specify the time range for trading, ensuring the strategy only operates during the desired period.
This strategy is ideal for traders who want to combine liquidity analysis with internal structure shifts for precise market entries and exits.
This description clearly outlines the strategy's logic, the flexibility it provides, and how it works. You can adjust it further to match your personal trading style or preferences!

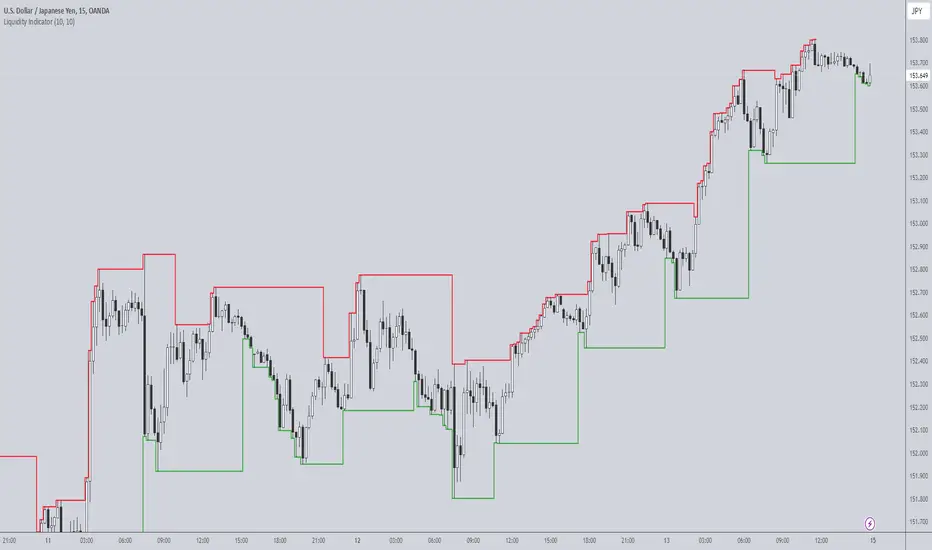
Liquidity IndicatorThe Liquidity Indicator helps identify key price levels where liquidity may be concentrated by highlighting local highs and local lows on the chart. These levels are calculated using a lookback period to determine the highest and lowest points in the recent price action.
Local Highs: Displayed as red lines, these indicate recent peaks where price has experienced rejection or a possible reversal point.
Local Lows: Displayed as green lines, these represent recent troughs where price may find support or experience a bounce.
This indicator is useful for spotting potential areas of interest for price reversal or continuation, as high liquidity zones may lead to more significant price movements.
Key Features:
Adjustable lookback period to define the scope for identifying local highs and lows.
Continuous plotting without any time restrictions, providing real-time insights into liquidity conditions.
Alerts available for when a local high or local low is detected, enabling timely market analysis.
Use Case:
This indicator can be used in conjunction with other technical analysis tools or strategies to help identify significant price levels where liquidity could impact price action. It is suitable for both intraday and swing traders looking for key price zones where potential reversals or continuations might occur.
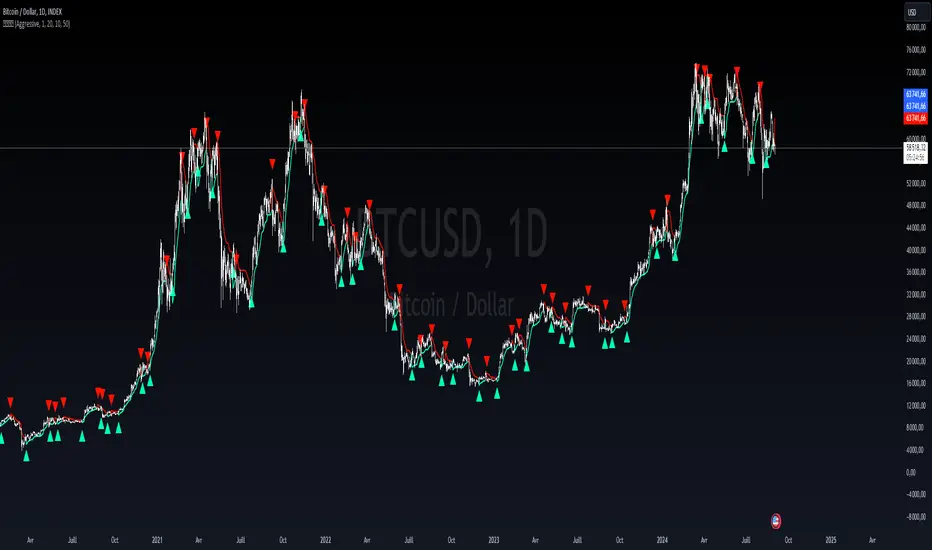
Liquidity weighted SupertrendOverview
The Liquidity Weighted Supertrend Indicator (LWST) is an advanced iteration of the traditional Supertrend indicator, meticulously crafted to improve trend detection by incorporating liquidity into its calculations. By weighting price movements according to trading volume, the LWST becomes more responsive to significant market activities, offering traders a more accurate depiction of market trends.
Indicator Description
The Liquidity Weighted Supertrend Indicator is a versatile and adaptive tool designed to assist traders in recognizing trends and potential reversal points within the market. This indicator features two operational modes: Aggressive and Smoothed, allowing traders to tailor trend detection to their specific trading style and market conditions.
Key Features
Two Supertrend Modes:
Aggressive Mode: This mode offers more responsive signals, ideal for short-term trading. It utilizes an Exponential Moving Average (EMA) to smooth the price data, resulting in quicker reactions to market changes.
Smoothed Mode: This mode provides more stable signals, suitable for longer-term trading, by employing a Simple Moving Average (SMA). Note that when "Smoothed" mode is selected, the "Fast MA length" input is not utilized, focusing instead on producing smoother trend lines.
LWMA Calculation:
The Liquidity Weighted Moving Average (LWMA) is a distinctive feature of the LWST, blending volume and price action to filter out market noise and pinpoint significant price movements. This calculation begins with the liquidity factor, determined by multiplying volume with the price change, which is then smoothed using an EMA for accuracy.
Customizable Parameters:
Factor: Adjusts the Supertrend line's sensitivity to price movements.
Supertrend Length: Defines the lookback period for the Average True Range (ATR) calculation, which affects the width of the Supertrend channel.
Fast and Slow MA Lengths: Allows customization of the fast and slow moving averages used in the LWMA calculation, offering further control over the indicator's responsiveness.
How the Indicator Works
LWMA Smoothing:
The LWST calculates liquidity by multiplying volume with the absolute difference between the close and open prices. This liquidity value is smoothed using an EMA and compared to its standard deviation, identifying significant price movements. Depending on the selected mode, the price data (hl2) is smoothed either with an EMA (in Aggressive Mode) or an SMA (in Smoothed Mode). It’s important to note that when Smoothed mode is active, the "Fast MA length" input does not affect the output.
Visual Signals:
The Supertrend line is visually represented on the chart, with different colors indicating bullish (lime) and bearish (red) trends.
Buy and sell signals are clearly marked with arrows: green triangles indicate potential buying opportunities (when the price crosses above the Supertrend line), and red triangles suggest selling opportunities (when the price crosses below the Supertrend line).
Additional arrows may appear, signaling potential trend reversals, providing further confirmation for traders.
How to Use the Indicator
Configuring the Indicator:
Supertrend Type: Choose between Aggressive and Smoothed modes depending on your trading strategy and the current market conditions. Aggressive mode is better suited for shorter timeframes, while Smoothed mode provides more consistent signals for longer-term analysis.
Factor and Length Settings: Customize the Factor, Supertrend Length, and Moving Average lengths to fine-tune the sensitivity and responsiveness of the Supertrend line, adapting the indicator to various market environments.
Interpreting the Signals:
Trend Identification: The Supertrend line offers a clear visualization of the current market trend. A green line indicates a bullish trend, suggesting upward price movement, while a red line indicates a bearish trend, signaling potential downward price movement.
Entry and Exit Points: The arrows plotted by the LWST provide straightforward entry and exit signals. Green arrows signal potential buy opportunities, indicating that the price may continue to rise, while red arrows signal potential sell opportunities, suggesting that the price may decline. These visual cues help traders make informed decisions based on the current market trend.
Liquidity LevelsThe "Liquidity Levels" indicator on TradingView is designed to identify and highlight liquidity levels in the market. This indicator is based on pivot highs and lows with an adjustable offset to adjust the importance and length of the identified levels.
The strength of this indicator lies in its ability to highlight changes in liquidity levels, which can be crucial for traders. By marking pivot highs and lows, potential areas of high liquidity are highlighted, which can indicate where significant market movements or reversal points may occur.
The flexibility of whether the calculation is based on the closing price or the high/low prices allows for customisable analysis. The visual representation of liquidity levels by lines makes it easier to identify and monitor these key areas in the chart, which can provide additional value for traders.

Liquidity Channel with B/SIndicator - Liquidity Level
Which calculates the liquidity levels based on the highest high and lowest low of the specified period. It determines the middle line, upper line, and lower line of the liquidity channel. The liquidity level is the average of the upper and lower lines, and the liquidity level distance is half of the difference between the upper and lower lines.
Here, the code determines if the conditions for overbought and oversold signals are met. It compares the current closing price with the previous opening price to determine the color of the bar (red or green). If the conditions are met and the bar color matches the expected direction (red for overbought and green for oversold), the respective signals are triggered.
The code plots buy and sell signals on the chart using shape labels. It displays "Buy" labels below the bars for buy signals and "Sell" labels above the bars for sell signals. Additionally, it colors the bars in gray. The code also sets up alert conditions to send notifications when buy or sell signals occur.
*************** Please note that this is a high-level overview of the code's functionality. The specific details and calculations may vary based on the parameters and settings provided in the code.
*************** Remember, trading involves risks, and it's important to thoroughly test any strategy and consider risk management principles before using it in live trading. It's recommended to consult with a knowledgeable financial advisor or professional trader for guidance and assistance in developing and implementing trading strategies.
***************Happy trading..
I will try to share my most commonly used strategies with you as much as possible. For this, you can follow me as a source of motivation, and if you like the indicators, you can give me a rocket to make me happy, my friends! :))

Liquidity Sweep of Candle & Swing @MaxMaserati 3.0MMM Liquidity Sweep Detector for single candle sweep and/or Swing Sweep
Identify liquidity sweeps with precision. A sweep occurs when price wicks through a key level (previous candle high/low or swing point) but closes back inside the range - indicating a failed breakout and potential reversal.
The set includes: Sweep Low, 50% of wick, TGT level
KEY FEATURES:
- Two Detection Modes: Track sweeps on previous candle levels OR swing highs/lows (pivot points)
- Both Mode: View candle and swing sweeps simultaneously
- Visual Clarity: Each sweep displays three extending lines (SWH/SWL, Target, 50% wick), box zone, and swept level with red X marker
- Smart Updates: When price creates new sweep levels without hitting targets, the entire sweep structure automatically relocates to the new level
- Double-Sided Logic: When both sides are swept on one candle, the indicator intelligently places the sweep on the longest wick side
SWEEP DEFINITION:
Bullish Sweep: Price wicks BELOW a low but closes ABOVE it (back inside range)
Bearish Sweep: Price wicks ABOVE a high but closes BELOW it (back inside range)
The indicator only creates sweeps on unviolated levels - levels that haven't been closed through yet. This ensures you're trading genuine liquidity sweeps, not broken levels.
CUSTOMIZATION:
- Adjustable swing lookback period
- Multiple box placement options
- Full color and display controls
- Invalidation options (Sweep High/Low or 50% Wick)
- Statistics panel showing active sweeps and completion rates
Perfect for traders using ICT concepts, Smart Money Theory, or institutional order flow analysis. Identify where large players are hunting liquidity before reversing price.
⚠️ DISCLAIMER
Educational Tool Only - This indicator is for educational and informational purposes only and does not constitute financial, investment, or trading advice.
Risk Warning - Trading involves substantial risk of loss and is not suitable for all investors. Past performance does not guarantee future results. No representation is made that this indicator will achieve profits or prevent losses.
User Responsibility - All trading decisions are solely your responsibility. The developer and Max Maserati Model assume no liability for losses incurred from using this indicator. Conduct your own research and consult a qualified financial advisor before making investment decisions.
By using this indicator, you acknowledge and agree to these terms.

Liquidity Void and Repair EngineLiquidity Void & Repair Engine
OVERVIEW
The Liquidity Void & Repair Engine is a high-fidelity institutional order flow tool designed to identify and track "Market Imbalances" or "Fair Value Gaps" (FVG). Unlike standard gap indicators that clutter the chart with every minor price jump, this engine uses Volatility-Adjusted Range Mapping to isolate high-conviction voids where price moved so rapidly that liquidity was left "unfilled."
The standout feature of this tool is its Active Repair Logic. The engine doesn't just draw static boxes; it monitors price action in real-time to determine when an imbalance has been "healed" by subsequent trading volume, providing a dynamic look at where the market has "unfinished business."
TECHNICAL LOGIC & ORIGINALITY
This script is published Open Source to contribute to the Pine Script community’s understanding of dynamic object management and order flow visualization.
ATR-Relative Filtering: To ensure only significant voids are plotted, the script uses a user-defined ATR (Average True Range) multiplier. This filters out market noise and focuses on institutional "impulse" moves.
Dynamic Box Management: Utilizing the Pine Script box array system, the script manages memory efficiently by updating existing objects rather than creating redundant ones.
The "Repair" Algorithm: The script tracks the high and low of every active void. When price action fully traverses the coordinates of a void, the script "seals" the box, visually marking the moment of liquidity equilibrium.
HOW TO USE
1. Identifying the "Magnet" (The Void)
When price moves aggressively, it leaves a "hole" in the auction.
Bullish Voids (Green): These represent areas where price surged so fast that buyers may still have unfilled orders sitting below. These act as Magnets for pullbacks.
Bearish Voids (Red): These represent areas where price plummeted, leaving a vacuum of selling pressure. These act as Magnets for relief rallies.
2. Trading the "Repair" Process
The Engine tracks how the market "repairs" these holes:
Partial Fill: If price enters a box but doesn't cross it, the "Magnet" is still active.
Full Repair: When a box is "sealed" (stops extending right), it indicates the imbalance is gone. If price "Seals" a green box and then bounces, it confirms the zone as Valid Institutional Support.
3. Confluence with the Trend
Continuation: In a strong uptrend, look for price to drop into a Green Bullish Void and find support. This is often the "Golden Entry" for trend followers.
Reversal Confirmation: If price ignores a Red Bearish Void and blasts right through it (sealing it instantly), it signals a massive shift in market regime and extreme bullish conviction.
USER SETTINGS
Lookback Period: How far back the engine searches for un-repaired gaps.
Min Gap Size (ATR %): Increase this to see only the "Major" institutional gaps; decrease it for a more granular intraday look.
Visual Styles: Fully customizable colors and transparency to match any chart theme (Dark/Light).
NOTES & DISCLAIMER
This script is a visualization of historical price imbalances and is intended for educational purposes only. It does not provide trade signals, entry/exit points, or financial advice. All trading involves risk.

Liquidity Sentiment Profile | LUPENIndicator Guide: Liquidity Sentiment Profile (LSP).
What is the LSP?
The Liquidity Sentiment Profile (LSP) is a "Next-Generation" oscillator designed to look beyond simple price action. While standard indicators (like RSI or MACD) primarily focus on where a candle closes, the LSP analyzes the micro-structure of the entire candle—specifically the relationship between the candle's Body, its Wicks (Shadows), and the Volume.
The Core Philosophy:
Wicks tell the truth: A long lower wick indicates that sellers pushed the price down, but buyers aggressively absorbed that liquidity and pushed it back up.
That is hidden bullish strength.
Volume validates intent: A price move with low volume is noise. A price move (or wick rejection) with high volume is a commitment by institutional players.
The LSP calculates a "Sentiment Score" between -100 and +100 based on these factors.
How to Read the Visuals
The Colors (Intensity)
color: Light Green - Bullish Acceleration. Buyers are in control, and momentum is increasing. This is the ideal time to be in a Long trade.
color: Dark Green - Bullish Deceleration. Buyers are still in control (price is likely rising), but the momentum is fading. This is a warning sign to tighten stop-losses or take profits.
color: Light Red - Bearish Acceleration. Sellers are dominating, and panic is increasing. This is the ideal time to be Short.
color: Dark Red - Bearish Deceleration. Sellers are still in control, but the downward pressure is exhausted. Be careful with new short positions.
The Lines & Fills
The Main Line: The actual LSP sentiment value.
The Yellow Signal Line: A smoothed average of the sentiment.
The Core Fill: The colored area between the Main Line and the Signal Line. When this area "glows", the trend is strong. When it dims (Dark), the trend is weak. Bearish Deceleration. Sellers are still in control, but the downward pressure is exhausted. Be careful with new short positions.
The Lines & Fills
The Main Line: The actual LSP sentiment value.
The Yellow Signal Line: A smoothed average of the sentiment.
The Core Fill: The colored area between the Main Line and the Signal Line. When this area "glows" (Neon), the trend is strong. When it dims (Dark), the trend is weak.
How to Use It (Trading Strategies)
Strategy A: The "Power Cross" (Trend Entry)
Use this for entering trends when the market wakes up.
Long Entry: Wait for the LSP line to cross ABOVE the Yellow Signal Line.
Confirmation: The fill color must turn Neon Green.
Short Entry: Wait for the LSP line to cross BELOW the Yellow Signal Line.
Confirmation: The fill color must turn Neon Red.
Strategy B: The "Absorption" Play (Reversals)
This is where the LSP shines. It detects when liquidity is being absorbed before price turns.
Bullish Absorption: The Price makes a Lower Low, but the LSP makes a Higher Low. This happens because the LSP detects the Volume on the Lower Wicks (buyers absorbing selling pressure). This is a high-probability reversal signal.
Bearish Absorption: The Price makes a Higher High, but the LSP makes a Lower High. The volume on the Upper Wicks suggests sellers are absorbing the buy orders.
Strategy C: The "Dimming" Exit (Risk Management)
Don't wait for the price to crash to exit a trade.
If you are in a Long trade (Neon Green) and the color instantly shifts to Dark Green, it means the "fuel" is running out. Consider taking partial profits or moving your Stop Loss to break even.
Standard oscillators (like RSI) often give false signals during strong trends (showing "Overbought" while price keeps going up). The LSP avoids this because it weights Volume and Wicks. If price goes up and volume increases, the LSP stays Neon Green, telling you the move is genuine, not just overextended.

Liquidity Void Detector + Pro SignalsWhat This Indicator Does
This indicator detects “liquidity voids”—large displacement candles with very high body-to-wick ratios and size significantly above recent ATR—where price moved rapidly and left untested areas.
It automatically draws shaded boxes for new, non-overlapping voids, shows a moveable dashboard (void fill probabilities), and provides one clean, actionable long/short signal per void when price action and momentum confirm.
How It Works
Void Detection: Candles with a body/wick ratio and size above user threshold trigger a potential liquidity void.
Box Drawing: Each new void is drawn as a shaded box (yellow/orange) that never overlaps other active voids.
Signal Confirmation: A “LONG” or “SHORT” label appears at the first bar within each valid void if momentum and candlestick structure align.
Dashboard: User-selectable dashboard shows up-to-date stats on remaining unfilled, partially filled, and fully filled voids.
Alerts: Built-in alerts fire when a new high-probability long/short signal is detected (user must add alerts manually).
Key Features
No overlap, no clutter: Only the latest set of boxes and a single signal per event are drawn. Oldest boxes are pruned automatically.
Momentum filter: Signals combine void and trend strength for higher conviction, filtering out weak/fake moves.
Non-repainting: Signals, boxes, and logic only use confirmed bar data—no repaint or future leaks.
Adjustable settings: Every threshold (body/wick ratio, ATR size, maximum boxes, dashboard location, signal label size) is user-configurable.
Efficient for all timeframes and asset classes.
How to Use
Add to your chart:
Click "Add to Chart" or search “Liquidity Void Detector” in the indicator search panel.
Tune your inputs:
Adjust the Body/Wick Ratio and Min Size vs ATR for your market or timeframe.
Set the Void Box Length (how many bars the box displays), signal sensitivity, and maximum concurrent voids.
Move the dashboard as needed for your chart layout.
What to look for:
Yellow/orange boxes highlight recent liquidity voids—untested price gaps where future reactions may occur.
LONG/SHORT signals appear only where a fresh void coincides with confirmed momentum in that direction.
Dashboard tracks probability of voids remaining unfilled, being partially filled, or fully refilled by price.
Trading logic and best use:
Traders may use void boxes to anticipate where price might react, reverse, or trend continuation can resume.
Combine signals with additional price action confirmation such as S/R levels, order blocks, wick rejections, volume spikes, or patterns (e.g., pin bars, engulfing).
Use signal alerts in conjunction with order flow, session profile, or support/resistance tools for increased confluence.
Always backtest and demo trade before live use.
Important Compliance & Disclaimer
No advice: This tool provides visual context only. All trading and risk decisions are the user’s responsibility.
No repainting, original source: The code is fully open-source, uses only native Pine Script, and never repaints.
No spam, no links, no 3rd-party promotion: 100% TradingView House Rules compliant.
If you find this useful, please consider leaving a positive review, and remember to always confirm with your own analysis.

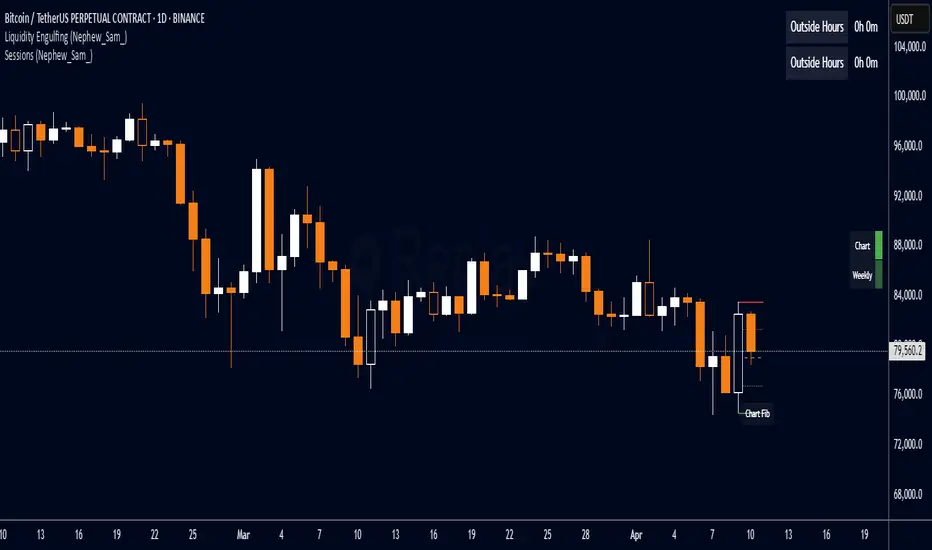
Liquidity Engulfing (Nephew_Sam_)🔥 Liquidity Engulfing Multi-Timeframe Detector
This indicator finds engulfing bars which have swept liquidity from its previous candle. You can use it across 6 timeframes with fibonacci entries.
⚡ Key Features
6 Customizable Timeframes - Complete market structure analysis
Smart Liquidity Detection - Finds patterns that sweep liquidity then reverse
Real-Time Status Table - Confirmed vs unconfirmed patterns with color coding
Fibonacci Integration - 5 customizable fib levels for precise entries
HTF → LTF Strategy - Spot reversals on higher timeframes, enter on lower timeframe fibs
📈 Engulfing Rules
Bullish: Current candle bullish + previous bearish + current low < previous low + current close > previous open
Bearish: Current candle bearish + previous bullish + current high > previous high + current close < previous open
Liquidity Oscillator (Price Impact Proxy)Osc > +60: liquidity is high relative to recent history → slippage tends to be lower.
Osc < -60: liquidity is low → expect worse fills, bigger wicks, easier manipulation.
It’s most useful as a filter (e.g., “don’t enter when liquidity is low”).

Liquidity & Momentum Master (LMM)💎 Liquidity & Momentum Master (LMM)
A professional dual-system indicator that combines:
📦 High-Volume Support/Resistance Zones and
📊 RSI + Bollinger Band Combo Signals — to visualize both smart money footprints and momentum reversals in one clean tool.
🧱 1. High-Volume Liquidity Zones (Support/Resistance Boxes)
Conditions
Visible only on 1H and higher timeframes (1H, 4H, 1D, etc.)
Detects candles with abnormally high volume and strong ATR-based range
Separates bullish (support) and bearish (resistance) zones
Visualization
All boxes are white, with adjustable transparency (alphaW, alphaBorder)
Each box extends to the right automatically
Only the most important (Top-N) zones are kept — weaker ones are removed automatically
Interpretation
White boxes = price areas with heavy liquidity and volume concentration
Price approaching these zones often leads to bounces or rejections
Narrow spacing = consolidation, wide spacing = potential large move
💎 2. RSI Exit + BB-RSI Combo Signals
RSI Exit (Overbought/Oversold Recovery)
RSI drops from overbought (>70) → plots red “RSI” above the candle
RSI rises from oversold (<30) → plots green “RSI” below the candle
Works on 15m, 30m, 1H, 4H, 1D
→ Indicates short-term exhaustion recovery
BB-RSI Combo (Momentum Reversal Confirmation)
Active on 1H and higher only
Requires both:
✅ RSI divergence (bullish or bearish)
✅ Bollinger Band re-entry (after temporary breakout)
Combo Buy (Green Diamond)
Bullish RSI divergence
Candle closes back above lower Bollinger Band
Combo Sell (Red Diamond)
Bearish RSI divergence
Candle closes back below upper Bollinger Band
→ Confirms stronger reversal momentum compared to standard RSI signals

Liquidity Swap Detector Ultimate - Cedric JeanjeanAdvanced Smart Money Concepts indicator designed to detect high-probability liquidity sweeps and institutional order flow reversals. This professional-grade tool combines multiple ICT (Inner Circle Trader) strategies to identify optimal entry points.
═══════════════════════════════════════════════════════
📊 KEY FEATURES:
✅ Smart Swing Detection
- Identifies confirmed swing highs and lows using adaptive lookback periods
- Eliminates false signals through double-confirmation logic
- Detects liquidity grabs at key market structure points
✅ Fair Value Gap (FVG) Analysis
- Multi-timeframe FVG detection for enhanced accuracy
- Filters imbalances by minimum size threshold
- Combines current timeframe and higher timeframe FVGs
✅ Advanced Volatility Filter
- ATR-based volatility analysis to avoid low-quality setups
- Adjustable volatility threshold (default 0.35%)
- Ensures entries during optimal market conditions
✅ Precision Signal Generation
- LONG signals: Confirmed swing lows + FVG + volatility confirmation
- SHORT signals: Confirmed swing highs + FVG + volatility confirmation
- Clear visual markers with price labels
✅ Comprehensive Alert System
- Three alert types: Simple, Detailed, JSON (for webhooks)
- Separate LONG/SHORT alert controls
- Compatible with MT5 integration via webhooks
- TradingView native alertcondition support
✅ Professional Dashboard
- Real-time ATR monitoring
- Volatility percentage display
- FVG status indicator
- Alert status tracker
═══════════════════════════════════════════════════════
⚙️ CUSTOMIZABLE PARAMETERS:
🔹 Lookback Swing (1-50): Defines swing detection sensitivity
🔹 ATR Multiplier: Controls wick filter strength
🔹 Volatility Filter: Minimum required market volatility (%)
🔹 FVG Filter: Minimum fair value gap size (%)
🔹 FVG Timeframe: Higher timeframe for multi-TF analysis
🔹 Visual Options: Toggle swing marks, FVG zones, labels
🔹 Alert Controls: Enable/disable LONG/SHORT notifications
═══════════════════════════════════════════════════════
📈 HOW IT WORKS:
1. The indicator scans for confirmed swing points using a robust double-confirmation algorithm
2. Simultaneously analyzes Fair Value Gaps on both current and higher timeframes
3. Validates market volatility to ensure sufficient price movement
4. Generates precise entry signals when all conditions align
5. Triggers customizable alerts for instant notification
═══════════════════════════════════════════════════════
🎯 BEST PRACTICES:
- Use on liquid markets (Forex majors, indices, crypto)
- Recommended timeframes: 15m, 1H, 4H
- Combine with support/resistance for confirmation
- Adjust lookback period based on market volatility
- Test alert settings before live trading
- Use JSON alerts for automated trading integration
═══════════════════════════════════════════════════════
⚡ ALERT CONFIGURATION:
1. Click the Alert icon (bell) in TradingView
2. Select "Liquidity Swap Detector Ultimate - TITAN v6"
3. Choose your preferred alert condition:
- LONG Signal: Only bullish setups
- SHORT Signal: Only bearish setups
- ANY Signal: All trading opportunities
4. Set expiration and notification preferences
5. For MT5 integration: Select "JSON" message type and configure webhook URL

Liquidity Grab Detector (Stop Hunt Sniper) v2.2📌 Purpose
This indicator detects Stop Hunts (Liquidity Grabs) — false breakouts above/below recent highs or lows — filtered by trend direction, volatility, and volume conditions.
It is designed for scalpers and intraday traders who want to identify high-probability reversal zones.
🧠 How It Works
1. Key Logic
Detects previous swing high / swing low over the Lookback Bars.
Marks a false breakout when price moves beyond the level and closes back inside.
Requires a volume spike on the breakout to confirm liquidity sweep.
2. Trend Filter (EMA 50)
Bullish signals only if price is above EMA 50.
Bearish signals only if price is below EMA 50.
This removes most counter-trend stop hunts.
3. ADX Filter
Signals appear only when ADX < Max ADX (low-trend conditions).
This avoids false signals in strong trending markets.
📈 How to Use
Green Arrows: Bullish stop hunt (potential long entry).
Red Arrows: Bearish stop hunt (potential short entry).
Works best in range conditions, liquidity zones, or near session highs/lows.
Combine with order flow, volume profile, or price action for extra confirmation.
Recommended Timeframes: 1m–15m for scalping; 30m–1h for intraday.
Markets: Crypto, Forex, Indices.
⚙️ Inputs
Lookback Bars — swing detection
Volume Spike Multiplier
EMA Length (trend filter)
Min Retrace — how much price must return inside range
Max ADX — trend filter sensitivity
⚠️ Disclaimer
This script is for educational purposes only and does not constitute financial advice.
Always test thoroughly before live trading.

Liquidity Sweep Reversal [Grimoire]The Liquidity Sweep Reversal indicator is designed to spot potential turning points by watching for “liquidity sweeps” above key prior highs. Specifically, it marks when price briefly pushes above levels such as:
The high of the previous candle
The high of the prior trading day
The high of the previous week
These sweeps often trigger stop-hunts or liquidity hunts, after which price frequently reverses. By highlighting those moments, the indicator helps you anticipate and trade these reversal moves more easily.

Liquidity Hunter: Stop Hunts & Volume ClustersStop Hunt Wick Detection
What it catches:
Wicks that are 2x+ larger than the candle body (adjustable)
Minimum wick size to filter out noise
Optional volume confirmation (stops hunts usually have higher volume)
Marks bullish stop hunts (long lower wicks) with 💎 and "BUY LIQ"
Marks bearish stop hunts (long upper wicks) with 💎 and "SELL LIQ"
Extends dashed lines showing where liquidity was grabbed
Volume Cluster Detection
What it tracks:
Bars with volume 1.5x+ above average (adjustable)
Automatically merges nearby clusters within 3 bars
Shows different colors based on volume intensity:
Yellow = 3x+ average volume (extreme)
Orange = 2x+ average volume (strong)
Blue = 1.5x+ average volume (moderate)
Draws horizontal zones showing where volume accumulated
Labels show the volume multiplier (e.g., "VOL: 2.3x")
Adjustable Settings
You can tune:
Wick-to-body ratio threshold
Minimum wick size percentage
Volume confirmation requirements
Cluster sensitivity and merge distance
The theory: Stop hunts grab liquidity above/below key levels, then price reverses. Volume clusters show where institutions accumulated positions. Both mark areas price is likely to revisit.
Try it out and let me know what needs tweaking!

Liquidity Levels - PMH/PWH/PDH/HODWhat is it?
An indicator that tracks the main liquidity levels on TradingView, displaying the highs and lows of reference for month, week, previous day and current day.
What's it for?
It identifies price zones where there are many pending orders (liquidity). Traders use it to:
Find support and resistance points
Identify areas where price could bounce or break through
Receive alerts when price touches or breaks these levels
Which levels does it show?
LevelDescriptionColorLinePMH/PMLPrevious month's high and lowPurpleSolidPWH/PWLPrevious week's high and lowBlueSolidPDH/PDLPrevious day's high and lowOrangeSolidHOD/LODCurrent day's high and lowGrayDotted
How to use it?
Apply the indicator to your chart
Customize colors and enable/disable the levels you prefer
Set alerts to receive notifications when price touches or breaks levels
Use the levels to make trading decisions (entry, exit, stop loss)
Perfect for: Scalping, Day Trading, Swing Trading on any asset (forex, crypto, stocks)
