Support and Resistance Signals MTF [LuxAlgo]The Support and Resistance Signals MTF indicator aims to identify undoubtedly one of the key concepts of technical analysis Support and Resistance Levels and more importantly, the script aims to capture and highlight major price action movements, such as Breakouts , Tests of the Zones , Retests of the Zones , and Rejections .
The script supports Multi-TimeFrame (MTF) functionality allowing users to analyze and observe the Support and Resistance Levels/Zones and their associated Signals from a higher timeframe perspective.
This script is an extended version of our previously published Support-and-Resistance-Levels-with-Breaks script from 2020.
Identification of key support and resistance levels/zones is an essential ingredient to successful technical analysis.
🔶 USAGE
Support and resistance are key concepts that help traders understand, analyze and act on chart patterns in the financial markets. Support describes a price level where a downtrend pauses due to demand for an asset increasing, while resistance refers to a level where an uptrend reverses as a sell-off happens.
The creation of support and resistance levels comes as a result of an initial imbalance of supply/demand, which forms what we know as a swing high or swing low. This script starts its processing using the swing highs/lows. Swing Highs/Lows are levels that many of the market participants use as a historical reference to place their trading orders (buy, sell, stop loss), as a result, those price levels potentially become and serve as key support and resistance levels.
One of the important features of the script is the signals it provides. The script follows the major price movements and highlights them on the chart.
🔹 Breakouts (non-repaint)
A breakout is a price moving outside a defined support or resistance level, the significance of the breakout can be measured by examining the volume. This script is not filtering them based on volume but provides volume information for the bar where the breakout takes place.
🔹 Retests
Retest is a case where the price action breaches a zone and then revisits the level breached.
🔹 Tests
Test is a case where the price action touches the support or resistance zones.
🔹 Rejections
Rejections are pin bar patterns with high trading volume.
Finally, Multi TimeFrame (MTF) functionality allows users to analyze and observe the Support and Resistance Levels/Zones and their associated Signals from a higher timeframe perspective.
🔶 SETTINGS
The script takes into account user-defined parameters to detect and highlight the zones, levels, and signals.
🔹 Support & Resistance Settings
Detection Timeframe: Set the indicator resolution, the users may examine higher timeframe detection on their chart timeframe.
Detection Length: Swing levels detection length
Check Previous Historical S&R Level: enables the script to check the previous historical levels.
🔹 Signals
Breakouts: Toggles the visibility of the Breakouts, enables customization of the color and the size of the visuals
Tests: Toggles the visibility of the Tests, enables customization of the color and the size of the visuals
Retests: Toggles the visibility of the Retests, enables customization of the color and the size of the visuals
Rejections: Toggles the visibility of the Rejections, enables customization of the color and the size of the visuals
🔹 Others
Sentiment Profile: Toggles the visibility of the Sentiment Profiles
Bullish Nodes: Color option for Bullish Nodes
Bearish Nodes: Color option for Bearish Nodes
🔶 RELATED SCRIPTS
Support-and-Resistance-Levels-with-Breaks
Buyside-Sellside-Liquidity
Liquidity-Levels-Voids
Pesquisar nos scripts por "liquidity"

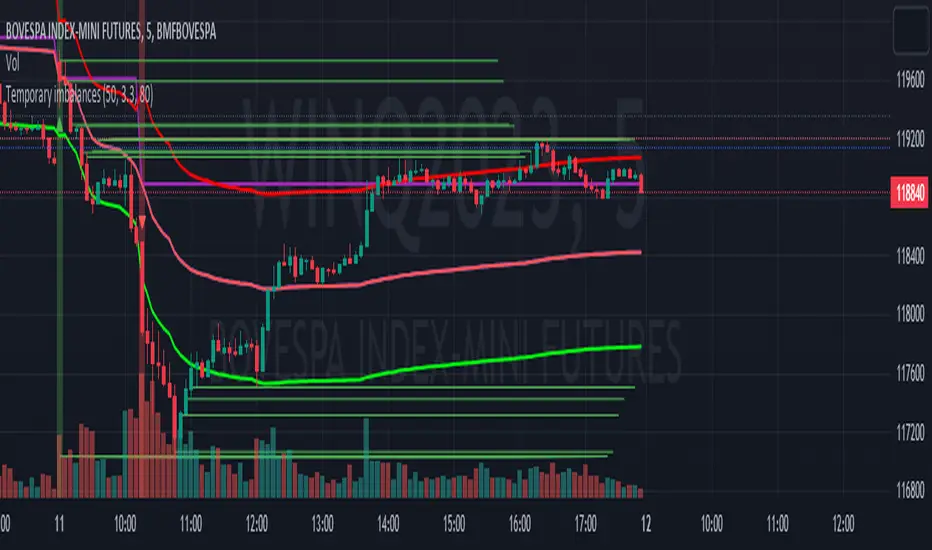
Temporary imbalancesThis indicator is designed to identify imbalances in order flow and market liquidity, It highlights candles with significant imbalances and draws reference lines
The indicator calculates imbalance based on changes in closing prices and volume. It uses the standard deviation to determine the significant imbalance threshold. Candles with bullish imbalances are highlighted in green, while candles with bearish imbalances are highlighted in red.
Furthermore, the indicator includes features of latency arbitrage and liquidity analysis. Latency arbitrage looks for price differences between the anchored VWAP and bid/ask quotes, targeting trading opportunities based on these differences. The liquidity analysis verifies the liquidity imbalance and calculates the VWAP anchored on this value in total using 4 VWAP.
This indicator can be adjusted according to the preferences and characteristics of the specific asset or market. It provides clear visual information and can be used as a complementary tool for technical analysis in trading strategies.
Interesting Segment Length 20,50,80,200
and Interesting lookback period 20,50,80,200
Interesting imbalance threshold 1.5, 2.4, 3.3 ,4.2
Este indicador é projetado para identificar desequilíbrios no fluxo de ordens e na liquidez do mercado, Ele destaca velas com desequilíbrios significativos e traça linhas de referência
O indicador calcula o desequilíbrio com base nas mudanças nos preços de fechamento e no volume. Ele usa o desvio padrão para determinar o limiar de desequilíbrio significativo. As velas com desequilíbrios de alta são destacadas em verde, enquanto as velas com desequilíbrios de baixa são destacadas em vermelho.
Além disso, o indicador inclui recursos de arbitragem de latência e análise de liquidez. A arbitragem de latência procura diferenças de preços entre a VWAP ancorada e as cotações de compra/venda, visando oportunidades de negociação com base nessas diferenças. A análise de liquidez verifica o desequilíbrio de liquidez e calcula a VWAP ancorada nesse valor ao total utiliza 4 VWAP.
Este indicador pode ser ajustado de acordo com as preferências e características do ativo ou mercado específico. Ele fornece informações visuais claras e pode ser usado como uma ferramenta complementar para análise técnica em estratégias de negociação.
Comprimento do Segmento interessante para usa 20,50,80,200
e Período de lookback interessante para usa 20,50,80,200
Limiar de desequilíbrio interessante para usa 1.5 ,2.4, 3.3 ,4.2
CBDE OscillatorWhat makes The Universe grow at an accelerating pace?
Dark Energy.
What makes The Economy grow at an accelerating pace?
Debt.
Debt is the Dark Energy of The Economy.
The Central Bank Dark Energy Oscillator (CBDEO) is a companion to the popular CBDET (Central Bank Dark Energy Tracer) script.
CBDEO is an oscillator that shows up in a separate TradingView pane in order to provide a relative change signal. It uses the same equations to aggregate central bank liquidity that are used in CBDET, and adds unique analysis tools that provide rate of change data.
There are 2 signals in the chart. First is the change/delta on a per bar basis, based on the chart time frame. The default style for this plot is "columns". This style parameter can be changed in the settings, along with each plot's visibility.
The second plot is a divergence signal that tests the change vs a simple moving average of the CBDET signal (central bank liquidity). The SMA length is customizable in the Input tab within the settings for the indicator. The SMA is based on the chart's current time frame.
The changes in liquidity on various time frames, and calculated as divergence against the liquidity signal SMA can be useful in determining the rate of change in liquidity, and therefore potential thrust in market price action.

Smart Money Concepts (SMC) [LuxAlgo]This all-in-one indicator displays real-time market structure (internal & swing BOS / CHoCH), order blocks, premium & discount zones, equal highs & lows, and much more...allowing traders to automatically mark up their charts with widely used price action methodologies. Following the release of our Fair Value Gap script, we received numerous requests from our community to release more features in the same category.
"Smart Money Concepts" (SMC) is a fairly new yet widely used term amongst price action traders looking to more accurately navigate liquidity & find more optimal points of interest in the market. Trying to determine where institutional market participants have orders placed (buy or sell side liquidity) can be a very reasonable approach to finding more practical entries & exits based on price action.
The indicator includes alerts for the presence of swing structures and many other relevant conditions.
Features
This indicator includes many features relevant to SMC, these are highlighted below:
Full internal & swing market structure labeling in real-time
Break of Structure (BOS)
Change of Character (CHoCH)
Order Blocks (bullish & bearish)
Equal Highs & Lows
Fair Value Gap Detection
Previous Highs & Lows
Premium & Discount Zones as a range
Options to style the indicator to more easily display these concepts
Settings
Mode: Allows the user to select Historical (default) or Present, which displays only recent data on the chart.
Style: Allows the user to select different styling for the entire indicator between Colored (default) and Monochrome.
Color Candles: Plots candles based on the internal & swing structures from within the indicator on the chart.
Internal Structure: Displays the internal structure labels & dashed lines to represent them. (BOS & CHoCH).
Confluence Filter: Filter non-significant internal structure breakouts.
Swing Structure: Displays the swing structure labels & solid lines on the chart (larger BOS & CHoCH labels).
Swing Points: Displays swing points labels on chart such as HH, HL, LH, LL.
Internal Order Blocks: Enables Internal Order Blocks & allows the user to select how many most recent Internal Order Blocks appear on the chart.
Swing Order Blocks: Enables Swing Order Blocks & allows the user to select how many most recent Swing Order Blocks appear on the chart.
Equal Highs & Lows: Displays EQH/EQL labels on chart for detecting equal highs & lows.
Bars Confirmation: Allows the user to select how many bars are needed to confirm an EQH/EQL symbol on chart.
Fair Value Gaps: Displays boxes to highlight imbalance areas on the chart.
Auto Threshold: Filter out non-significant fair value gaps.
Timeframe: Allows the user to select the timeframe for the Fair Value Gap detection.
Extend FVG: Allows the user to choose how many bars to extend the Fair Value Gap boxes on the chart.
Highs & Lows MTF: Allows the user to display previous highs & lows from daily, weekly, & monthly timeframes as significant levels.
Premium/Discount Zones: Allows the user to display Premium, Discount, and Equilibrium zones on the chart
Usage
Users can see automatic CHoCH and BOS labels to highlight breakouts of market structure, which allows to determine the market trend. In the chart below we can see the internal structure which displays more frequent labels within larger structures. We can also see equal highs & lows (EQH/EQL) labels plotted alongside the internal structure to frequently give indications of potential reversals.
In the chart below we can see the swing market structure labels. These are also labeled as BOS and CHoCH but with a solid line & larger text to show larger market structure breakouts & trend reversals. Users can be mindful of these larger structure labels while trading internal structures as displayed in the previous chart.
Order blocks highlight areas where institutional market participants open positions, one can use order blocks to determine confirmation entries or potential targets as we can expect there is a large amount of liquidity at these order blocks. In the chart below we can see 2 potential trade setups with confirmation entries. The path outlined in red would be a potential short entry targeting the blue order block below, and the path outlined in green would be a potential long entry, targeting the red order blocks above.
As we can see in the chart below, the bullish confirmation entry played out in this scenario with the green path outlined in hindsight. As price breaks though the order blocks above, the indicator will consider them mitigated causing them to disappear, and as per the logic of these order blocks they will always display 5 (by default) on the chart so we can now see more actionable levels.
The Smart Money Concepts indicator has many other features and here we can see how they can also help a user find potential levels for price action trading. In the screenshot below we can see a trade setup using the Previous Monthly High, Strong High, and a Swing Order Block as a stop loss. Accompanied by the Premium from the Discount/Premium zones feature being used as a potential entry. A potential take profit level for this trade setup that a user could easily identify would be the 50% mark labeled with the Fair Value Gap & the Equilibrium all displayed automatically by the indicator.
Conclusion
This indicator highlights all relevant components of Smart Money Concepts which can be a very useful interpretation of market structure, liquidity, & more simply put, price action. The term was coined & popularized primarily within the forex community & by ICT while making its way to become a part of many traders' analysis. These concepts, with or without this indicator do not guarantee a trader to be trading within the presence of institutional or "bank-level" liquidity, there is no supporting data regarding the validity of these teachings.

MTF Market Structure Highs and LowsThe indicator marks the last fractal highs and lows (W,D,4H and 1H options) to help determine current market structure. The script was created to help with directional bias but also as a MTF visual aid for stop hunts/liquidity raids.
Liquidity areas are where we assume trader's stop losses would be when buying or selling. Liquidity lies above and below swing points and institutions need liquidity to fill large orders.
Monitor price action as it hits these areas for a potential reversal trade.

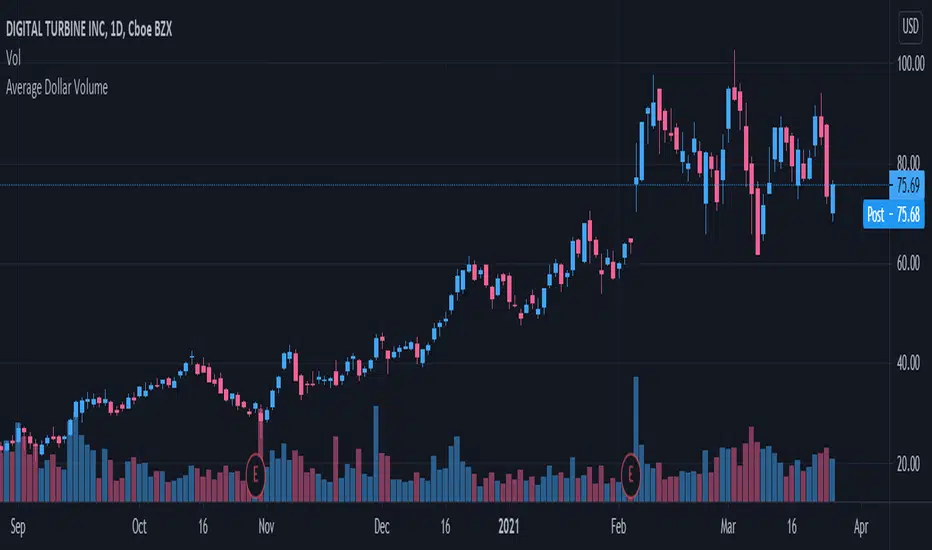
Volume Indicators PackageCONTAINS 3 OF MY BEST VOLUME INDICATORS ALL FOR THE PRICE OF ONE!
CONTAINS:
Average Dollar Volume in RED
Up/Down Volume Ratio in Green
Volume Buzz/Volume Run Rate in BLUE
If you would like to get these individually, I also have scripts for that too.
Below is information about all three of these indicators, what they do, and why they are important.
---------------------------------------------------------------------------------------------AVERAGE DOLLAR VOLUME----------------------------------------------------------------------------------------
Dollar volume is simply the volume traded multiplied times the cost of the stock.
Dollar volume is an extremely important metric for finding stocks with enough liquidity for market makers to position themselves in. Market Liquidity is defined as market's feature whereby an individual or firm can quickly purchase or sell an asset without causing a drastic change in the asset's price. The key concept you want to understand is that these big instructions with billions of dollars need liquidity in a stock in order to even think about buying it, and therefore these institutions will demand a large dollar volume . A good dollar volume amount, that represents a pretty liquid name, is typically above 100 million $ average. Why are institutions important? Simple because they are the ones who make stocks move, and I mean really move. If you want to see large growth from a stock in a short amount of time, you need institutions wielding billions of dollars to be fighting one another to buy more shares. Institutions are the ones who make or break a stock, this is why we call them market makers.
My script calculates average dollar volume using four averages: the 50, the 30, the 20, and the 10 period. I use multiple averages in order to provide the accurate and up to date information to you. It then selects the minimum of these averages and divides this value by 1 million and displays this number to you.
TL;DR? If you want monster moves from your stocks, you need to pick names with average high liquidity(dollar volume >= $100 million). The number presented to you is in millions of whatever currency the name is traded in.
---------------------------------------------------------------------------------------------UP/DOWN VOLUME RATIO-----------------------------------------------------------------------------------------
Up/Down Volume Ratio is calculated by summing volume on days when it closes up and divide that total by the volume on days when the stock closed down.
High volume up days are typically a sign of accumulation(buying) by big players, while down days are signs of distribution(selling) by big market players. The Up Down volume ratio takes this assumption and turns it into a tangible number that's easier for the trader to understand. My formula is calculated using the past 50 periods, be warned it will not display a value for stocks with under 50 periods of trading history. This indicator is great for identify accumulation of growth stocks early on in their moves, most of the time you would like a growth stocks U/D value to be above 2, showing institutional sponsorship of a stock.
Up/Down Volume value interpretation:
U/D < 1 -> Bearish outlook, as sellers are in control
U/D = 1 -> Sellers and Buyers are equal
U/D > 1 -> Bullish outlook, as buyers are in control
U/D > 2 -> Bullish outlook, significant accumulation underway by market makers
U/D >= 3 -> MONSTER STOCK ALERT, market makers can not get enough of this stock and are ravenous to buy more
U/D values greater than 2 are rare and typically do not last very long, and U/D >= 3 are extremely rare one example I kind find of a stock's U/D peaking above 3 was Google back in 2005.
-----------------------------------------------------------------------------------------------------VOLUME BUZZ-----------------------------------------------------------------------------------------------
Volume Buzz/ Volume Run Rate as seen on TC2000 and MarketSmith respectively.
Basically, the volume buzz tells you what percentage over average(100 time period moving average) the volume traded was. You can use this indicator to more readily identify above-average trading volume and accumulation days on charts. The percentage will show up in the top left corner, make sure to click the settings button and uncheck the second box(left of plot) in order to get rid of the chart line.

Average Dollar VolumeDollar volume is simply the volume traded multiplied times the cost of the stock.
Dollar volume is an extremely important metric for finding stocks with enough liquidity for market makers to position themselves in. Market Liquidity is defined as market's feature whereby an individual or firm can quickly purchase or sell an asset without causing a drastic change in the asset's price. The key concept you want to understand is that these big instructions with billions of dollars need liquidity in a stock in order to even think about buying it, and therefore these institutions will demand a large dollar volume. A good dollar volume amount, that represents a pretty liquid name, is typically above 100 million $ average. Why are institutions important? Simple because they are the ones who make stocks move, and I mean really move. If you want to see large growth from a stock in a short amount of time, you need institutions wielding billions of dollars to be fighting one another to buy more shares. Institutions are the ones who make or break a stock, this is why we call them market makers.
My script calculates average dollar volume using four averages: the 50, the 30, the 20, and the 10 period. I use multiple averages in order to provide the accurate and up to date information to you. It then selects the minimum of these averages and divides this value by 1 million and displays this number to you.
TL;DR? If you want monster moves from your stocks, you need to pick names with average high liquidity(dollar volume >= $100 million). The number presented to you is in millions of whatever currency the name is traded in.
DePriExchange weighted price for cryptocurrencies
DECENTRALIZED PRICE CHART FOR DECENTRALIZED WORLD
See non-manipulated , globally price action that comes from whole liquidity!
The main idea behind this script is that...
The value of each trading pair finally determined globally and the price displayed in exchanges is its own and not global! differences between exchanges, reduced to near zero gradually by market makers and arbitrages, so..
Every min tick price changes Must be backed by liquidity to be part of the global fluctuations
more liquidity gives it more credibility
more credibility give it more weight
..Against opposing movements.
This script can collect price of crypto pairs from 12 exchanges that listed on TV and have effective volume.
In the first step, summarizes the volume of all exchanges and creates the total volume
In the next step, divide each exchange volume to total volume to obtain relative weight of each exchange.
In the final step, multiply each exchange price to weight of itself and summarizes these numbers .. now, we have Exchange weighted price!
The results on high liquidity pairs like BTCUSDT, ETHUSDT, is not much differ then simple chart but when you apply it on lower liquidity, lower time frames of altcoins, you realize its benefits and usefulness. Altcoins chart in composite and simple mode is very differ, I hope you enjoy from TRUE CHART.
With this, also you can..
Filter and smooth candlestick chart with SMA or EMA
Plot a line chart of pair at your desired frame separate from the main chart for monitor important price levels
Get realtime report of whole volume of pair on included exchanges
Get realtime report of each exchange weight and share
Note.1:
some of pairs queted on more than one like BTCUSD, BTCUSDT, BTCUSDC and etc. In this pairs we choose the one that usually has more volume on that exchange.
Note.2:
At this time, supported queted currencies are BTC, ETH, USD, USDT, BUSD, USDC, USDK.
Note.3:
This script is relatively heavy! This is not cuz of bad coding.
Each bar compution contains at least one plot and some of security calls, so 10 to 15 seconds is normal load time.
Note.4:
You can combine this with your price action base scripts and use balanced OHLCV. The necessary explanations about this are available in the code.
Note.5:
You must only include exchanges that support your ticker, Otherwise you will receive an error.
I hope it comes useful to you.

BTC Energy + HR + Longs + M2
BTC Energy Ratio + Hashrate + Longs + M2
The #1 Bitcoin Macro Weapon on TradingView 🚀🔥
If you’re tired of getting chopped by fakeouts, ETF noise, and Twitter hopium — this is the one chart that finally puts you on the right side of every major move.
What you’re looking at:
Orange line → Bitcoin priced in real-world mining energy (Oil × Gas + Uranium × Coal) × 1000
→ The true fundamental floor of BTC
Blue line → Scaled hashrate trend (miner strength & capex lag)
Green line → Bitfinex longs EMA (leveraged bull sentiment)
Purple line → Global M2 money supply (US+EU+CN+JP) with 10-week lead (the liquidity wave BTC rides)
Why this indicator prints money:
Most tools react to price.
This one predicts where price is going based on energy, miners, leverage, and liquidity — the only four things that actually drive Bitcoin long-term.
It has nailed:
2022 bottom at ~924 📉
2024 breakout above 12,336 🚀
2025 top at 17,280 🏔️
And right now it’s flashing generational accumulation at ~11,500 (Nov 2025)
13 permanent levels with right-side labels — no guessing what anything means:
20,000 → 2021 Bull ATH
17,280 → 2025 ATH
15,000 → 2024 High Resist
14,000 → Overvalued Zone
13,000 → 2024 Breakout
12,336 → Bull/Bear Line (the most important level)
12,000 → 2024 Volume POC
10,930 → Key Support 2024
9,800 → Strong Buy Fib
8,000 → Deep Support 2023
6,000 → 2021 Mid-Cycle
4,500 → 2023 Accum Low
924 → 2022 Bear Low
Live dashboard tells you exactly what to do — no thinking required:
Current ratio (updates live)
Hashrate + 24H %
Longs trend
Risk Mode → Orange vs Hashrate (RISK ON / RISK OFF)
180-day correlation
RSI
13-tier Zone + SIGNAL (STRONG BUY / ACCUMULATE / HOLD / DISTRIBUTE / EXTREME SELL)
Dead-simple rules that actually work:
Weekly timeframe = cleanest view
Blue peaking + orange holding support → miner pain = next leg up
Green spiking + orange failing → overcrowded longs = trim
Purple rising → liquidity coming in = ride the wave
Risk Mode = RISK OFF → price is cheap vs miners → buy
Set these 3 alerts and walk away:
Ratio > 12,336 → Bull confirmed → add
Ratio > 14,000 → Start scaling out
Ratio < 9,800 → Generational buy → back up the truck
No repainting • Fully open-source • Forced daily data • Works on any TF
Energy is the only real backing Bitcoin has.
Hashrate lag is the best leading indicator.
Longs show greed.
M2 is the tide.
This chart combines all four — and right now it’s screaming ACCUMULATE.
Load it. Trust it.
Stop trading hope. Start trading reality.
DYOR • NFA • For entertainment purposes only 😎
#bitcoin #macro #energy #hashrate #m2 #cycle #riskon #riskoff

BTC Macro Heatmap (Fed Cuts & Hikes)🔴 1. Red line – Fed Funds Rate (policy trend)
This line tells you what stage of the monetary cycle we’re in.
Rising red line = the Fed is hiking → liquidity is tightening → money leaves risk assets like BTC.
Flat = pause → markets start pricing in the next move (often sideways BTC).
Falling = easing / cutting → liquidity returns → bullish environment builds.
The rate of change matters more than the level. When the slope turns down, capital starts seeking yield again — BTC benefits first because it’s the most volatile asset.
💚 2. Dim green zones – detected cuts
These are data-based easing events pulled directly from FRED.
They show when the actual effective rate began moving down, not necessarily the exact meeting day.
Think of them as the Fed’s “foot off the brake” — that’s when risk markets begin responding.
🟩 3. Bright green lines – official FOMC cuts
These are the real policy shifts — the Fed formally changed direction.
After these appear, BTC historically transitions from accumulation → markup phase.
Look at 2020: the bright green lines came right before BTC’s full reversal.
You’re seeing the same thing now with the 2025 lines — early-stage liquidity return.
🟠 4. Orange line – DXY (US Dollar Index)
DXY is your “risk-off” gauge.
When DXY rises, global investors flock to dollars → BTC usually weakens.
When DXY peaks and starts dropping, it means risk appetite is coming back → BTC rallies.
BTC and DXY are inversely correlated about 70–80% of the time.
Watch for DXY lower highs after rate cuts — that’s your macro confirmation of a BTC-friendly environment.
🟦 5. Aqua line – BTC (normalized)
You’re not looking for the price itself here, but its shape relative to DXY and the Fed line.
When BTC curls up as the red line flattens and DXY rolls over → that’s historically the start of a major bull phase.
BTC tends to bottom before the first cut and explode once DXY decisively breaks down.
🧠 Putting it together
Here’s the rhythm this chart shows over and over:
Fed hikes (red line rising) → BTC weakens, DXY climbs.
Fed pauses (red line flat) → BTC stops falling, DXY tops.
Fed cuts (dim + bright green) → DXY turns down → BTC begins long recovery → bull cycle starts.

Bifurcation Zone - CAEBifurcation Zone — Cognitive Adversarial Engine (BZ-CAE)
Bifurcation Zone — CAE (BZ-CAE) is a next-generation divergence detection system enhanced by a Cognitive Adversarial Engine that evaluates both sides of every potential trade before presenting signals. Unlike traditional divergence indicators that show every price-oscillator disagreement regardless of context, BZ-CAE applies comprehensive market-state intelligence to identify only the divergences that occur in favorable conditions with genuine probability edges.
The system identifies structural bifurcation points — critical junctures where price and momentum disagree, signaling potential reversals or continuations — then validates these opportunities through five interconnected intelligence layers: Trend Conviction Scoring , Directional Momentum Alignment , Multi-Factor Exhaustion Modeling , Adversarial Validation , and Confidence Scoring . The result is a selective, context-aware signal system that filters noise and highlights high-probability setups.
This is not a "buy the arrow" indicator. It's a decision support framework that teaches you how to read market state, evaluate divergence quality, and make informed trading decisions based on quantified intelligence rather than hope.
What Sets BZ-CAE Apart: Technical Architecture
The Problem With Traditional Divergence Indicators
Most divergence indicators operate on a simple rule: if price makes a higher high and RSI makes a lower high, show a bearish signal. If price makes a lower low and RSI makes a higher low, show a bullish signal. This creates several critical problems:
Context Blindness : They show counter-trend signals in powerful trends that rarely reverse, leading to repeated losses as you fade momentum.
Signal Spam : Every minor price-oscillator disagreement generates an alert, overwhelming you with low-quality setups and creating analysis paralysis.
No Quality Ranking : All signals are treated identically. A marginal divergence in choppy conditions receives the same visual treatment as a high-conviction setup at a major exhaustion point.
Single-Sided Evaluation : They ask "Is this a good long?" without checking if the short case is overwhelmingly stronger, leading you into obvious bad trades.
Static Configuration : You manually choose RSI 14 or Stochastic 14 and hope it works, with no systematic way to validate if that's optimal for your instrument.
BZ-CAE's Solution: Cognitive Adversarial Intelligence
BZ-CAE solves these problems through an integrated five-layer intelligence architecture:
1. Trend Conviction Score (TCS) — 0 to 1 Scale
Most indicators check if ADX is above 25 to determine "trending" conditions. This binary approach misses nuance. TCS is a weighted composite metric:
Formula : 0.35 × normalize(ADX, 10, 35) + 0.35 × structural_strength + 0.30 × htf_alignment
Structural Strength : 10-bar SMA of consecutive directional bars. Captures persistence — are bulls or bears consistently winning?
HTF Alignment : Multi-timeframe EMA stacking (20/50/100/200). When all EMAs align in the same direction, you're in institutional trend territory.
Purpose : Quantifies how "locked in" the trend is. When TCS exceeds your threshold (default 0.80), the system knows to avoid counter-trend trades unless other factors override.
Interpretation :
TCS > 0.85: Very strong trend — counter-trading is extremely high risk
TCS 0.70-0.85: Strong trend — favor continuation, require exhaustion for reversals
TCS 0.50-0.70: Moderate trend — context matters, both directions viable
TCS < 0.50: Weak/choppy — reversals more viable, range-bound conditions
2. Directional Momentum Alignment (DMA) — ATR-Normalized
Formula : (EMA21 - EMA55) / ATR14
This isn't just "price above EMA" — it's a regime-aware momentum gauge. The same $100 price movement reads completely differently in high-volatility crypto versus low-volatility forex. By normalizing with ATR, DMA adapts its interpretation to current market conditions.
Purpose : Quantifies the directional "force" behind current price action. Positive = bullish push, negative = bearish push. Magnitude = strength.
Interpretation :
DMA > 0.7: Strong bullish momentum — bearish divergences risky
DMA 0.3 to 0.7: Moderate bullish bias
DMA -0.3 to 0.3: Balanced/choppy conditions
DMA -0.7 to -0.3: Moderate bearish bias
DMA < -0.7: Strong bearish momentum — bullish divergences risky
3. Multi-Factor Exhaustion Modeling — 0 to 1 Probability
Single-metric exhaustion detection (like "RSI > 80") misses complex market states. BZ-CAE aggregates five independent exhaustion signals:
Volume Spikes : Current volume versus 50-bar average
2.5x average: 0.25 weight
2.0x average: 0.15 weight
1.5x average: 0.10 weight
Divergence Present : The fact that a divergence exists contributes 0.30 weight — structural momentum disagreement is itself an exhaustion signal.
RSI Extremes : Captures oscillator climax zones
RSI > 80 or < 20: 0.25 weight
RSI > 75 or < 25: 0.15 weight
Pin Bar Detection : Identifies rejection candles (2:1 wick-to-body ratio, indicating failed breakout attempts): 0.15 weight
Extended Runs : Consecutive bars above/below EMA20 without pullback
30+ bars: 0.15 weight (market hasn't paused to consolidate)
Total exhaustion score is the sum of all applicable weights, capped at 1.0.
Purpose : Detects when strong trends become vulnerable to reversal. High exhaustion can override trend filters, allowing counter-trend trades at genuine turning points that basic indicators would miss.
Interpretation :
Exhaustion > 0.75: High probability of climax — yellow background shading alerts you visually
Exhaustion 0.50-0.75: Moderate overextension — watch for confirmation
Exhaustion < 0.50: Fresh move — trend can continue, counter-trend trades higher risk
4. Adversarial Validation — Game Theory Applied to Trading
This is BZ-CAE's signature innovation. Before approving any signal, the engine quantifies BOTH sides of the trade simultaneously:
For Bullish Divergences , it calculates:
Bull Case Score (0-1+) :
Distance below EMA20 (pullback quality): up to 0.25
Bullish EMA alignment (close > EMA20 > EMA50): 0.25
Oversold RSI (< 40): 0.25
Volume confirmation (> 1.2x average): 0.25
Bear Case Score (0-1+) :
Price below EMA50 (structural weakness): 0.30
Very oversold RSI (< 30, indicating knife-catching): 0.20
Differential = Bull Case - Bear Case
If differential < -0.10 (default threshold), the bear case is dominating — signal is BLOCKED or ANNOTATED.
For Bearish Divergences , the logic inverts (Bear Case vs Bull Case).
Purpose : Prevents trades where you're fighting obvious strength in the opposite direction. This is institutional-grade risk management — don't just evaluate your trade, evaluate the counter-trade simultaneously.
Why This Matters : You might see a bullish divergence at a local low, but if price is deeply below major support EMAs with strong bearish momentum, you're catching a falling knife. The adversarial check catches this and blocks the signal.
5. Confidence Scoring — 0 to 1 Quality Assessment
Every signal that passes initial filters receives a comprehensive quality score:
Formula :
0.30 × normalize(TCS) // Trend context
+ 0.25 × normalize(|DMA|) // Momentum magnitude
+ 0.20 × pullback_quality // Entry distance from EMA20
+ 0.15 × state_quality // ADX + alignment + structure
+ 0.10 × divergence_strength // Slope separation magnitude
+ adversarial_bonus (0-0.30) // Your side's advantage
Purpose : Ranks setup quality for filtering and position sizing decisions. You can set a minimum confidence threshold (default 0.35) to ensure only quality setups reach your chart.
Interpretation :
Confidence > 0.70: Premium setup — consider increased position size
Confidence 0.50-0.70: Good quality — standard size
Confidence 0.35-0.50: Acceptable — reduced size or skip if conservative
Confidence < 0.35: Marginal — blocked in Filtering mode, annotated in Advisory mode
CAE Operating Modes: Learning vs Enforcement
Off : Disables all CAE logic. Raw divergence pipeline only. Use for baseline comparison.
Advisory : Shows ALL signals regardless of CAE evaluation, but annotates signals that WOULD be blocked with specific warnings (e.g., "Bull: strong downtrend (TCS=0.87)" or "Adversarial bearish"). This is your learning mode — see CAE's decision logic in action without missing educational opportunities.
Filtering : Actively blocks low-quality signals. Only setups that pass all enabled gates (Trend Filter, Adversarial Validation, Confidence Gating) reach your chart. This is your live trading mode — trust the system to enforce discipline.
CAE Filter Gates: Three-Layer Protection
When CAE is enabled, signals must pass through three independent gates (each can be toggled on/off):
Gate 1: Strong Trend Filter
If TCS ≥ tcs_threshold (default 0.80)
And signal is counter-trend (bullish in downtrend or bearish in uptrend)
And exhaustion < exhaustion_required (default 0.50)
Then: BLOCK signal
Logic: Don't fade strong trends unless the move is clearly overextended
Gate 2: Adversarial Validation
Calculate both bull case and bear case scores
If opposing case dominates by more than adv_threshold (default 0.10)
Then: BLOCK signal
Logic: Avoid trades where you're fighting obvious strength in the opposite direction
Gate 3: Confidence Gating
Calculate composite confidence score (0-1)
If confidence < min_confidence (default 0.35)
Then: In Filtering mode, BLOCK signal; in Advisory mode, ANNOTATE with warning
Logic: Only take setups with minimum quality threshold
All three gates work together. A signal must pass ALL enabled gates to fire.
Visual Intelligence System
Bifurcation Zones (Supply/Demand Blocks)
When a divergence signal fires, BZ-CAE draws a semi-transparent box extending 15 bars forward from the signal pivot:
Demand Zones (Bullish) : Theme-colored box (cyan in Cyberpunk, blue in Professional, etc.) labeled "Demand" — marks where smart money likely placed buy orders as price diverged at the low.
Supply Zones (Bearish) : Theme-colored box (magenta in Cyberpunk, orange in Professional) labeled "Supply" — marks where smart money likely placed sell orders as price diverged at the high.
Theory : Divergences represent institutional disagreement with the crowd. The crowd pushed price to an extreme (new high or low), but momentum (oscillator) is waning, indicating smart money is taking the opposite side. These zones mark order placement areas that become future support/resistance.
Use Cases :
Exit targets: Take profit when price returns to opposite-side zone
Re-entry levels: If price returns to your entry zone, consider adding
Stop placement: Place stops just beyond your zone (below demand, above supply)
Auto-Cleanup : System keeps the last 20 zones to prevent chart clutter.
Adversarial Bar Coloring — Real-Time Market Debate Heatmap
Each bar is colored based on the Bull Case vs Bear Case differential:
Strong Bull Advantage (diff > 0.3): Full theme bull color (e.g., cyan)
Moderate Bull Advantage (diff > 0.1): 50% transparency bull
Neutral (diff -0.1 to 0.1): Gray/neutral theme
Moderate Bear Advantage (diff < -0.1): 50% transparency bear
Strong Bear Advantage (diff < -0.3): Full theme bear color (e.g., magenta)
This creates a real-time visual heatmap showing which side is "winning" the market debate. When bars flip from cyan to magenta (or vice versa), you're witnessing a shift in adversarial advantage — a leading indicator of potential momentum changes.
Exhaustion Shading
When exhaustion score exceeds 0.75, the chart background displays a semi-transparent yellow highlight. This immediate visual warning alerts you that the current move is at high risk of reversal, even if trend indicators remain strong.
Visual Themes — Six Aesthetic Options
Cyberpunk : Cyan/Magenta/Yellow — High contrast, neon aesthetic, excellent for dark-themed trading environments
Professional : Blue/Orange/Green — Corporate color palette, suitable for presentations and professional documentation
Ocean : Teal/Red/Cyan — Aquatic palette, calming for extended monitoring sessions
Fire : Orange/Red/Coral — Warm aggressive colors, high energy
Matrix : Green/Red/Lime — Code aesthetic, homage to classic hacker visuals
Monochrome : White/Gray — Minimal distraction, maximum focus on price action
All visual elements (signal markers, zones, bar colors, dashboard) adapt to your selected theme.
Divergence Engine — Core Detection System
What Are Divergences?
Divergences occur when price action and momentum indicators disagree, creating structural tension that often resolves in a change of direction:
Regular Divergence (Reversal Signal) :
Bearish Regular : Price makes higher high, oscillator makes lower high → Potential trend reversal down
Bullish Regular : Price makes lower low, oscillator makes higher low → Potential trend reversal up
Hidden Divergence (Continuation Signal) :
Bearish Hidden : Price makes lower high, oscillator makes higher high → Downtrend continuation
Bullish Hidden : Price makes higher low, oscillator makes lower low → Uptrend continuation
Both types can be enabled/disabled independently in settings.
Pivot Detection Methods
BZ-CAE uses symmetric pivot detection with separate lookback and lookforward periods (default 5/5):
Pivot High : Bar where high > all highs within lookback range AND high > all highs within lookforward range
Pivot Low : Bar where low < all lows within lookback range AND low < all lows within lookforward range
This ensures structural validity — the pivot must be a clear local extreme, not just a minor wiggle.
Divergence Validation Requirements
For a divergence to be confirmed, it must satisfy:
Slope Disagreement : Price slope and oscillator slope must move in opposite directions (for regular divs) or same direction with inverted highs/lows (for hidden divs)
Minimum Slope Change : |osc_slope| > min_slope_change / 100 (default 1.0) — filters weak, marginal divergences
Maximum Lookback Range : Pivots must be within max_lookback bars (default 60) — prevents ancient, irrelevant divergences
ATR-Normalized Strength : Divergence strength = min(|price_slope| × |osc_slope| × 10, 1.0) — quantifies the magnitude of disagreement in volatility context
Regular divergences receive 1.0× weight; hidden divergences receive 0.8× weight (slightly less reliable historically).
Oscillator Options — Five Professional Indicators
RSI (Relative Strength Index) : Classic overbought/oversold momentum indicator. Best for: General purpose divergence detection across all instruments.
Stochastic : Range-bound %K momentum comparing close to high-low range. Best for: Mean reversion strategies and range-bound markets.
CCI (Commodity Channel Index) : Measures deviation from statistical mean, auto-normalized to 0-100 scale. Best for: Cyclical instruments and commodities.
MFI (Money Flow Index) : Volume-weighted RSI incorporating money flow. Best for: Volume-driven markets like stocks and crypto.
Williams %R : Inverse stochastic looking back over period, auto-adjusted to 0-100. Best for: Reversal detection at extremes.
Each oscillator has adjustable length (2-200, default 14) and smoothing (1-20, default 1). You also set overbought (50-100, default 70) and oversold (0-50, default 30) thresholds.
Signal Timing Modes — Understanding Repainting
BZ-CAE offers two timing policies with complete transparency about repainting behavior:
Realtime (1-bar, peak-anchored)
How It Works :
Detects peaks 1 bar ago using pattern: high > high AND high > high
Signal prints on the NEXT bar after peak detection (bar_index)
Visual marker anchors to the actual PEAK bar (bar_index - 1, offset -1)
Signal locks in when bar CONFIRMS (closes)
Repainting Behavior :
On the FORMING bar (before close), the peak condition may change as new prices arrive
Once bar CLOSES (barstate.isconfirmed), signal is locked permanently
This is preview/early warning behavior by design
Best For :
Active monitoring and immediate alerts
Learning the system (seeing signals develop in real-time)
Responsive entry if you're watching the chart live
Confirmed (lookforward)
How It Works :
Uses Pine Script's built-in ta.pivothigh() and ta.pivotlow() functions
Requires full pivot validation period (lookback + lookforward bars)
Signal prints pivot_lookforward bars after the actual peak (default 5-bar delay)
Visual marker anchors to the actual peak bar (offset -pivot_lookforward)
No Repainting Behavior
Best For :
Backtesting and historical analysis
Conservative entries requiring full confirmation
Automated trading systems
Swing trading with larger timeframes
Tradeoff :
Delayed entry by pivot_lookforward bars (typically 5 bars)
On a 5-minute chart, this is a 25-minute delay
On a 4-hour chart, this is a 20-hour delay
Recommendation : Use Confirmed for backtesting to verify system performance honestly. Use Realtime for live monitoring only if you're actively watching the chart and understand pre-confirmation repainting behavior.
Signal Spacing System — Anti-Spam Architecture
Even after CAE filtering, raw divergences can cluster. The spacing system enforces separation:
Three Independent Filters
1. Min Bars Between ANY Signals (default 12):
Prevents rapid-fire clustering across both directions
If last signal (bull or bear) was within N bars, block new signal
Ensures breathing room between all setups
2. Min Bars Between SAME-SIDE Signals (default 24, optional enforcement):
Prevents bull-bull or bear-bear spam
Separate tracking for bullish and bearish signal timelines
Toggle enforcement on/off
3. Min ATR Distance From Last Signal (default 0, optional):
Requires price to move N × ATR from last signal location
Ensures meaningful price movement between setups
0 = disabled, 0.5-2.0 = typical range for enabled
All three filters work independently. A signal must pass ALL enabled filters to proceed.
Practical Guidance :
Scalping (1-5m) : Any 6-10, Same-side 12-20, ATR 0-0.5
Day Trading (15m-1H) : Any 12, Same-side 24, ATR 0-1.0
Swing Trading (4H-D) : Any 20-30, Same-side 40-60, ATR 1.0-2.0
Dashboard — Real-Time Control Center
The dashboard (toggleable, four corner positions, three sizes) provides comprehensive system intelligence:
Oscillator Section
Current oscillator type and value
State: OVERBOUGHT / OVERSOLD / NEUTRAL (color-coded)
Length parameter
Cognitive Engine Section
TCS (Trend Conviction Score) :
Current value with emoji state indicator
🔥 = Strong trend (>0.75)
📊 = Moderate trend (0.50-0.75)
〰️ = Weak/choppy (<0.50)
Color: Red if above threshold (trend filter active), yellow if moderate, green if weak
DMA (Directional Momentum Alignment) :
Current value with emoji direction indicator
🐂 = Bullish momentum (>0.5)
⚖️ = Balanced (-0.5 to 0.5)
🐻 = Bearish momentum (<-0.5)
Color: Green if bullish, red if bearish
Exhaustion :
Current value with emoji warning indicator
⚠️ = High exhaustion (>0.75)
🟡 = Moderate (0.50-0.75)
✓ = Low (<0.50)
Color: Red if high, yellow if moderate, green if low
Pullback :
Quality of current distance from EMA20
Values >0.6 are ideal entry zones (not too close, not too far)
Bull Case / Bear Case (if Adversarial enabled):
Current scores for both sides of the market debate
Differential with emoji indicator:
📈 = Bull advantage (>0.2)
➡️ = Balanced (-0.2 to 0.2)
📉 = Bear advantage (<-0.2)
Last Signal Metrics Section (New Feature)
When a signal fires, this section captures and displays:
Signal type (BULL or BEAR)
Bars elapsed since signal
Confidence % at time of signal
TCS value at signal time
DMA value at signal time
Purpose : Provides a historical reference for learning. You can see what the market state looked like when the last signal fired, helping you correlate outcomes with conditions.
Statistics Section
Total Signals : Lifetime count across session
Blocked Signals : Count and percentage (filter effectiveness metric)
Bull Signals : Total bullish divergences
Bear Signals : Total bearish divergences
Purpose : System health monitoring. If blocked % is very high (>60%), filters may be too strict. If very low (<10%), filters may be too loose.
Advisory Annotations
When CAE Mode = Advisory, this section displays warnings for signals that would be blocked in Filtering mode:
Examples:
"Bull spacing: wait 8 bars"
"Bear: strong uptrend (TCS=0.87)"
"Adversarial bearish"
"Low confidence 32%"
Multiple warnings can stack, separated by " | ". This teaches you CAE's decision logic transparently.
How to Use BZ-CAE — Complete Workflow
Phase 1: Initial Setup (First Session)
Apply BZ-CAE to your chart
Select your preferred Visual Theme (Cyberpunk recommended for visibility)
Set Signal Timing to "Confirmed (lookforward)" for learning
Choose your Oscillator Type (RSI recommended for general use, length 14)
Set Overbought/Oversold to 70/30 (standard)
Enable both Regular Divergence and Hidden Divergence
Set Pivot Lookback/Lookforward to 5/5 (balanced structure)
Enable CAE Intelligence
Set CAE Mode to "Advisory" (learning mode)
Enable all three CAE filters: Strong Trend Filter , Adversarial Validation , Confidence Gating
Enable Show Dashboard , position Top Right, size Normal
Enable Draw Bifurcation Zones and Adversarial Bar Coloring
Phase 2: Learning Period (Weeks 1-2)
Goal : Understand how CAE evaluates market state and filters signals.
Activities :
Watch the dashboard during signals :
Note TCS values when counter-trend signals fail — this teaches you the trend strength threshold for your instrument
Observe exhaustion patterns at actual turning points — learn when overextension truly matters
Study adversarial differential at signal times — see when opposing cases dominate
Review blocked signals (orange X-crosses):
In Advisory mode, you see everything — signals that would pass AND signals that would be blocked
Check the advisory annotations to understand why CAE would block
Track outcomes: Were the blocks correct? Did those signals fail?
Use Last Signal Metrics :
After each signal, check the dashboard capture of confidence, TCS, and DMA
Journal these values alongside trade outcomes
Identify patterns: Do confidence >0.70 signals work better? Does your instrument respect TCS >0.85?
Understand your instrument's "personality" :
Trending instruments (indices, major forex) may need TCS threshold 0.85-0.90
Choppy instruments (low-cap stocks, exotic pairs) may work best with TCS 0.70-0.75
High-volatility instruments (crypto) may need wider spacing
Low-volatility instruments may need tighter spacing
Phase 3: Calibration (Weeks 3-4)
Goal : Optimize settings for your specific instrument, timeframe, and style.
Calibration Checklist :
Min Confidence Threshold :
Review confidence distribution in your signal journal
Identify the confidence level below which signals consistently fail
Set min_confidence slightly above that level
Day trading : 0.35-0.45
Swing trading : 0.40-0.55
Scalping : 0.30-0.40
TCS Threshold :
Find the TCS level where counter-trend signals consistently get stopped out
Set tcs_threshold at or slightly below that level
Trending instruments : 0.85-0.90
Mixed instruments : 0.80-0.85
Choppy instruments : 0.75-0.80
Exhaustion Override Level :
Identify exhaustion readings that marked genuine reversals
Set exhaustion_required just below the average
Typical range : 0.45-0.55
Adversarial Threshold :
Default 0.10 works for most instruments
If you find CAE is too conservative (blocking good trades), raise to 0.15-0.20
If signals are still getting caught in opposing momentum, lower to 0.07-0.09
Spacing Parameters :
Count bars between quality signals in your journal
Set min bars ANY to ~60% of that average
Set min bars SAME-SIDE to ~120% of that average
Scalping : Any 6-10, Same 12-20
Day trading : Any 12, Same 24
Swing : Any 20-30, Same 40-60
Oscillator Selection :
Try different oscillators for 1-2 weeks each
Track win rate and average winner/loser by oscillator type
RSI : Best for general use, clear OB/OS
Stochastic : Best for range-bound, mean reversion
MFI : Best for volume-driven markets
CCI : Best for cyclical instruments
Williams %R : Best for reversal detection
Phase 4: Live Deployment
Goal : Disciplined execution with proven, calibrated system.
Settings Changes :
Switch CAE Mode from Advisory to Filtering
System now actively blocks low-quality signals
Only setups passing all gates reach your chart
Keep Signal Timing on Confirmed for conservative entries
OR switch to Realtime if you're actively monitoring and want faster entries (accept pre-confirmation repaint risk)
Use your calibrated thresholds from Phase 3
Enable high-confidence alerts: "⭐ High Confidence Bullish/Bearish" (>0.70)
Trading Discipline Rules :
Respect Blocked Signals :
If CAE blocks a trade you wanted to take, TRUST THE SYSTEM
Don't manually override — if you consistently disagree, return to Phase 2/3 calibration
The block exists because market state failed intelligence checks
Confidence-Based Position Sizing :
Confidence >0.70: Standard or increased size (e.g., 1.5-2.0% risk)
Confidence 0.50-0.70: Standard size (e.g., 1.0% risk)
Confidence 0.35-0.50: Reduced size (e.g., 0.5% risk) or skip if conservative
TCS-Based Management :
High TCS + counter-trend signal: Use tight stops, quick exits (you're fading momentum)
Low TCS + reversal signal: Use wider stops, trail aggressively (genuine reversal potential)
Exhaustion Awareness :
Exhaustion >0.75 (yellow shading): Market is overextended, reversal risk is elevated — consider early exit or tighter trailing stops even on winning trades
Exhaustion <0.30: Continuation bias — hold for larger move, wide trailing stops
Adversarial Context :
Strong differential against you (e.g., bullish signal with bear diff <-0.2): Use very tight stops, consider skipping
Strong differential with you (e.g., bullish signal with bull diff >0.2): Trail aggressively, this is your tailwind
Practical Settings by Timeframe & Style
Scalping (1-5 Minute Charts)
Objective : High frequency, tight stops, quick reversals in fast-moving markets.
Oscillator :
Type: RSI or Stochastic (fast response to quick moves)
Length: 9-11 (more responsive than standard 14)
Smoothing: 1 (no lag)
OB/OS: 65/35 (looser thresholds ensure frequent crossings in fast conditions)
Divergence :
Pivot Lookback/Lookforward: 3/3 (tight structure, catch small swings)
Max Lookback: 40-50 bars (recent structure only)
Min Slope Change: 0.8-1.0 (don't be overly strict)
CAE :
Mode: Advisory first (learn), then Filtering
Min Confidence: 0.30-0.35 (lower bar for speed, accept more signals)
TCS Threshold: 0.70-0.75 (allow more counter-trend opportunities)
Exhaustion Required: 0.45-0.50 (moderate override)
Strong Trend Filter: ON (still respect major intraday trends)
Adversarial: ON (critical for scalping protection — catches bad entries quickly)
Spacing :
Min Bars ANY: 6-10 (fast pace, many setups)
Min Bars SAME-SIDE: 12-20 (prevent clustering)
Min ATR Distance: 0 or 0.5 (loose)
Timing : Realtime (speed over precision, but understand repaint risk)
Visuals :
Signal Size: Tiny (chart clarity in busy conditions)
Show Zones: Optional (can clutter on low timeframes)
Bar Coloring: ON (helps read momentum shifts quickly)
Dashboard: Small size (corner reference, not main focus)
Key Consideration : Scalping generates noise. Even with CAE, expect lower win rate (45-55%) but aim for favorable R:R (2:1 or better). Size conservatively.
Day Trading (15-Minute to 1-Hour Charts)
Objective : Balance quality and frequency. Standard divergence trading approach.
Oscillator :
Type: RSI or MFI (proven reliability, volume confirmation with MFI)
Length: 14 (industry standard, well-studied)
Smoothing: 1-2
OB/OS: 70/30 (classic levels)
Divergence :
Pivot Lookback/Lookforward: 5/5 (balanced structure)
Max Lookback: 60 bars
Min Slope Change: 1.0 (standard strictness)
CAE :
Mode: Filtering (enforce discipline from the start after brief Advisory learning)
Min Confidence: 0.35-0.45 (quality filter without being too restrictive)
TCS Threshold: 0.80-0.85 (respect strong trends)
Exhaustion Required: 0.50 (balanced override threshold)
Strong Trend Filter: ON
Adversarial: ON
Confidence Gating: ON (all three filters active)
Spacing :
Min Bars ANY: 12 (breathing room between all setups)
Min Bars SAME-SIDE: 24 (prevent bull/bear clusters)
Min ATR Distance: 0-1.0 (optional refinement, typically 0.5-1.0)
Timing : Confirmed (1-bar delay for reliability, no repainting)
Visuals :
Signal Size: Tiny or Small
Show Zones: ON (useful reference for exits/re-entries)
Bar Coloring: ON (context awareness)
Dashboard: Normal size (full visibility)
Key Consideration : This is the "sweet spot" timeframe for BZ-CAE. Market structure is clear, CAE has sufficient data, and signal frequency is manageable. Expect 55-65% win rate with proper execution.
Swing Trading (4-Hour to Daily Charts)
Objective : Quality over quantity. High conviction only. Larger stops and targets.
Oscillator :
Type: RSI or CCI (robust on higher timeframes, smooth longer waves)
Length: 14-21 (capture larger momentum swings)
Smoothing: 1-3
OB/OS: 70/30 or 75/25 (strict extremes)
Divergence :
Pivot Lookback/Lookforward: 5/5 or 7/7 (structural purity, major swings only)
Max Lookback: 80-100 bars (broader historical context)
Min Slope Change: 1.2-1.5 (require strong, undeniable divergence)
CAE :
Mode: Filtering (strict enforcement, premium setups only)
Min Confidence: 0.40-0.55 (high bar for entry)
TCS Threshold: 0.85-0.95 (very strong trend protection — don't fade established HTF trends)
Exhaustion Required: 0.50-0.60 (higher bar for override — only extreme exhaustion justifies counter-trend)
Strong Trend Filter: ON (critical on HTF)
Adversarial: ON (avoid obvious bad trades)
Confidence Gating: ON (quality gate essential)
Spacing :
Min Bars ANY: 20-30 (substantial separation)
Min Bars SAME-SIDE: 40-60 (significant breathing room)
Min ATR Distance: 1.0-2.0 (require meaningful price movement)
Timing : Confirmed (purity over speed, zero repaint for swing accuracy)
Visuals :
Signal Size: Small or Normal (clear markers on zoomed-out view)
Show Zones: ON (important HTF levels)
Bar Coloring: ON (long-term trend awareness)
Dashboard: Normal or Large (comprehensive analysis)
Key Consideration : Swing signals are rare but powerful. Expect 2-5 signals per month per instrument. Win rate should be 60-70%+ due to stringent filtering. Position size can be larger given confidence.
Dashboard Interpretation Reference
TCS (Trend Conviction Score) States
0.00-0.50: Weak/Choppy
Emoji: 〰️
Color: Green/cyan
Meaning: No established trend. Range-bound or consolidating. Both reversal and continuation signals viable.
Action: Reversals (regular divs) are safer. Use wider profit targets (market has room to move). Consider mean reversion strategies.
0.50-0.75: Moderate Trend
Emoji: 📊
Color: Yellow/neutral
Meaning: Developing trend but not locked in. Context matters significantly.
Action: Check DMA and exhaustion. If DMA confirms trend and exhaustion is low, favor continuation (hidden divs). If exhaustion is high, reversals are viable.
0.75-0.85: Strong Trend
Emoji: 🔥
Color: Orange/warning
Meaning: Well-established trend with persistence. Counter-trend is high risk.
Action: Require exhaustion >0.50 for counter-trend entries. Favor continuation signals. Use tight stops on counter-trend attempts.
0.85-1.00: Very Strong Trend
Emoji: 🔥🔥
Color: Red/danger (if counter-trading)
Meaning: Locked-in institutional trend. Extremely high risk to fade.
Action: Avoid counter-trend unless exhaustion >0.75 (yellow shading). Focus exclusively on continuation opportunities. Momentum is king here.
DMA (Directional Momentum Alignment) Zones
-2.0 to -1.0: Strong Bearish Momentum
Emoji: 🐻🐻
Color: Dark red
Meaning: Powerful downside force. Sellers are in control.
Action: Bullish divergences are counter-momentum (high risk). Bearish divergences are with-momentum (lower risk). Size down on longs.
-0.5 to 0.5: Neutral/Balanced
Emoji: ⚖️
Color: Gray/neutral
Meaning: No strong directional bias. Choppy or consolidating.
Action: Both directions have similar probability. Focus on confidence score and adversarial differential for edge.
1.0 to 2.0: Strong Bullish Momentum
Emoji: 🐂🐂
Color: Bright green/cyan
Meaning: Powerful upside force. Buyers are in control.
Action: Bearish divergences are counter-momentum (high risk). Bullish divergences are with-momentum (lower risk). Size down on shorts.
Exhaustion States
0.00-0.50: Fresh Move
Emoji: ✓
Color: Green
Meaning: Trend is healthy, not overextended. Room to run.
Action: Counter-trend trades are premature. Favor continuation. Hold winners for larger moves. Avoid early exits.
0.50-0.75: Mature Move
Emoji: 🟡
Color: Yellow
Meaning: Move is aging. Watch for signs of climax.
Action: Tighten trailing stops on winning trades. Be ready for reversals. Don't add to positions aggressively.
0.75-0.85: High Exhaustion
Emoji: ⚠️
Color: Orange
Background: Yellow shading appears
Meaning: Move is overextended. Reversal risk elevated significantly.
Action: Counter-trend reversals are higher probability. Consider early exits on with-trend positions. Size up on reversal divergences (if CAE allows).
0.85-1.00: Critical Exhaustion
Emoji: ⚠️⚠️
Color: Red
Background: Yellow shading intensifies
Meaning: Climax conditions. Reversal imminent or underway.
Action: Aggressive reversal trades justified. Exit all with-trend positions. This is where major turns occur.
Confidence Score Tiers
0.00-0.30: Low Quality
Color: Red
Status: Blocked in Filtering mode
Action: Skip entirely. Setup lacks fundamental quality across multiple factors.
0.30-0.50: Moderate Quality
Color: Yellow/orange
Status: Marginal — passes in Filtering only if >min_confidence
Action: Reduced position size (0.5-0.75% risk). Tight stops. Conservative profit targets. Skip if you're selective.
0.50-0.70: High Quality
Color: Green/cyan
Status: Good setup across most quality factors
Action: Standard position size (1.0-1.5% risk). Normal stops and targets. This is your bread-and-butter trade.
0.70-1.00: Premium Quality
Color: Bright green/gold
Status: Exceptional setup — all factors aligned
Visual: Double confidence ring appears
Action: Consider increased position size (1.5-2.0% risk, maximum). Wider stops. Larger targets. High probability of success. These are rare — capitalize when they appear.
Adversarial Differential Interpretation
Bull Differential > 0.3 :
Visual: Strong cyan/green bar colors
Meaning: Bull case strongly dominates. Buyers have clear advantage.
Action: Bullish divergences favored (with-advantage). Bearish divergences face headwind (reduce size or skip). Momentum is bullish.
Bull Differential 0.1 to 0.3 :
Visual: Moderate cyan/green transparency
Meaning: Moderate bull advantage. Buyers have edge but not overwhelming.
Action: Both directions viable. Slight bias toward longs.
Differential -0.1 to 0.1 :
Visual: Gray/neutral bars
Meaning: Balanced debate. No clear advantage either side.
Action: Rely on other factors (confidence, TCS, exhaustion) for direction. Adversarial is neutral.
Bear Differential -0.3 to -0.1 :
Visual: Moderate red/magenta transparency
Meaning: Moderate bear advantage. Sellers have edge but not overwhelming.
Action: Both directions viable. Slight bias toward shorts.
Bear Differential < -0.3 :
Visual: Strong red/magenta bar colors
Meaning: Bear case strongly dominates. Sellers have clear advantage.
Action: Bearish divergences favored (with-advantage). Bullish divergences face headwind (reduce size or skip). Momentum is bearish.
Last Signal Metrics — Post-Trade Analysis
After a signal fires, dashboard captures:
Type : BULL or BEAR
Bars Ago : How long since signal (updates every bar)
Confidence : What was the quality score at signal time
TCS : What was trend conviction at signal time
DMA : What was momentum alignment at signal time
Use Case : Post-trade journaling and learning.
Example: "BULL signal 12 bars ago. Confidence: 68%, TCS: 0.42, DMA: -0.85"
Analysis : This was a bullish reversal (regular div) with good confidence, weak trend (TCS), but strong bearish momentum (DMA). The bet was that momentum would reverse — a counter-momentum play requiring exhaustion confirmation. Check if exhaustion was high at that time to justify the entry.
Track patterns:
Do your best trades have confidence >0.65?
Do low-TCS signals (<0.50) work better for you?
Are you more successful with-momentum (DMA aligned with signal) or counter-momentum?
Troubleshooting Guide
Problem: No Signals Appearing
Symptoms : Chart loads, dashboard shows metrics, but no divergence signals fire.
Diagnosis Checklist :
Check dashboard oscillator value : Is it crossing OB/OS levels (70/30)? If oscillator stays in 40-60 range constantly, it can't reach extremes needed for divergence detection.
Are pivots forming? : Look for local swing highs/lows on your chart. If price is in tight consolidation, pivots may not meet lookback/lookforward requirements.
Is spacing too tight? : Check "Last Signal" metrics — how many bars since last signal? If <12 and your min_bars_ANY is 12, spacing filter is blocking.
Is CAE blocking everything? : Check dashboard Statistics section — what's the blocked signal count? High blocks indicate overly strict filters.
Solutions :
Loosen OB/OS Temporarily :
Try 65/35 to verify divergence detection works
If signals appear, the issue was threshold strictness
Gradually tighten back to 67/33, then 70/30 as appropriate
Lower Min Confidence :
Try 0.25-0.30 (diagnostic level)
If signals appear, filter was too strict
Raise gradually to find sweet spot (0.35-0.45 typical)
Disable Strong Trend Filter Temporarily :
Turn off in CAE settings
If signals appear, TCS threshold was blocking everything
Re-enable and lower TCS_threshold to 0.70-0.75
Reduce Min Slope Change :
Try 0.7-0.8 (from default 1.0)
Allows weaker divergences through
Helpful on low-volatility instruments
Widen Spacing :
Set min_bars_ANY to 6-8
Set min_bars_SAME_SIDE to 12-16
Reduces time between allowed signals
Check Timing Mode :
If using Confirmed, remember there's a pivot_lookforward delay (5+ bars)
Switch to Realtime temporarily to verify system is working
Realtime has no delay but repaints
Verify Oscillator Settings :
Length 14 is standard but might not fit all instruments
Try length 9-11 for faster response
Try length 18-21 for slower, smoother response
Problem: Too Many Signals (Signal Spam)
Symptoms : Dashboard shows 50+ signals in Statistics, confidence scores mostly <0.40, signals clustering close together.
Solutions :
Raise Min Confidence :
Try 0.40-0.50 (quality filter)
Blocks bottom-tier setups
Targets top 50-60% of divergences only
Tighten OB/OS :
Use 70/30 or 75/25
Requires more extreme oscillator readings
Reduces false divergences in mid-range
Increase Min Slope Change :
Try 1.2-1.5 (from default 1.0)
Requires stronger, more obvious divergences
Filters marginal slope disagreements
Raise TCS Threshold :
Try 0.85-0.90 (from default 0.80)
Stricter trend filter blocks more counter-trend attempts
Favors only strongest trend alignment
Enable ALL CAE Gates :
Turn on Trend Filter + Adversarial + Confidence
Triple-layer protection
Blocks aggressively — expect 20-40% reduction in signals
Widen Spacing :
min_bars_ANY: 15-20 (from 12)
min_bars_SAME_SIDE: 30-40 (from 24)
Creates substantial breathing room
Switch to Confirmed Timing :
Removes realtime preview noise
Ensures full pivot validation
5-bar delay filters many false starts
Problem: Signals in Strong Trends Get Stopped Out
Symptoms : You take a bullish divergence in a downtrend (or bearish in uptrend), and it immediately fails. Dashboard showed high TCS at the time.
Analysis : This is INTENDED behavior — CAE is protecting you from low-probability counter-trend trades.
Understanding :
Check Last Signal Metrics in dashboard — what was TCS when signal fired?
If TCS was >0.85 and signal was counter-trend, CAE correctly identified it as high risk
Strong trends rarely reverse cleanly without major exhaustion
Your losses here are the system working as designed (blocking bad odds)
If You Want to Override (Not Recommended) :
Lower TCS_threshold to 0.70-0.75 (allows more counter-trend)
Lower exhaustion_required to 0.40 (easier override)
Disable Strong Trend Filter entirely (very risky)
Better Approach :
TRUST THE FILTER — it's preventing costly mistakes
Wait for exhaustion >0.75 (yellow shading) before counter-trending strong TCS
Focus on continuation signals (hidden divs) in high-TCS environments
Use Advisory mode to see what CAE is blocking and learn from outcomes
Problem: Adversarial Blocking Seems Wrong
Symptoms : You see a divergence that "looks good" visually, but CAE blocks with "Adversarial bearish/bullish" warning.
Diagnosis :
Check dashboard Bull Case and Bear Case scores at that moment
Look at Differential value
Check adversarial bar colors — was there strong coloring against your intended direction?
Understanding :
Adversarial catches "obvious" opposing momentum that's easy to miss
Example: Bullish divergence at a local low, BUT price is deeply below EMA50, bearish momentum is strong, and RSI shows knife-catching conditions
Bull Case might be 0.20 while Bear Case is 0.55
Differential = -0.35, far beyond threshold
Block is CORRECT — you'd be fighting overwhelming opposing flow
If You Disagree Consistently
Review blocked signals on chart — scroll back and check outcomes
Did those blocked signals actually work, or did they fail as adversarial predicted?
Raise adv_threshold to 0.15-0.20 (more permissive, allows closer battles)
Disable Adversarial Validation temporarily (diagnostic) to isolate its effect
Use Advisory mode to learn adversarial patterns over 50-100 signals
Remember : Adversarial is conservative BY DESIGN. It prevents "obvious" bad trades where you're fighting strong strength the other way.
Problem: Dashboard Not Showing or Incomplete
Solutions :
Toggle "Show Dashboard" to ON in settings
Try different dashboard sizes (Small/Normal/Large)
Try different positions (Top Left/Right, Bottom Left/Right) — might be off-screen
Some sections require CAE Enable = ON (Cognitive Engine section won't appear if CAE is disabled)
Statistics section requires at least 1 lifetime signal to populate
Check that visual theme is set (dashboard colors adapt to theme)
Problem: Performance Lag, Chart Freezing
Symptoms : Chart loading is slow, indicator calculations cause delays, pinch-to-zoom lags.
Diagnosis : Visual features are computationally expensive, especially adversarial bar coloring (recalculates every bar).
Solutions (In Order of Impact) :
Disable Adversarial Bar Coloring (MOST EXPENSIVE):
Turn OFF "Adversarial Bar Coloring" in settings
This is the single biggest performance drain
Immediate improvement
Reduce Vertical Lines :
Lower "Keep last N vertical lines" to 20-30
Or set to 0 to disable entirely
Moderate improvement
Disable Bifurcation Zones :
Turn OFF "Draw Bifurcation Zones"
Reduces box drawing calculations
Moderate improvement
Set Dashboard Size to Small :
Smaller dashboard = fewer cells = less rendering
Minor improvement
Use Shorter Max Lookback :
Reduce max_lookback to 40-50 (from 60+)
Fewer bars to scan for divergences
Minor improvement
Disable Exhaustion Shading :
Turn OFF "Show Market State"
Removes background coloring calculations
Minor improvement
Extreme Performance Mode :
Disable ALL visual enhancements
Keep only triangle markers
Dashboard Small or OFF
Use Minimal theme if available
Problem: Realtime Signals Repainting
Symptoms : You see a signal appear, but on next bar it disappears or moves.
Explanation :
Realtime mode detects peaks 1 bar ago: high > high AND high > high
On the FORMING bar (before close), this condition can change as new prices arrive
Example: At 10:05, high (10:04 bar) was 100, current high is 99 → peak detected
At 10:05:30, new high of 101 arrives → peak condition breaks → signal disappears
At 10:06 (bar close), final high is 101 → no peak at 10:04 anymore → signal gone permanently
This is expected behavior for realtime responsiveness. You get preview/early warning, but it's not locked until bar confirms.
Solutions :
Use Confirmed Timing :
Switch to "Confirmed (lookforward)" mode
ZERO repainting — pivot must be fully validated
5-bar delay (pivot_lookforward)
What you see in history is exactly what would have appeared live
Accept Realtime Repaint as Tradeoff :
Keep Realtime mode for speed and alerts
Understand that pre-confirmation signals may vanish
Only trade signals that CONFIRM at bar close (check barstate.isconfirmed)
Use for live monitoring, NOT for backtesting
Trade Only After Confirmation :
In Realtime mode, wait 1 full bar after signal appears before entering
If signal survives that bar close, it's locked
This adds 1-bar delay but removes repaint risk
Recommendation : Use Confirmed for backtesting and conservative trading. Use Realtime only for active monitoring with full understanding of preview behavior.
Risk Management Integration
BZ-CAE is a signal generation system, not a complete trading strategy. You must integrate proper risk management:
Position Sizing by Confidence
Confidence 0.70-1.00 (Premium) :
Risk: 1.5-2.0% of account (MAXIMUM)
Reasoning: High-quality setup across all factors
Still cap at 2% — even premium setups can fail
Confidence 0.50-0.70 (High Quality) :
Risk: 1.0-1.5% of account
Reasoning: Standard good setup
Your bread-and-butter risk level
Confidence 0.35-0.50 (Moderate Quality) :
Risk: 0.5-1.0% of account
Reasoning: Marginal setup, passes minimum threshold
Reduce size or skip if you're selective
Confidence <0.35 (Low Quality) :
Risk: 0% (blocked in Filtering mode)
Reasoning: Insufficient quality factors
System protects you by not showing these
Stop Placement Strategies
For Reversal Signals (Regular Divergences) :
Place stop beyond the divergence pivot plus buffer
Bullish : Stop below the divergence low - 1.0-1.5 × ATR
Bearish : Stop above the divergence high + 1.0-1.5 × ATR
Reasoning: If price breaks the pivot, divergence structure is invalidated
For Continuation Signals (Hidden Divergences) :
Place stop beyond recent swing in opposite direction
Bullish continuation : Stop below recent swing low (not the divergence pivot itself)
Bearish continuation : Stop above recent swing high
Reasoning: You're trading with trend, allow more breathing room
ATR-Based Stops :
1.5-2.0 × ATR is standard
Scale by timeframe:
Scalping (1-5m): 1.0-1.5 × ATR (tight)
Day trading (15m-1H): 1.5-2.0 × ATR (balanced)
Swing (4H-D): 2.0-3.0 × ATR (wide)
Never Use Fixed Dollar/Pip Stops :
Markets have different volatility
50-pip stop on EUR/USD ≠ 50-pip stop on GBP/JPY
Always normalize by ATR or pivot structure
Profit Targets and Scaling
Primary Target :
2-3 × ATR from entry (minimum 2:1 reward-risk)
Example : Entry at 100, ATR = 2, stop at 97 (1.5 × ATR) → target at 106 (3 × ATR) = 2:1 R:R
Scaling Out Strategy :
Take 50% off at 1.5 × ATR (secure partial profit)
Move stop to breakeven
Trail remaining 50% with 1.0 × ATR trailing stop
Let winners run if trend persists
Targets by Confidence :
High Confidence (>0.70) : Aggressive targets (3-4 × ATR), trail wider (1.5 × ATR)
Standard Confidence (0.50-0.70) : Normal targets (2-3 × ATR), standard trail (1.0 × ATR)
Low Confidence (0.35-0.50) : Conservative targets (1.5-2 × ATR), tight trail (0.75 × ATR)
Use Bifurcation Zones :
If opposite-side zone is visible on chart (from previous signal), use it as target
Example : Bullish signal at 100, prior supply zone at 110 → use 110 as target
Zones mark institutional resistance/support
Exhaustion-Based Exits :
If you're in a trade and exhaustion >0.75 develops (yellow shading), consider early exit
Market is overextended — reversal risk is high
Take profit even if target not reached
Trade Management by TCS
High TCS + Counter-Trend Trade (Risky) :
Use very tight stops (1.0-1.5 × ATR)
Conservative targets (1.5-2 × ATR)
Quick exit if trade doesn't work immediately
You're fading momentum — respect it
Low TCS + Reversal Trade (Safer) :
Use wider stops (2.0-2.5 × ATR)
Aggressive targets (3-4 × ATR)
Trail with patience
Genuine reversal potential in weak trend
High TCS + Continuation Trade (Safest) :
Standard stops (1.5-2.0 × ATR)
Very aggressive targets (4-5 × ATR)
Trail wide (1.5-2.0 × ATR)
You're with institutional momentum — let it run
Educational Value — Learning Machine Intelligence
BZ-CAE is designed as a learning platform, not just a tool:
Advisory Mode as Teacher
Most indicators are binary: signal or no signal. You don't learn WHY certain setups are better.
BZ-CAE's Advisory mode shows you EVERY potential divergence, then annotates the ones that would be blocked in Filtering mode with specific reasons:
"Bull: strong downtrend (TCS=0.87)" teaches you that TCS >0.85 makes counter-trend very risky
"Adversarial bearish" teaches you that the opposing case was dominating
"Low confidence 32%" teaches you that the setup lacked quality across multiple factors
"Bull spacing: wait 8 bars" teaches you that signals need breathing room
After 50-100 signals in Advisory mode, you internalize the CAE's decision logic. You start seeing these factors yourself BEFORE the indicator does.
Dashboard Transparency
Most "intelligent" indicators are black boxes — you don't know how they make decisions.
BZ-CAE shows you ALL metrics in real-time:
TCS tells you trend strength
DMA tells you momentum alignment
Exhaustion tells you overextension
Adversarial shows both sides of the debate
Confidence shows composite quality
You learn to interpret market state holistically, a skill applicable to ANY trading system beyond this indicator.
Divergence Quality Education
Not all divergences are equal. BZ-CAE teaches you which conditions produce high-probability setups:
Quality divergence : Regular bullish div at a low, TCS <0.50 (weak trend), exhaustion >0.75 (overextended), positive adversarial differential, confidence >0.70
Low-quality divergence : Regular bearish div at a high, TCS >0.85 (strong uptrend), exhaustion <0.30 (not overextended), negative adversarial differential, confidence <0.40
After using the system, you can evaluate divergences manually with similar intelligence.
Risk Management Discipline
Confidence-based position sizing teaches you to adjust risk based on setup quality, not emotions:
Beginners often size all trades identically
Or worse, size UP on marginal setups to "make up" for losses
BZ-CAE forces systematic sizing: premium setups get larger size, marginal setups get smaller size
This creates a probabilistic approach where your edge compounds over time.
What This Indicator Is NOT
Complete transparency about limitations and positioning:
Not a Prediction System
BZ-CAE does not predict future prices. It identifies structural divergences (price-momentum disagreements) and assesses current market state (trend, exhaustion, adversarial conditions). It tells you WHEN conditions favor a potential reversal or continuation, not WHAT WILL HAPPEN.
Markets are probabilistic. Even premium-confidence setups fail ~30-40% of the time. The system improves your probability distribution over many trades — it doesn't eliminate risk.
Not Fully Automated
This is a decision support tool, not a trading robot. You must:
Execute trades manually based on signals
Manage positions (stops, targets, trailing)
Apply discretionary judgment (news events, liquidity, context)
Integrate with your broader strategy and risk rules
The confidence scores guide position sizing, but YOU determine final risk allocation based on your account size, risk tolerance, and portfolio context.
Not Beginner-Friendly
BZ-CAE requires understanding of:
Divergence trading concepts (regular vs hidden, reversal vs continuation)
Market state interpretation (trend vs range, momentum, exhaustion)
Basic technical analysis (pivots, support/resistance, EMAs)
Risk management fundamentals (position sizing, stops, R:R)
This is designed for intermediate to advanced traders willing to invest time learning the system. If you want "buy the arrow" simplicity, this isn't the tool.
Not a Holy Grail
There is no perfect indicator. BZ-CAE filters noise and improves signal quality significantly, but:
Losing trades are inevitable (even at 70% win rate, 30% still fail)
Market conditions change rapidly (yesterday's strong trend becomes today's chop)
Black swan events occur (fundamentals override technicals)
Execution matters (slippage, fees, emotional discipline)
The system provides an EDGE, not a guarantee. Your job is to execute that edge consistently with proper risk management over hundreds of trades.
Not Financial Advice
BZ-CAE is an educational and analytical tool. All trading decisions are your responsibility. Past performance (backtested or live) does not guarantee future results. Only risk capital you can afford to lose. Consult a licensed financial advisor for investment advice specific to your situation.
Ideal Market Conditions
Best Performance Characteristics
Liquid Instruments :
Major forex pairs (EUR/USD, GBP/USD, USD/JPY)
Large-cap stocks and index ETFs (SPY, QQQ, AAPL, MSFT)
High-volume crypto (BTC, ETH)
Major commodities (Gold, Oil, Natural Gas)
Reasoning: Clean price structure, clear pivots, meaningful oscillator behavior
Trending with Consolidations :
Markets that trend for 20-40 bars, then consolidate 10-20 bars, repeat
Creates divergences at consolidation boundaries (reversals) and within trends (continuations)
Both regular and hidden divs find opportunities
5-Minute to Daily Timeframes :
Below 5m: too much noise, false pivots, CAE metrics unstable
Above daily: too few signals, edge diminishes (fundamentals dominate)
Sweet spot: 15m to 4H for most traders
Consistent Volume and Participation :
Regular trading sessions (not holidays or thin markets)
Predictable volatility patterns
Avoid instruments with sudden gaps or circuit breakers
Challenging Conditions
Extremely Low Liquidity :
Penny stocks, exotic forex pairs, low-volume crypto
Erratic pivots, unreliable oscillator readings
CAE metrics can't assess market state properly
Very Low Timeframes (1-Minute or Below) :
Dominated by market microstructure noise
Divergences are everywhere but meaningless
CAE filtering helps but still unreliable
Extended Sideways Consolidation :
100+ bars of tight range with no clear pivots
Oscillator hugs midpoint (45-55 range)
No divergences to detect
Fundamentally-Driven Gap Markets :
Earnings releases, economic data, geopolitical events
Price gaps over stops and targets
Technical structure breaks down
Recommendation: Disable trading around known events
Calculation Methodology — Technical Depth
For users who want to understand the math:
Oscillator Computation
Each oscillator type calculates differently, but all normalize to 0-100:
RSI : ta.rsi(close, length) — Standard Relative Strength Index
Stochastic : ta.stoch(high, low, close, length) — %K calculation
CCI : (ta.cci(hlc3, length) + 100) / 2 — Normalized from -100/+100 to 0-100
MFI : ta.mfi(hlc3, length) — Volume-weighted RSI equivalent
Williams %R : ta.wpr(length) + 100 — Inverted stochastic adjusted to 0-100
Smoothing: If smoothing > 1, apply ta.sma(oscillator, smoothing)
Divergence Detection Algorithm
Identify Pivots :
Price high pivot: ta.pivothigh(high, lookback, lookforward)
Price low pivot: ta.pivotlow(low, lookback, lookforward)
Oscillator high pivot: ta.pivothigh(osc, lookback, lookforward)
Oscillator low pivot: ta.pivotlow(osc, lookback, lookforward)
Store Recent Pivots :
Maintain arrays of last 10 pivots with bar indices
When new pivot confirmed, unshift to array, pop oldest if >10
Scan for Slope Disagreements :
Loop through last 5 pivots
For each pair (current pivot, historical pivot):
Check if within max_lookback bars
Calculate slopes: (current - historical) / bars_between
Regular bearish: price_slope > 0, osc_slope < 0, |osc_slope| > min_threshold
Regular bullish: price_slope < 0, osc_slope > 0, |osc_slope| > min_threshold
Hidden bearish: price_slope < 0, osc_slope > 0, osc_slope > min_threshold
Hidden bullish: price_slope > 0, osc_slope < 0, |osc_slope| > min_threshold
Important Disclaimers and Terms
Performance Disclosure
Past performance, whether backtested or live-traded, does not guarantee future results. Markets change. What works today may not work tomorrow. Hypothetical or simulated performance results have inherent limitations and do not represent actual trading.
Risk of Loss
Trading involves substantial risk of loss. Only trade with risk capital you can afford to lose entirely. The high degree of leverage often available in trading can work against you as well as for you. Leveraged trading may result in losses exceeding your initial deposit.
Not Financial Advice
BZ-CAE is an educational and analytical tool for technical analysis. It is not financial advice, investment advice, or a recommendation to buy or sell any security or instrument. All trading decisions are your sole responsibility. Consult a licensed financial advisor for advice specific to your circumstances.
Technical Indicator Limitations
BZ-CAE is a technical analysis tool based on price and volume data. It does not account for:
Fundamental analysis (earnings, economic data, financial health)
Market sentiment and positioning
Geopolitical events and news
Liquidity conditions and market microstructure changes
Regulatory changes or exchange rules
Integrate with broader analysis and strategy. Do not rely solely on technical indicators for trading decisions.
Repainting Acknowledgment
As disclosed throughout this documentation:
Realtime mode may repaint on forming bars before confirmation (by design for preview functionality)
Confirmed mode has zero repainting (fully validated pivots only)
Choose timing mode appropriate for your use case. Understand the tradeoffs.
Testing Recommendation
ALWAYS test on demo/paper accounts before committing real capital. Validate the indicator's behavior on your specific instruments and timeframes. Learn the system thoroughly in Advisory mode before using Filtering mode.
Learning Resources :
In-indicator tooltips (hover over setting names for detailed explanations)
This comprehensive publishing statement (save for reference)
User guide in script comments (top of code)
Final Word — Philosophy of BZ-CAE
BZ-CAE is not designed to replace your judgment — it's designed to enhance it.
The indicator identifies structural inflection points (bifurcations) where price and momentum disagree. The Cognitive Engine evaluates market state to determine if this disagreement is meaningful or noise. The Adversarial model debates both sides of the trade to catch obvious bad setups. The Confidence system ranks quality so you can choose your risk appetite.
But YOU still execute. YOU still manage risk. YOU still learn from outcomes.
This is intelligence amplification, not intelligence replacement.
Use Advisory mode to learn how expert traders evaluate market state. Use Filtering mode to enforce discipline when emotions run high. Use the dashboard to develop a systematic approach to reading markets. Use confidence scores to size positions probabilistically.
The system provides an edge. Your job is to execute that edge with discipline, patience, and proper risk management over hundreds of trades.
Markets are probabilistic. No system wins every trade. But a systematic edge + disciplined execution + proper risk management compounds over time. That's the path to consistent profitability. BZ-CAE gives you the edge. The discipline and risk management are on you.
Taking you to school. — Dskyz, Trade with insight. Trade with anticipation.

BOS/CHOCH Demand & SupplyThis indicator automatically identifies and plots Supply and Demand zones based on Smart Money Concepts (SMC) methodology. It detects structural breaks in price action and marks the origin zones that initiated these moves.
How It Works (Technical Methodology)
1. Swing Point Detection
The indicator uses Pine Script's ta.pivothigh() and ta.pivotlow() functions to identify swing highs and lows. Users can input multiple lookback periods (e.g., 1, 2, 3, 5, 11, 15, 20) to detect structure across different timeframe perspectives simultaneously.
2. Break of Structure (BOS) Detection
A Bullish BOS is confirmed when:
Current candle closes above the last swing high
Previous candle's high was still below that swing high
The current swing high is higher than the previous swing high (trend continuation)
A Bearish BOS is confirmed when:
Current candle closes below the last swing low
Previous candle's low was still above that swing low
The current swing low is lower than the previous swing low (trend continuation)
3. Change of Character (CHOCH) Detection
A Bullish CHOCH is confirmed when:
Price breaks above the last swing high
But that swing high was lower than the previous swing high (potential reversal signal)
A Bearish CHOCH is confirmed when:
Price breaks below the last swing low
But that swing low was higher than the previous swing low (potential reversal signal)
4. Inducement / Liquidity Grab Filter (Optional)
When enabled, zones are only drawn if the swing point that created them first grabbed liquidity from the previous swing:
For Demand zones: The swing low must have traded below the previous swing low before the bullish break
For Supply zones: The swing high must have traded above the previous swing high before the bearish break
This filter helps identify higher-probability zones where stop-losses were likely triggered before the move.
5. Zone Construction
Demand Zone (Bullish):
Top boundary: max(open, close) of the swing low candle
Bottom boundary: low of the swing low candle
Supply Zone (Bearish):
Top boundary: high of the swing high candle
Bottom boundary: min(open, close) of the swing high candle
This captures the candle body-to-wick range where institutional orders likely reside.
6. Zone Lifecycle Management
Active Zone: Displayed in green (demand) or red (supply)
Mitigated Zone: When price touches the zone but doesn't break it, the zone turns gray (indicating partial fill)
Broken Zone: When price fully breaks through the zone, it is automatically deleted from the chart
How to Use
Demand Zones (Green): Look for long entries when price returns to these zones. The zone represents where buying pressure previously overcame selling.
Supply Zones (Red): Look for short entries when price returns to these zones. The zone represents where selling pressure previously overcame buying.
BOS Zones: Indicate trend continuation - trade in the direction of the break.
CHOCH Zones: Indicate potential reversal - these are early warning signals of trend change.
Enable "Require Inducement" for higher-quality setups where liquidity was grabbed before the structural break.
Multi-Lookback Periods: Using multiple values helps identify zones across different structural levels. Smaller values catch minor structure; larger values catch major structure.
Disclaimer
This indicator is a technical analysis tool and should be used in conjunction with other forms of analysis. Past performance does not guarantee future results. Always use proper risk management.
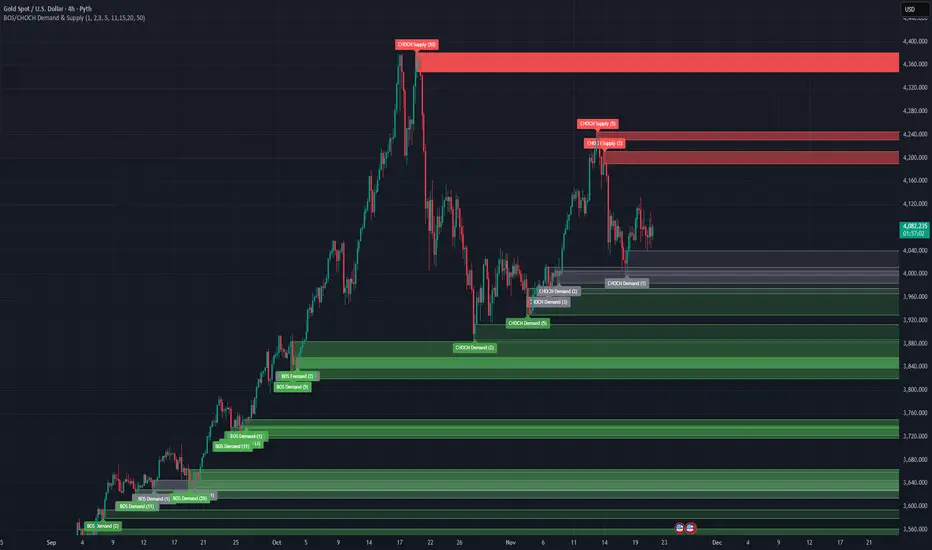
Trend Gazer v5# Trend Gazer v5: Professional Multi-Timeframe ICT Analysis System
## 📊 Overview
**Trend Gazer v5** is a comprehensive institutional-grade trading system that synthesizes multiple proven methodologies into a unified analytical framework. This indicator combines **ICT (Inner Circle Trader) concepts**, **Smart Money Structure**, **Order Block detection**, **Fair Value Gaps**, and **volumetric analysis** to provide traders with high-probability trade setups backed by institutional footprints.
Unlike fragmented indicators that force traders to switch between multiple tools, Trend Gazer v5 delivers a **holistic market view** in a single overlay, eliminating analysis paralysis and enabling confident decision-making.
---
## 🎯 Why This Combination is Necessary
### The Problem with Single-Concept Indicators
Traditional indicators suffer from three critical flaws:
1. **Isolated Context** - Price action, volume, and structure are analyzed separately, creating conflicting signals
2. **Timeframe Blindness** - Single-timeframe analysis misses institutional activity occurring across multiple timeframes
3. **Lagging Confirmation** - Waiting for one indicator to confirm another causes missed entries and late exits
### The Institutional Trading Reality
Professional traders and institutions operate across **multiple dimensions simultaneously**:
- **Structural Context**: Where are we in the market cycle? (CHoCH, SiMS, BoMS)
- **Order Flow**: Where is institutional supply and demand concentrated? (Order Blocks)
- **Inefficiencies**: Where are price imbalances that must be filled? (Fair Value Gaps)
- **Momentum Context**: Is volume expanding or contracting? (VWC/TBOSI)
- **Mean Reversion Points**: Where do institutions expect rebounds? (NPR/BB, EMAs)
**Trend Gazer v5 unifies these dimensions**, creating a complete picture of market microstructure that individual indicators cannot provide.
---
## 🔬 Core Analytical Framework
### 1️⃣ ICT Donchian Smart Money Structure
**Purpose**: Identify institutional market structure shifts that precede major moves.
**Components**:
- **CHoCH (Change of Character)** - Market structure break signaling trend exhaustion
- `1.CHoCH` (Bullish) - Lower low broken, shift to bullish structure
- `A.CHoCH` (Bearish) - Higher high broken, shift to bearish structure
- **SiMS (Shift in Market Structure)** - Initial structure shift (2nd occurrence)
- **BoMS (Break of Market Structure)** - Continuation structure (3rd+ occurrence)
**Why It's Essential**:
Retail traders react to price changes. Institutions **create** price changes by breaking structure. By detecting these shifts using **Donchian channels** (the purest form of high/low tracking), we identify the exact moments when institutional bias changes.
**Credit**: Based on *ICT Donchian Smart Money Structure* by Zeiierman (CC BY-NC-SA 4.0)
---
### 2️⃣ Multi-Timeframe Order Block Detection
**Purpose**: Map institutional supply/demand zones where price is likely to reverse.
**Methodology**:
Order Blocks represent the **last opposite-direction candle** before a strong move. These zones indicate where institutions accumulated (bullish OB) or distributed (bearish OB) positions.
**Multi-Timeframe Coverage**:
- **1-minute**: Scalping zones for day traders
- **3-minute**: Short-term swing zones
- **15-minute**: Intraday institutional zones
- **60-minute**: Daily swing zones
- **Current TF**: Dynamic adaptation to any chart timeframe
**Key Features**:
- **Bounce Detection** - Identifies when price rebounds from OB zones (Signal 7: 🎯 OB Bounce)
- **Breaker Tracking** - Monitors when OBs are violated, converting bullish OBs to resistance and vice versa
- **Visual Rendering** - Color-coded boxes with transparency showing OB strength
- **OB Direction Filter** - Blocks contradictory signals (no SELL in bullish OB, no BUY in bearish OB)
**Why MTF Order Blocks Matter**:
A 60-minute Order Block represents institutional positioning at a larger timeframe. When combined with a 3-minute entry signal, you're trading **with** the big players, not against them.
---
### 3️⃣ Fair Value Gap (FVG) Detection
**Purpose**: Identify price inefficiencies that institutional traders must eventually fill.
**What Are FVGs?**:
Fair Value Gaps occur when price moves so rapidly that it leaves an **imbalance** - a gap between the high of one candle and the low of the candle two bars later (or vice versa). Institutions view these as inefficient pricing that must be corrected.
**Detection Logic**:
```
Bullish FVG: high < low → Gap up = Bearish imbalance (expect downward fill)
Bearish FVG: low > high → Gap down = Bullish imbalance (expect upward fill)
```
**Visual Design**:
- **Bullish FVG**: Green boxes (support zones where price should bounce)
- **Bearish FVG**: Red boxes (resistance zones where price should reject)
- **Mitigation Tracking**: FVGs disappear when filled, signaling completion
- **Volume Attribution**: Each FVG tracks associated buying/selling volume
**Why FVGs Are Critical**:
Institutions operate on **efficiency**. Gaps represent inefficiency. When price returns to fill a gap, it's not random - it's institutional traders **correcting market inefficiency**. Trading into FVG fills offers exceptional risk/reward.
---
### 4️⃣ Volumetric Weighted Cloud (VWC/TBOSI)
**Purpose**: Detect momentum shifts and trend strength using volume-weighted price action.
**Mechanism**:
VWC applies **volatility weighting** to moving averages, creating a dynamic cloud that expands during high-volatility trends and contracts during consolidation.
**Multi-Timeframe Analysis**:
- **1m, 3m, 5m**: Micro-scalping momentum
- **15m**: Intraday trend confirmation
- **60m, 240m**: Swing trade trend validation
**Signal Generation**:
- **VWC Switch (Signal 2)**: When cloud color flips (red → green or green → red), indicating momentum reversal
- **VWC Status Table**: Real-time display of trend direction across all timeframes
**Why Volume-Weighting Matters**:
Traditional moving averages treat all bars equally. VWC gives **more weight to high-volume bars**, ensuring that signals reflect actual institutional participation, not low-volume noise.
---
### 5️⃣ Non-Repaint STDEV (NPR) & Bollinger Bands
**Purpose**: Identify extreme mean-reversion points without repainting.
**Problem with Traditional Indicators**:
Many indicators **repaint** - they change past values when new data arrives, making backtests misleading. NPR uses **lookahead bias prevention** to ensure signals remain fixed.
**Configuration**:
- **15-minute NPR/BB**: Intraday volatility bands
- **60-minute NPR/BB**: Swing trade extremes
- **Multiple Kernel Options**: Exponential, Simple, Double Exponential, Triple Exponential for different smoothing profiles
**Signal Logic (Signal 8)**:
- **BUY**: Price closes **inside** lower band (not just touching it) → Extreme oversold with institutional absorption likely
- **SELL**: Price closes **inside** upper band → Extreme overbought with institutional distribution likely
**Why NPR is Superior**:
Repainting indicators give traders false confidence in backtests. NPR ensures every signal you see in history is **exactly** what a trader would have seen in real-time.
---
### 6️⃣ 💎 STRONG CHoCH Pattern Detection
**Purpose**: Identify the highest-probability setups when multiple CHoCH confirmations align within a tight timeframe.
**Pattern Logic**:
**STRONG BUY Pattern**:
```
1.CHoCH → A.CHoCH → 1.CHoCH (within 20 bars)
```
This sequence indicates:
1. Initial bullish structure shift
2. Bearish retest (pullback)
3. **Renewed bullish confirmation** - Institutions are re-accumulating after shaking out weak hands
**STRONG SELL Pattern**:
```
A.CHoCH → 1.CHoCH → A.CHoCH (within 20 bars)
```
This sequence indicates:
1. Initial bearish structure shift
2. Bullish retest (dead cat bounce)
3. **Renewed bearish confirmation** - Institutions are re-distributing after trapping longs
**Visual Display**:
```
💎 BUY
```
- **0% transparency** (fully opaque) - Maximum visual priority
- Displayed **immediately** when pattern completes (no additional signal required)
- Independent of Market Structure filter (pattern itself is the confirmation)
**Why STRONG Signals Are Different**:
- **Triple Confirmation**: Three structure shifts eliminate false breakouts
- **Tight Timeframe**: 20-bar window ensures institutional conviction, not random noise
- **Automatic Display**: No waiting for price action - the pattern itself triggers the alert
- **Historical Validation**: This specific sequence has proven to precede major institutional moves
**Risk Management**:
STRONG signals offer the best risk/reward because:
1. Stop loss can be placed beyond the middle CHoCH (tight risk)
2. Target can be set at next major structure level (large reward)
3. Pattern failure is immediately evident (quick exit if wrong)
---
### 7️⃣ Multi-EMA Framework
**Purpose**: Provide dynamic support/resistance and trend context.
**EMA Configuration**:
- **EMA 7**: Micro-trend (scalping)
- **EMA 20**: Short-term trend
- **EMA 50**: Institutional pivot (Signal 6: EMA50 Bounce)
- **EMA 100**: Mid-term trend filter
- **EMA 200**: Major institutional support/resistance
- **EMA 400, 800**: Macro trend context
**Visual Fills**:
- Color-coded fills between EMAs create **visual trend strength zones**
- Convergence = consolidation
- Divergence = trending market
**Why 7 EMAs?**:
Each EMA represents a different **participant timeframe**:
- EMA 7/20: Day traders and scalpers
- EMA 50/100: Swing traders
- EMA 200/400/800: Position traders and institutions
When all EMAs align, **all participant types agree on direction** - the highest-probability trend trades.
---
## 🚀 8-Signal Trading System
Trend Gazer v5 employs **8 distinct signal conditions** (all enabled by default), each designed to capture different market regimes:
### ⭐ Signal Hierarchy & Trading Philosophy
**IMPORTANT**: Not all signals are created equal. The indicator displays a hierarchy of signal quality:
**PRIMARY SIGNALS (Trade These)**:
- 💎 **STRONG BUY/SELL** - Triple-confirmed CHoCH patterns (highest priority)
- 🌟 **Star Signals (S7, S8)** - High-probability institutional zone reactions
- Signal 7: Order Block Bounce
- Signal 8: 60m NPR/BB Bounce
**AUXILIARY SIGNALS (Confirmation & Context)**:
- **Signals 1-6** - Use these as:
- **Confirmation** for Star Signals (when multiple signals align)
- **Context** for understanding market conditions
- **Early warnings** of potential moves (validate before trading)
- **Additional filters** (e.g., "only trade Star Signals that also have Signal 1")
**Trading Recommendation**:
- **Conservative Traders**: Trade ONLY 💎 STRONG and 🌟 Star Signals
- **Moderate Traders**: Trade Star Signals + validated auxiliary signals (2+ signal confirmation)
- **Active Traders**: Use all signals with proper risk management
The visual transparency system reinforces this hierarchy:
- 0% transparent = STRONG (💎) - Highest conviction
- 50% transparent = Star (🌟) + OB signals - High quality
- 70% transparent = Auxiliary (S1-S6) - Supplementary information
### Signal 1: RSI Shift + Structure (AND Logic)
**Strictest Signal** - Requires both RSI momentum confirmation AND structure change.
- **Use Case**: High-conviction trades in trending markets
- **Frequency**: Least frequent, highest accuracy
### Signal 2: VWC Switch (OR Logic)
**Most Frequent Signal** - Triggers on any VWC color flip across monitored timeframes.
- **Use Case**: Capturing early momentum shifts
- **Frequency**: Most frequent, good for active traders
### Signal 3: Structure Change
**Bar Color Change with RSI Confirmation** - Detects when candle color shifts with supporting RSI.
- **Use Case**: Trend continuation trades
- **Frequency**: Moderate
### Signal 4: BB Breakout + RSI
**Bollinger Band Breakout Reversal** - Price breaks band then immediately reverses.
- **Use Case**: Fade false breakouts
- **Frequency**: Moderate, excellent risk/reward
### Signal 5: BB/EMA50 Break
**Aggressive Breakout Signal** - Price breaks both BB and EMA50 simultaneously.
- **Use Case**: Momentum breakout trades
- **Frequency**: Moderate-high
### Signal 6: EMA50 Bounce Reversal
**Mean Reversion at EMA50** - Price touches EMA50 and bounces.
- **Use Case**: Trading pullbacks in strong trends
- **Frequency**: Moderate, reliable
### Signal 7: 🌟 OB Bounce (Star Signal)
**Order Block Bounce** - Price enters OB zone and reverses.
- **Use Case**: Institutional zone reactions
- **Frequency**: Low, but extremely high quality
- **Special Features**:
- 🎯 **OB Bounce Label**: `🌟 🎯 BUY/SELL ` - Actual Signal 7 bounce from visible OB
- 📍 **In OB Label**: `📍 BUY/SELL ` - Other signals (S1-6, S8) occurring inside an OB zone
- **OB Direction Filter**: Blocks contradictory signals (no SELL in bullish OB, no BUY in bearish OB)
### Signal 8: 🌟 60m NPR/BB Bounce (Star Signal)
**Extreme Mean-Reversion** - Price closes **inside** 60m NPR/BB bands at extremes.
- **Use Case**: Capturing institutional absorption at extremes
- **Frequency**: Low, exceptional win rate
- **Special Logic**: Candle close must be **INSIDE** bands, not just touching (prevents false breakouts)
### 💎 STRONG Signals (Bonus)
**CHoCH Pattern Completion** - Triple-confirmed structure shifts.
- **STRONG BUY**: `1.CHoCH → A.CHoCH → 1.CHoCH (≤20 bars)`
- **STRONG SELL**: `A.CHoCH → 1.CHoCH → A.CHoCH (≤20 bars)`
- **Display**: Immediate upon pattern completion (independent signal)
- **Use Case**: Highest-conviction institutional trend shifts
---
## 🎨 Visual Design Philosophy
### Signal Hierarchy via Transparency
**0% Transparency (Opaque)**:
- 💎 **STRONG BUY/SELL** - Highest priority, institutional pattern confirmation
**50% Transparency**:
- 🌟 **Star Signals** (S7, S8) - High-quality mean reversion
- 🎯 **OB Bounce** - Institutional zone reaction
- 📍 **In OB** - Enhanced signal in institutional zone
- **CHoCH Labels** (1.CHoCH, A.CHoCH) - Structure shift markers
**70% Transparency**:
- **Regular Signals** (S1-S6) - Standard trade setups
This visual hierarchy ensures traders **instantly recognize** high-priority setups without analysis paralysis.
### Color Scheme: Japanese Candlestick Convention
**Bullish = Red | Bearish = Blue/Green**
This follows traditional Japanese candlestick methodology where:
- **Red (Yang)**: Positive energy, rising prices, bullish
- **Blue/Green (Yin)**: Negative energy, falling prices, bearish
While Western conventions often reverse this, we maintain **ICT and institutional conventions** for consistency with professional trading rooms.
---
## 📡 Alert System
### Any Alert (Automatic)
**8 Events Monitored**:
1. 💎 **STRONG BUY** - Pattern: `1.CHoCH → A.CHoCH → 1.CHoCH`
2. 💎 **STRONG SELL** - Pattern: `A.CHoCH → 1.CHoCH → A.CHoCH`
3. ⭐ **Star BUY** - Signal 7 or 8
4. ⭐ **Star SELL** - Signal 7 or 8
5. 📍 **BUY (in OB)** - Any signal inside Bullish Order Block
6. 📍 **SELL (in OB)** - Any signal inside Bearish Order Block
7. **Bullish CHoCH** - Market structure shift to bullish
8. **Bearish CHoCH** - Market structure shift to bearish
**Format**: `TICKER TIMEFRAME EventName`
**Example**: `BTCUSDT 5 💎 STRONG BUY`
### Individual alertcondition() Options
Create custom alerts for specific events:
- BUY/SELL Signals (all or filtered)
- Star Signals Only (S7/S8)
- STRONG Signals Only (💎)
- CHoCH Events Only
- Bullish/Bearish CHoCH separately
---
## ⚙️ Configuration & Settings
### ICT Structure Filter (DEFAULT ON ⭐)
**Enable Structure Filter**: Display signals ONLY after CHoCH/SiMS/BoMS
- **Purpose**: Filter out noise by requiring institutional confirmation
- **Recommendation**: Keep enabled for disciplined trading
**Show Structure Labels (DEFAULT ON ⭐)**: Display CHoCH/SiMS/BoMS labels
- **Purpose**: Visual confirmation of market structure state
- **Labels**:
- `1.CHoCH` (Red background, white text) - Bullish structure shift
- `A.CHoCH` (Blue background, white text) - Bearish structure shift
- `2.SMS` / `B.SMS` (Red/Blue text) - Shift in Market Structure (2nd occurrence)
- `3.BMS` / `C.BMS` (Red/Blue text) - Break of Market Structure (3rd+ occurrence)
**Structure Period**: Default 3 bars (ICT standard)
### Order Block Configuration
**Enable Multi-Timeframe OBs**: Detect OBs from multiple timeframes simultaneously
**Mitigation Options**:
- Close - OB invalidated when candle closes through it
- Wick - OB invalidated when wick touches it
- 50% - OB invalidated when 50% of zone is violated
**Show OBs from**:
- Current Timeframe (always)
- 1m, 3m, 15m, 60m (selectable)
### Fair Value Gap Settings
**Show FVGs**: Enable/disable FVG rendering
**Mitigation Source**: Wick, Close, or 50% fill
**Color Customization**: Bullish FVG (green), Bearish FVG (red)
### Signal Filters
**Show ONLY Star Signals (DEFAULT OFF)**:
- When ON: Display only S7 (OB Bounce) and S8 (NPR/BB Bounce)
- When OFF: Display all signals S1-S8 (DEFAULT)
- **Use Case**: Focus on highest-quality setups, ignore noise
### Visual Settings
**EMA Display**: Toggle individual EMAs on/off
**VWC Cloud**: Enable/disable volumetric cloud
**NPR/BB Bands**: Show/hide 15m and 60m bands
**Status Table**: Real-time VWC status across all timeframes
---
## 📚 How to Use
### For Scalpers (1m-5m Charts)
1. Enable **1m and 3m Order Blocks**
2. Watch for **Signal 2 (VWC Switch)** or **Signal 5 (BB/EMA50 Break)**
3. Confirm with **1m/3m MTF OB** as support/resistance
4. Use **FVGs** for micro-target setting
5. Set alerts for **Star BUY/SELL** for highest-quality scalps
### For Day Traders (15m-60m Charts)
1. Enable **15m and 60m Order Blocks**
2. Wait for **CHoCH** to establish bias
3. Trade **Signal 7 (OB Bounce)** or **Signal 8 (60m NPR/BB Bounce)**
4. Use **EMA 50/100** as dynamic stop placement
5. Set alerts for **💎 STRONG BUY/SELL** for major moves
### For Swing Traders (4H-Daily Charts)
1. Enable **60m Order Blocks** (will render as larger zones on HTF)
2. Wait for **Market Structure confirmation** (CHoCH)
3. Focus on **Signal 1 (RSI Shift + Structure)** for highest conviction
4. Use **EMA 200/400/800** for macro trend alignment
5. Set alerts for **Bullish/Bearish CHoCH** to catch structure shifts early
### Universal Strategy (Recommended Approach)
1. **Focus on Primary Signals First** - Build your track record with 💎 STRONG and 🌟 Star Signals only
2. **Wait for Market Structure** - Never trade against CHoCH direction
3. **Use Auxiliary Signals for Confirmation** - When a Star Signal appears, check if auxiliary signals (S1-6) also confirm
4. **Respect Order Blocks** - Fade signals that contradict OB direction
5. **Use FVGs for Targets** - Price gravitates toward unfilled gaps
6. **Gradually Incorporate Auxiliary Signals** - Once profitable with primary signals, experiment with validated auxiliary setups
### Signal Quality Statistics (Typical Observation)
Based on common market behavior patterns:
**💎 STRONG Signals**:
- Frequency: Rare (1-3 per week on daily charts)
- Win Rate: Very High (70-85% when proper risk management applied)
- Risk/Reward: Excellent (1:3 to 1:5+ typical)
**🌟 Star Signals (S7, S8)**:
- Frequency: Moderate (2-5 per day on lower timeframes)
- Win Rate: High (60-75% when aligned with structure)
- Risk/Reward: Good (1:2 to 1:4 typical)
**Auxiliary Signals (S1-6)**:
- Frequency: High (multiple per hour on active timeframes)
- Win Rate: Moderate (50-65% standalone, higher when used as confirmation)
- Risk/Reward: Variable (1:1 to 1:3 typical)
**Key Insight**: Trading only primary signals reduces trade frequency but dramatically improves consistency and psychological ease.
---
## 🏆 What Makes This Indicator Unique
### 1. **True Multi-Timeframe Integration**
Most "MTF" indicators simply display data from other timeframes. Trend Gazer v5 **synthesizes** MTF data into unified signals, eliminating conflicting information.
### 2. **Non-Repainting Architecture**
All signals are fixed at bar close. What you see in backtests is exactly what you'd see in real-time.
### 3. **Institutional Focus**
Every component is designed around institutional behavior:
- Where they accumulate (Order Blocks)
- When they shift (CHoCH)
- What they must fix (FVGs)
- How they create momentum (VWC)
### 4. **Complete Transparency**
- **Open Source** - Full code visibility
- **Credited Sources** - All borrowed concepts attributed
- **No Black Boxes** - Every calculation is documented
### 5. **Flexible Yet Focused**
- **8 Signal Types** - Adapts to any market regime
- **Default Settings Optimized** - Works immediately without tweaking
- **Optional Filters** - "Show ONLY Star Signals" for disciplined traders
### 6. **Professional Alert System**
- **8-event Any Alert** - Never miss institutional moves
- **Individual alertconditions** - Customize to your strategy
- **Formatted Messages** - Ticker + Timeframe + Event for instant context
---
## 📖 Educational Value
### Learning ICT Concepts
This indicator serves as a **visual teaching tool** for:
- **Market Structure**: See CHoCH/SiMS/BoMS in real-time
- **Order Blocks**: Understand where institutions positioned
- **Fair Value Gaps**: Learn how inefficiencies are filled
- **Smart Money Behavior**: Watch institutional footprints unfold
### Backtesting & Strategy Development
Use Trend Gazer v5 to:
1. **Validate ICT Concepts** - Do OB bounces really work? Test it.
2. **Optimize Entry Timing** - Which signals work best in your market?
3. **Develop Filters** - Combine signals for your edge
4. **Build Strategies** - Export signals to Pine Script strategies
---
## ⚠️ Disclaimer
This indicator is for **educational and informational purposes only**. It should not be considered as financial advice or a recommendation to buy or sell any financial instrument.
**Trading involves substantial risk of loss**. Past performance is not indicative of future results. No indicator, regardless of sophistication, can guarantee profitable trades.
**Always:**
- Conduct your own research
- Use proper risk management (1-2% risk per trade)
- Consult with qualified financial advisors
- Practice on paper/demo accounts before live trading
- Understand that you are solely responsible for your trading decisions
---
## 🔗 Credits & Licenses
### Original Code Sources
1. **ICT Donchian Smart Money Structure**
- Author: Zeiierman
- License: CC BY-NC-SA 4.0
- Modifications: Integrated with multi-signal system, added CHoCH pattern detection
2. **Reverse RSI Signals**
- Author: AlgoAlpha
- License: MPL 2.0
- Modifications: Adapted for internal signal logic
3. **Volumetric Weighted Cloud (VWC/TBOSI)**
- Original concept adapted for multi-timeframe analysis
- Enhanced with MTF table display
4. **Order Block & FVG Detection**
- Based on ICT concepts
- Custom implementation with MTF support
### This Indicator's License
**Mozilla Public License 2.0 (MPL 2.0)**
You are free to:
- ✅ Use commercially
- ✅ Modify and distribute
- ✅ Use privately
- ✅ Patent use
Under conditions:
- 📄 Disclose source
- 📄 License and copyright notice
- 📄 Same license for modifications
---
## 📞 Support & Community
### Reporting Issues
If you encounter bugs or have feature suggestions, please provide:
1. Chart timeframe and symbol
2. Settings configuration
3. Screenshot of the issue
4. Expected vs actual behavior
### Best Practices
- Start with default settings
- Gradually enable/disable features to understand each component
- Use demo account for at least 30 days before live trading
- Combine with proper risk management
---
## 🚀 Version History
### v5.0 - Simplified ICT Mode (Current)
- ✅ Removed all unused filters and features
- ✅ Enabled all 8 signals by default
- ✅ Added 💎 STRONG CHoCH pattern detection
- ✅ Enhanced OB Bounce labeling system
- ✅ Added FVG detection and visualization
- ✅ Improved alert system (8 events)
- ✅ Optimized performance (faster rendering)
- ✅ Added comprehensive DESCRIPTION documentation
### v4.2 - ICT Mode with EMA Convergence Filter (Deprecated)
- Legacy version with EMA convergence features (removed for simplicity)
### v4.0 - Pure ICT Mode (Deprecated)
- Initial ICT-focused release
---
## 🎓 Recommended Learning Resources
To fully leverage this indicator, study:
1. **ICT Concepts** (Inner Circle Trader - YouTube)
- Market Structure
- Order Blocks
- Fair Value Gaps
- Liquidity Concepts
2. **Smart Money Concepts (SMC)**
- Change of Character (CHoCH)
- Break of Structure (BOS)
- Liquidity Sweeps
3. **Volume Spread Analysis (VSA)**
- Effort vs Result
- Supply vs Demand
- Volume Climax
4. **Risk Management**
- Position Sizing
- R-Multiple Theory
- Win Rate vs Risk/Reward Balance
---
## ✅ Quick Start Checklist
- Add indicator to chart
- Verify **Enable Structure Filter** is ON
- Verify **Show Structure Labels** is ON
- Enable desired MTF Order Blocks (1m, 3m, 15m, 60m)
- Enable FVG display
- Set up **Any Alert** for all 8 events
- Paper trade for 30 days minimum
- Document your trades (screenshots + notes)
- Review performance weekly
- Adjust filters based on your strategy
---
## 💡 Final Thoughts
**Trend Gazer v5 is not a "magic button" indicator.** It's a professional analytical framework that requires education, practice, and discipline.
The best traders don't use indicators to **tell them what to do**. They use indicators to **confirm what they already see** in price action.
Use this tool to:
- ✅ Confirm your analysis
- ✅ Filter out low-probability setups
- ✅ Identify institutional footprints
- ✅ Time entries with precision
Avoid using it to:
- ❌ Trade blindly without understanding context
- ❌ Ignore risk management
- ❌ Revenge trade after losses
- ❌ Replace education with automation
**Trade smart. Trade safe. Trade with structure.**
---
**© rasukaru666 | 2025 | Mozilla Public License 2.0**
*This indicator is published as open source to contribute to the trading education community. If it helps you, please share your experience and help others learn.*
------------------------------------------------------
# Trend Gazer v5: プロフェッショナル・マルチタイムフレームICT分析システム
## 📊 概要
**Trend Gazer v5** は、複数の実証済み手法を統合した分析フレームワークを提供する、包括的な機関投資家グレードの取引システムです。このインジケーターは、**ICT(Inner Circle Trader)コンセプト**、**スマートマネー構造**、**オーダーブロック検知**、**フェアバリューギャップ**、および**出来高分析**を組み合わせて、機関投資家の足跡に裏打ちされた高確率の取引セットアップをトレーダーに提供します。
断片的なインジケーターは、トレーダーに複数のツールを切り替えることを強いますが、Trend Gazer v5は**包括的な市場ビュー**を単一のオーバーレイで提供し、分析麻痺を排除して自信ある意思決定を可能にします。
---
## 🎯 なぜこの組み合わせが必要なのか
### 単一コンセプトインジケーターの問題点
従来のインジケーターは3つの致命的な欠陥を抱えています:
1. **孤立したコンテキスト** - 価格、出来高、構造が個別に分析され、矛盾するシグナルを生成
2. **タイムフレームの盲目性** - 単一タイムフレーム分析は、複数のタイムフレームで発生する機関投資家の活動を見逃す
3. **遅れた確認** - あるインジケーターが別のインジケーターの確認を待つことで、エントリーを逃し、エグジットが遅れる
### 機関投資家の取引実態
プロのトレーダーや機関投資家は、**複数の次元を同時に**操作します:
- **構造的コンテキスト**: 市場サイクルのどこにいるのか?(CHoCH、SiMS、BoMS)
- **オーダーフロー**: 機関投資家の需要と供給が集中しているのはどこか?(オーダーブロック)
- **非効率性**: 埋めなければならない価格の不均衡はどこか?(フェアバリューギャップ)
- **モメンタムコンテキスト**: 出来高は拡大しているか縮小しているか?(VWC/TBOSI)
- **平均回帰ポイント**: 機関投資家がリバウンドを期待する場所はどこか?(NPR/BB、EMA)
**Trend Gazer v5はこれらの次元を統合**し、個別のインジケーターでは提供できない市場マイクロ構造の完全な全体像を作成します。
---
## 🔬 コア分析フレームワーク
### 1️⃣ ICT ドンチャン・スマートマネー構造
**目的**: 大きな動きに先行する機関投資家の市場構造シフトを識別する。
**コンポーネント**:
- **CHoCH (Change of Character / 性質の変化)** - トレンド疲弊を示す市場構造のブレイク
- `1.CHoCH`(強気) - 直近安値のブレイク、強気構造へのシフト
- `A.CHoCH`(弱気) - 直近高値のブレイク、弱気構造へのシフト
- **SiMS (Shift in Market Structure / 市場構造のシフト)** - 初期構造シフト(2回目の発生)
- **BoMS (Break of Market Structure / 市場構造のブレイク)** - 継続構造(3回目以降の発生)
**なぜ不可欠なのか**:
小売トレーダーは価格変化に反応します。機関投資家は構造を破ることで価格変化を**作り出します**。**ドンチャンチャネル**(高値/安値追跡の最も純粋な形式)を使用してこれらのシフトを検出することで、機関投資家のバイアスが変化する正確な瞬間を特定します。
**クレジット**: Zeiierman氏の*ICT Donchian Smart Money Structure*に基づく(CC BY-NC-SA 4.0)
---
### 2️⃣ マルチタイムフレーム・オーダーブロック検知
**目的**: 価格が反転する可能性が高い機関投資家の需給ゾーンをマッピングする。
**方法論**:
オーダーブロックは、強い動きの前の**最後の反対方向ローソク足**を表します。これらのゾーンは、機関投資家がポジションを蓄積(強気OB)または分配(弱気OB)した場所を示します。
**マルチタイムフレームカバレッジ**:
- **1分足**: デイトレーダー向けスキャルピングゾーン
- **3分足**: 短期スイングゾーン
- **15分足**: イントラデイ機関投資家ゾーン
- **60分足**: デイリースイングゾーン
- **現在のTF**: 任意のチャートタイムフレームへの動的適応
**主要機能**:
- **バウンス検知** - OBゾーンから価格がリバウンドする時を識別(シグナル7: 🎯 OBバウンス)
- **ブレーカー追跡** - OBが破られた時を監視し、強気OBを抵抗に、弱気OBをサポートに変換
- **ビジュアルレンダリング** - OBの強度を示す透明度付きの色分けされたボックス
- **OB方向フィルター** - 矛盾するシグナルをブロック(強気OBでSELLなし、弱気OBでBUYなし)
**なぜMTFオーダーブロックが重要か**:
60分足のオーダーブロックは、より大きなタイムフレームでの機関投資家のポジショニングを表します。3分足のエントリーシグナルと組み合わせることで、大口プレイヤーと**同じ方向**で取引することになります。
---
### 3️⃣ フェアバリューギャップ(FVG)検知
**目的**: 機関投資家が最終的に埋めなければならない価格の非効率性を識別する。
**FVGとは何か?**:
フェアバリューギャップは、価格があまりにも急速に動いて**不均衡**を残す時に発生します - 1本のローソク足の高値と2本後のローソク足の安値の間のギャップ(またはその逆)。機関投資家はこれらを修正されなければならない非効率的な価格設定と見なします。
**検知ロジック**:
```
強気FVG: high < low → ギャップアップ = 弱気の不均衡(下方フィル予想)
弱気FVG: low > high → ギャップダウン = 強気の不均衡(上方フィル予想)
```
**ビジュアルデザイン**:
- **強気FVG**: 緑のボックス(価格がバウンドすべきサポートゾーン)
- **弱気FVG**: 赤のボックス(価格が拒否されるべき抵抗ゾーン)
- **ミティゲーション追跡**: FVGは埋められると消え、完了を示す
- **出来高帰属**: 各FVGは関連する買い/売り出来高を追跡
**なぜFVGが重要か**:
機関投資家は**効率性**で動きます。ギャップは非効率性を表します。価格がギャップを埋めるために戻る時、それはランダムではありません - 機関投資家が**市場の非効率性を修正**しているのです。FVGフィルへの取引は卓越したリスク/リワードを提供します。
---
### 4️⃣ 出来高加重クラウド(VWC/TBOSI)
**目的**: 出来高加重プライスアクションを使用してモメンタムシフトとトレンド強度を検出する。
**メカニズム**:
VWCは移動平均に**ボラティリティ加重**を適用し、高ボラティリティトレンド中に拡大し、コンソリデーション中に縮小する動的クラウドを作成します。
**マルチタイムフレーム分析**:
- **1m、3m、5m**: マイクロスキャルピングモメンタム
- **15m**: イントラデイトレンド確認
- **60m、240m**: スイングトレードトレンド検証
**シグナル生成**:
- **VWCスイッチ(シグナル2)**: クラウドの色が反転した時(赤→緑または緑→赤)、モメンタム反転を示す
- **VWCステータステーブル**: 全タイムフレームのトレンド方向のリアルタイム表示
**なぜ出来高加重が重要か**:
従来の移動平均はすべてのバーを等しく扱います。VWCは**高出来高バーに重みを与え**、シグナルが低出来高のノイズではなく、実際の機関投資家の参加を反映することを保証します。
---
### 5️⃣ ノンリペイントSTDEV(NPR)&ボリンジャーバンド
**目的**: リペイントなしで極端な平均回帰ポイントを識別する。
**従来のインジケーターの問題点**:
多くのインジケーターは**リペイント**します - 新しいデータが到着すると過去の値を変更し、バックテストを誤解させます。NPRは**先読みバイアス防止**を使用して、シグナルが固定されたままであることを保証します。
**設定**:
- **15分足NPR/BB**: イントラデイボラティリティバンド
- **60分足NPR/BB**: スイングトレード極値
- **複数のカーネルオプション**: 指数、単純、二重指数、三重指数 - 異なる平滑化プロファイル
**シグナルロジック(シグナル8)**:
- **BUY**: 価格が下部バンドの**内側**でクローズ(触れるだけではない)→ 極端な売られ過ぎで機関投資家の吸収が可能性高い
- **SELL**: 価格が上部バンドの**内側**でクローズ → 極端な買われ過ぎで機関投資家の分配が可能性高い
**なぜNPRが優れているか**:
リペイントインジケーターはトレーダーにバックテストで誤った自信を与えます。NPRは、履歴で見るすべてのシグナルが、トレーダーがリアルタイムで見たであろうもの**そのもの**であることを保証します。
---
### 6️⃣ 💎 STRONG CHoChパターン検知
**目的**: 短い時間枠内で複数のCHoCH確認が整列した時の最高確率セットアップを識別する。
**パターンロジック**:
**STRONG BUYパターン**:
```
1.CHoCH → A.CHoCH → 1.CHoCH(20バー以内)
```
このシーケンスは以下を示します:
1. 初期強気構造シフト
2. 弱気リテスト(プルバック)
3. **更新された強気確認** - 機関投資家は弱い手を振り落とした後に再蓄積中
**STRONG SELLパターン**:
```
A.CHoCH → 1.CHoCH → A.CHoCH(20バー以内)
```
このシーケンスは以下を示します:
1. 初期弱気構造シフト
2. 強気リテスト(デッドキャットバウンス)
3. **更新された弱気確認** - 機関投資家はロングを罠にかけた後に再分配中
**ビジュアル表示**:
```
💎 BUY
```
- **0%透明度**(完全不透明) - 最大の視覚的優先度
- パターン完成時に**即座に**表示(追加シグナル不要)
- 市場構造フィルターから独立(パターン自体が確認)
**なぜSTRONGシグナルが異なるか**:
- **三重確認**: 3つの構造シフトが誤ったブレイクアウトを排除
- **短い時間枠**: 20バーウィンドウがランダムなノイズではなく、機関投資家の確信を保証
- **自動表示**: 価格アクションを待たない - パターン自体がアラートをトリガー
- **歴史的検証**: この特定のシーケンスは主要な機関投資家の動きに先行することが証明されている
**リスク管理**:
STRONGシグナルは最高のリスク/リワードを提供します:
1. ストップロスは中央のCHoCHの外に配置可能(タイトなリスク)
2. ターゲットは次の主要構造レベルに設定可能(大きなリワード)
3. パターン失敗は即座に明らか(間違っていればクイックエグジット)
---
### 7️⃣ マルチEMAフレームワーク
**目的**: ダイナミックなサポート/レジスタンスとトレンドコンテキストを提供する。
**EMA設定**:
- **EMA 7**: マイクロトレンド(スキャルピング)
- **EMA 20**: 短期トレンド
- **EMA 50**: 機関投資家のピボット(シグナル6: EMA50バウンス)
- **EMA 100**: 中期トレンドフィルター
- **EMA 200**: 主要な機関投資家のサポート/レジスタンス
- **EMA 400、800**: マクロトレンドコンテキスト
**ビジュアルフィル**:
- EMA間の色分けされたフィルが**ビジュアルトレンド強度ゾーン**を作成
- 収束 = コンソリデーション
- 発散 = トレンド市場
**なぜ7つのEMAか?**:
各EMAは異なる**参加者タイムフレーム**を表します:
- EMA 7/20: デイトレーダーとスキャルパー
- EMA 50/100: スイングトレーダー
- EMA 200/400/800: ポジショントレーダーと機関投資家
すべてのEMAが整列した時、**すべての参加者タイプが方向に同意**している - 最高確率のトレンド取引です。
---
## 🚀 8シグナル取引システム
Trend Gazer v5は**8つの異なるシグナル条件**(すべてデフォルトで有効)を採用しており、それぞれが異なる市場レジームを捕捉するように設計されています:
### ⭐ シグナル階層&取引哲学
**重要**: すべてのシグナルが同じではありません。インジケーターはシグナル品質の階層を表示します:
**プライマリーシグナル(これを取引する)**:
- 💎 **STRONG BUY/SELL** - 三重CHoChパターン(最優先)
- 🌟 **スターシグナル(S7、S8)** - 高確率の機関投資家ゾーン反応
- シグナル7: オーダーブロックバウンス
- シグナル8: 60m NPR/BBバウンス
**補助シグナル(確認とコンテキスト)**:
- **シグナル1-6** - これらを以下として使用:
- スターシグナルの**確認**(複数のシグナルが整列した時)
- 市場状況を理解するための**コンテキスト**
- 潜在的な動きの**早期警告**(取引前に検証)
- **追加フィルター**(例:「シグナル1も出ているスターシグナルのみ取引」)
**取引推奨**:
- **保守的トレーダー**: 💎 STRONGと🌟スターシグナル**のみ**取引
- **中程度トレーダー**: スターシグナル + 検証された補助シグナル(2+シグナル確認)
- **アクティブトレーダー**: 適切なリスク管理ですべてのシグナルを使用
視覚的透明度システムはこの階層を強化します:
- 0%透明度 = STRONG(💎) - 最高の確信
- 50%透明度 = スター(🌟)+ OBシグナル - 高品質
- 70%透明度 = 補助(S1-S6) - 補足情報
### シグナル1: RSIシフト + 構造(ANDロジック)
**最も厳格なシグナル** - RSIモメンタム確認と構造変化の両方が必要。
- **使用例**: トレンド市場での高確信取引
- **頻度**: 最も少ない、最高の精度
- **分類**:
### シグナル2: VWCスイッチ(ORロジック)
**最も頻繁なシグナル** - 監視されているタイムフレームでのVWC色反転でトリガー。
- **使用例**: 早期モメンタムシフトの捕捉
- **頻度**: 最も頻繁、アクティブトレーダーに適している
- **分類**:
### シグナル3: 構造変化
**バーカラー変化とRSI確認** - RSIサポートでローソク足の色がシフトする時を検出。
- **使用例**: トレンド継続取引
- **頻度**: 中程度
- **分類**:
### シグナル4: BBブレイクアウト + RSI
**ボリンジャーバンドブレイクアウト反転** - 価格がバンドを破った後すぐに反転。
- **使用例**: 誤ったブレイクアウトをフェード
- **頻度**: 中程度、優れたリスク/リワード
- **分類**:
### シグナル5: BB/EMA50ブレイク
**積極的ブレイクアウトシグナル** - 価格がBBとEMA50を同時にブレイク。
- **使用例**: モメンタムブレイクアウト取引
- **頻度**: 中〜高
- **分類**:
### シグナル6: EMA50バウンス反転
**EMA50での平均回帰** - 価格がEMA50に触れてバウンス。
- **使用例**: 強いトレンドでのプルバック取引
- **頻度**: 中程度、信頼性あり
- **分類**:
### シグナル7: 🌟 OBバウンス(スターシグナル)
**オーダーブロックバウンス** - 価格がOBゾーンに入って反転。
- **使用例**: 機関投資家ゾーン反応
- **頻度**: 低いが、極めて高品質
- **分類**:
- **特別機能**:
- 🎯 **OBバウンスラベル**: `🌟 🎯 BUY/SELL ` - 可視OBからの実際のシグナル7バウンス
- 📍 **In OBラベル**: `📍 BUY/SELL ` - OBゾーン内で発生する他のシグナル(S1-6、S8)
- **OB方向フィルター**: 矛盾するシグナルをブロック(強気OBでSELLなし、弱気OBでBUYなし)
### シグナル8: 🌟 60m NPR/BBバウンス(スターシグナル)
**極端な平均回帰** - 価格が60m NPR/BBバンドの極値で**内側に**クローズ。
- **使用例**: 極値での機関投資家の吸収を捕捉
- **頻度**: 低い、卓越した勝率
- **分類**:
- **特別ロジック**: ローソク足のクローズがバンドの**内側**でなければならない(触れるだけではダメ、誤ったブレイクアウトを防止)
### 💎 STRONGシグナル(ボーナス)
**CHoChパターン完成** - 三重確認された構造シフト。
- **STRONG BUY**: `1.CHoCH → A.CHoCH → 1.CHoCH(≤20バー)`
- **STRONG SELL**: `A.CHoCH → 1.CHoCH → A.CHoCH(≤20バー)`
- **表示**: パターン完成時に即座(独立したシグナル)
- **分類**:
- **使用例**: 最高確信の機関投資家トレンドシフト
---
## 🎨 ビジュアルデザイン哲学
### 透明度によるシグナル階層
**0%透明度(不透明)**:
- 💎 **STRONG BUY/SELL** - 最優先、機関投資家パターン確認
**50%透明度**:
- 🌟 **スターシグナル**(S7、S8) - 高品質平均回帰
- 🎯 **OBバウンス** - 機関投資家ゾーン反応
- 📍 **In OB** - 機関投資家ゾーン内の強化されたシグナル
- **CHoChラベル**(1.CHoCH、A.CHoCH) - 構造シフトマーカー
**70%透明度**:
- **通常シグナル**(S1-S6) - 標準取引セットアップ
この視覚的階層により、トレーダーは分析麻痺なしに高優先度セットアップを**即座に認識**できます。
### カラースキーム: 日本式ローソク足慣例
**強気 = 赤 | 弱気 = 青/緑**
これは伝統的な日本式ローソク足方法論に従います:
- **赤(陽)**: ポジティブエネルギー、上昇価格、強気
- **青/緑(陰)**: ネガティブエネルギー、下降価格、弱気
西洋の慣例はしばしばこれを逆にしますが、プロの取引ルームとの一貫性のために**ICTと機関投資家の慣例**を維持します。
---
## 📡 アラートシステム
### Any Alert(自動)
**8つのイベントを監視**:
1. 💎 **STRONG BUY** - パターン: `1.CHoCH → A.CHoCH → 1.CHoCH`
2. 💎 **STRONG SELL** - パターン: `A.CHoCH → 1.CHoCH → A.CHoCH`
3. ⭐ **Star BUY** - シグナル7または8
4. ⭐ **Star SELL** - シグナル7または8
5. 📍 **BUY (in OB)** - 強気オーダーブロック内の任意のシグナル
6. 📍 **SELL (in OB)** - 弱気オーダーブロック内の任意のシグナル
7. **Bullish CHoCH** - 強気への市場構造シフト
8. **Bearish CHoCH** - 弱気への市場構造シフト
**フォーマット**: `TICKER TIMEFRAME EventName`
**例**: `BTCUSDT 5 💎 STRONG BUY`
### 個別alertcondition()オプション
特定のイベントのカスタムアラートを作成:
- BUY/SELLシグナル(すべてまたはフィルタリング)
- スターシグナルのみ(S7/S8)
- STRONGシグナルのみ(💎)
- CHoChイベントのみ
- 強気/弱気CHoCH個別
---
## ⚙️ 設定と設定
### ICT構造フィルター(デフォルトON ⭐)
**構造フィルターを有効化**: CHoCH/SiMS/BoMS後のシグナル**のみ**表示
- **目的**: 機関投資家の確認を要求することでノイズをフィルター
- **推奨**: 規律ある取引のために有効のままにする
**構造ラベルを表示(デフォルトON ⭐)**: CHoCH/SiMS/BoMSラベルを表示
- **目的**: 市場構造状態の視覚的確認
- **ラベル**:
- `1.CHoCH`(赤背景、白テキスト) - 強気構造シフト
- `A.CHoCH`(青背景、白テキスト) - 弱気構造シフト
- `2.SMS` / `B.SMS`(赤/青テキスト) - 市場構造のシフト(2回目)
- `3.BMS` / `C.BMS`(赤/青テキスト) - 市場構造のブレイク(3回目以降)
**構造期間**: デフォルト3バー(ICT標準)
### オーダーブロック設定
**マルチタイムフレームOBを有効化**: 複数のタイムフレームから同時にOBを検出
**ミティゲーションオプション**:
- Close - ローソク足がクローズで通過した時にOB無効化
- Wick - ウィックが触れた時にOB無効化
- 50% - ゾーンの50%が侵害された時にOB無効化
**OBを表示**:
- 現在のタイムフレーム(常に)
- 1m、3m、15m、60m(選択可能)
### フェアバリューギャップ設定
**FVGを表示**: FVGレンダリングを有効/無効
**ミティゲーションソース**: Wick、Close、または50%フィル
**カラーカスタマイゼーション**: 強気FVG(緑)、弱気FVG(赤)
### シグナルフィルター
**スターシグナルのみ表示(デフォルトOFF)**:
- ONの時: S7(OBバウンス)とS8(NPR/BBバウンス)のみ表示
- OFFの時: すべてのシグナルS1-S8を表示(デフォルト)
- **使用例**: 最高品質のセットアップに集中し、ノイズを無視
### ビジュアル設定
**EMA表示**: 個別のEMAをオン/オフ切り替え
**VWCクラウド**: 出来高クラウドを有効/無効
**NPR/BBバンド**: 15mと60mバンドを表示/非表示
**ステータステーブル**: すべてのタイムフレームでのリアルタイムVWCステータス
---
## 📚 使用方法
### スキャルパー向け(1m-5m チャート)
1. **1mと3mオーダーブロック**を有効化
2. **シグナル2(VWCスイッチ)**または**シグナル5(BB/EMA50ブレイク)**を監視
3. サポート/レジスタンスとして**1m/3m MTF OB**で確認
4. マイクロターゲット設定に**FVG**を使用
5. 最高品質のスキャルプのために**Star BUY/SELL**のアラートを設定
### デイトレーダー向け(15m-60m チャート)
1. **15mと60mオーダーブロック**を有効化
2. バイアスを確立するために**CHoCH**を待つ
3. **シグナル7(OBバウンス)**または**シグナル8(60m NPR/BBバウンス)**を取引
4. ダイナミックストップ配置に**EMA 50/100**を使用
5. 主要な動きのために**💎 STRONG BUY/SELL**のアラートを設定
### スイングトレーダー向け(4H-日足 チャート)
1. **60mオーダーブロック**を有効化(HTFでより大きなゾーンとしてレンダリング)
2. **市場構造確認**(CHoCH)を待つ
3. 最高確信のために**シグナル1(RSIシフト + 構造)**に集中
4. マクロトレンド整列のために**EMA 200/400/800**を使用
5. 構造シフトを早期に捕捉するために**Bullish/Bearish CHoCH**のアラートを設定
### ユニバーサル戦略(推奨アプローチ)
1. **まずプライマリーシグナルに集中** - 💎 STRONGと🌟スターシグナル**のみ**でトラックレコードを構築
2. **市場構造を待つ** - CHoCH方向に逆らって取引しない
3. **補助シグナルを確認に使用** - スターシグナルが現れたら、補助シグナル(S1-6)も確認するかチェック
4. **オーダーブロックを尊重** - OB方向と矛盾するシグナルをフェード
5. **ターゲットにFVGを使用** - 価格は埋められていないギャップに引き寄せられる
6. **徐々に補助シグナルを組み込む** - プライマリーシグナルで利益が出たら、検証された補助セットアップを実験
### シグナル品質統計(典型的な観察)
一般的な市場行動パターンに基づく:
**💎 STRONGシグナル**:
- 頻度: まれ(日足チャートで週1-3回)
- 勝率: 非常に高い(適切なリスク管理適用時70-85%)
- リスク/リワード: 優秀(典型的に1:3から1:5+)
**🌟 スターシグナル(S7、S8)**:
- 頻度: 中程度(短期足で1日2-5回)
- 勝率: 高い(構造と整列時60-75%)
- リスク/リワード: 良好(典型的に1:2から1:4)
**補助シグナル(S1-6)**:
- 頻度: 高い(活発なタイムフレームで1時間に複数回)
- 勝率: 中程度(単独で50-65%、確認として使用時はより高い)
- リスク/リワード: 変動(典型的に1:1から1:3)
**重要な洞察**: プライマリーシグナルのみの取引は取引頻度を減らしますが、一貫性と心理的容易さを劇的に改善します。
---
## 🏆 このインジケーターのユニークな点
### 1. **真のマルチタイムフレーム統合**
ほとんどの「MTF」インジケーターは単に他のタイムフレームからデータを表示するだけです。Trend Gazer v5はMTFデータを統一されたシグナルに**合成**し、矛盾する情報を排除します。
### 2. **ノンリペイント・アーキテクチャ**
すべてのシグナルはバークローズで固定されます。バックテストで見るものは、リアルタイムで見るであろうもの**そのもの**です。
### 3. **機関投資家フォーカス**
すべてのコンポーネントは機関投資家の行動を中心に設計されています:
- どこで蓄積するか(オーダーブロック)
- いつシフトするか(CHoCH)
- 何を修正しなければならないか(FVG)
- どのようにモメンタムを作り出すか(VWC)
### 4. **完全な透明性**
- **オープンソース** - 完全なコード可視性
- **クレジットされたソース** - すべての借用コンセプトが帰属
- **ブラックボックスなし** - すべての計算が文書化
### 5. **柔軟だが焦点を絞った**
- **8シグナルタイプ** - 任意の市場レジームに適応
- **最適化されたデフォルト設定** - 調整なしですぐに動作
- **オプションフィルター** - 規律あるトレーダーのための「スターシグナルのみ表示」
### 6. **プロフェッショナルアラートシステム**
- **8イベントAny Alert** - 機関投資家の動きを見逃さない
- **個別alertconditions** - あなたの戦略にカスタマイズ
- **フォーマットされたメッセージ** - 即座のコンテキストのためのTicker + Timeframe + Event
---
## 📖 教育的価値
### ICT概念の学習
このインジケーターは以下のための**視覚的教育ツール**として機能します:
- **市場構造**: CHoCH/SiMS/BoMSをリアルタイムで見る
- **オーダーブロック**: 機関投資家がどこでポジショニングしたかを理解
- **フェアバリューギャップ**: 非効率性がどのように埋められるかを学ぶ
- **スマートマネー行動**: 機関投資家の足跡が展開するのを観察
### バックテスティングと戦略開発
Trend Gazer v5を使用して:
1. **ICT概念を検証** - OBバウンスは本当に機能するか?テストする。
2. **エントリータイミングを最適化** - あなたの市場でどのシグナルが最も機能するか?
3. **フィルターを開発** - あなたのエッジのためにシグナルを組み合わせる
4. **戦略を構築** - シグナルをPine Scriptストラテジーにエクスポート
---
## ⚠️ 免責事項
このインジケーターは**教育および情報提供のみを目的**としています。金融アドバイスではありません。
**リスク警告**:
- 取引には重大な損失リスクが伴い、すべての投資家に適しているわけではありません
- 過去のパフォーマンスは将来の結果を**示すものではありません**
- どのインジケーターも利益ある取引を保証することはできません
- あなたは自分の取引決定に対して単独で責任を負います
**取引前に**:
- 自分自身の調査とデューデリジェンスを実施
- 資格のある金融アドバイザーに相談
- 適切なリスク管理を使用(取引あたり1-2%以上リスクを取らない)
- ライブ取引前にペーパー/デモアカウントで練習
- 損失は取引の一部であることを理解
このインジケーターによって提供される情報は、投資アドバイス、金融アドバイス、取引アドバイス、またはその他の種類のアドバイスを構成するものではありません。インジケーターの出力をそのように扱うべきではありません。作成者は、あなたが任意の暗号通貨、証券、または商品を買い、売り、または保有すべきであると推奨するものではありません。常に自分自身の調査を行い、専門的なアドバイスを求めてください。
このソフトウェアは、明示的または黙示的を問わず、いかなる種類の保証もなく「現状のまま」提供されます。
---
## 🔗 クレジットとライセンス
### 原作コードソース
1. **ICT Donchian Smart Money Structure**
- 作者: Zeiierman
- ライセンス: CC BY-NC-SA 4.0
- 変更: マルチシグナルシステムと統合、CHoChパターン検知を追加
2. **Reverse RSI Signals**
- 作者: AlgoAlpha
- ライセンス: MPL 2.0
- 変更: 内部シグナルロジックに適応
3. **Volumetric Weighted Cloud(VWC/TBOSI)**
- 元のコンセプトをマルチタイムフレーム分析に適応
- MTFテーブル表示で強化
4. **Order Block & FVG Detection**
- ICTコンセプトに基づく
- MTFサポートでカスタム実装
### このインジケーターのライセンス
**Mozilla Public License 2.0(MPL 2.0)**
以下が自由です:
- ✅ 商用利用
- ✅ 変更と配布
- ✅ 私的使用
- ✅ 特許使用
条件:
- 📄 ソースを開示
- 📄 ライセンスと著作権表示
- 📄 変更に同じライセンス
---
## 📞 サポートとコミュニティ
### 問題の報告
バグに遭遇したり機能提案がある場合は、以下を提供してください:
1. チャートタイムフレームとシンボル
2. 設定構成
3. 問題のスクリーンショット
4. 期待される動作と実際の動作
### ベストプラクティス
- デフォルト設定で開始
- 各コンポーネントを理解するために段階的に機能を有効/無効化
- ライブ取引前に少なくとも30日間デモアカウントを使用
- 適切なリスク管理と組み合わせる
---
## 🚀 バージョン履歴
### v5.0 - Simplified ICT Mode(現在)
- ✅ すべての未使用フィルターと機能を削除
- ✅ すべての8シグナルをデフォルトで有効化
- ✅ 💎 STRONG CHoChパターン検知を追加
- ✅ OBバウンスラベリングシステムを強化
- ✅ FVG検知と可視化を追加
- ✅ アラートシステムを改善(8イベント)
- ✅ パフォーマンスを最適化(より速いレンダリング)
- ✅ 包括的なDESCRIPTIONドキュメントを追加
### v4.2 - ICT Mode with EMA Convergence Filter(非推奨)
- EMA収束機能を持つレガシーバージョン(シンプルさのために削除)
### v4.0 - Pure ICT Mode(非推奨)
- 初期ICTフォーカスリリース
---
## 🎓 推奨学習リソース
このインジケーターを完全に活用するために、以下を学習してください:
1. **ICTコンセプト**(Inner Circle Trader - YouTube)
- 市場構造
- オーダーブロック
- フェアバリューギャップ
- 流動性コンセプト
2. **スマートマネーコンセプト(SMC)**
- Change of Character(CHoCH)
- Break of Structure(BOS)
- Liquidity Sweeps
3. **Volume Spread Analysis(VSA)**
- Effort vs Result
- Supply vs Demand
- Volume Climax
4. **リスク管理**
- ポジションサイジング
- R-Multiple理論
- 勝率vsリスク/リワードバランス
---
## ✅ クイックスタートチェックリスト
- チャートにインジケーターを追加
- **構造フィルターを有効化**がONであることを確認
- **構造ラベルを表示**がONであることを確認
- 希望するMTFオーダーブロックを有効化(1m、3m、15m、60m)
- FVG表示を有効化
- すべての8イベントのために**Any Alert**を設定
- 最低30日間ペーパートレード
- 取引を文書化(スクリーンショット + ノート)
- 週次でパフォーマンスをレビュー
- あなたの戦略に基づいてフィルターを調整
---
## 💡 最後の考え
**Trend Gazer v5は「魔法のボタン」インジケーターではありません。**教育、練習、規律を必要とするプロフェッショナル分析フレームワークです。
最高のトレーダーは、インジケーターを使って**何をすべきかを教えてもらいません**。インジケーターを使って、プライスアクションで**既に見ているものを確認**します。
このツールを使用して:
- ✅ 分析を確認
- ✅ 低確率セットアップをフィルターアウト
- ✅ 機関投資家の足跡を識別
- ✅ エントリーを精密にタイミング
使用を避けるべき:
- ❌ コンテキストを理解せずに盲目的に取引
- ❌ リスク管理を無視
- ❌ 損失後にリベンジトレード
- ❌ 教育を自動化に置き換える
**スマートに取引しましょう。安全に取引しましょう。構造を持って取引しましょう。**
---
**© rasukaru666 | 2025 | Mozilla Public License 2.0**
*このインジケーターは、取引教育コミュニティに貢献するためにオープンソースとして公開されています。役立つ場合は、あなたの経験を共有して他の人が学ぶのを助けてください。*

Candle 2 Closure📌 Indicator Presentation – Candle 2 Closure
" Candle 2 Closure "s is an indicator designed to identify three types of price–action-based signals in real time: Long, Short, and Generic.
The goal is to visually highlight moments when the market breaks a key level of the previous candle but rejects that break, closing on the opposite side.
The idea was inspired by the study of pure price action and specifically by the following video:
👉 www.youtube.com
🎯 How the Indicator Works
The indicator generates signals on bar close (barstate.isconfirmed), making them reliable and free from repainting.
🔵 LONG Signal
A long signal is triggered when:
The current candle breaks the low of the previous candle
But then closes back above that low
→ This is often a sign of a bear trap or a liquidity rejection to the downside.
🔴 SHORT Signal
A short signal is triggered when:
The current candle breaks the high of the previous candle
But then closes back below that high
→ This may indicate a bull trap or a liquidity rejection to the upside.
⚪ GENERIC Signal
A generic signal is triggered when:
A high or low is broken,
But neither the long nor short conditions are met,
Resulting in a simple unconfirmed break.
📍 Operational Advantages
Highlights liquidity absorption zones
Works on all timeframes (1m → 1D)
Useful for scalping, intraday, or swing trading
Clear and immediate visual signals on the chart
Zero repainting
✨ Visual Style
LONG displayed below the candle, white color
SHORT displayed above the candle, white color
Generic signal shown with a neutral label

Volume-Confirmed FTR Zones [AlgoPoint]FTR Zone Indicator — Fail To Return Zones (With Volume Confirmation)
Advanced Smart Money Zone Detection for Institutional Orderflow
The FTR Zone Indicator is a professional-grade tool designed for traders who follow Smart Money Concepts (SMC), ICT methodologies, or institutional orderflow. It automatically detects Fail To Return Zones (FTR) — high-probability supply and demand areas formed after strong displacement moves.
By combining impulse detection, base identification, and volume confirmation, this indicator highlights zones where price is most likely to react, reverse, or mitigate shortly after structure breaks.
⸻
⭐ What Are FTR Zones?
FTR zones (Fail To Return zones) are price areas where:
1. A strong displacement / impulse candle is formed
2. That impulse originates from a small consolidation (base)
3. Price moves away aggressively
4. AND fails to return immediately to the origin area
These zones often indicate:
• Institutional orders
• Imbalance
• Hidden liquidity
• Origin of a trend leg
• High-probability mitigation points
This indicator fully automates the detection and visualization of such areas.
🔍 How the Indicator Works
1. Impulse Detection
The indicator identifies a valid impulse candle using:
• ATR-based bar range filter
• Trend-aligned candle body direction
• Optional volume confirmation
Only large, meaningful institutional candles qualify — filtering out noise.
2. Base Zone Identification
Before every impulse, the tool finds the micro-consolidation base using:
• Highest high of the last X bars
• Lowest low of the last X bars
This base becomes the potential FTR zone.
3. FTR Zone Creation
When a valid impulse is detected:
• Bullish impulse → Demand FTR zone
• Bearish impulse → Supply FTR zone
The zone is immediately drawn on the chart using box.new().
4. Zone Extension
Every zone continuously extends to the right as price evolves, allowing you to track:
• Mitigation
• Retests
• Reaction points
• Liquidity sweeps
5. Invalidation Logic
Zones automatically delete when violated:
• Demand zone invalid if close < zone low
• Supply zone invalid if close > zone high
This keeps the chart clean and helps focus only on active, high-value areas.
🎛️ Key Features
✔ Automatic FTR Zone Detection
Instantly identifies institutional origin zones based on real impulse and displacement.
✔ Volume-Based Filtering
Ensures only high-volume impulses (true institutional orders) create zones.
✔ Supply & Demand Coloring
• Bullish FTR → Demand Zone (Teal tone)
• Bearish FTR → Supply Zone (Red tone)
✔ Safe Zone Storage
Fault-tolerant logic ensures no array errors, invalid zones, or broken visuals.
✔ Auto-Extending Boxes
Real-time zone updates with precise historical mapping.
✔ Smart Invalidation
Zone is removed only when fully broken, preventing false signals.
✔ Clean, Non-Repainting Logic
Impulse detection and zone placement are confirmed only on bar close.
📈 How to Use It (Example Schenarios)
For Reversals or Continuations
• Look for price reacting or mitigating inside a zone
• Use as entry confirmation in trend continuations
• Combine with FVG, BOS/CHOCH, liquidity sweeps, or premium/discount zones
For Scalping or Intraday Trading
• High-probability countertrend entries
• Reaction-based setups at institutional footprints
For Swing Traders
• Identify weekly/daily origin zones
• Plan entries around large displacement points

Mickey's Breaker Engine⚡ Breaker Engine | Auto Retest + Smart R:R Targets
A precision-grade breaker-block detection system built for traders who live and breathe clean structure.
This indicator automatically detects Breaker Candles, confirms them, marks their zones, and executes intelligent retest-based entry logic — complete with Stop-Loss and Risk-to-Reward (R:R) tracking up to 3R (or any custom ratio).
🧠 Core Concept
A Breaker Block is a structural shift where price violates liquidity from a failed order block and flips the zone’s polarity — turning a former supply into demand (or vice-versa).
This script identifies those setups automatically, confirms them only after a valid structure break, and waits for a clean retest to trigger a trade signal.
🚀 Key Features
⚙️ Smart Zone Detection
Detects both Bullish Breakers and Bearish Breakers.
Zones are drawn precisely using the breaker’s middle candle body (or full wick range if enabled).
Fully configurable transparency, width, and extension for better visual context.
🎯 Auto Retest Entry Logic
Entry triggers only on a clean retest, not on immediate breakout.
Includes logical filters to ensure retests are structurally valid and not overlapping candles.
Works in any timeframe or market — crypto, forex, indices, or commodities.
💡 Dynamic Risk–Reward Tracking
Automatically plots 1R, 2R, 3R, ...R targets based on your defined stop range.
Risk is calculated from entry to zone boundary or ATR offset.
Each target label appears precisely when hit.
Targets automatically stop updating once Stop-Loss is triggered.
🧱 Visual Clarity
BUY 🟢 / SELL 🔴 bubbles at entries.
SL ❌ marker when stop is hit.
🎯 1R / 2R / 3R labels dynamically plotted when each reward level is reached.
Non-overlapping placement using ATR-based spacing.
⚡ Real-Time Alerts - Instant alerts for:
✅ “Breaker BUY” – Clean retest confirmed (Long setup)
✅ “Breaker SELL” – Clean retest confirmed (Short setup)
❌ “Breaker BUY SL” – Stop hit for Long
❌ “Breaker SELL SL” – Stop hit for Short
🧩 Customization Panel
| Setting | Description |
| :-------------------------- | :------------------------------------------------------------------------------ |
| **ATR Length** | Controls volatility-based offset sizing. |
| **Entry / SL Offset × ATR** | Adjusts label spacing and dynamic positioning. |
| **Risk-Reward Ratio** | Define default R:R (e.g. 1:3). |
| **Multiple Retests** | Enable if you want the same breaker zone to allow multiple retests/entries. |
| **Banner Design** | Control opacity, extension, and wick usage for the breaker block visualization. |
| **Color Controls** | Choose your BUY/SELL/SL bubble colors to match your chart theme. |
⚙️ Underlying Logic (At a Glance)
Pattern Detection:
Identifies a 5-bar sequence that forms a valid Breaker Candle (the middle bar flips structure).
Confirmation:
Requires a follow-through candle to validate a real liquidity break.
Zone Registration:
Stores the breaker zone’s body range in arrays for tracking.
Clean Retest Entry:
Waits for price to retest the zone from the opposite side and close cleanly inside.
Stop Loss / Target Projection:
Defines stop loss just beyond the zone and plots up to 3 × reward targets dynamically.
Monitoring & Alerts:
Tracks each setup independently until either an R-target or SL is reached.
💬 Recommended Usage
Works best with market-structure traders, smart-money concepts, or liquidity-based systems.
Combine it with an external displacement confirmation or BOS/CHOCH tool for best precision.
Ideal for backtesting breaker-based R:R consistency or forward-testing retest entries.
Compatible with any asset / timeframe.
🧭 Disclaimer
This script is for educational and analytical purposes only.
It is not financial advice and should not be used to make trading decisions without independent confirmation or risk management.
Always test on demo data before deploying live.

Rage of UltronRage of Ultron - Multi-Timeframe Smart Money Trading System
Advanced Confluence-Based Trading Indicator
Rage of Ultron is a comprehensive multi-timeframe trading system that combines Smart Money Concepts (SMC) with macro market context, RSI divergences, liquidity sweeps, and volume analysis to identify high-probability setups across all markets.
Key Features
Multi-Timeframe Alignment
* Weekly Bias - Directional trend context
* Daily Structure - Order Blocks and Fair Value Gaps
* 4H Confirmation - Entry timing and execution
* Real-time MTF alignment scoring (🟢 Bull Aligned / 🔴 Bear Aligned / 🟡 Mixed)
Smart Money Concepts
* Order Blocks (OB) - Institutional entry zones with visual clarity
* Fair Value Gaps (FVG) - Price imbalances and retracement magnets
* Change of Character (CHoCH) - Market structure breaks (▲▼)
* Liquidity Sweeps - Stop hunt detection before reversals (💧)
Technical Analysis
* RSI Divergences - Regular and hidden divergences with zones (◆)
* RSI Swing Failure Patterns - Grade-A reversal setups (★)
* Automatic Fibonacci - Dynamic retracements and extensions
* Volume Impulse Detection - Weighted confirmation signals
Macro Market Radar
* DXY - Dollar strength assessment
* BTC Dominance - Crypto market risk gauge
* USDT Dominance - Stablecoin flow analysis
* Combined risk environment scoring
Confluence Scoring System (0-7)
Quantified setup quality with three alert tiers:
* Tier 1 (Score 6-7): Full confluence + sweep + volume + MTF alignment
* Tier 2 (Score 5): High confluence + volume or sweep
* Tier 3 (Score 4): Standard confluence setups
"Rage" Volume State
* 🟢 RAGE PULSE - Explosive volume spike (score 6+ trigger)
* ⚡ Active - Strong volume with good confluence
* 🟡 Stable - Moderate volume conditions
* 🔴 Dormant - Low volume, wait for confirmation
Visual Design
* Clean Zone Rendering - Persistent OB/FVG boxes with limited extension
* Signal Bar Highlighting - Colored fills and contrasting borders for instant recognition
* Dynamic Symbol Placement - ATR-based offset prevents overlap
* Comprehensive Panel - Real-time macro + trade metrics in one view
* Toggleable Legend - Learn signals, hide once familiar
How to Use
1. Set Your Timeframes - Default 1W/1D/4H works for swing trading
2. Monitor Macro Environment - Check risk-on/off context
3. Wait for Confluence ≥4 - Let multiple signals align
4. Enter on Tier 1/2 Alerts - Best probability setups
5. Use Fib Extensions for Targets - Systematic profit taking
Customizable Settings
* Multi-timeframe periods
* RSI length and divergence sensitivity
* Liquidity sweep parameters
* Fibonacci swing lookback
* Volume thresholds
* Shape offset multiplier
* Visual toggles (Fibs, extensions, legend)
Built-in Alert System
Three-tier alert structure lets you filter by setup quality. Set alerts for Tier 1 only for highest conviction trades, or include Tier 2 for more opportunities.
Best Practices
* Use on clean timeframes - 1H+ for less noise
* Combine with support/resistance - Zones near key levels = highest probability
* Respect the macro - Don't fight extreme risk-off environments
* Wait for the full stack - Best trades have 4+ aligned signals
* Practice on demo first - Learn signal behavior in your market
Works On
* Cryptocurrency (spot & futures)
* Forex pairs
* Stock indices
* Individual stocks
* Commodities
Note: This indicator identifies potential setups but does not guarantee profits. Always use proper risk management, position sizing, and stops. Past performance does not predict future results.
Created by cdotgnz | For educational purposes

Major exchages total Open interest & Long/Short OI trends📊 Indicator: Major Exchanges Total OI & Long/Short Trends
This Pine Script™ indicator is designed to provide a comprehensive analysis of Open Interest (OI) and Long/Short position trends across major cryptocurrency exchanges (Binance, Bybit, OKX, Bitget, HTX, Deribit). It serves as a powerful tool for traders seeking to understand market liquidity, participant positioning, and overall market sentiment.
🔑 Key Features and Functionalities
Aggregated Multi-Exchange Open Interest (OI):
Consolidates real-time Open Interest data from user-selected major cryptocurrency exchanges.
Provides a unified view of the total OI, offering insights into the collective market liquidity and the aggregate size of participants' open positions.
Visualized Combined OI Candles:
Presents the aggregated total OI data in a candlestick chart format.
Displays the Open, High, Low, and Close of the combined OI, with color variations indicating increases or decreases from the previous period. This enables intuitive visualization of OI trend shifts.
Estimated Long/Short OI and Visualization:
Calculates and visualizes estimated Long and Short position Open Interest based on the total aggregated OI data.
Estimation Logic:
Employs a sophisticated logic that considers both price changes and OI fluctuations to infer the balance between Long and Short positions. For instance, an increase in both price and OI may suggest an accumulation of Long positions, while a price decrease coupled with an OI increase might indicate growing Short positions.
Initial 50:50 Ratio:
The estimation for Long/Short OI begins with an assumption of a 50:50 ratio at the initial data point available for the selected timeframe. This establishes a neutral baseline, from which subsequent price and OI changes drive the divergence and evolution of the estimated Long/Short balance.
Flexible Visualization Options:
Allows users to display Long/Short OI data in either line or candlestick styles, with customizable color schemes. This flexibility aids in clearly discerning bullish or bearish positioning trends.
💡 Development Background
The development of this indicator stems from the critical importance of Open Interest data in the cryptocurrency derivatives market. Recognizing the limitations of analyzing individual exchange OI in isolation, the primary objective was to integrate data from leading exchanges to offer a holistic perspective on market sentiment and overall positioning dynamics.
The inclusion of the Long/Short position estimation feature is crucial for deciphering the specific directional biases of market participants, which is often not evident from raw OI data alone. This enables a deeper understanding of how positions are being accumulated or liquidated, moving beyond simple OI change analysis.
Furthermore, a key design consideration was to leverage the characteristic where the indicator's data start point dynamically adjusts with the chart's timeframe selection. This allows for the analysis of short-term Long/Short trends on shorter timeframes and long-term trends on longer timeframes. This inherent flexibility empowers traders to conduct analyses across various time scales, aligning with their diverse trading strategies.
🚀 Trading Applications
Leveraging Combined Open Interest (OI):
Trend Confirmation: A sustained increase in total OI signifies growing market interest and capital inflow, potentially confirming the strength of an existing trend. Conversely, decreasing OI may suggest diminishing participant interest or widespread position liquidation.
Validation of Price Extremes: If price forms a new high but OI fails to increase or declines, it could signal a potential trend reversal (divergence). Conversely, a sharp increase in OI during a price decline might indicate a surge in short positions or renewed selling pressure.
Identifying Volatility Triggers: Monitoring rapid shifts in OI during significant news events or market catalysts can help assess immediate market reactions and liquidity changes.
📈Utilizing Long/Short OI Trends
Assessing Market Bias: A sustained dominance or rapid increase in Long OI suggests a prevalent bullish sentiment, which could inform decisions to enter or maintain long positions. The inverse scenario indicates bearish sentiment and potential short entry opportunities.
Anticipating Squeezes: The indicator can help identify scenarios conducive to short or long squeezes. Excessive short positioning followed by a price uptick can trigger a short squeeze, leading to rapid price appreciation. Conversely, an oversupply of long positions preceding a price drop can result in a long squeeze and sharp declines.
Divergence Analysis: Divergences between price action and Long/Short OI estimates can signal potential trend reversals. For example, if price is rising but the increase in Long OI slows down or Short OI begins to grow, it may suggest weakening buying pressure.
🕔Timeframe-Specific Trend Analysis:
Shorter Timeframes (e.g., 1m, 5m, 15m): Ideal for identifying short-term shifts in participant positioning, beneficial for day trading and scalping strategies. Provides insights into immediate market reactions to price movements.
Longer Timeframes (e.g., 1h, 4h, Daily): Valuable for evaluating broader positioning trends and the sustainability or potential reversal of medium-to-long-term trends. Offers a macro perspective on Long/Short dynamics, suitable for swing trading or long-term investment strategies.
This indicator integrates complex market data, provides nuanced Long/Short position estimations, and offers multi-timeframe analytical capabilities, empowering traders to make more informed and strategic decisions.

Clock&Flow – Market Pulse IndicatorClock&Flow – Market Pulse Indicator
1) General Purpose
The Market Pulse Indicator is designed to visualize the strength and direction of market flow in a clear, intuitive way.
Unlike common volume or momentum indicators, it blends three essential dimensions — price velocity, normalized volume, and volatility (ATR) — to highlight when market pressure is truly meaningful.
It helps identify genuine liquidity inflows/outflows, potential exhaustion zones, and moments of compression or expansion within the price structure.
2) Data Sources
All data is directly taken from the current chart’s feed on TradingView:
Price (close): to measure relative price change.
Volume: to detect the intensity of market participation (normalized to average).
ATR (Average True Range): to evaluate volatility relative to price levels.
No external data or off-platform sources are used.
3) Logic and Calculation Steps
Price Velocity: calculates the percentage change between the current close and the close N bars ago.
priceChange = (close - close ) / close
Normalized Volume: compares current volume to its moving average over the same period.
volNorm = volume / sma(volume, length)
Normalized Volatility: ATR divided by price to adjust for instrument scale.
atrNorm = atr(length) / close
Combination : multiplies the three components into one raw value that represents market pulse intensity.
rawPulse = priceChange * volNorm * (1 + atrNorm)
Smoothing: a moving average (smoothLen) is applied to create a cleaner and more readable oscillator line.
flowPulse = sma(rawPulse * multiplier, smoothLen)
4) Parameters (Default Settings)
length (20): analysis period for price change, volume, and ATR.
smoothLen (5): smoothing factor; higher values reduce noise.
multiplier (100): scales the output for readability; adjust to fit chart scale.
5) How to Read the Indicator
Market Pulse > 0 (green): net inflow of liquidity; buying pressure dominates.
Market Pulse < 0 (red): net outflow of liquidity; selling pressure dominates.
Near 0: neutral phase; market balance or consolidation.
Sudden peaks: strong bursts of flow — often coincide with news releases or session overlaps.
Confirmations: use as a second-level filter before entering trades or to confirm momentum behind a breakout.
6) Divergences
Divergences between price and Market Pulse are key signals of weakening flow strength:
Bullish divergence: price forms lower lows while Market Pulse forms higher lows → selling pressure is fading; potential reversal or bounce.
Bearish divergence: price forms higher highs while Market Pulse fails to confirm → buying momentum is losing strength; potential correction ahead.
For reliability, look for divergences on higher timeframes (H4, Daily).
On lower timeframes, treat them as early warnings.
7) Typical Use Cases
Breakout confirmation: price breaks resistance with a rising Market Pulse → confirms genuine participation.
False signal filter: price breaks a level but Market Pulse remains flat/negative → likely fake breakout.
Pullback entry: after a breakout, wait for a short retracement and a new positive pulse → safer entry point.
Exit signal: if you’re long and Market Pulse suddenly turns negative with strong volume → consider partial exit or tighter stops.
8) Recommended Timeframes
Intraday / Scalping: 5–30 min charts with length 10–14, smoothLen 3–5.
Swing trading: 1h–4h charts with length 20–50.
Position trading: Daily charts with larger length (50–100) for smoother data.
Always optimize parameters to the specific asset — there are no universal settings.
9) Limitations
This indicator is not a trading system — it’s a decision-support tool.
Results depend on the quality of the volume data available for the symbol.
Performance and sensitivity are influenced by length, smoothing, and multiplier values — always test before live trading.
Use alongside sound risk and money management.
10) Disclaimer
This script is provided for educational purposes only and does not constitute financial advice.
Trading and investing involve significant risk, including the potential loss of capital.
Always test indicators in simulation environments and make independent decisions based on your own analysis and risk tolerance.
Italiano
1) Scopo generale
Flow Pulse è un oscillatore pensato per visualizzare la forza e la direzione del flusso di mercato in modo immediato. Non è un semplice indicatore di volume né una copia di RSI/MACD: combina tre dimensioni fondamentali — variazione di prezzo, volume normalizzato e volatilità — per mettere in evidenza i momenti in cui la pressione dei partecipanti è realmente significativa.
È ideale per identificare: entrate guidate da flussi reali, potenziali esaurimenti, momenti di compressione/espansione del movimento e segnali di conferma per breakout o rimbalzi.
2) Dati utilizzati
L’indicatore usa esclusivamente dati disponibili sulla piattaforma TradingView del grafico corrente:
price (close) — per calcolare la variazione percentuale del prezzo;
volume per misurare l’intensità degli scambi (normalizzato su media);
ATR (Average True Range) — per normalizzare la volatilità rispetto al prezzo;
Tutti i feed (prezzo e volume) sono quelli forniti dall’exchange/fornitore dati collegato al simbolo sul grafico.
3) Logica e passaggi di calcolo
Velocità del prezzo: calcolo della variazione percentuale tra la chiusura corrente e la chiusura N barre fa:
priceChange = (close - close ) / close
— misura la direzione e magnitudine del movimento in termine relativo.
Volume normalizzato: rapporto tra il volume corrente e la media mobile semplice del volume su length barre:
volNorm = volume / sma(volume, length)
— evidenzia volumi anomali rispetto alla media.
Volatilità normalizzata (ATR): rapporto ATR/close per rendere la volatilità comparabile across price levels:
atrNorm = atr(length) / close
Combinazione: il prodotto di questi fattori (con un piccolo offset su ATR) genera un valore grezzo:
rawPulse = priceChange * volNorm * (1 + atrNorm)
— se priceChange e volNorm sono positivi e l’ATR è presente, il rawPulse sarà significativamente positivo.
Smoothing: media mobile semplice (SMA) applicata al rawPulse e moltiplicazione per un fattore scalare (multiplier) per portare il range su livelli leggibili:
flowPulse = sma(rawPulse * multiplier, smoothLen)
4) Parametri esposti (default consigliati)
length (periodo analisi) — default 20: influenza calcolo Δ% e media volumi; allunga la finestra storica.
smoothLen (smussamento) — default 5: smoothing del segnale per ridurre rumore.
multiplier — default 100: fattore di scala per rendere l’oscillatore più leggibile.
5) Interpretazione pratica dei valori
FlowPulse > 0 (verde): predominanza di flusso d’ingresso — pressione d’acquisto. Maggiore il valore, più forte la convinzione (volume + movimento + volatilità).
FlowPulse < 0 (rosso): predominanza di flusso in uscita — pressione di vendita.
Vicino a 0: assenza di flussi netti chiari; mercato piatto o bilanciato.
Picchi repentini: indicano accelerate di flusso — spesso coincidono con rotture, open/close session, news.
Sostegno al trade: usa FlowPulse come conferma prima di entrare su breakout o come avviso di attenzione su esaurimenti.
6) Divergenze (come leggerle)
Le divergenze tra prezzo e FlowPulse sono segnali importanti:
Divergenza rialzista (bullish divergence): prezzo fa nuovi minimi mentre FlowPulse non fa nuovi minimi (o forma minimo relativo più alto) → indica che la spinta di vendita non è supportata da volume/volatilità, possibile inversione/rimbalzo.
Divergenza ribassista (bearish divergence): prezzo fa nuovi massimi mentre FlowPulse non li conferma (o forma massimo relativo più basso) → la spinta d’acquisto è “debole”, possibile esaurimento e inversione.
Note pratiche: cercare divergenze su timeframe maggiori (H4, D) per maggiore attendibilità; sui timeframe minori prendere solo come early warning.
7) Esempi d’uso operativo
Conferma breakout: prezzo rompe resistenza + FlowPulse positivo e crescente → breakout più probabile e con volumi reali.
Filtro per falsi segnali: prezzo rompe ma FlowPulse è piatto/negativo → alto rischio di false breakout.
Entrata per pullback: dopo breakout, attendere un pullback con FlowPulse che torna positivo → ingresso più prudente.
Gestione delle uscite: se sei long e FlowPulse improvvisamente si inverte in negativo su volumi elevati → considerare riduzione posizione o stop.
8) Timeframe consigliati
Intraday / Scalping: M5–M30 con length ridotto (es. 10–14) e smoothLen piccolo.
Swing trading: H1–H4 con length 20–50.
Position trading: D1 con length maggiore per filtrare rumore.
Testa i parametri sul tuo asset e timeframe; nessun parametro è universale.
9) Limitazioni e avvertenze
L’indicatore non è un sistema di trading completo: è un tool di informazione e timing.
Dipende dalla qualità dei dati di volume del simbolo: su alcuni titoli/mercati (es. alcuni ETF, Forex su certi broker) il volume può essere parziale o non rappresentativo.
I valori di margine/multiplier e smoothing influenzano sensibilmente sensibilità e falsi segnali: backtest e ottimizzazione sono raccomandati.
Non usare il solo FlowPulse per entrare su leva elevata senza gestione del rischio12) Disclaimer da inserire
Disclaimer: Questo indicatore è fornito solo a scopo didattico e non costituisce consulenza finanziaria. L’uso comporta rischi: valuta sempre la gestione del rischio e testa su conto demo prima dell’applicazione in reale.

📋 Trading Checklist – Precision Entry SystemTake your trading discipline to the next level with this Precision Trading Checklist for TradingView. Designed for intraday traders following liquidity, structure, and Smart Money Concepts (SMC) AKA ICT Concepts, this overlay ensures you never miss a key confirmation before entering a trade.
Features:
✅ Pre-Market Preparation: Track previous session highs/lows, AM/PM sessions, and key liquidity zones.
✅ Bias & Narrative Check: Quickly confirm daily trend, price position relative to daily open, and higher timeframe confluence.
✅ Session-Specific Rules: Focused sessions like Silver Bullet (10:00–11:30), Afternoon (13:30–15:00), and Final Hour (15:00–16:00).
✅ Structure & Setup Validation: Confirm liquidity sweeps, market structure shifts, expansion candles, fair value gaps, and order blocks.
✅ Risk Management Reminders: Stop-loss, target points, risk percentage, breakeven management, and pyramiding rules.
✅ Post-Trade Journaling: Document entries, session, setup type, trade outcome, and grading for continuous improvement.
✅ Golden Rules: Visual reminders to enforce discipline, avoid emotional trades, and respect session limits.
Why Use It:
This checklist is perfect for traders who want to stay consistent, minimise mistakes, and follow a disciplined routine. Displayed as an overlay on your chart, it provides all essential checks in one glance, keeping you focused on the setup rather than scrolling through notes or separate trackers.
How to use:
Add the indicator to your chart
Click the settings/gear icon
Check off items as you complete them
The checklist on your chart updates in real-time with green checkmarks!
The checkboxes will persist as long as the indicator is on your chart,
making it perfect for tracking your pre-trade and post-trade routines!
Follow the checklist items step by step before entering trades.
Use the session-specific guidelines to filter setups.
Journal your trades post-execution for growth and analysis.

Inter-symmetric Forecast (ISF)Concept:
The Inter-Symmetric Forecast (ISF) is a physics-inspired price projection tool that visualizes both trend-continuation and mean-reversion scenarios in one dynamic structure. It extends the classic ADAM Projection by introducing a regime-sensitive weighting based on the Market Reynolds Number (Reₘ), a dimensionless ratio of market momentum × liquidity to volatility-derived “viscosity.”
Mechanism:
ISF mirrors past price action around the current close (the continuation path) while also forward-pasting the same pattern unreflected (the anti-trend path). It then blends these paths bar-by-bar using time-reflected Reₘ values — meaning the liquidity-momentum regime of each past segment determines how much its future mirror leans toward continuation or reversion.
Interpretation:
High Reₘ → strong inertia/liquidity, favors trend continuation.
Low Reₘ → high friction/volatility, favors mean reversion.
The yellow blended forecast shows the regime-weighted midpoint between both outcomes.
Use:
ISF offers traders a visual probability corridor rather than a fixed prediction — illustrating how far a move might extend if momentum persists, or fade if conditions become viscous. It’s best used as a contextual forecasting overlay for discretionary or systematic analysis.

Quantura - Fair Value GapIntroduction
“Quantura – Fair Value Gap” is a precision-engineered institutional concept indicator designed to automatically identify, visualize, and manage Fair Value Gaps (FVGs) across any market or timeframe. It enables traders to observe price inefficiencies, potential liquidity voids, and retracement areas that often act as magnets for price rebalancing.
Originality & Value
Unlike many public FVG scripts that only highlight candle gaps, this indicator integrates dynamic filters and adaptive logic to determine the strength and reliability of each gap. It merges overlapping zones intelligently and optionally extends valid imbalances forward for ongoing reference.
Its value lies in:
Dynamic statistical filtering based on gap standard deviation.
Optional volume confirmation for high-confidence FVGs.
Automatic merging of overlapping or adjacent gaps for clean visualization.
Support for both bullish and bearish imbalances.
Signal alerts when gaps are filled or rebalanced by price.
Functionality & Core Logic
Detects Fair Value Gaps by comparing candle-to-candle price displacement.
Applies a Gap Filter (standard deviation-based) to qualify valid gaps.
Optionally validates gaps formed under significant volume conditions.
Draws color-coded boxes to mark bullish (discount) and bearish (premium) inefficiencies.
Monitors each FVG until price fills the gap, at which point the box is visually closed.
Provides optional signal markers (“▲” or “▼”) when rebalancing occurs.
Parameters & Customization
Gap Filter: Sets the minimum statistical deviation required for a valid FVG. Higher values detect fewer, stronger gaps.
Volume Filter: Toggles additional validation using relative volume strength.
Volume Sensitivity: Adjusts how much above-average volume must be present to confirm a gap.
Bullish/Bearish Colors: Customize color schemes for imbalance zones.
Extend Gaps: Optionally extend open gaps forward for better confluence tracking.
Signals: Enables or disables gap-fill signal markers.
Visualization & Display
Bullish FVGs: Appear in blue-tinted boxes, indicating potential demand-side inefficiencies.
Bearish FVGs: Appear in red-tinted boxes, representing potential supply-side inefficiencies.
Overlapping zones are merged automatically to maintain clarity.
Filled gaps remain visible for historical context, allowing for post-event analysis.
Optional signal arrows display when price returns to rebalance an FVG.
Use Cases
Identify institutional inefficiencies and liquidity voids.
Detect premium and discount levels in trending markets.
Combine with market structure or order block indicators for confluence.
Track when price rebalances inefficiencies to refine entry/exit points.
Build FVG-based algorithmic strategies that rely on structural imbalance resolution.
Limitations & Recommendations
The indicator detects structural imbalances but does not predict future direction or guarantee profitability.
Volume filters may behave differently across brokers due to data-source differences.
Use alongside structure or liquidity tools for enhanced decision-making.
Extreme volatility or illiquid assets may generate temporary invalid gaps.
Markets & Timeframes
Compatible with all markets (crypto, forex, equities, indices, futures) and all timeframes. Recommended for multi-timeframe confluence analysis — e.g., detecting higher-timeframe FVGs and refining lower-timeframe entries.
Author & Access
Developed 100% by Quantura. Published as a Open-source script indicator. Access is free.
Compliance Note
This description adheres fully to TradingView’s House Rules and Script Publishing Requirements . It provides a detailed explanation of originality, core logic, limitations, and appropriate use — with no unrealistic or misleading performance claims.

Ornstein-Uhlenbeck Trend Channel [BOSWaves]Ornstein-Uhlenbeck Trend Channel - Adaptive Mean Reversion with Dynamic Equilibrium Geometry
Overview
The Ornstein-Uhlenbeck Trend Channel introduces an advanced equilibrium-mapping framework that blends statistical mean reversion with adaptive trend geometry. Traditional channels and regression bands react linearly to volatility, often failing to capture the natural rhythm of price equilibrium. This model evolves that concept through a dynamic reversion engine, where equilibrium adapts continuously to volatility, trend slope, and structural bias - forming a living channel that bends, expands, and contracts in real time.
The result is a smooth, equilibrium-driven representation of market balance - not just trend direction. Instead of static bands or abrupt slope shifts, traders see fluid, volatility-aware motion that mirrors the natural pull-and-release dynamic of market behavior. Each channel visualizes the probabilistic boundaries of fair value, showing where price tends to revert and where it accelerates away from its statistical mean.
Unlike conventional envelopes or Bollinger-type constructs, the Ornstein-Uhlenbeck framework is volatility-reactive and equilibrium-sensitive, providing traders with a contextual map of where price is likely to stabilize, extend, or exhaust.
Theoretical Foundation
The Ornstein-Uhlenbeck Trend Channel is inspired by stochastic mean-reversion processes - mathematical models used to describe systems that oscillate around a drifting equilibrium. While linear regression channels assume constant variance, financial markets operate under variable volatility and shifting equilibrium points. The OU process accounts for this by treating price as a mean-seeking motion governed by volatility and trend persistence.
At its core are three interacting components:
Equilibrium Mean (μ) : Represents the evolving balance point of price, adjusting to directional bias and volatility.
Reversion Rate (θ) : Defines how strongly price is pulled back toward equilibrium after deviation, capturing the self-correcting nature of market structure.
Volatility Coefficient (σ) : Controls how far and how quickly price can diverge from equilibrium before mean reversion pressure increases.
By embedding this stochastic model inside a volatility-adjusted framework, the system accurately scales across different markets and conditions - maintaining meaningful equilibrium geometry across crypto, forex, indices, or commodities. This design gives traders a mathematically grounded yet visually intuitive interpretation of dynamic balance in live market motion.
How It Works
The Ornstein-Uhlenbeck Trend Channel is constructed through a structured multi-stage process that merges stochastic logic with volatility mechanics:
Equilibrium Estimation Core : The indicator begins by identifying the evolving mean using adaptive smoothing influenced by trend direction and volatility. This becomes the live centerline - the statistical anchor around which price naturally oscillates.
Volatility Normalization Layer : ATR or rolling deviation is used to calculate volatility intensity. The output scales the channel width dynamically, ensuring that boundaries reflect current variance rather than static thresholds.
Directional Bias Engine : EMA slope and trend confirmation logic determine whether equilibrium should tilt upward or downward. This creates asymmetrical channel motion that bends with the prevailing trend rather than staying horizontal.
Channel Boundary Construction : Upper and lower bands are plotted at volatility-proportional distances from the mean. These envelopes form the “statistical pressure zones” that indicate where mean reversion or acceleration may occur.
Signal and Lifecycle Control : Channel breaches, mean crossovers, and slope flips mark statistically significant events - exhaustion, continuation, or rebalancing. Older equilibrium zones gradually fade, ensuring a clear, context-aware visual field.
Through these layers, the channel forms a continuously updating equilibrium corridor that adapts in real time - breathing with the market’s volatility and rhythm.
Interpretation
The Ornstein-Uhlenbeck Trend Channel reframes how traders interpret balance and momentum. Instead of viewing price as directional movement alone, it visualizes the constant tension between trending force and equilibrium pull.
Uptrend Phases : The equilibrium mean tilts upward, with price oscillating around or slightly above the midline. Upper band touches signal momentum extension; lower touches reflect healthy reversion.
Downtrend Phases : The mean slopes downward, with upper-band interactions marking resistance zones and lower bands acting as reversion boundaries.
Equilibrium Transitions : Flat mean sections indicate balance or distribution phases. Breaks from these neutral zones often precede directional expansion.
Overextension Events : When price closes beyond an outer boundary, it marks statistically significant disequilibrium - an early warning of exhaustion or volatility reset.
Visually, the OU channel translates volatility and equilibrium into structured geometry, giving traders a statistical lens on trend quality, reversion probability, and volatility stress points.
Strategy Integration
The Ornstein-Uhlenbeck Trend Channel integrates seamlessly into both mean-reversion and trend-continuation systems:
Trend Alignment : Use mean slope direction to confirm higher-timeframe bias before entering continuation setups.
Reversion Entries : Target rejections from outer bands when supported by volume or divergence, capturing snapbacks toward equilibrium.
Volatility Breakout Mapping : Monitor boundary expansions to identify transition from compression to expansion phases.
Liquidity Zone Confirmation : Combine with BOS or order-block indicators to validate structural zones against equilibrium positioning.
Momentum Filtering : Align with oscillators or volume profiles to isolate equilibrium-based pullbacks with statistical context.
Technical Implementation Details
Core Engine : Stochastic Ornstein-Uhlenbeck process for continuous mean recalibration.
Volatility Framework : ATR- and deviation-based scaling for dynamic channel expansion.
Directional Logic : EMA-slope driven bias for adaptive mean tilt.
Channel Composition : Independent upper and lower envelopes with smoothing and transparency control.
Signal Structure : Alerts for mean crossovers and boundary breaches.
Performance Profile : Lightweight, multi-timeframe compatible implementation optimized for real-time responsiveness.
Optimal Application Parameters
Timeframe Guidance:
1 - 5 min : Reactive equilibrium tracking for short-term scalping and microstructure analysis.
15 - 60 min : Medium-range setups for volatility-phase transitions and intraday structure.
4H - Daily : Macro equilibrium mapping for identifying exhaustion, distribution, or reaccumulation zones.
Suggested Configuration:
Mean Length : 20 - 50
Volatility Multiplier : 1.5× - 2.5×
Reversion Sensitivity : 0.4 - 0.8
Smoothing : 2 - 5
Parameter tuning should reflect asset liquidity, volatility, and desired reversion frequency.
Performance Characteristics
High Effectiveness:
Trending environments with cyclical pullbacks and volatility oscillation.
Markets exhibiting consistent equilibrium-return behavior (indices, majors, high-cap crypto).
Reduced Effectiveness:
Low-volatility consolidations with minimal variance.
Random walk markets lacking definable equilibrium anchors.
Integration Guidelines
Confluence Framework : Pair with BOSWaves structural tools or momentum oscillators for context validation.
Directional Control : Follow mean slope alignment for directional conviction before acting on channel extremes.
Risk Calibration : Use outer band violations for controlled contrarian entries or trailing stop management.
Multi-Timeframe Synergy : Derive macro equilibrium zones on higher timeframes and refine entries on lower levels.
Disclaimer
The Ornstein-Uhlenbeck Trend Channel is a professional-grade equilibrium and volatility framework. It is not predictive or profit-assured; performance depends on parameter calibration, volatility regime, and disciplined execution. BOSWaves recommends using it as part of a comprehensive analytical stack combining structure, liquidity, and momentum context.
