Triple CCI Strategy MFI Confirmed [Skyrexio]Overview
Triple CCI Strategy MFI Confirmed leverages 3 different periods Commodity Channel Index (CCI) indicator in conjunction Money Flow Index (MFI) and Exponential Moving Average (EMA) to obtain the high probability setups. Fast period CCI is used for having the high probability to enter in the direction of short term trend, middle and slow period CCI are used for confirmation, if market now likely in the mid and long-term uptrend. MFI is used to confirm trade with the money inflow/outflow with the high probability. EMA is used as an additional trend filter. Moreover, strategy uses exponential moving average (EMA) to trail the price when it reaches the specific level. More information in "Methodology" and "Justification of Methodology" paragraphs. The strategy opens only long trades.
Unique Features
Dynamic stop-loss system: Instead of fixed stop-loss level strategy utilizes average true range (ATR) multiplied by user given number subtracted from the position entry price as a dynamic stop loss level.
Configurable Trading Periods: Users can tailor the strategy to specific market windows, adapting to different market conditions.
Four layers trade filtering system: Strategy utilizes two different period CCI indicators, MFI and EMA indicators to confirm the signals produced by fast period CCI.
Trailing take profit level: After reaching the trailing profit activation level scrip activate the trailing of long trade using EMA. More information in methodology.
Methodology
The strategy opens long trade when the following price met the conditions:
Fast period CCI shall crossover the zero-line.
Slow and Middle period CCI shall be above zero-lines.
Price shall close above the EMA. Crossover is not obligatory
MFI shall be above 50
When long trade is executed, strategy set the stop-loss level at the price ATR multiplied by user-given value below the entry price. This level is recalculated on every next candle close, adjusting to the current market volatility.
At the same time strategy set up the trailing stop validation level. When the price crosses the level equals entry price plus ATR multiplied by user-given value script starts to trail the price with EMA. If price closes below EMA long trade is closed. When the trailing starts, script prints the label “Trailing Activated”.
Strategy settings
In the inputs window user can setup the following strategy settings:
ATR Stop Loss (by default = 1.75)
ATR Trailing Profit Activation Level (by default = 2.25)
CCI Fast Length (by default = 14, used for calculation short term period CCI)
CCI Middle Length (by default = 25, used for calculation short term period CCI)
CCI Slow Length (by default = 50, used for calculation long term period CCI)
MFI Length (by default = 14, used for calculation MFI
EMA Length (by default = 50, period of EMA, used for trend filtering EMA calculation)
Trailing EMA Length (by default = 20)
User can choose the optimal parameters during backtesting on certain price chart.
Justification of Methodology
Before understanding why this particular combination of indicator has been chosen let's briefly explain what is CCI, MFI and EMA.
The Commodity Channel Index (CCI) is a momentum-based technical indicator that measures the deviation of a security's price from its average price over a specific period. It helps traders identify overbought or oversold conditions and potential trend reversals.
The CCI formula is:
CCI = (Typical Price − SMA) / (0.015 × Mean Deviation)
Typical Price (TP): This is calculated as the average of the high, low, and closing prices for the period.
Simple Moving Average (SMA): This is the average of the Typical Prices over a specific number of periods.
Mean Deviation: This is the average of the absolute differences between the Typical Price and the SMA.
The result is a value that typically fluctuates between +100 and -100, though it is not bounded and can go higher or lower depending on the price movement.
The Money Flow Index (MFI) is a technical indicator that measures the strength of money flowing into and out of a security. It combines price and volume data to assess buying and selling pressure and is often used to identify overbought or oversold conditions. The formula for MFI involves several steps:
1. Calculate the Typical Price (TP):
TP = (high + low + close) / 3
2. Calculate the Raw Money Flow (RMF):
Raw Money Flow = TP × Volume
3. Determine Positive and Negative Money Flow:
If the current TP is greater than the previous TP, it's Positive Money Flow.
If the current TP is less than the previous TP, it's Negative Money Flow.
4. Calculate the Money Flow Ratio (MFR):
Money Flow Ratio = Sum of Positive Money Flow (over n periods) / Sum of Negative Money Flow (over n periods)
5. Calculate the Money Flow Index (MFI):
MFI = 100 − (100 / (1 + Money Flow Ratio))
MFI above 80 can be considered as overbought, below 20 - oversold.
The Exponential Moving Average (EMA) is a type of moving average that places greater weight and significance on the most recent data points. It is widely used in technical analysis to smooth price data and identify trends more quickly than the Simple Moving Average (SMA).
Formula:
1. Calculate the multiplier
Multiplier = 2 / (n + 1) , Where n is the number of periods.
2. EMA Calculation
EMA = (Current Price) × Multiplier + (Previous EMA) × (1 − Multiplier)
This strategy leverages Fast period CCI, which shall break the zero line to the upside to say that probability of short term trend change to the upside increased. This zero line crossover shall be confirmed by the Middle and Slow periods CCI Indicators. At the moment of breakout these two CCIs shall be above 0, indicating that there is a high probability that price is in middle and long term uptrend. This approach increases chances to have a long trade setup in the direction of mid-term and long-term trends when the short-term trend starts to reverse to the upside.
Additionally strategy uses MFI to have a greater probability that fast CCI breakout is confirmed by this indicator. We consider the values of MFI above 50 as a higher probability that trend change from downtrend to the uptrend is real. Script opens long trades only if MFI is above 50. As you already know from the MFI description, it incorporates volume in its calculation, therefore we have another one confirmation factor.
Finally, strategy uses EMA an additional trend filter. It allows to open long trades only if price close above EMA (by default 50 period). It increases the probability of taking long trades only in the direction of the trend.
ATR is used to adjust the strategy risk management to the current market volatility. If volatility is low, we don’t need the large stop loss to understand the there is a high probability that we made a mistake opening the trade. User can setup the settings ATR Stop Loss and ATR Trailing Profit Activation Level to realize his own risk to reward preferences, but the unique feature of a strategy is that after reaching trailing profit activation level strategy is trying to follow the trend until it is likely to be finished instead of using fixed risk management settings. It allows sometimes to be involved in the large movements. It’s also important to make a note, that script uses another one EMA (by default = 20 period) as a trailing profit level.
Backtest Results
Operating window: Date range of backtests is 2022.04.01 - 2024.11.25. It is chosen to let the strategy to close all opened positions.
Commission and Slippage: Includes a standard Binance commission of 0.1% and accounts for possible slippage over 5 ticks.
Initial capital: 10000 USDT
Percent of capital used in every trade: 50%
Maximum Single Position Loss: -4.13%
Maximum Single Profit: +19.66%
Net Profit: +5421.21 USDT (+54.21%)
Total Trades: 108 (44.44% win rate)
Profit Factor: 2.006
Maximum Accumulated Loss: 777.40 USDT (-7.77%)
Average Profit per Trade: 50.20 USDT (+0.85%)
Average Trade Duration: 44 hours
These results are obtained with realistic parameters representing trading conditions observed at major exchanges such as Binance and with realistic trading portfolio usage parameters.
How to Use
Add the script to favorites for easy access.
Apply to the desired timeframe and chart (optimal performance observed on 2h BTC/USDT).
Configure settings using the dropdown choice list in the built-in menu.
Set up alerts to automate strategy positions through web hook with the text: {{strategy.order.alert_message}}
Disclaimer:
Educational and informational tool reflecting Skyrex commitment to informed trading. Past performance does not guarantee future results. Test strategies in a simulated environment before live implementation
Pesquisar nos scripts por "indicators"

Non-Psychological Levels🟩 Non-Psychological Levels is a structural analysis tool that segments price action into objective ranges, identifying Broken and Unbroken levels without relying on psychological or time-based assumptions. By emphasizing mechanically derived price behavior, it provides traders with a clear framework for analyzing support and resistance in a consistent and unbiased manner across various market conditions.
This indicator introduces a new approach to understanding market structure by focusing on price movement within defined segments, free from behavioral patterns, round numbers, or specific time intervals. While the indicator is time-agnostic in design, it works within the natural time progression of the chart, ensuring that segmentation aligns with the inherent structure of price movement. Broken levels, where price has breached a structural boundary, and Unbroken levels, which remain intact, are visualized with horizontal lines. These structural zones are complemented by dynamically boxed segments that contextualize both historical and ongoing price behavior.
By offering an objective perspective, the Non-Psychological Levels indicator complements psychology-based tools, helping traders explore market dynamics from multiple angles. When structural levels align with psychological zones, they reinforce critical price areas; when they differ, they provide opportunities to analyze price behavior from an alternative lens. This indicator is designed as both an educational framework and a practical tool, encouraging a deeper understanding of structural price behavior in technical analysis.
⭕ THEORY AND CONCEPT ⭕
The Non-Psychological Levels indicator is grounded in the principle of analyzing price behavior without reliance on psychological assumptions or time-based factors. Its primary purpose is to provide a structural framework for identifying support and resistance levels by focusing solely on price movement within mechanically defined segments. By removing external influences such as sentiment, time intervals, or market sessions, the indicator offers an unbiased lens through which traders can observe price dynamics.
Non-psychology, as defined here, refers to an approach that excludes behavioral and emotional patterns—like fear, greed, or herd mentality—from price analysis. Traditional tools often depend on these patterns to identify zones such as pivots or Fibonacci retracements, but these methods can be inconsistent in volatile markets. In contrast, the Non-Psychological Levels indicator focuses entirely on what price is doing, free from assumptions about trader behavior or external time constraints.
The indicator’s time-agnostic and mechanically driven design segments price action into consistent ranges, highlighting "Broken" levels (where price breaches structural boundaries) and "Unbroken" levels (where price holds). These structural zones remain unaffected by subjective or external influences, ensuring clarity and consistency across different markets and timeframes. By doing so, the indicator reveals a pure view of price structure, independent of psychological biases.
Importantly, the Non-Psychological Levels indicator is not intended to replace psychology-based tools but to complement them. When its structural levels align with psychological zones like round numbers or session highs/lows, the significance of these areas is reinforced. Conversely, when the levels differ, the contrast provides traders with alternative insights into market dynamics. This dual perspective—blending mechanical objectivity with behavioral analysis—enhances the depth and flexibility of market evaluation.
The following principles outline the theoretical foundation of the indicator and its unique contribution to structural price analysis:
Time-Agnostic Design : The indicator avoids reliance on time-based factors like daily opens, session intervals, or specific events. Instead, it segments price action using bar indexes, ensuring that structural levels are identified independently of external time variables. While the x-axis of a chart inherently represents time, this indicator abstracts away its influence, allowing traders to focus purely on price movement without the bias of temporal context.
Mechanical and Neutral Framework : Every calculation within the indicator is predetermined by a set of mechanical rules, ensuring no subjective input or interpretation affects the results. This objectivity guarantees that levels are derived solely from observed price behavior, providing a reliable framework that traders can trust to remain consistent across different assets, timeframes, and market conditions.
Broken and Unbroken Levels : Broken levels represent zones where price has breached a structural boundary, while Unbroken levels highlight areas where price has consistently respected its range. This distinction provides a clear and systematic method for identifying key support and resistance levels, offering insights into where future price interactions are most likely to occur.
Neutral Price Behavior : By dividing price action into equal segments, the indicator removes the influence of external factors like trader sentiment or psychological expectations. Each segment independently determines significant levels based purely on price action, enabling a structural view of the market that abstracts away behavioral or emotional biases.
Complement to Psychological Tools : While the indicator itself avoids behavioral assumptions, its levels can align with psychological zones like round numbers, pivots, or Fibonacci levels. When these structural and psychological levels overlap, it reinforces the importance of key areas, while divergences offer opportunities to examine price behavior from a new perspective.
Educational Value : The indicator encourages traders to explore the contrast between structural and psychological analysis. By introducing a framework that isolates price behavior from external influences, it challenges traditional methods of technical analysis, fostering deeper insights into market structure and behavior.
🔍 UNDERSTANDING STRUCTURAL LEVELS 🔍
The Non-Psychological Levels indicator offers a straightforward yet powerful way to understand market structure by segmenting price action into mechanically defined ranges. This segmentation highlights two key elements: "Broken" levels, where price has breached structural boundaries, and "Unbroken" levels, which remain intact and respected by price action. Together, these components create a framework for identifying potential areas of support and resistance.
Broken Levels : These are structural boundaries that price has surpassed, indicating areas where previous support or resistance failed. Broken levels often signal transitions in price behavior, such as shifts in momentum or the start of trending movements. They provide insight into zones where price has already tested and moved beyond.
Unbroken Levels : These levels remain intact within a given price segment, marking areas where price has consistently respected boundaries. Unbroken levels are particularly useful for identifying potential reversal points or zones of continued support or resistance. Their persistence across price action often makes them reliable indicators of market structure.
The visual segmentation of price action into distinct ranges allows traders to observe how price transitions between structural zones. For example:
- Clusters of Unbroken levels near the current price may suggest strong support or resistance, offering areas of interest for reversals or breakouts.
- Gaps between Unbroken levels highlight areas of price inefficiency or low interaction, which may become significant if revisited.
By focusing solely on structural price behavior, the Non-Psychological Levels indicator enables traders to analyze price independently of time or psychological factors. This makes it a valuable tool for understanding price dynamics objectively, whether used on its own or alongside other indicators.
🛠️ SETTINGS 🛠️
The Non-Psychological Levels indicator offers various customizable settings to help users tailor its visualization to their specific trading style and market conditions. These settings allow adjustments to sensitivity, level projection, and the source of price calculations (e.g., wicks or closing prices). Below, we outline each setting and its impact on the chart, along with examples to illustrate their functionality.
Custom Settings
Sensitivity : This setting adjusts the balance between detailed and broader structural levels by controlling the number of segments. Higher values result in more segments, revealing finer price levels, while lower values consolidate segments to highlight major price movements.
Source : Allows the user to choose between 'Wick' or 'Close' for detecting levels. Selecting 'Wick' emphasizes the absolute highs and lows of price action, while 'Close' focuses on closing prices within each segment.
Level Labels : Configures the visual representation of price levels, allowing users to toggle between price values, symbols (▲ ▼), or disabling labels altogether. This setting ensures clarity in how Broken and Unbroken levels are displayed on the chart.
Unbroken Levels : - - - Users can customize the colors and label styles for Unbroken levels, which highlight areas where price has respected structural boundaries.
Broken Levels : -|- Similar to Unbroken levels, users can specify the visual appearance of Broken levels, including color customization for Broken highs and lows. These settings help distinguish areas where price has breached a structural boundary.
Projection Options : This setting allows users to control how broken and unbroken levels are visually extended on the chart. The Future option projects lines forward to the right of the current price, showing potential future relevance of levels. The All option extends lines both forward and backward, providing a comprehensive view of how levels align with historical and potential future price action. The None option disables projections, keeping the chart focused solely on current segment levels without any extensions.
Segments : Includes options for customizing the segment visualization:
- Live Segment : Toggles the display of a highlighted box representing the current developing segment, helping users focus on ongoing price action.
- Boxes : Allows users to display filled boxes around each segment for additional visual emphasis.
- Segment Colors : Users can define separate colors for support (lower) and resistance (upper) segments, making it easier to interpret directional trends.
- Boundaries : Enables or disables vertical lines to mark segment boundaries, providing a clearer view of structural divisions.
Repaint : This setting allows users to enable or disable triangle labels within the live segment. When enabled, the triangles dynamically update to reflect real-time price behavior during the live bar but will repaint until the bar is fully confirmed. Disabling this option prevents the triangles from appearing during the live bar, reducing potential confusion as they may otherwise flash on and off during price updates. This setting ensures users can choose their preferred visualization while maintaining clarity in real-time analysis.
Color Settings : Offers extensive customization for all visual elements, including Broken and Unbroken levels, segment boundaries, and live segments. These settings ensure the indicator can adapt to individual preferences for chart readability.
🖼️ CHART EXAMPLES 🖼️
The following chart examples illustrate different configurations and features of the Non-Psychological Levels indicator. These examples highlight how the indicator’s settings influence the visualization of structural price behavior, helping traders understand its functionality in various scenarios.
Broken and Unbroken Levels : Orange prices are Broken HIghs. Blue prices are Broken Lows. Green and Red are Unbroken.
Boundaries : Enable Boundaries to visualize segments.
High Sensitivity Setting : A high sensitivity setting produces fewer segments and levels, emphasizing broader price ranges and major structural zones. This configuration is better suited for higher timeframes or identifying overarching trends.
Low Sensitivity Setting : A low sensitivity setting results in a greater number of segments and levels, offering a granular view of price structure. This configuration is ideal for analyzing detailed price movements on lower timeframes.
Live Segment with Triangles Enabled : This example shows the live segment box with triangle labels enabled. These triangles update dynamically during the live bar but may repaint until the bar is confirmed, helping traders observe real-time price behavior.
Broken and Unbroken Levels : This example highlights Broken levels (where price has breached structural boundaries and are drawn through subsequent price action) and Unbroken levels (where price has respected structural boundaries). These distinctions visually identify areas of potential support and resistance.
Broken and Unbroken Levels with Projection: All : This example demonstrates the "Project All" feature, where broken and unbroken levels are extended both forward and backward on the chart. This visualization highlights historical and potential future support and resistance zones, helping traders better understand how price interacts with these structural levels over time.
Segment Boxes with Boundaries : Filled boxes around individual segments visually distinguish each price interval, offering clarity in observing structural price transitions.
📊 SUMMARY 📊
The Non-Psychological Levels indicator provides a unique framework for analyzing structural price behavior through the identification of Broken and Unbroken levels. These levels act as a mechanical representation of support and resistance, independent of psychological biases or time-based factors. By focusing purely on price movement within defined segments, the indicator offers a neutral and consistent approach to understanding market dynamics.
This method complements traditional tools by providing an unbiased perspective. When structural levels align with psychological zones—such as round numbers or session-based highs and lows—they reinforce the significance of these areas as key price zones. When they diverge, the indicator introduces an alternative view, prompting further exploration of price behavior. This dual perspective enhances the depth of analysis by combining the mechanical and behavioral aspects of price action.
The Non-Psychological Levels indicator is not designed to generate trading signals or predict future price movements but serves as a visual and educational tool. Its adaptability across all markets and timeframes allows traders to integrate it into their broader strategies. By highlighting structural price dynamics, the indicator offers a fresh perspective on market analysis while remaining compatible with other technical tools.
⚙️ COMPATIBILITY AND LIMITATIONS ⚙️
Asset Compatibility :
The Non-Psychological Levels indicator is compatible with all asset classes, including cryptocurrencies, forex, stocks, and commodities. It can be applied to any chart or timeframe, making it a flexible tool for structural price analysis. Users should adjust the Sensitivity setting to ensure the segmentation aligns with the price behavior of the specific asset being analyzed. For instance, higher sensitivity values are more suitable for assets with large price ranges, while lower values work well for assets with tighter ranges.
Visual Range Dependency :
The indicator is optimized to perform calculations only within the visible range of the chart. This is a significant advantage, as it prevents unnecessary calculations and maintains efficient performance. However, because of this dependency, levels may appear to "recalculate" when the chart is zoomed in or out quickly or shifted abruptly. While this does not affect the integrity of the levels, it may cause a temporary lag as the indicator adjusts to the new visual range.
Persistence of Levels Beyond Visibility :
Even if levels are not visible on the chart due to zoom or scroll settings, they still exist in the background and are recalculated when revisited. This ensures that the structural price analysis remains consistent, regardless of the chart view.
Box Limitations in Pine Script :
The indicator is subject to Pine Script's inherent limitation of 500 boxes. This means that no more than 500 segments or level boxes can be drawn on the chart simultaneously. For most configurations, this limitation is mitigated by focusing on the visual range, but users employing very low sensitivity settings may exceed the limit. In such cases, only the most recent 500 boxes will be displayed, potentially omitting earlier segments.
Lag with Low Sensitivity Settings :
When sensitivity is set to a low value, the indicator creates many more segments, resulting in finer granularity and a higher number of boxes. While this provides detailed structural levels, it may increase the likelihood of exceeding Pine Script’s 500-box limit or cause a temporary lag when rendering a dense set of boxes over a wide visual range. Users should adjust sensitivity to balance detail with performance, especially on assets with high volatility or broad price ranges.
Live Segment Caution :
The live segment box updates in real time to reflect price movements as the segment is still developing. Since the segment high and segment low are not yet finalized, users should interpret this feature as a dynamic visualization of current price behavior rather than a definitive structural analysis. This ensures clarity during ongoing price action while maintaining the integrity of the indicator's framework.
Cross-Market Versatility :
The indicator’s time-agnostic and mechanical design ensures that it functions identically across all markets and timeframes. However, users should consider the unique characteristics of different markets when interpreting the results, as certain assets (e.g., highly volatile cryptocurrencies) may require sensitivity adjustments for optimal segmentation.
Visual Range Dependency: Levels recalculate efficiently within the chart's visible range but may lag temporarily when zooming or scrolling quickly.
These considerations ensure that the Non-Psychological Levels indicator remains robust and versatile while highlighting some inherent limitations of Pine Script and real-time recalculations. Users can mitigate these constraints by carefully adjusting sensitivity and understanding how the visual range dependency affects performance.
⚠️ DISCLAIMER ⚠️
The Non-Psychological Levels indicator is a visual analysis tool and is not designed as a predictive or trading signal indicator. Its primary purpose is to highlight structural price levels, providing an objective framework for understanding support and resistance within mechanically segmented price action.
The indicator operates within the visible range of the chart to ensure efficiency and adaptiveness, but this recalculation should not be interpreted as a forecast of future price behavior. While the structural levels may align with significant price zones in hindsight, they are purely a reflection of observed price dynamics and should not be used as standalone trading signals.
This indicator is intended as an educational and visual aid to complement other analysis methods. Users are encouraged to integrate it into a broader trading strategy and make adjustments to the settings based on their individual needs and market conditions.
🧠 BEYOND THE CODE 🧠
The Non-Psychological Levels indicator, like other xxattaxx indicators , is designed with education and community collaboration in mind. Its open-source nature encourages exploration, experimentation, and the development of new approaches to price analysis. By focusing on structural price behavior rather than psychological or time-based factors, this indicator introduces a fresh perspective for users to study.
Beyond its visual utility, the indicator serves as an educational framework for understanding the concept of non-psychological analysis. It offers traders an opportunity to explore price dynamics in a purely mechanical way, challenging conventional methods and fostering deeper insights into structural behavior. This approach is especially valuable for those interested in exploring new concepts or seeking alternative perspectives on market analysis.
Your comments, suggestions, and discussions are invaluable in shaping the future of this project. We actively encourage your feedback and contributions, which will directly help us refine and improve the Non-Psychological Levels indicator. We look forward to seeing the creative ways in which you use and enhance this tool. MVS

SuperATR 7-Step Profit - Strategy [presentTrading] Long time no see!
█ Introduction and How It Is Different
The SuperATR 7-Step Profit Strategy is a multi-layered trading approach that integrates adaptive Average True Range (ATR) calculations with momentum-based trend detection. What sets this strategy apart is its sophisticated 7-step take-profit mechanism, which combines four ATR-based exit levels and three fixed percentage levels. This hybrid approach allows traders to dynamically adjust to market volatility while systematically capturing profits in both long and short market positions.
Traditional trading strategies often rely on static indicators or single-layered exit strategies, which may not adapt well to changing market conditions. The SuperATR 7-Step Profit Strategy addresses this limitation by:
- Using Adaptive ATR: Enhances the standard ATR by making it responsive to current market momentum.
- Incorporating Momentum-Based Trend Detection: Identifies stronger trends with higher probability of continuation.
- Employing a Multi-Step Take-Profit System: Allows for gradual profit-taking at predetermined levels, optimizing returns while minimizing risk.
BTCUSD 6hr Performance
█ Strategy, How It Works: Detailed Explanation
The strategy revolves around detecting strong market trends and capitalizing on them using an adaptive ATR and momentum indicators. Below is a detailed breakdown of each component of the strategy.
🔶 1. True Range Calculation with Enhanced Volatility Detection
The True Range (TR) measures market volatility by considering the most significant price movements. The enhanced TR is calculated as:
TR = Max
Where:
High and Low are the current bar's high and low prices.
Previous Close is the closing price of the previous bar.
Abs denotes the absolute value.
Max selects the maximum value among the three calculations.
🔶 2. Momentum Factor Calculation
To make the ATR adaptive, the strategy incorporates a Momentum Factor (MF), which adjusts the ATR based on recent price movements.
Momentum = Close - Close
Stdev_Close = Standard Deviation of Close over n periods
Normalized_Momentum = Momentum / Stdev_Close (if Stdev_Close ≠ 0)
Momentum_Factor = Abs(Normalized_Momentum)
Where:
Close is the current closing price.
n is the momentum_period, a user-defined input (default is 7).
Standard Deviation measures the dispersion of closing prices over n periods.
Abs ensures the momentum factor is always positive.
🔶 3. Adaptive ATR Calculation
The Adaptive ATR (AATR) adjusts the traditional ATR based on the Momentum Factor, making it more responsive during volatile periods and smoother during consolidation.
Short_ATR = SMA(True Range, short_period)
Long_ATR = SMA(True Range, long_period)
Adaptive_ATR = /
Where:
SMA is the Simple Moving Average.
short_period and long_period are user-defined inputs (defaults are 3 and 7, respectively).
🔶 4. Trend Strength Calculation
The strategy quantifies the strength of the trend to filter out weak signals.
Price_Change = Close - Close
ATR_Multiple = Price_Change / Adaptive_ATR (if Adaptive_ATR ≠ 0)
Trend_Strength = SMA(ATR_Multiple, n)
🔶 5. Trend Signal Determination
If (Short_MA > Long_MA) AND (Trend_Strength > Trend_Strength_Threshold):
Trend_Signal = 1 (Strong Uptrend)
Elif (Short_MA < Long_MA) AND (Trend_Strength < -Trend_Strength_Threshold):
Trend_Signal = -1 (Strong Downtrend)
Else:
Trend_Signal = 0 (No Clear Trend)
🔶 6. Trend Confirmation with Price Action
Adaptive_ATR_SMA = SMA(Adaptive_ATR, atr_sma_period)
If (Trend_Signal == 1) AND (Close > Short_MA) AND (Adaptive_ATR > Adaptive_ATR_SMA):
Trend_Confirmed = True
Elif (Trend_Signal == -1) AND (Close < Short_MA) AND (Adaptive_ATR > Adaptive_ATR_SMA):
Trend_Confirmed = True
Else:
Trend_Confirmed = False
Local Performance
🔶 7. Multi-Step Take-Profit Mechanism
The strategy employs a 7-step take-profit system
█ Trade Direction
The SuperATR 7-Step Profit Strategy is designed to work in both long and short market conditions. By identifying strong uptrends and downtrends, it allows traders to capitalize on price movements in either direction.
Long Trades: Initiated when the market shows strong upward momentum and the trend is confirmed.
Short Trades: Initiated when the market exhibits strong downward momentum and the trend is confirmed.
█ Usage
To implement the SuperATR 7-Step Profit Strategy:
1. Configure the Strategy Parameters:
- Adjust the short_period, long_period, and momentum_period to match the desired sensitivity.
- Set the trend_strength_threshold to control how strong a trend must be before acting.
2. Set Up the Multi-Step Take-Profit Levels:
- Define ATR multipliers and fixed percentage levels according to risk tolerance and profit goals.
- Specify the percentage of the position to close at each level.
3. Apply the Strategy to a Chart:
- Use the strategy on instruments and timeframes where it has been tested and optimized.
- Monitor the positions and adjust parameters as needed based on performance.
4. Backtest and Optimize:
- Utilize TradingView's backtesting features to evaluate historical performance.
- Adjust the default settings to optimize for different market conditions.
█ Default Settings
Understanding default settings is crucial for optimal performance.
Short Period (3): Affects the responsiveness of the short-term MA.
Effect: Lower values increase sensitivity but may produce more false signals.
Long Period (7): Determines the trend baseline.
Effect: Higher values reduce noise but may delay signals.
Momentum Period (7): Influences adaptive ATR and trend strength.
Effect: Shorter periods react quicker to price changes.
Trend Strength Threshold (0.5): Filters out weaker trends.
Effect: Higher thresholds yield fewer but stronger signals.
ATR Multipliers: Set distances for ATR-based exits.
Effect: Larger multipliers aim for bigger moves but may reduce hit rate.
Fixed TP Levels (%): Control profit-taking on smaller moves.
Effect: Adjusting these levels affects how quickly profits are realized.
Exit Percentages: Determine how much of the position is closed at each TP level.
Effect: Higher percentages reduce exposure faster, affecting risk and reward.
Adjusting these variables allows you to tailor the strategy to different market conditions and personal risk preferences.
By integrating adaptive indicators and a multi-tiered exit strategy, the SuperATR 7-Step Profit Strategy offers a versatile tool for traders seeking to navigate varying market conditions effectively. Understanding and adjusting the key parameters enables traders to harness the full potential of this strategy.

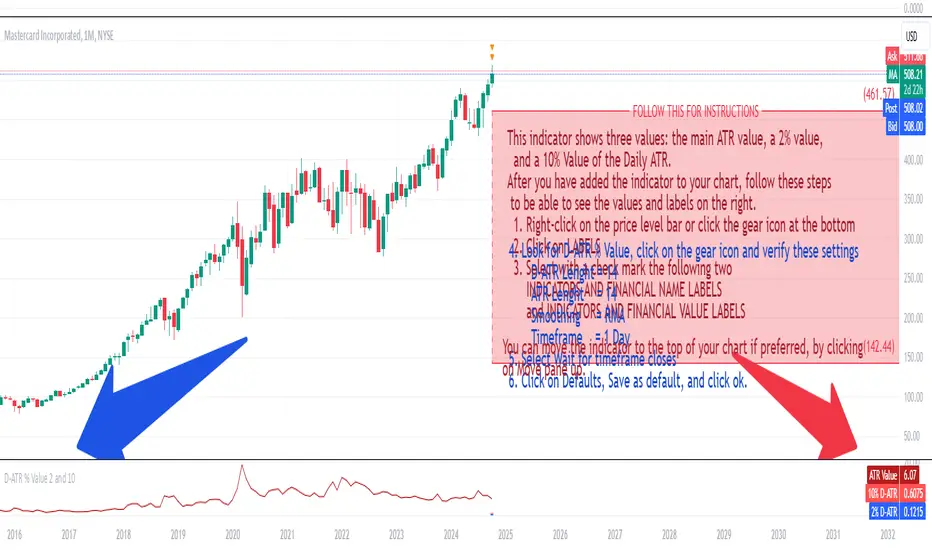
Daily ATR 2 and 10 Percent Value
This indicator shows three values: the main ATR value, a 2% value,
and a 10% Value of the Daily ATR.
After you have added the indicator to your chart, follow these steps
to be able to see the values and labels on the right.
1. Right-click on the price level bar or click the gear icon at the bottom
2. Click on LABELS
3. Select with a check mark the following two
INDICATORS AND FINANCIAL NAME LABELS
and INDICATORS AND FINANCIAL VALUE LABELS
4. Look for D-ATR % Value, click on the gear icon and verify these settings
- D-ATR Lenght = 14
- ATR Lenght = 14
- Smoothing = RMA
- Timeframe = 1 Day
5. Select Wait for timeframe closes
6. Click on Defaults, Save as default, and click ok.
You can move the indicator to the top of your chart if preferred, by clicking
on Move pane up.
Slightly modifications from other indicators.
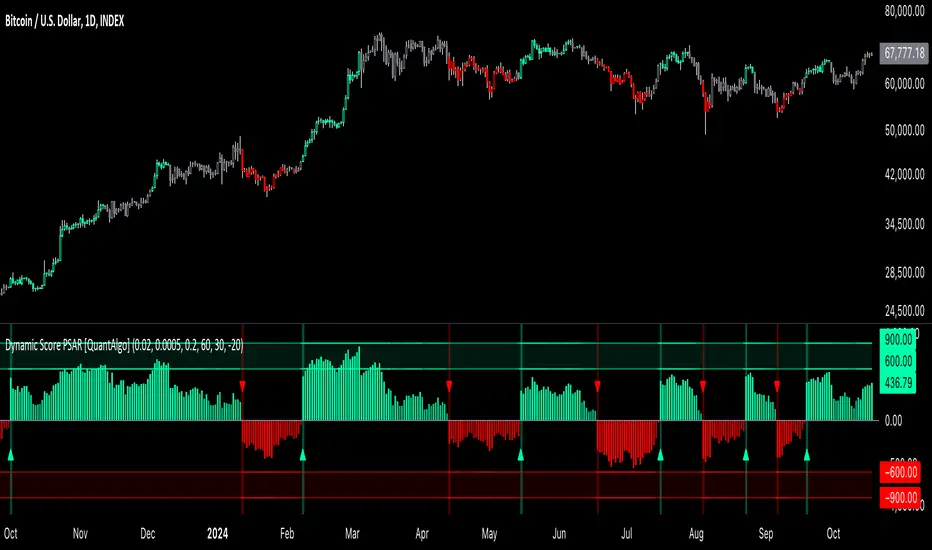
Dynamic Score PSAR [QuantAlgo]Dynamic Score PSAR 📈🧬
The Dynamic Score PSAR by QuantAlgo introduces an innovative approach to trend detection by utilizing a dynamic trend scoring technique in combination with the Parabolic SAR. This method goes beyond traditional trend-following indicators by evaluating market momentum through a scoring system that analyzes price behavior over a customizable window. By dynamically adjusting to evolving market conditions, this indicator provides clearer, more adaptive trend signals that help traders and investors anticipate market reversals and capitalize on momentum shifts with greater precision.
💫 Conceptual Foundation and Innovation
At the core of the Dynamic Score PSAR is the dynamic trend score system, which assesses price movements by comparing normalized PSAR values across a range of historical data points. This dynamic trend scoring technique offers a unique, probabilistic approach to trend analysis by evaluating how the current market compares to past price movements. Unlike traditional PSAR indicators that rely on static parameters, this scoring mechanism allows the indicator to adjust in real time to market fluctuations, offering traders and investors a more responsive and insightful view of trends. This innovation makes the Dynamic Score PSAR particularly effective in detecting shifts in momentum and potential reversals, even in volatile or complex market environments.
✨ Technical Composition and Calculation
The Dynamic Score PSAR is composed of several advanced components designed to provide a higher probability of detecting accurate trend shifts. The key innovation lies in the dynamic trend scoring technique, which iterates over historical PSAR values and evaluates price momentum through a dynamic scoring system. By comparing the current normalized PSAR value with previous data points over a user-defined window, the system generates a score that reflects the strength and direction of the trend. This allows for a more refined and responsive detection of trends compared to static, traditional indicators.
To enhance clarity, the PSAR values are normalized against an Exponential Moving Average (EMA), providing a standardized framework for comparison. This normalization ensures that the indicator adapts dynamically to market conditions, making it more effective in volatile markets. The smoothing process reduces noise, helping traders and investors focus on significant trend signals.
Additionally, users can adjust the length of the data window and the sensitivity thresholds for detecting uptrends and downtrends, providing flexibility for different trading and investing environments.
📈 Features and Practical Applications
Customizable Window Length: Adjust the window length to control the indicator’s sensitivity to recent price movements. This provides flexibility for short-term or long-term trend analysis.
Uptrend/Downtrend Thresholds: Set customizable thresholds for identifying uptrends and downtrends. These thresholds define when trend signals are triggered, offering adaptability to different market conditions.
Bar Coloring and Gradient Visualization: Visual cues, including color-coded bars and gradient fills, make it easier to interpret market trends and identify key moments for potential trend reversals.
Momentum Confirmation: The dynamic trend scoring system evaluates price action over time, providing a probabilistic measure of market momentum to confirm the strength and direction of a trend.
⚡️ How to Use
✅ Add the Indicator: Add the Dynamic Score PSAR to your favourites, then to your chart and adjust the PSAR settings, window length, and trend thresholds to match your preferences. Customize the sensitivity to price movements by tweaking the window length and thresholds for different market conditions.
👀 Monitor Trend Shifts: Watch for trend changes as the normalized PSAR values cross key thresholds, and use the dynamic score to confirm the strength and direction of trends. Bar coloring and background fills visually highlight key moments for trend shifts, making it easier to spot reversals.
🔔 Set Alerts: Configure alerts for significant trend crossovers and reversals, ensuring you can act on market movements promptly, even when you’re not actively monitoring the charts.
🌟 Summary and Usage Tips
The Dynamic Score PSAR by QuantAlgo is a powerful tool that combines traditional trend-following techniques with the flexibility of a dynamic trend scoring system. This innovative approach provides clearer, more adaptive trend signals, reducing the risk of false entries and exits while helping traders and investors capture significant market moves. The ability to adjust the indicator’s sensitivity and thresholds makes it versatile across different trading and investing environments, whether you’re focused on short-term pivots or long-term trend reversals. To maximize its effectiveness, fine-tune the sensitivity settings based on current market conditions and use the visual cues to confirm trend shifts.
Enhanced Economic Composite with Dynamic WeightEnhanced Economic Composite with Dynamic Weight
Overview of the Indicator :
The "Enhanced Economic Composite with Dynamic Weight" is a comprehensive tool that combines multiple economic indicators, technical signals, and dynamic weighting to provide insights into market and economic health. It adjusts based on current volatility and recession risk, offering a detailed view of market conditions.
What This Indicator Does :
Tracks Economic Health: Uses key economic and market indicators to assess overall market conditions.
Dynamic Weighting: Adjusts the importance of components like stock indices, gold, and bonds based on volatility (VIX) and yield curve inversion.
Technical Signals: Identifies market momentum shifts through key crossovers like the Golden Cross, Death Cross, Silver Cross, and Hospice Cross.
Recession Shading: Marks known recessions for historical context.
Economic Factors Considered :
TIP (Treasury Inflation-Protected Securities): Reflects inflation expectations.
Gold: A safe-haven asset, increases in weight during volatility or rising momentum.
US Dollar Index (DXY): Measures USD strength, fixed weight of 10%, smoothed with EMA.
Commodities (DBC): Indicates global demand; weight increases with momentum or volatility.
Volatility Index (VIX): Reflects market risk, inversely related to market confidence.
Stock Indices (S&P 500, DJIA, NASDAQ, Russell 2000): Represent market performance, with weights reduced during high volatility or negative yield spread.
Yield Spread (10Y - 2Y Treasuries): Predicts recessions; negative spread reduces stock weighting.
Credit Spread (HYG - TLT): Indicates market risk through corporate vs. government bond yields.
How and Why Factors are Weighted:
Stock Indices get more weight in stable markets (low VIX, positive yield spread), while safe-haven assets like gold and bonds gain weight in volatile markets or during yield curve inversions. This dynamic adjustment ensures the composite reflects current market sentiment.
Technical Signals:
Golden Cross: 50 EMA crossing above 200 SMA, signaling bullish momentum.
Death Cross: 50 EMA below 200 SMA, indicating bearish momentum.
Silver Cross: 21 EMA crossing above 50 EMA, plotted only if below the 200-day SMA, signaling potential upside in downtrend conditions.
Hospice Cross: 50 EMA crosses below 21 EMA, plotted only if 21 EMA is below 200 SMA, a leading bearish signal.
Recession Shading:
Recession periods like the Great Recession, Early 2000s Recession, and COVID-19 Recession are shaded to provide historical context.
Benefits of Using This Indicator:
Comprehensive Analysis: Combines economic fundamentals and technical analysis for a full market view.
Dynamic Risk Adjustment: Weights shift between growth and safe-haven assets based on volatility and recession risk.
Early Signals: The Silver Cross and Hospice Cross provide early warnings of potential market shifts.
Recession Forecasting: Helps predict downturns through the yield curve and recession indicators.
Who Can Benefit:
Traders: Identify market momentum shifts early through crossovers.
Long-term Investors: Use recession warnings and dynamic adjustments to protect portfolios.
Analysts: A holistic tool for analyzing both economic trends and market movements.
This indicator helps users navigate varying market conditions by dynamically adjusting based on economic factors and providing early technical signals for market momentum shifts.

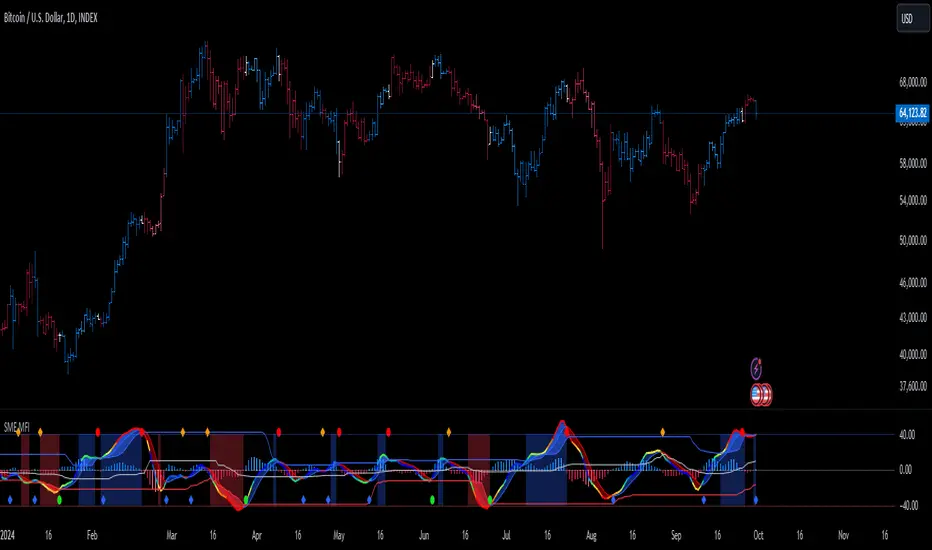
SMI Ergodic Indicator/Oscillator of Money Flow Index▮ Introduction
The Stochastic Momentum Index Ergodic (SMII) indicator is a technical analysis tool designed to predict trend reversals in the price of an asset.
It functions as a momentum oscillator, measuring the ratio of the smoothed price change to the smoothed absolute price change over a given number of previous periods.
The Ergodic SMI is based on the True Strength Index (TSI) and integrates a signal line, which is an exponential moving average (EMA) of the SMI indicator itself.
The Ergodic SMI oscillator provides a clearer picture of market trends than the traditional stochastic oscillator by incorporating the concept of 'ergodicity', which helps remove market noise.
On ther other hand, MFI (Money Flow Index) is a technical analysis indicator used to measure the inflow of money into an asset and thus help identify buying and selling pressure in a given financial instrument.
When these two indicators are combined, they can provide a more comprehensive view of price direction and market strength.
▮ Motivation: why another indicator?
By combining SMII with MFI, we can gain even more insights into the market.
One way to do this is to use the MFI as an input to the SMII, rather than just using price.
This means we are measuring momentum based on buying and selling pressure rather than just price.
Furthermore, there is the possibility of making several fine adjustments to both the calculation and visualization parameters that are not present in other indicators.
▮ What to look for
When using the SMII MFI indicator, there are a few things to look out for.
First, look at the SMII signal line.
When the line crosses above -40, it is considered a buy signal, while the crossing below +40 is considered a sell signal.
Also, pay attention to divergences between the SMII and the price.
If price is rising but the SMII is showing negative divergence, it could indicate that momentum is waning and a reversal could be in the offing.
Likewise, if price is falling but the SMII is showing positive divergence, this could indicate that momentum is building and a reversal could also be in the offing.
Divergences can be considered in both indicator and/or histogram.
Examples:
▮ Notes
The indicator presented here offers both the 'SMII' and the 'SMIO', that is, the 'Stochastic Momentum Index Ergodic Indicator' together with the 'Stochastic Momentum Index Ergodic Oscillator' (histogram), as per the documentation described in reference links.
So it is important to highlight the differences in relation to my other indicator, the 'Stochastic Momentum Index (SMI) of Money Flow Index (MFI)':
This last one is purely based on the SMI , which is implemented using SMA smoothing for the relative range and the high/low range.
Although they may seem the same in some situations, the calculation is actually different. The TSI tends to be more responsive at the expense of being noisier, while the SMI tends to be smoother. Which of these two indicators is best depends on the situation, the context, and the analyst's personal preference.
Please refer to reference links to more info.
▮ References
SMI documentation
SMII documentation
SMIO documentation
MFI documentation
US Sentiment Index [CryptoSea]The US Sentiment Index is an advanced analytical tool designed for traders seeking to uncover patterns, correlations, and potential leading signals across key market tickers. This indicator surpasses traditional sentiment measures, providing a data-driven approach that offers deeper insights compared to conventional indices like the Fear and Greed Index.
Key Features
Multi-Ticker Analysis: Integrates data from a diverse set of market indicators, including gold, S&P 500, U.S. Dollar Index, Volatility Index, and more, to create a comprehensive view of market sentiment.
Customisable Sensitivity Settings: Allows users to adjust the moving average period to fine-tune the sensitivity of sentiment calculations, adapting the tool to various market conditions and trading strategies.
Detailed Sentiment Scaling: Utilises a 0-100 scale to quantify sentiment strength, with colour gradients that visually represent bearish, neutral, and bullish conditions, aiding in quick decision-making.
Below is an example where the sentiment index can give leading signals. We see a first sign of wekaness in the index as it drops below its moving average. Shortly after we see it dip below our median 50 level, another sign of weakeness. We see the SPX price action to take a hit following the sentiment index decrease.
Tickers Used and Their Impact on Sentiment
The impact of each ticker on sentiment can be bullish or bearish, depending on their behaviour:
Gold (USGD): Typically seen as a safe-haven asset, rising gold prices often indicate increased market fear or bearish sentiment. Conversely, falling gold prices can signal reduced fear and a shift towards bullish sentiment in riskier assets.
S&P 500 (SPX): A rising S&P 500 is usually a sign of bullish sentiment, reflecting confidence in economic growth and market stability. A decline, however, suggests bearish sentiment and a potential move towards risk aversion.
U.S. Dollar Index (DXY): A strengthening U.S. Dollar can be a sign of fear as investors seek safety in the dollar, which is bearish for risk assets. A weakening dollar, on the other hand, can signal bullish sentiment as capital flows into riskier assets.
Volatility Index (VIX): Known as the "fear gauge," a rising VIX indicates increased market fear and bearish sentiment. A falling VIX suggests a calm, bullish market environment.
Junk Bonds (JNK): Rising junk bond prices often reflect bullish sentiment as investors take on more risk for higher returns. Conversely, falling junk bond prices signal increased fear and bearish sentiment.
Long-Term Treasury Bonds (TLT): Higher prices for long-term treasuries usually indicate a flight to safety, reflecting bearish sentiment. Lower prices suggest a shift towards riskier assets, indicating bullish sentiment.
Financial Sector ETF (XLF): Strength in the financial sector is typically bullish, indicating confidence in economic conditions. Weakness in this sector can reflect bearish sentiment and concerns about financial stability.
Unemployment Rate (USUR): A rising unemployment rate is a bearish signal, indicating economic weakness. A declining unemployment rate is bullish, reflecting economic strength and job growth.
U.S. Interest Rates (USINTR, USIRYY): Higher interest rates can be bearish, as they increase borrowing costs and reduce spending. Lower rates are generally bullish, promoting economic growth and risk-taking.
How it Works
Sentiment Calculation: The US Sentiment Index combines data from multiple tickers, calculating sentiment by scaling the distance from their respective moving averages. Each asset's behaviour is interpreted within the context of market fear or greed, providing a refined sentiment reading that adjusts dynamically.
Market Strength Analysis: When the index is above 50 and also above its moving average, it indicates particularly strong or bullish market conditions, driven by greed. Conversely, when the index is below 50 and under its moving average, it signals bearish or weak market conditions, associated with fear.
Correlation and Pattern Detection: The indicator analyses correlations among the included assets to detect patterns that might signal potential market movements, giving traders a leading edge over simpler sentiment measures.
Adaptive Background Colouring: Utilises a colour gradient that dynamically adjusts based on sentiment values, highlighting extreme fear, neutral, and extreme greed levels directly on the chart.
Flexible Display Options: Offers settings to toggle the moving average plot and adjust its period, giving users the ability to tailor the indicator's sensitivity and display to their specific needs.
In this example below, we can see the Sentiment rise above the Moving Average (MA). Price action goes on to follow this, although there is an instance where it dips below the MA, it quickly rises back above again as a sign of strength.
Another way you can use this index is by simply using the MA, if its trending up, we know the macro sentiment is bullish.
Application
Data-Driven Insights: Offers traders a detailed, data-driven approach to sentiment analysis, incorporating a broad spectrum of market indicators to deliver actionable insights.
Pattern Recognition: Helps identify patterns and correlations that may lead to market reversals or continuations, providing a nuanced view that goes beyond simple sentiment gauges.
Enhanced Decision-Making: Equips traders with a robust tool to validate trading strategies and make informed decisions based on comprehensive sentiment analysis.
The US Sentiment Index by is an essential addition to the toolkit of any trader looking to navigate market complexities with precision and confidence. Its advanced features and data-driven approach offer unparalleled insights into market sentiment, setting it apart from conventional sentiment indicators.

RCYC Bullish Bearish Indicator
Summary: The RCYC Bullish Bearish Indicator is a custom trading tool designed to help traders identify potential bullish and bearish conditions in the market using a combination of KDJ and RSI indicators. This indicator uses color-coded candles to visually represent bullish and bearish signals, making it easy to identify trend changes on the chart. The script is particularly useful for traders who prefer visual signals and want to incorporate both trend momentum (KDJ) and relative strength (RSI) in their analysis.
Description:
The RCYC Bullish Bearish Indicator is a unique mashup of the KDJ and RSI indicators, optimized to provide a clear visual representation of market conditions through color-coded candles. This indicator not only identifies the potential trend shifts but also provides alerts for significant crossover points, enhancing a trader's ability to make informed decisions.
How It Works:
KDJ Calculation:
The KDJ is a variation of the Stochastic Oscillator that includes the %J line, which can go beyond the typical 0-100 range of %K and %D.
The KDJ component of this indicator calculates the highest high and lowest low over a specified period (KDJ Length), using these values to derive the %K line.
The %D line is a smoothed version of %K, and the %J line is derived from %K and %D using the formula: J = 3 * %K - 2 * %D.
This indicator focuses on the behavior of the %J line in relation to a mid-point level (50), identifying crossovers and crossunders that signal potential shifts in market sentiment.
RSI Calculation:
The Relative Strength Index (RSI) is a momentum oscillator that measures the speed and change of price movements. It is widely used to identify overbought or oversold conditions.
In this indicator, RSI values are adjusted and plotted to align visually with the KDJ values, providing a complementary momentum analysis.
Crossover Logic and Candle Coloring:
The indicator tracks two main events:
CrossOver50: When the %J line crosses above the 50 level, indicating potential bullish momentum.
CrossUnder50: When the %J line crosses below the 50 level, indicating potential bearish momentum.
Depending on the crossover events, the script changes the color of the candles on the chart:
Red candles on the initial crossover above 50, followed by dark blue candles to maintain bullish sentiment.
Yellow candles on the initial crossover below 50, followed by light blue candles to maintain bearish sentiment.
Alerts:
The indicator includes alert conditions for both bullish and bearish signals:
Red Candle Alert: Notifies the trader when the %J line crosses above 50.
Yellow Candle Alert: Notifies the trader when the %J line crosses below 50.
These alerts allow traders to react promptly to key market signals without continuously monitoring the chart.
Usage and Benefits:
This indicator is designed for traders looking to combine momentum and trend analysis into a single visual tool. It is particularly useful for those trading in trending markets or looking for entry/exit signals based on momentum shifts.
The color-coded candles provide an intuitive way to assess market conditions at a glance, reducing the complexity associated with analyzing multiple indicators separately.
By integrating both KDJ and RSI, the RCYC Bullish Bearish Indicator offers a balanced approach to trend detection and momentum confirmation, making it versatile for various trading styles, including scalping, swing trading, and position trading.
Originality and Usefulness:
While the indicator builds upon the familiar concepts of KDJ and RSI, it uniquely merges them into a cohesive visual tool with distinct crossover-based alerts and candle coloring.
This approach makes the indicator original, as it simplifies the interpretation of complex signals into straightforward visual cues, enhancing the decision-making process for traders who prefer chart-based analysis.

RSI Overlay Table - 30 Tickers Sorted with ColorOverview
The RSI Overlay Table script provides traders with a powerful tool to monitor the Relative Strength Index (RSI) across multiple tickers in real-time. This script enables users to keep track of up to 30 different assets simultaneously, displaying their RSI values in an easy-to-read table format directly on the chart. It helps traders identify overbought and oversold conditions quickly, enhancing their ability to make informed trading decisions.
Key Features
Monitor Multiple Tickers: Track the RSI values of up to 30 different tickers at once. This allows users to have a broad view of market conditions across various assets without the need to switch between charts.
Dynamic RSI Calculations: The script calculates the RSI using the user-defined length, providing flexibility to adjust sensitivity based on the trading strategy. The default RSI length is set to 14, a commonly used period in technical analysis.
Customizable Overbought and Oversold Levels: Users can define their own overbought and oversold RSI levels, allowing them to tailor the script to their trading style. By default, the overbought level is set at 70, and the oversold level is set at 30.
Hide Neutral Rows Option: To help traders focus on the most critical signals, the script includes an option to hide rows where the RSI values are neither overbought nor oversold. This feature helps traders concentrate on assets that are more likely to experience a price reversal.
Color-Coded Alerts: The script highlights overbought and oversold conditions with distinct colors:
Red: Indicates that the asset is overbought (RSI above the user-defined overbought level).
Green: Indicates that the asset is oversold (RSI below the user-defined oversold level).
How to Use the RSI Overlay Table Script
Input Tickers: Enter up to 30 ticker symbols in the script settings. The script will automatically fetch the RSI values for each ticker and display them in the overlay table on the chart.
Adjust RSI Settings: Modify the RSI length and the overbought/oversold levels according to your trading strategy. These settings can be adjusted in the script input panel.
Use the Hide Neutral Rows Option: Toggle the “Hide Neutral Rows” option to focus only on tickers that are in overbought or oversold conditions. This feature is useful for traders who wish to filter out less significant signals and only act on strong RSI indicators.
Interpret the Table: The table will display each ticker symbol alongside its current RSI value. Tickers with RSI values above the overbought level will be highlighted in red, suggesting a potential sell signal. Tickers with RSI values below the oversold level will be highlighted in green, indicating a potential buy signal.
Application and Strategy
The RSI Overlay Table script is designed for traders who manage multiple assets and need to monitor their technical indicators efficiently. It is particularly useful for:
Swing Traders: Identifying overbought and oversold conditions to time entries and exits.
Portfolio Managers: Monitoring the relative strength of various assets in a portfolio.
Scalpers: Quickly spotting extreme price movements across multiple assets.
Notes
This script is intended to be used as a supplementary tool for technical analysis. Always use it in conjunction with other indicators and market analysis techniques.
The RSI values and signals provided by this script should not be taken as financial advice.
The RSI Overlay Table script provides a clear and efficient way to track RSI values across multiple assets, helping traders make more informed decisions. By offering customizable settings and a clean, color-coded interface, this tool aims to enhance the user's trading experience and streamline their analysis process.

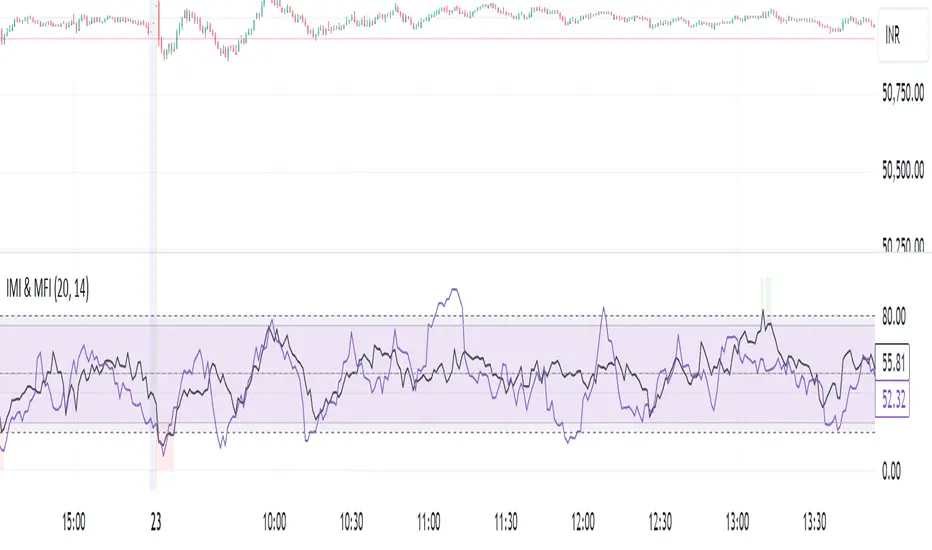
IMI and MFI CombinedFor a strategy using the combined IMI (Intraday Momentum Index), MFI (Money Flow Index), and Bollinger Bands on a 1-minute chart of Bank NIFTY (Bank Nifty Index), here's how you can interpret the indicators and define a sell signal strategy:
Strategy Explanation:
IMI (Intraday Momentum Index):
IMI measures the ratio of upward price changes to downward price changes over a specified period, indicating momentum.
In the script, IMI is plotted with a range from 0 to 100. Levels above 75 are considered overbought, and levels below 25 are oversold.
Strategy Condition: A sell signal can be considered when IMI is above 75, indicating a potentially overbought market condition.
MFI (Money Flow Index):
MFI measures the strength of money flowing in and out of a security, using price and volume.
In the script, MFI is plotted with levels at 80 (overbought) and 20 (oversold).
Strategy Condition: A sell signal can be considered when MFI is above 80, suggesting an overbought condition in the market.
Bollinger Bands:
Bollinger Bands consist of a middle band (SMA) and upper/lower bands representing volatility levels around the price.
In the script, Bollinger Bands are plotted with a length of 20 and a standard deviation multiplier of 2.
Strategy Condition: While not explicitly used for generating sell signals in this script, Bollinger Bands can help confirm price volatility and potential reversals when combined with other indicators.
Sell Signal Criteria:
IMI Sell Signal: Look for instances where IMI rises above 75. This indicates that the recent upward price momentum may be reaching an unsustainable level, potentially signaling a reversal or a pullback in prices.
MFI Sell Signal: Look for MFI rising above 80. This suggests that the market has experienced strong buying pressure, possibly leading to an overbought condition where a price correction or reversal might occur.
Implementation Considerations:
Confirmation: Consider waiting for both IMI and MFI to confirm the overbought condition simultaneously before entering a sell trade. This can increase the reliability of the signal.
Risk Management: Use stop-loss orders to manage risk in case the market moves against the anticipated direction after the sell signal is triggered.
Timeframe: This strategy is tailored for a 1-minute chart, meaning signals should be interpreted and acted upon quickly due to the rapid nature of price movements in intraday trading.
By combining these indicators and interpreting their signals, you can develop a systematic approach to identifying potential sell opportunities in the Bank NIFTY index on a 1-minute timeframe. Adjustments to indicator parameters and additional technical analysis may further refine the strategy based on your trading preferences and risk tolerance.
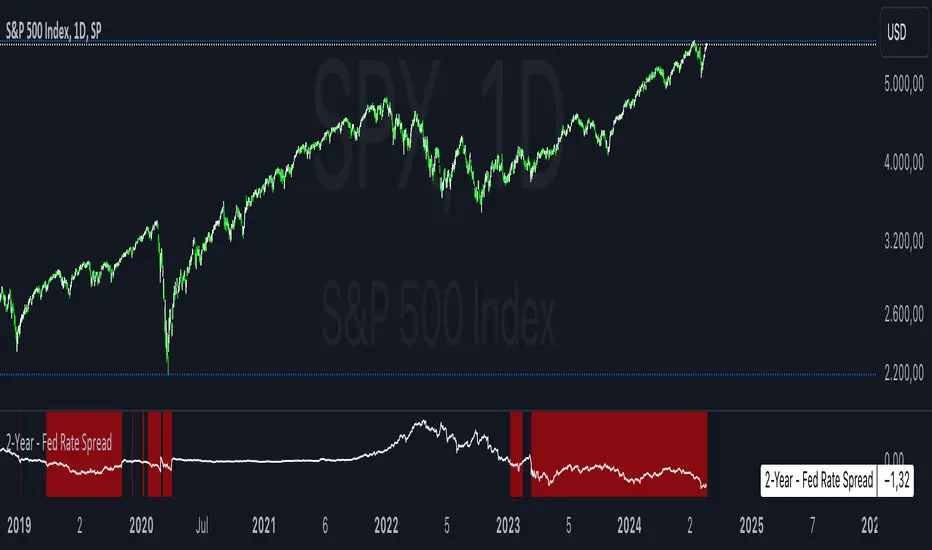
2-Year - Fed Rate SpreadThe “2-Year - Fed Rate Spread” is a financial indicator that measures the difference between the 2-Year Treasury Yield and the Federal Funds Rate (Fed Funds Rate). This spread is often used as a gauge of market sentiment regarding the future direction of interest rates and economic conditions.
Calculation
• 2-Year Treasury Yield: This is the return on investment, expressed as a percentage, on the U.S. government’s debt obligations that mature in two years.
• Federal Funds Rate: The interest rate at which depository institutions trade federal funds (balances held at Federal Reserve Banks) with each other overnight.
The indicator calculates the spread by subtracting the Fed Funds Rate from the 2-Year Treasury Yield:
{2-Year - Fed Rate Spread} = {2-Year Treasury Yield} - {Fed Funds Rate}
Interpretation:
• Positive Spread: A positive spread (2-Year Treasury Yield > Fed Funds Rate) typically suggests that the market expects the Fed to raise rates in the future, indicating confidence in economic growth.
• Negative Spread: A negative spread (2-Year Treasury Yield < Fed Funds Rate) can indicate market expectations of a rate cut, often signaling concerns about an economic slowdown or recession. When the spread turns negative, the indicator’s background turns red, making it visually easy to identify these periods.
How to Use:
• Trend Analysis: Investors and analysts can use this spread to assess the market’s expectations for future monetary policy. A persistent negative spread may suggest a cautious approach to equity investments, as it often precedes economic downturns.
• Confirmation Tool: The spread can be used alongside other economic indicators, such as the yield curve, to confirm signals about the direction of interest rates and economic activity.
Research and Academic References:
The 2-Year - Fed Rate Spread is part of a broader analysis of yield spreads and their implications for economic forecasting. Several academic studies have examined the predictive power of yield spreads, including those that involve the 2-Year Treasury Yield and Fed Funds Rate:
1. Estrella, Arturo, and Frederic S. Mishkin (1998). “Predicting U.S. Recessions: Financial Variables as Leading Indicators.” The Review of Economics and Statistics, 80(1): 45-61.
• This study explores the predictive power of various financial variables, including yield spreads, in forecasting U.S. recessions. The authors find that the yield spread is a robust leading indicator of economic downturns.
2. Estrella, Arturo, and Gikas A. Hardouvelis (1991). “The Term Structure as a Predictor of Real Economic Activity.” The Journal of Finance, 46(2): 555-576.
• The paper examines the relationship between the term structure of interest rates (including short-term spreads like the 2-Year - Fed Rate) and future economic activity. The study finds that yield spreads are significant predictors of future economic performance.
3. Rudebusch, Glenn D., and John C. Williams (2009). “Forecasting Recessions: The Puzzle of the Enduring Power of the Yield Curve.” Journal of Business & Economic Statistics, 27(4): 492-503.
• This research investigates why the yield curve, particularly spreads involving short-term rates like the 2-Year Treasury Yield, remains a powerful tool for forecasting recessions despite changes in monetary policy.
Conclusion:
The 2-Year - Fed Rate Spread is a valuable tool for market participants seeking to understand future interest rate movements and potential economic conditions. By monitoring the spread, especially when it turns negative, investors can gain insights into market sentiment and adjust their strategies accordingly. The academic research supports the use of such yield spreads as reliable indicators of future economic activity.
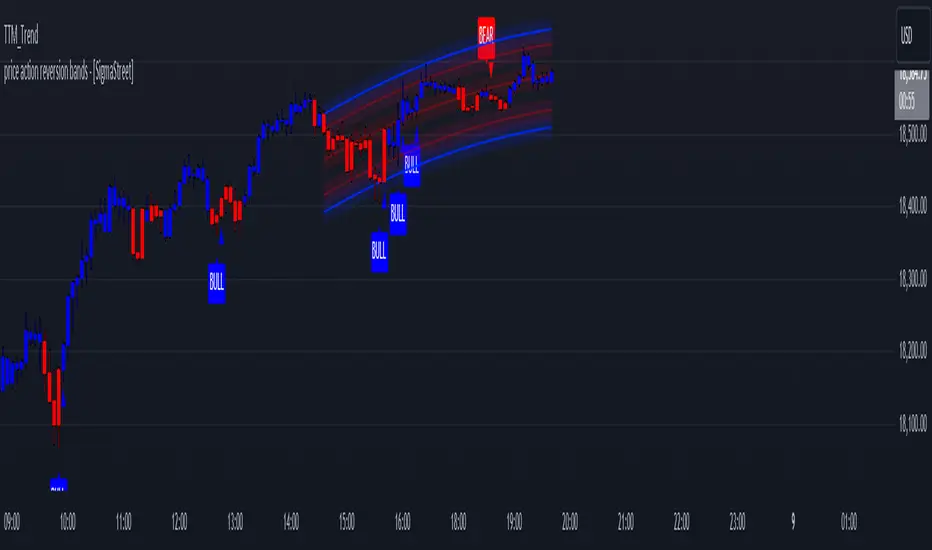
price action reversion bands - [SigmaStreet]█ OVERVIEW
The "Price Action Reversion Bands" is designed to help traders identify potential reversal zones through the integration of polynomial regression, fractal analysis, and pinbar detection. This tool overlays directly onto the price chart, providing dynamic visual cues and signals for market reversals. Its unique synthesis of these methodologies offers traders a powerful, multifaceted approach to market analysis.
█ CONCEPTS
Polynomial Regression Bands:
What It Does:
Models the main trend using a polynomial equation to create a middle trend line with dynamic support and resistance bands.
How It Works:
Calculates polynomial coefficients to plot a regression line and adjusts the bands according to market volatility and conditions.
Fibonacci Retracement Levels:
What It Does:
Provides additional lines inside the regression bands at key Fibonacci ratios to identify potential support and resistance areas.
How It Works:
Calculates retracement levels by identifying high and low points over the same period used to calculate the regression bands, applying Fibonacci ratios to these points.
Fractal Analysis:
What It Does: Identifies natural resistance and support levels, indicating potential reversal zones.
How It Works: Detects fractals based on a specific pattern of price action, using Williams Fractal methodology.
Pinbar Detection:
What It Does: Signals potential price reversals through pinbar candlestick patterns.
How It Works: Analyzes
candlesticks to identify pinbars which show a rejection of prices, suggesting possible reversals.
█ ORIGINALITY AND USEFULNESS
The price action reversion bands distinguishes itself through its innovative integration of several advanced analytical methods, providing traders with a holistic view of potential market reversals:
Unique Combination:
While many tools use these techniques in isolation, this indicator synergistically combines polynomial regression, Fibonacci retracement levels, fractal analysis, and pinbar detection. This multi-faceted approach allows traders to assess strength, potential reversal zones, and price rejection more effectively than using traditional single-method indicators.
Advanced Polynomial Regression Application:
Unlike standard regression tools that offer static insights, this indicator dynamically adjusts its regression bands based on real-time market volatility, providing a more accurate reflection of market conditions.
Enhanced Signal Reliability:
By using fractals and pinbars in conjunction to validate each other, the indicator significantly increases the reliability of its reversal signals. This dual-validation method filters out less probable signals, focusing on high-probability trading opportunities.
Customization and Flexibility:
It offers unprecedented customization options, allowing traders to fine-tune the tool according to their trading style and market conditions. Traders can adjust the polynomial degree, the sensitivity of the Fibonacci retracements, and even the definition of what constitutes a significant pinbar, making it highly adaptable to various trading scenarios.
Educational Value:
The indicator not only aids in trading but also serves as an educational tool that helps traders understand the interaction between different types of market analysis techniques. This contributes to a deeper knowledge base and better trading decisions over time.
These distinctive features make the "Price Action Reversion Bands - " not just another indicator but a comprehensive trading tool that enhances decision-making through a well-rounded analysis of market dynamics.
█ HOW TO USE
Installation and Setup:
Apply the indicator to your TradingView chart from the "Indicators" menu.
Select either polynomial regression or Fibonacci retracement as the basis for the bands through the indicator settings.
Reading the Indicator:
Monitor the approach of price to the upper and lower bands which indicate potential reversal zones.
Look for fractal and pinbar formations near these bands for additional signal confirmation.
Customization:
Adjust settings such as the polynomial degree, data window length, and engagement zones to tailor the bands to your trading style.
Modify visual aspects like color and line type for better clarity and personal preference.
█ FEATURES
Dynamic Adjustment:
Bands adjust in real-time based on incoming price data and selected settings.
Multiple Analysis Techniques: Combines several analytical techniques to provide a comprehensive view of potential market movements. The integration of polynomial regression with Fibonacci levels, supplemented by fractal and pinbar analysis, marks this tool as particularly innovative, offering a level of synthesis that enhances predictive accuracy and usability.
User-Friendly Customization: Allows for extensive customization to suit individual trading strategies and preferences.
█ LIMITATIONS
Market Dependency:
Performance may vary significantly across different markets and conditions.
Parameter Sensitivity: Requires fine-tuning of parameters to ensure optimal performance, which might demand a steep learning curve for new users.
█ NOTES
For best results, combine this tool with other forms of analysis, such as fundamental analysis and other technical indicators, to confirm signals and enhance decision-making.
█ THANKS
Special thanks to the PineCoders community the Pine Coders themselves for their foundational contributions to the concepts used in this script. Their pioneering work in the fields of technical analysis and Pine Script development has been invaluable. This script is a testament to the collaborative spirit of the TradingView developer community, integrating analytical techniques with innovative approaches to offer a tool that is both modern and cutting-edge.
EMA Cross Dashboard | Flux Charts💎 GENERAL OVERVIEW
Introducing our new Exponential Moving Average (EMA) Cross Dashboard! This dashboard let's you select a source for the calculation of the EMA of it, then let's you enter 2 lengths for up to 5 timeframes, plotting their crosses in the chart.
Features of the new EMA Cross Dashboard :
Shows EMA Crosses Across Up To 5 Different Timeframes.
Select Any Source, Including Other Indicators.
Customizable Dashboard.
📌 HOW DOES IT WORK ?
EMA is a widely used indicator within trading community, it is similar to a Simple Moving Average (SMA) but places more weight on recent prices, making it more reactive to current trends. Crosses of EMA lines can be helpful to determine strong bullish & bearish movements of an asset. This indicator shows finds crosses across 5 different timeframes in a dashboard and plots them in your chart for ease of use.
🚩UNIQUENESS
This dashboard cuts through the hassle of manual EMA cross calculations and plotting. It offers flexibility by allowing various data sources (even custom indicators) and customization through enabling / disabling individual timeframes. The clear visualization lets you see EMA crosses efficiently.
⚙️SETTINGS
1. Timeframes
You can set up to 5 timeframes & 2 lenghts to detect crosses for each timeframe here. You can also enable / disable them.
2. General Configuration
EMA Source -> You can select the source for the calculation of the EMA here. You can select sources from other indicators as well as more general sources like close, high and low price.

SMA Cross Dashboard | Flux Charts💎 GENERAL OVERVIEW
Introducing our new Simple Moving Average (SMA) Cross Dashboard! This dashboard let's you select a source for the calculation of the SMA of it, then let's you enter 2 lengths for up to 5 timeframes, plotting their crosses in the chart.
Features of the new SMA Cross Dashboard :
Shows SMA Crosses Across Up To 5 Different Timeframes.
Select Any Source, Including Other Indicators.
Customizable Dashboard.
📌 HOW DOES IT WORK ?
SMA is a widely used indicator within trading community, it simply works by taking the mathematical average of a source by desired length. Crosses of SMA lines can be helpful to determine strong bullish & bearish movements of an asset. This indicator shows finds crosses across 5 different timeframes in a dashboard and plots them in your chart for ease of use.
🚩UNIQUENESS
This dashboard cuts through the hassle of manual SMA cross calculations and plotting. It offers flexibility by allowing various data sources (even custom indicators) and customization through enabling / disabling individual timeframes. The clear visualization lets you see SMA crosses efficiently.
⚙️SETTINGS
1. Timeframes
You can set up to 5 timeframes & 2 lenghts to detect crosses for each timeframe here. You can also enable / disable them.
2. General Configuration
SMA Source -> You can select the source for the calculation of the SMA here. You can select sources from other indicators as well as more general sources like close, high and low price.
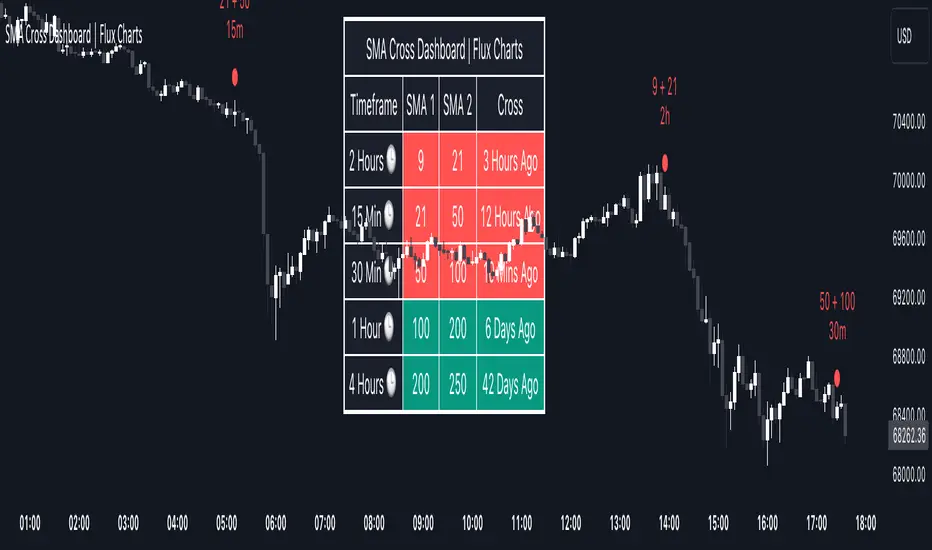
Danger Signals from The Trading MindwheelThe " Danger Signals " indicator, a collaborative creation from the minds at Amphibian Trading and MARA Wealth, serves as your vigilant lookout in the volatile world of stock trading. Drawing from the wisdom encapsulated in "The Trading Mindwheel" and the successful methodologies of legends like William O'Neil and Mark Minervini, this tool is engineered to safeguard your trading journey.
Core Features:
Real-Time Alerts: Identify critical danger signals as they emerge in the market. Whether it's a single day of heightened risk or a pattern forming, stay informed with specific danger signals and a tally of signals for comprehensive decision-making support. The indicator looks for over 30 different signals ranging from simple closing ranges to more complex signals like blow off action.
Tailored Insights with Portfolio Heat Integration: Pair with the "Portfolio Heat" indicator to customize danger signals based on your current positions, entry points, and stops. This personalized approach ensures that the insights are directly relevant to your trading strategy. Certain signals can have different meanings based on where your trade is at in its lifecycle. Blow off action at the beginning of a trend can be viewed as strength, while after an extended run could signal an opportunity to lock in profits.
Forward-Looking Analysis: Leverage the 'Potential Danger Signals' feature to assess future risks. Enter hypothetical price levels to understand potential market reactions before they unfold, enabling proactive trade management.
The indicator offers two different modes of 'Potential Danger Signals', Worst Case or Immediate. Worst Case allows the user to input any price and see what signals would fire based on price reaching that level, while the Immediate mode looks for potential Danger Signals that could happen on the next bar.
This is achieved by adding and subtracting the average daily range to the current bars close while also forecasting the next values of moving averages, vwaps, risk multiples and the relative strength line to see if a Danger Signal would trigger.
User Customization: Flexibility is at your fingertips with toggle options for each danger signal. Tailor the indicator to match your unique trading style and risk tolerance. No two traders are the same, that is why each signal is able to be turned on or off to match your trading personality.
Versatile Application: Ideal for growth stock traders, momentum swing traders, and adherents of the CANSLIM methodology. Whether you're a novice or a seasoned investor, this tool aligns with strategies influenced by trading giants.
Validation and Utility:
Inspired by the trade management principles of Michael Lamothe, the " Danger Signals " indicator is more than just a tool; it's a reflection of tested strategies that highlight the importance of risk management. Through rigorous validation, including the insights from "The Trading Mindwheel," this indicator helps traders navigate the complexities of the market with an informed, strategic approach.
Whether you're contemplating a new position or evaluating an existing one, the " Danger Signals " indicator is designed to provide the clarity needed to avoid potential pitfalls and capitalize on opportunities with confidence. Embrace a smarter way to trade, where awareness and preparation open the door to success.
Let's dive into each of the components of this indicator.
Volume: Volume refers to the number of shares or contracts traded in a security or an entire market during a given period. It is a measure of the total trading activity and liquidity, indicating the overall interest in a stock or market.
Price Action: the analysis of historical prices to inform trading decisions, without the use of technical indicators. It focuses on the movement of prices to identify patterns, trends, and potential reversal points in the market.
Relative Strength Line: The RS line is a popular tool used to compare the performance of a stock, typically calculated as the ratio of the stock's price to a benchmark index's price. It helps identify outperformers and underperformers relative to the market or a specific sector. The RS value is calculated by dividing the close price of the chosen stock by the close price of the comparative symbol (SPX by default).
Average True Range (ATR): ATR is a market volatility indicator used to show the average range prices swing over a specified period. It is calculated by taking the moving average of the true ranges of a stock for a specific period. The true range for a period is the greatest of the following three values:
The difference between the current high and the current low.
The absolute value of the current high minus the previous close.
The absolute value of the current low minus the previous close.
Average Daily Range (ADR): ADR is a measure used in trading to capture the average range between the high and low prices of an asset over a specified number of past trading days. Unlike the Average True Range (ATR), which accounts for gaps in the price from one day to the next, the Average Daily Range focuses solely on the trading range within each day and averages it out.
Anchored VWAP: AVWAP gives the average price of an asset, weighted by volume, starting from a specific anchor point. This provides traders with a dynamic average price considering both price and volume from a specific start point, offering insights into the market's direction and potential support or resistance levels.
Moving Averages: Moving Averages smooth out price data by creating a constantly updated average price over a specific period of time. It helps traders identify trends by flattening out the fluctuations in price data.
Stochastic: A stochastic oscillator is a momentum indicator used in technical analysis that compares a particular closing price of an asset to a range of its prices over a certain period of time. The theory behind the stochastic oscillator is that in a market trending upwards, prices will tend to close near their high, and in a market trending downwards, prices close near their low.
While each of these components offer unique insights into market behavior, providing sell signals under specific conditions, the power of combining these different signals lies in their ability to confirm each other's signals. This in turn reduces false positives and provides a more reliable basis for trading decisions
These signals can be recognized at any time, however the indicators power is in it's ability to take into account where a trade is in terms of your entry price and stop.
If a trade just started, it hasn’t earned much leeway. Kind of like a new employee that shows up late on the first day of work. It’s less forgivable than say the person who has been there for a while, has done well, is on time, and then one day comes in late.
Contextual Sensitivity:
For instance, a high volume sell-off coupled with a bearish price action pattern significantly strengthens the sell signal. When the price closes below an Anchored VWAP or a critical moving average in this context, it reaffirms the bearish sentiment, suggesting that the momentum is likely to continue downwards.
By considering the relative strength line (RS) alongside volume and price action, the indicator can differentiate between a normal retracement in a strong uptrend and a when a stock starts to become a laggard.
The integration of ATR and ADR provides a dynamic framework that adjusts to the market's volatility. A sudden increase in ATR or a character change detected through comparing short-term and long-term ADR can alert traders to emerging trends or reversals.
The "Danger Signals" indicator exemplifies the power of integrating diverse technical indicators to create a more sophisticated, responsive, and adaptable trading tool. This approach not only amplifies the individual strengths of each indicator but also mitigates their weaknesses.
Portfolio Heat Indicator can be found by clicking on the image below
Danger Signals Included
Price Closes Near Low - Daily Closing Range of 30% or Less
Price Closes Near Weekly Low - Weekly Closing Range of 30% or Less
Price Closes Near Daily Low on Heavy Volume - Daily Closing Range of 30% or Less on Heaviest Volume of the Last 5 Days
Price Closes Near Weekly Low on Heavy Volume - Weekly Closing Range of 30% or Less on Heaviest Volume of the Last 5 Weeks
Price Closes Below Moving Average - Price Closes Below One of 5 Selected Moving Averages
Price Closes Below Swing Low - Price Closes Below Most Recent Swing Low
Price Closes Below 1.5 ATR - Price Closes Below Trailing ATR Stop Based on Highest High of Last 10 Days
Price Closes Below AVWAP - Price Closes Below Selected Anchored VWAP (Anchors include: High of base, Low of base, Highest volume of base, Custom date)
Price Shows Aggressive Selling - Current Bars High is Greater Than Previous Day's High and Closes Near the Lows on Heaviest Volume of the Last 5 Days
Outside Reversal Bar - Price Makes a New High and Closes Near the Lows, Lower Than the Previous Bar's Low
Price Shows Signs of Stalling - Heavy Volume with a Close of Less than 1%
3 Consecutive Days of Lower Lows - 3 Days of Lower Lows
Close Lower than 3 Previous Lows - Close is Less than 3 Previous Lows
Character Change - ADR of Last Shorter Length is Larger than ADR of Longer Length
Fast Stochastic Crosses Below Slow Stochastic - Fast Stochastic Crosses Below Slow Stochastic
Fast & Slow Stochastic Curved Down - Both Stochastic Lines Close Lower than Previous Day for 2 Consecutive Days
Lower Lows & Lower Highs Intraday - Lower High and Lower Low on 30 Minute Timeframe
Moving Average Crossunder - Selected MA Crosses Below Other Selected MA
RS Starts Curving Down - Relative Strength Line Closes Lower than Previous Day for 2 Consecutive Days
RS Turns Negative Short Term - RS Closes Below RS of 7 Days Ago
RS Underperforms Price - Relative Strength Line Not at Highs, While Price Is
Moving Average Begins to Flatten Out - First Day MA Doesn't Close Higher
Price Moves Higher on Lighter Volume - Price Makes a New High on Light Volume and 15 Day Average Volume is Less than 50 Day Average
Price Hits % Target - Price Moves Set % Higher from Entry Price
Price Hits R Multiple - Price hits (Entry - Stop Multiplied by Setting) and Added to Entry
Price Hits Overhead Resistance - Price Crosses a Swing High from a Monthly Timeframe Chart from at Least 1 Year Ago
Price Hits Fib Level - Price Crosses a Fib Extension Drawn From Base High to Low
Price Hits a Psychological Level - Price Crosses a Multiple of 0 or 5
Heavy Volume After Significant Move - Above Average and Heaviest Volume of the Last 5 Days 35 Bars or More from Breakout
Moving Averages Begin to Slope Downward - Moving Averages Fall for 2 Consecutive Days
Blow Off Action - Highest Volume, Largest Spread, Multiple Gaps in a Row 35 Bars or More Post Breakout
Late Buying Frenzy - ANTS 35 Bars or More Post Breakout
Exhaustion Gap - Gap Up 5% or Higher with Price 125% or More Above 200sma
