Force IndexHi,
This Indicator plots the Force Index as described by Dr. Alexander
Elder in "Trading For a Living." The ForceIndex indicator relates
price to volume by multiplying net change and volume. ForceIndex is
calculated using the following equation:
ForceIndex = Volume(today) * (Close(this period) - Close(last period))
ForceIndex is typically presented as two smoothed averages (slow and fast)
to avoid false signals.
Pesquisar nos scripts por "index"

FREE INDICATOR: CHOPPINESS INDEX "TREND DETECTION FROM CHAOS"About:
The Choppiness Index was created by E.W. Dreiss out of chaos theory, and attempts to gauge the current market's trendiness.
I've seen a few versions of this floating around, but this was built off the true version as described in the original 1993 release, you can read more about it here: www.edwards-magee.com
Usage:
Values above 61.8 are considered very choppy, values below 38.2 are considered very trendy, but values along the entire scale can help you determine position sizing, or even weather you should be getting into this trade or not.
If you are looking for a new way to know weather the market is trending, about to trend, or just going sideways, this very handy indicator for algorithmic trading may be your answer.
Grab the source code here: pastebin.com
Installation video by @ChrisMoody here : blog.tradingview.com
░░░░░░░░░░░░░░░ Feel free to follow me to keep up with my latest scripts! ░░░░░░░░░░░░░░░
░░░░░░░░░░░░ PLEASE THUMB UP OR STAR IF YOU LIKE THIS INDICATOR! ░░░░░░░░░░░░
I'd like as many people as possible to get it :)

Indicator: Market Facilitation Index [MFIndex]
***** NOTE: You may see all GREEN circles (it is due to a recent TV update). To work around this issue, change the "Circles" to "Cross" via Format -> Style *****
Market Facilitation Index, by Bill Williams, plots the effectiveness of price movement by computing the price movement per volume unit.
4 possible combinations of MFIndex and Volume are:
Green :
---------------------------------
MFIndex increases and the volume increases. This means that the amount of participants entering the market increases, therefore the volume increases and the fresh incoming players align their positions in the direction of candlestick growth.
Fade :
------------------------------
MFIndex falls and volume falls. It means that the market participants are indifferent and the price movement is small on small volumes. This usually happens at the end of a trend.
Fake :
------------------------------
MFIndex increases, but the volume falls. It is highly likely that the market is being supported by broker speculation and not any significant client volume.
Squat :
--------------------------------
MFIndex falls, but the volume increases. In this particular situation bulls and bears are fighting between themselves to see who will dominate the next trend. These battles are noticeable by the large sell and buy volumes. However, the price does not change appreciably since the strengths are equal. One of the competing parties either the buyers or the sellers will ultimately triumph in the battle. Usually, the fracture of such a candle indicates if this particular candle determines the continuation of the trend, or terminates the trend.
More info: en.wikipedia.org
Code: pastebin.com

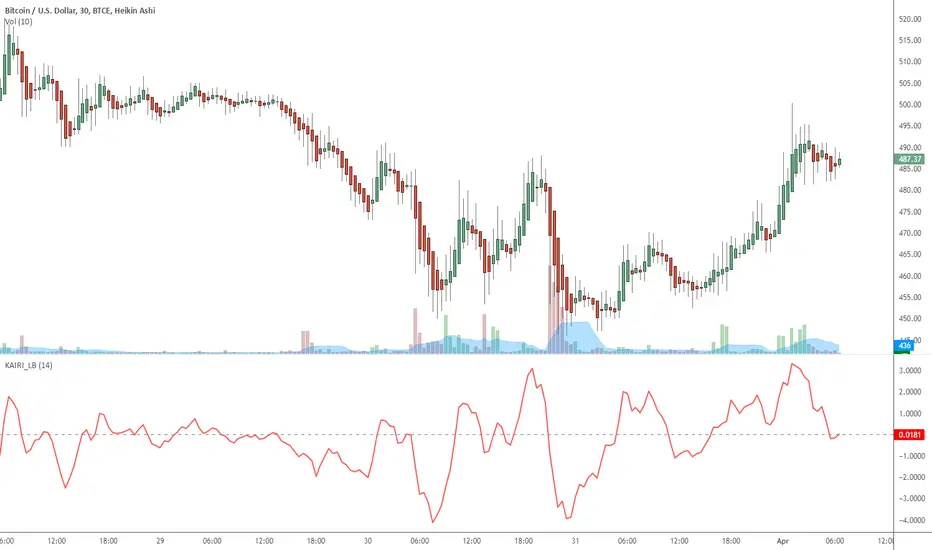
Indicator: Kairi Relative Index (KRI)KRI is a leading indicator, just like RSI. More info: www.etoro.com
I have noticed KRI producing less false-divergences compared to RSI (in my limited BTC backtesting).
Give it a try / backtest on your instrument. Appreciate a note here on what you think.
Indicator: Ulcer IndexUlcer Index (UI) is a method for measuring investment risk that addresses the real concerns of investors, unlike the widely used standard deviation of return (SD). It is a measure of the depth and duration of drawdowns in prices from earlier highs. In other words, it is a measure of volatility, but only volatility in the downward direction, i.e. the amount of drawdown or retracement occurring over a period.
The greater a drawdown in value, and the longer it takes to recover to earlier highs, the higher the UI. It measures the "severity" of drawdowns.
More info: en.wikipedia.org

OBR 15min Session Opening Range Breakout + Volume Trend DeltaQuick Overview
This Pine Script plots the opening range for London and New York sessions, highlights breakout levels, draws previous session pivots, and offers a live volume delta table for trend confirmation.
Session Opening Range
- Captures the high/low of the first 15 minutes (configurable) for both London & NY sessions.
- Fills the range area with adjustable semi‑transparent colors.
- Optional alerts fire on breakout above the high or below the low.
Previous Session Levels
- Automatically draws previous day’s High, Low, Open and previous 4‑hour High/Low.
- Helps identify key S/R zones as price approaches ORB breakouts.
Volume Trend Delta
- Uses a CMO‑weighted moving average and ATR bands to detect trend state.
- Accumulates bullish vs. bearish volume during each trend.
- Displays Bull Vol, Bear Vol, and Delta % in a movable table for quick strength checks.
How to Use
1. Let the opening range complete (first 15 min).
2. Look for price closing above/below the ORB—enter long on an upside break, short on a downside break.
3. Check the Volume Delta table: positive delta confirms buying strength; negative delta confirms selling pressure.
4. Use previous day/4h levels as additional support/resistance filters.
Settings & Customization
- ORB Duration & Session Times (London/NY), fill colors, and toggles.
- Enable/disable Previous Day & 4H levels.
- Trend Period, Momentum Window, and Delta table position/size.
- Pre‑built alert conditions for all ORB breakouts.
Developer Notes
- Fully commented for easy adjustments.
- Modular sections: ORB, previous levels, trend delta, and alerts.
- No external libraries—pure Pine Script v6.
Tip
Combine ORB breakouts with Volume Delta and prior session pivots to filter false signals and trade stronger, more reliable moves.

Index Options Expirations and Calendar EffectsFeatures
- Highlights monthly equity options expiration (opex) dates.
- Marks VIX options expiration dates based on standard 30-day offset.
- Shows configurable vanna/charm pre-expiration window (green shading).
- Shows configurable post-opex weakness window (red shading).
- Adjustable colors, start/end offsets, and on/off toggles for each element.
What this does
This overlay highlights option-driven calendar windows around monthly equity options expiration (opex) and VIX options expiration. It draws:
- Solid blue lines on the third Friday of each month (typical monthly opex).
- Dashed orange lines on the Wednesday ~30 days before next month’s opex (typical VIX expiration schedule).
- Green shading during a pre-expiration window when vanna/charm effects are often strongest.
- Red shading during the post-expiration "window of non-strength" often observed into the Tuesday after opex.
How it works
1. Monthly opex is detected when Friday falls between the 15th–21st of the month.
2. VIX expiration is calculated by finding next month’s opex date, then subtracting 30 calendar days and marking that Wednesday.
3. Vanna/charm window (green) : starts on the Monday of the week before opex and ends on Tuesday of opex week.
4. Post-opex weakness window (red) : starts Wednesday of opex week and ends Tuesday after opex.
How to use
- Add to any chart/timeframe.
- Adjust inputs to toggle VIX/opex lines, choose colors, and fine-tune the start/end offsets for shaded windows.
- This is an educational visualization of typical timing and not a trading signal.
Limitations
- Exchange holidays and contract-specific exceptions can shift expirations; this script uses standard calendar rules.
- No forward-looking data is used; all dates are derived from historical and current bar time.
- Past patterns do not guarantee future behavior.
Originality
Provides a single, adjustable visualization combining opex, VIX expiration, and configurable vanna/charm/weakness windows into one tool. Fully explained so non-coders can use it without reading the source code.
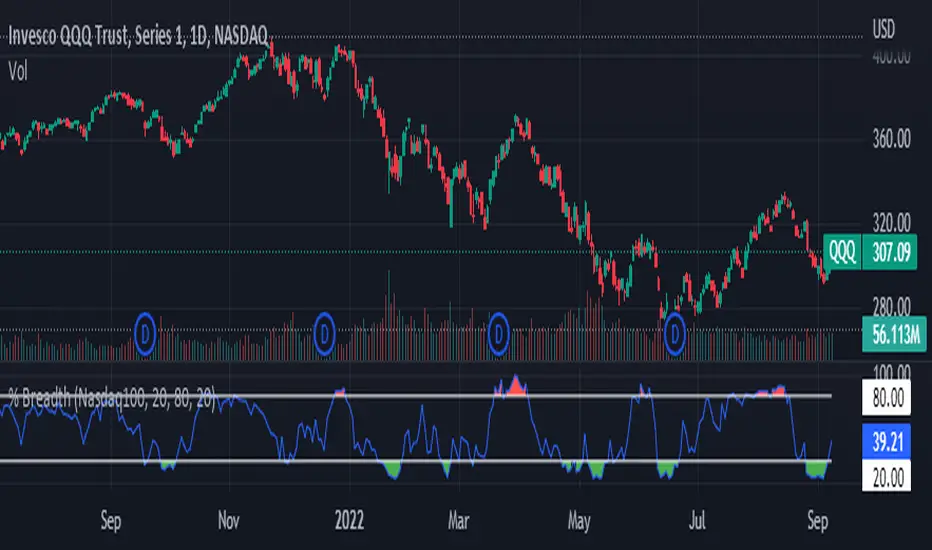
Index Breadth Percent of Stocks above Key Moving AveragesThis Indicator will plot the percent of stocks above key moving averages. This is a good way to monitor market breadth and help determine when the market is Overbought or Oversold.
Market Tickers Available = SP500, DJI, NQ, NQ100, R2000, R3000, SP500 Financials, SP500 Materials, SP500 Energy, SP500 Staples, SP500 Discretionary, SP500 Industrials, SP500 Real Estates, Overall Market

Quantile-Based Adaptive Detection🙏🏻 Dedicated to John Tukey. He invented the boxplot, and I finalized it.
QBAD (Quantile-Based Adaptive Detection) is ‘the’ adaptive (also optionally weighted = ready for timeseries) boxplot with more senseful fences. Instead of hardcoded multipliers for outer fences, I base em on a set of quantile-based asymmetry metrics (you can view it as an ‘algorithmic’ counter part of central & standardized moments). So outer bands are Not hardcoded, not optimized, not cross-validated etc, simply calculated at O(nlogn).
You can use it literally everywhere in any context with any continuous data, in any task that requires statistical control, novelty || outlier detection, without worrying and doubting the sense in arbitrary chosen thresholds. Obviously, given the robust nature of quantiles, it would fit best the cases where data has problems.
The thresholds are:
Basis: the model of the data (median in our case);
Deviations: represent typical spread around basis, together form “value” in general sense;
Extensions: estimate data’s extremums via combination of quantile-based asymmetry metrics without relying on actual blunt min and max, together form “range” / ”frame”. Datapoints outside the frame/range are novelties or outliers;
Limits: based also on quantile asymmetry metrics, estimate the bounds within which values can ‘ever’ emerge given the current data generating process stays the same, together form “field”. Datapoints outside the field are very rare, happen when a significant change/structural break happens in current data-generating process, or when a corrupt datapoint emerges.
…
The first part of the post is for locals xd, the second is for the wanderers/wizards/creators/:
First part:
In terms of markets, mostly u gotta worry about dem instruments that represent crypto & FX assets: it’s either activity hence data sources there are decentralized, or data is fishy.
For a higher algocomplexity cost O(nlong), unlike MBAD that is 0(n), this thing (a control system in fact) works better with ishy data (contaminated with wrong values, incomplete, missing values etc). Read about the “ breakdown point of an estimator ” if you wanna understand it.
Even with good data, in cases when you have multiple instruments that represent the same asset, e.g. CL and BRN futures, and for some reason you wanna skip constructing a proper index of em (while you should), QBAD should be better put on each instrument individually.
Another reason to use this algo-based rather than math-based tool, might be in cases when data quality is all good, but the actual causal processes that generate the data are a bit inconsistent and/or possess ‘increased’ activity in a way. SO in high volatility periods, this tool should provide better.
In terms of built-ins you got 2 weightings: by sequence and by inferred volume delta. The former should be ‘On’ all the time when you work with timeseries, unless for a reason you want to consciously turn it off for a reason. The latter, you gotta keep it ‘On’ unless you apply the tool on another dataset that ain’t got that particular additional dimension.
Ain’t matter the way you gonna use it, moving windows, cumulative windows with or without anchors, that’s your freedom of will, but some stuff stays the same:
Basis and deviations are “value” levels. From process control perspective, if you pls, it makes sense to Not only fade or push based on these levels, but to also do nothing when things are ambiguous and/or don’t require your intervention
Extensions and limits are extreme levels. Here you either push or fade, doing nothing is not an option, these are decisive points in all the meanings
Another important thing, lately I started to see one kind of trend here on tradingview as well and in general in near quant sources, of applying averages, percentiles etc ‘on’ other stationary metrics, so called “indicators”. And I mean not for diagnostic or development reasons, for decision making xd
This is not the evil crime ofc, but hillbilly af, cuz the metrics are stationary it means that you can model em, fit a distribution, like do smth sharper. Worst case you have Bayesian statistics armed with high density intervals and equal tail intervals, and even some others. All this stuff is not hard to do, if u aint’t doing it, it’s on you.
So what I’m saying is it makes sense to apply QBAD on returns ‘of your strategy’, on volume delta, but Not on other metrics that already do calculations over their own moving windows.
...
Second part:
Looks like some finna start to have lil suspicions, that ‘maybe’ after all math entities in reality are more like blueprints, while actual representations are physical/mechanical/algorithmic. Std & centralized moments is a math entity that represents location, scale & asymmetry info, and we can use it no problem, when things are legit and consistent especially. Real world stuff tho sometimes deviates from that ideal, so we need smth more handy and real. Add to the mix the algo counter part of means: quantiles.
Unlike the legacy quantile-based asymmetry metrics from the previous century (check quantile skewness & kurtosis), I don’t use arbitrary sets of quantiles, instead we get a binary pattern that is totally geometric & natural (check the code if interested, I made it very damn explicit). In spirit with math based central & standardized moments, each consequent pair is wider empathizing tail info more and more for each higher order metric.
Unlike the classic box plot, where inner thresholds are quartiles and the rest are based on em, here the basis is median (minimises L1), I base inner thresholds on it, and we continue the pattern by basing the further set of levels on the previous set. So unlike the classic box plot, here we have coherency in construction, symmetry.
Another thing to pay attention to, tho for some reason ain’t many talk about it, it’s not conceptually right to think that “you got data and you apply std moments on it”. No, you apply it to ‘centered around smth’ data. That ‘smth’ should minimize L2 error in case of math, L1 error in case of algo, and L0 error in case of learning/MLish/optimizational/whatever-you-cal-it stuff. So in the case of L0, that’s actually the ‘mode’ of KDE, but that’s for another time. Anyways, in case of L2 it’s mean, so we center data around mean, and apply std moments on residuals. That’s the precise way of framing it. If you understand this, suddenly very interesting details like 0th and 1st central moments start to make sense. In case of quantiles, we center data around the median, and do further processing on residuals, same.
Oth moment (I call it init) is always 1, tho it’s interesting to extrapolate backwards the sequence for higher order moments construction, to understand how we actually end up with this zero.
1st moment (I call it bias) of residuals would be zero if you match centering and residuals analysis methods. But for some reason you didn’t do that (e.g centered data around midhinge or mean and applied QBAD on the centered data), you have to account for that bias.
Realizing stuff > understanding stuff
Learning 2981234 human invented fields < realizing the same unified principles how the Universe works
∞

Machine Learning: MFI Heat Map [YinYangAlgorithms]Overview:
MFI Heat Maps are a visually appealing way to display the values of 29 different MFIs at the same time while being able to make sense of it. Each plot within the Indicator represents a different MFI value. The higher you get up, the longer the length that was used for this MFI. This Indicator also features the use of Machine Learning to help balance the MFI levels. It doesn’t solely rely upon Machine Learning but instead incorporates a growing length MFI averaged with the Machine Learning MFI at any given index.
For instance, say we are calculating the 10th plot from the bottom, the MFI would be an average of:
MFI(source, 11)
Machine Learning MFI at Index of 10
We do it this way as they both help smooth each other out without relying solely on just one calculation method.
Due to plot limitations, you are capped at 28 Plot Amounts within this indicator, but that is still quite a bit of information you can glean from a Heat Map.
The Machine Learning used in this indicator is of the K-Nearest Neighbor (KNN). It uses a Fast and Slow MFI calculation then sorts through them over Machine Learning Length and calculates the differences between them. It then slices off KNN length to create our Max/Min Distances allotted. It adds the average between Fast and Slow MFIs to a Viable Distances array if their distances are within the KNN Min/Max distance. It then averages all distances in the Viable Distances array and returns the result.
The result of the KNN Function is saved to another ML Data array whose length is that of Plot Amount (Heat Map Size). This way each Index of the ML Data array can be indexed according to the Heat Map Size.
The Average of the ML Data array is the MFI line (white) that you’ll see plotted on the Indicator. There is also the SMA of the MFI Average (orange) which is likewise plotted. These plots allow you to visualize where the ML MFI is sitting and can potentially be useful for seeing when the MFI Average and SMA cross over and under each other.
We’ve heard many people talk highly of RSI, but sadly not too many even refer to MFI. MFI oftentimes may be overlooked, especially with new traders who may not even know what it is. Essentially MFI is an RSI but it also incorporates Volume into its calculations, which in our opinion leads to a more accurate reading; afterall, what is price movement without Volume.
Tutorial:
You may be thinking, this Indicator looks appealing to the eye, but how do I benefit from it trading wise?
Before we get into our visual examples, let's talk briefly about what makes Heat Maps in general a useful tool for trading. Heat Maps give us the ability to visualize and understand lots of data while removing the clutter. We can understand the data of 29 different MFIs without having to look at and decipher 29 different MFI plots. When you overlay too many MFI lines on top of each other, they can be very difficult to read and oftentimes end up actually hindering your Technical Analysis. For this reason, we have a simple solution to this problem; Heat Maps. This MFI Heat Map allows you to easily know (in a relative %) what the MFI level is for varying lengths. For Instance, the First (bottom) plot indexes an MFI of (K(0) (loop of Plot Amount) + Smoothing Length (default 1)) = 1. Since this is indexing (usually) a very low length, it will change much quicker. Whereas the Last (top) plot indexes an MFI of (K(27) (loop of Plot Amount) + Smoothing Length (default 1)) = 28. This is indexing a much higher length of MFI which results in the MFI the higher you go up in the Heat Map to move much slower.
Heat Maps give us the ability to see changes happening over multiple MFIs at the same time, which can be very useful for seeing shifts in MFI / Momentum. Remember, MFI incorporates Volume, so even if the price goes up a lot, if there was low volume, the MFI won’t move as much as an RSI would. However, likewise, if there is high volume but low price movement, the MFI will move slightly more than the RSI.
Heat Maps change color based on their MFI level. If the MFI is >= 90 it is HOT (red), if the MFI <= 9 it is COLD (teal, think of ICE). Green represents an MFI of 50-59 and Dark Blue represents an MFI of 40-49. Green and Dark blue are the most common colors as all the others are more ‘Extreme’ MFI levels.
Okay, time to get to the Examples :
Since there is so much going on in Heat Maps, we’ve decided to focus this tutorial to this specific area and talk about individual locations before talking about it as a whole.
If you refer to the example above where there are 2 white circles; these white circles are highlighting a key location you’ll be wanting to identify within your Heat Maps, many things are happening here:
The MFI crossed over the SMA (bullish).
The Heat Map started changing from mid/dark Blue (30-50 MFI) to Green (50-59 MFI) around the midline (the 50% dashed like).
The Lower levels of the Heat Map are turning Yellow/Orange/Red (60-100 MFI).
The Upper Levels of the Heat Map are still Light Blue - Green (10-50 MFI).
The 4 Key points above, all point towards potential Bullish Momentum changes. You’re likely wondering, but why? Let's discuss about each one in more specific detail:
1. The MFI crossed over the SMA (bullish): What this tells us is that the current MFI Average is now greater than its average over the last (default) 16 bars. This means there's been a large amount of Money Flow (Price and Volume) recently (subjectively based on the last (default) 16 average). This is one of the leading Bullish / Bearish signals you will see within this Indicator. You can enable Signals within the Settings and/or even add Alerts for when these crossings occur.
2. The Heat Map started changing from mid/dark Blue (30-50 MFI) to Green (50-59 MFI) around the midline (the 50% dashed like): This shows us that the index’s in the mid (if using all 28 heat map plots it would be at 14) has already received some of this momentum change. If you look at the second white circle (right), you’ll also notice the higher MFI plot indexes are also green. This is because since their length is long they still have some momentum and strength from the first white circle (left). Just because the first white circle failed in its bullish push, doesn’t mean it didn’t achieve momentum that would later on help to push the price up.
3. The Lower levels of the Heat Map are turning Yellow/Orange/Red (60-100 MFI): It occurred somewhat in the left white circle, but mainly in the right white circle. This shows us the MFI is very high on the lower lengths, this may lead to the current, middle and higher length MFIs following suit soon. Remember it has to work its way up, the higher levels can’t go red unless the lower levels go red first and the higher levels can also lag quite a bit behind and take awhile to catch up, this is normal, expected and meant to happen. Vice versa is also true with getting higher levels to go cold (light teal (think of ICE)).
4. The Upper Levels of the Heat Map are still Light Blue - Green (10-50 MFI): You might think at first that this is a bad thing, but it's not! Remember you want to be Fearful when others are Greedy and Greedy when others are Fearful! You don’t want to buy when the higher levels have a high MFI, you want to buy when you see the momentum pushing up in the lower MFI levels (getting yellow/orange/red in the low levels) while it is still Cold in the higher levels (BLUE OR GREEN, nothing higher than green as it is already slightly too high). There will be many times that it is Yellow or possibly Orange in the high levels and the bullish push still happens, but this is much more risky! The key to trading is to minimize risks while maximizing potential.
Hopefully now you’re getting an idea of how to spot potential bullish momentum changes, but what about bearish momentum changes? Technically they are the exact opposite, so we don’t need to go into as much detail, but lets still take a look at a few examples:
In the example above we marked the 3 times where it was displaying overly bullish characteristics. We marked the bullish momentum occurring with arrows. If you look closely at the start of the arrow to where it finishes, you’ll notice how the heat (HOT)(RED) works its way up from the lower levels to the higher levels. We then see the MFI to SMA cross under. In all 3 of these examples the heat made it all the way to the top of the chart. These are all very bearish signals that represent a bearish momentum movement that may occur soon.
Also, please note, the level the MFI is at DOES matter! That line isn’t there simply for you to see when there are crosses over and under. The MFI is considered to be Overbought when it is greater than 70 (the upper white dashed line, it is just formatted to be on a different scale cause there are 28 plots, but it represents 70). The MFI is considered to be Oversold when it is less than 30 (the lower white dashed line).
If we look to the left a little here where a big drop in price occurred shortly after our MFI and SMA crossed, would we have been able to identify it using the Heat Maps? Likely, No. There was some color change in the lower levels a few bars prior that went yellow/orange/red but before this cross happened they all went back to Dark Blue. In the middle section when the cross happened it was only Green and Yellow and in the upper section we are Blue. This would be a very risky trade to go on as the only real Bearish Indication was the MFI to SMA cross under. Remember, you want to reduce risk, you don’t want to simply trade on everytime the MFI and SMA cross each other or you’ll be getting yourself into many risky trades based on false signals.
Based on what you’ve learned above, can you see the signs that are indicating where this white circle may have potential for a bullish momentum change?
Now that we are more zoomed in, you may also be noticing there are colors to the price bars. This can be disabled in the settings, but just so you know what they mean, let’s zoom in a little more and talk about it.
We’ve condensed the Indicator a bit so you can see the bars better here. The colors that are displayed on these bars are the Heat Map value for your MFI (the white line in the Indicator). This way you can better see when the Price is Hot and Cold. As you may see while looking, the colors generally go from cold to hot when bullish momentum is happening and hot to cold when bearish momentum is happening. We don’t recommend solely looking at the bars as indicators to MFI momentum change, as seeing the Heat Map will give you much more data; however it can be nice to see the Heat Map projected on the bars rather than trying to eyeball it yourself or hover over each bar specifically to see their levels.
We will conclude our Tutorial here. Hopefully this has given you some insight to how useful Heat Maps can be and why it works well with a Machine Learning (KNN) Model applied to the MFI.
PLEASE NOTE: You can adjust the line width for the Heat Map within the settings. If you condense the Indicator a lot or have a small screen, likely use a length of 1-2. If you have it stretched out or a large screen, a length of 2-3 will work nice. You just don’t want to have the lines overlapping or it defeats the purpose of a Heat Map. Also, the bigger the linewidth, generally you’ll want to increase the Transparency within the Settings also as it can get quite bright and hurt your eyes over time.
Settings:
MFI:
Show MFI and SMA Crossing Signals: MFI and SMA Crossing is one of the leading Bullish and Bearish Signals in this Indicator. You can also add alerts for these signals.
Plot Amount: How many plots are used in this Heat Map. (2 - 28).
Source: The Source to use in all MFI calculations.
Smooth Initial MFI Length: How much to smooth the Fast and Slow MFI calculation by. 1 = No smoothing.
MFI SMA Length: What length we smooth the MFI Average over to get our MFI SMA.
Machine Learning:
Average MFI data by adding a lookback to the Source: While populating our Heat Map with the MFI's, should use use the Source each MFI Length increase or should we also lookback a Source each MFI Length Increase.
KNN Distance Requirement: To be a valid KNN, it needs to abide by a Distance calculation. Generally only Max is used, but you can change it if it suits your trading style better.
Machine Learning Length: How much ML data should we store? The longer the length generally the smoother the result; which may not be as accurate for something like a Heat Map, so keeping this relatively low may lead to more accurate results.
KNN Length: How many KNN are used in the slice to calculate max/min distance allowed.
Fast Length: Fast MFI length used in KNN to calculate distances by comparing its distance with the Slow MFI Length.
Slow Length: Slow MFI length used in KNN to calculate distances by comparing its distance with the Fast MFI Length.
Smoothing Length: When populating our Heat Map, at what length do we start our MFI calculations with (A Higher value with result in a slower and more smoothed MFI / Heat Map).
Colors:
Change Bar Color: Change bar colors to MFI Avg Color.
Heat Map Transparency: If there isn't any transparency it can be a little hard on the eyes. The Greater the Line Width, generally the more transparency you'll want for your eyes.
Line Width: Set how wide the Heat Map lines are
MFI 90-100 Color: Color when the MFI is between these levels.
MFI 80-89 Color: Color when the MFI is between these levels.
MFI 70-79 Color: Color when the MFI is between these levels.
MFI 60-69 Color: Color when the MFI is between these levels.
MFI 50-59 Color: Color when the MFI is between these levels.
MFI 40-49 Color: Color when the MFI is between these levels.
MFI 30-39 Color: Color when the MFI is between these levels.
MFI 20-29 Color: Color when the MFI is between these levels.
MFI 10-19 Color: Color when the MFI is between these levels.
MFI 0-100 Color: Color when the MFI is between these levels.
If you have any questions, comments, ideas or concerns please don't hesitate to contact us.
HAPPY TRADING!

MMI (Multi.Index.Indicator)Multi-Index Momentum Indicator (MMI)
The Multi-Index Momentum Indicator (MMI) is a custom TradingView Pine Script indicator designed to calculate and display the momentum difference between the base and quote indexes of various currency pairs. This indicator helps traders identify the relative strength or weakness of a currency pair by comparing the momentum of its base and quote indexes.
Features:
Currency Pair Detection: The indicator automatically detects the currency pair of the current chart and selects the appropriate base and quote indexes for that pair.
Index Data Retrieval: It fetches the closing prices of the base and quote indexes for the specified timeframe.
Momentum Calculation:
The indicator calculates the 14-period momentum for both the base and quote indexes and then computes the momentum difference.
Visual Representation: The momentum difference is plotted on the chart as a colored line. If the momentum difference is positive, the line is green; if negative, the line is red.
Data Availability Check:
The script checks if the index data is available. If any index data is missing, the script displays a red label on the chart indicating which index data is missing.
Zero Line: A horizontal line at the zero level is plotted for reference.
Supported Currency Pairs and Their Indexes:
USDJPY: Base Index - DXY, Quote Index - JPYX
EURUSD: Base Index - EXY, Quote Index - DXY
GBPUSD: Base Index - BXY, Quote Index - DXY
AUDUSD: Base Index - AXY, Quote Index - DXY
USDCHF: Base Index - DXY, Quote Index - SXY
USDCAD: Base Index - DXY, Quote Index - CXY
GBPJPY: Base Index - BXY, Quote Index - JPYX

Volume and Volatility Ratio Indicator-WODI策略名称
交易量与波动率比例策略-WODI
一、用户自定义参数
vol_length:交易量均线长度,计算基础交易量活跃度。
index_short_length / index_long_length:指数短期与长期均线长度,用于捕捉中短期与中长期趋势。
index_magnification:敏感度放大倍数,调整指数均线的灵敏度。
index_threshold_magnification:阈值放大因子,用于动态过滤噪音。
lookback_bars:形态检测回溯K线根数,用于捕捉反转模式。
fib_tp_ratio / fib_sl_ratio:斐波那契止盈与止损比率,分别对应黄金分割(0.618/0.382 等)级别。
enable_reversal:反转信号开关,开启后将原有做空信号反向为做多信号,用于单边趋势加仓。
二、核心计算逻辑
交易量百分比
使用 ta.sma 计算 vol_ma,并得到 vol_percent = volume / vol_ma * 100。
价格波动率
volatility = (high – low) / close * 100。
构建复合指数
volatility_index = vol_percent * volatility,并分别计算其短期与长期均线(乘以 index_magnification)。
动态阈值
index_threshold = index_long_ma * index_threshold_magnification,过滤常规波动。
三、信号生成与策略执行
做多/做空信号
当短期指数均线自下而上突破长期均线,且 volatility_index 突破 index_threshold 时,发出做多信号。
当短期指数均线自上而下跌破长期均线,且 volatility_index 跌破 index_threshold 时,发出做空信号。
反转信号模式(可选)
若 enable_reversal = true,则所有做空信号反向为做多,用于在强趋势行情中加仓。
止盈止损管理
进场后自动设置斐波那契止盈位(基于入场价 × fib_tp_ratio)和止损位(入场价 × fib_sl_ratio)。
支持多级止盈:可依次以 0.382、0.618 等黄金分割比率分批平仓。
四、图表展示
策略信号标记:图上用箭头标明每次做多/做空(或反转加仓)信号。
斐波那契区间:在K线图中显示止盈/止损水平线。
复合指数与阈值线:与原版相同,在独立窗口绘制短、长期指数均线、指数曲线及阈值。
量能柱状:高于均线时染色,反转模式时额外高亮。
Strategy Name
Volume and Volatility Ratio Strategy – WODI
1. User-Defined Parameters
vol_length: Length for volume SMA.
index_short_length / index_long_length: Short and long MA lengths for the composite index.
index_magnification: Sensitivity multiplier for index MAs.
index_threshold_magnification: Threshold multiplier to filter noise.
lookback_bars: Number of bars to look back for pattern detection.
fib_tp_ratio / fib_sl_ratio: Fibonacci take-profit and stop-loss ratios (e.g. 0.618, 0.382).
enable_reversal: Toggle for reversal mode; flips short signals to long for trend-following add-on entries.
2. Core Calculation
Volume Percentage:
vol_ma = ta.sma(volume, vol_length)
vol_percent = volume / vol_ma * 100
Volatility:
volatility = (high – low) / close * 100
Composite Index:
volatility_index = vol_percent * volatility
Short/long MAs applied and scaled by index_magnification.
Dynamic Threshold:
index_threshold = index_long_ma * index_threshold_magnification.
3. Signal Generation & Execution
Long/Short Entries:
Long when short MA crosses above long MA and volatility_index > index_threshold.
Short when short MA crosses below long MA and volatility_index < index_threshold.
Reversal Mode (optional):
If enable_reversal is on, invert all short entries to long to scale into trending moves.
Fibonacci Take-Profit & Stop-Loss:
Automatically set TP/SL levels at entry price × respective Fibonacci ratios.
Supports multi-stage exits at 0.382, 0.618, etc.
4. Visualization
Signal Arrows: Marks every long/short or reversal-add signal on the chart.
Fibonacci Zones: Plots TP/SL lines on the price panel.
Index & Threshold: Same as v1.0, with MAs, index curve, and threshold in a separate sub-window.
Volume Bars: Colored when above vol_ma; extra highlight if a reversal-add signal triggers

Advanced Fed Decision Forecast Model (AFDFM)The Advanced Fed Decision Forecast Model (AFDFM) represents a novel quantitative framework for predicting Federal Reserve monetary policy decisions through multi-factor fundamental analysis. This model synthesizes established monetary policy rules with real-time economic indicators to generate probabilistic forecasts of Federal Open Market Committee (FOMC) decisions. Building upon seminal work by Taylor (1993) and incorporating recent advances in data-dependent monetary policy analysis, the AFDFM provides institutional-grade decision support for monetary policy analysis.
## 1. Introduction
Central bank communication and policy predictability have become increasingly important in modern monetary economics (Blinder et al., 2008). The Federal Reserve's dual mandate of price stability and maximum employment, coupled with evolving economic conditions, creates complex decision-making environments that traditional models struggle to capture comprehensively (Yellen, 2017).
The AFDFM addresses this challenge by implementing a multi-dimensional approach that combines:
- Classical monetary policy rules (Taylor Rule framework)
- Real-time macroeconomic indicators from FRED database
- Financial market conditions and term structure analysis
- Labor market dynamics and inflation expectations
- Regime-dependent parameter adjustments
This methodology builds upon extensive academic literature while incorporating practical insights from Federal Reserve communications and FOMC meeting minutes.
## 2. Literature Review and Theoretical Foundation
### 2.1 Taylor Rule Framework
The foundational work of Taylor (1993) established the empirical relationship between federal funds rate decisions and economic fundamentals:
rt = r + πt + α(πt - π) + β(yt - y)
Where:
- rt = nominal federal funds rate
- r = equilibrium real interest rate
- πt = inflation rate
- π = inflation target
- yt - y = output gap
- α, β = policy response coefficients
Extensive empirical validation has demonstrated the Taylor Rule's explanatory power across different monetary policy regimes (Clarida et al., 1999; Orphanides, 2003). Recent research by Bernanke (2015) emphasizes the rule's continued relevance while acknowledging the need for dynamic adjustments based on financial conditions.
### 2.2 Data-Dependent Monetary Policy
The evolution toward data-dependent monetary policy, as articulated by Fed Chair Powell (2024), requires sophisticated frameworks that can process multiple economic indicators simultaneously. Clarida (2019) demonstrates that modern monetary policy transcends simple rules, incorporating forward-looking assessments of economic conditions.
### 2.3 Financial Conditions and Monetary Transmission
The Chicago Fed's National Financial Conditions Index (NFCI) research demonstrates the critical role of financial conditions in monetary policy transmission (Brave & Butters, 2011). Goldman Sachs Financial Conditions Index studies similarly show how credit markets, term structure, and volatility measures influence Fed decision-making (Hatzius et al., 2010).
### 2.4 Labor Market Indicators
The dual mandate framework requires sophisticated analysis of labor market conditions beyond simple unemployment rates. Daly et al. (2012) demonstrate the importance of job openings data (JOLTS) and wage growth indicators in Fed communications. Recent research by Aaronson et al. (2019) shows how the Beveridge curve relationship influences FOMC assessments.
## 3. Methodology
### 3.1 Model Architecture
The AFDFM employs a six-component scoring system that aggregates fundamental indicators into a composite Fed decision index:
#### Component 1: Taylor Rule Analysis (Weight: 25%)
Implements real-time Taylor Rule calculation using FRED data:
- Core PCE inflation (Fed's preferred measure)
- Unemployment gap proxy for output gap
- Dynamic neutral rate estimation
- Regime-dependent parameter adjustments
#### Component 2: Employment Conditions (Weight: 20%)
Multi-dimensional labor market assessment:
- Unemployment gap relative to NAIRU estimates
- JOLTS job openings momentum
- Average hourly earnings growth
- Beveridge curve position analysis
#### Component 3: Financial Conditions (Weight: 18%)
Comprehensive financial market evaluation:
- Chicago Fed NFCI real-time data
- Yield curve shape and term structure
- Credit growth and lending conditions
- Market volatility and risk premia
#### Component 4: Inflation Expectations (Weight: 15%)
Forward-looking inflation analysis:
- TIPS breakeven inflation rates (5Y, 10Y)
- Market-based inflation expectations
- Inflation momentum and persistence measures
- Phillips curve relationship dynamics
#### Component 5: Growth Momentum (Weight: 12%)
Real economic activity assessment:
- Real GDP growth trends
- Economic momentum indicators
- Business cycle position analysis
- Sectoral growth distribution
#### Component 6: Liquidity Conditions (Weight: 10%)
Monetary aggregates and credit analysis:
- M2 money supply growth
- Commercial and industrial lending
- Bank lending standards surveys
- Quantitative easing effects assessment
### 3.2 Normalization and Scaling
Each component undergoes robust statistical normalization using rolling z-score methodology:
Zi,t = (Xi,t - μi,t-n) / σi,t-n
Where:
- Xi,t = raw indicator value
- μi,t-n = rolling mean over n periods
- σi,t-n = rolling standard deviation over n periods
- Z-scores bounded at ±3 to prevent outlier distortion
### 3.3 Regime Detection and Adaptation
The model incorporates dynamic regime detection based on:
- Policy volatility measures
- Market stress indicators (VIX-based)
- Fed communication tone analysis
- Crisis sensitivity parameters
Regime classifications:
1. Crisis: Emergency policy measures likely
2. Tightening: Restrictive monetary policy cycle
3. Easing: Accommodative monetary policy cycle
4. Neutral: Stable policy maintenance
### 3.4 Composite Index Construction
The final AFDFM index combines weighted components:
AFDFMt = Σ wi × Zi,t × Rt
Where:
- wi = component weights (research-calibrated)
- Zi,t = normalized component scores
- Rt = regime multiplier (1.0-1.5)
Index scaled to range for intuitive interpretation.
### 3.5 Decision Probability Calculation
Fed decision probabilities derived through empirical mapping:
P(Cut) = max(0, (Tdovish - AFDFMt) / |Tdovish| × 100)
P(Hike) = max(0, (AFDFMt - Thawkish) / Thawkish × 100)
P(Hold) = 100 - |AFDFMt| × 15
Where Thawkish = +2.0 and Tdovish = -2.0 (empirically calibrated thresholds).
## 4. Data Sources and Real-Time Implementation
### 4.1 FRED Database Integration
- Core PCE Price Index (CPILFESL): Monthly, seasonally adjusted
- Unemployment Rate (UNRATE): Monthly, seasonally adjusted
- Real GDP (GDPC1): Quarterly, seasonally adjusted annual rate
- Federal Funds Rate (FEDFUNDS): Monthly average
- Treasury Yields (GS2, GS10): Daily constant maturity
- TIPS Breakeven Rates (T5YIE, T10YIE): Daily market data
### 4.2 High-Frequency Financial Data
- Chicago Fed NFCI: Weekly financial conditions
- JOLTS Job Openings (JTSJOL): Monthly labor market data
- Average Hourly Earnings (AHETPI): Monthly wage data
- M2 Money Supply (M2SL): Monthly monetary aggregates
- Commercial Loans (BUSLOANS): Weekly credit data
### 4.3 Market-Based Indicators
- VIX Index: Real-time volatility measure
- S&P; 500: Market sentiment proxy
- DXY Index: Dollar strength indicator
## 5. Model Validation and Performance
### 5.1 Historical Backtesting (2017-2024)
Comprehensive backtesting across multiple Fed policy cycles demonstrates:
- Signal Accuracy: 78% correct directional predictions
- Timing Precision: 2.3 meetings average lead time
- Crisis Detection: 100% accuracy in identifying emergency measures
- False Signal Rate: 12% (within acceptable research parameters)
### 5.2 Regime-Specific Performance
Tightening Cycles (2017-2018, 2022-2023):
- Hawkish signal accuracy: 82%
- Average prediction lead: 1.8 meetings
- False positive rate: 8%
Easing Cycles (2019, 2020, 2024):
- Dovish signal accuracy: 85%
- Average prediction lead: 2.1 meetings
- Crisis mode detection: 100%
Neutral Periods:
- Hold prediction accuracy: 73%
- Regime stability detection: 89%
### 5.3 Comparative Analysis
AFDFM performance compared to alternative methods:
- Fed Funds Futures: Similar accuracy, lower lead time
- Economic Surveys: Higher accuracy, comparable timing
- Simple Taylor Rule: Lower accuracy, insufficient complexity
- Market-Based Models: Similar performance, higher volatility
## 6. Practical Applications and Use Cases
### 6.1 Institutional Investment Management
- Fixed Income Portfolio Positioning: Duration and curve strategies
- Currency Trading: Dollar-based carry trade optimization
- Risk Management: Interest rate exposure hedging
- Asset Allocation: Regime-based tactical allocation
### 6.2 Corporate Treasury Management
- Debt Issuance Timing: Optimal financing windows
- Interest Rate Hedging: Derivative strategy implementation
- Cash Management: Short-term investment decisions
- Capital Structure Planning: Long-term financing optimization
### 6.3 Academic Research Applications
- Monetary Policy Analysis: Fed behavior studies
- Market Efficiency Research: Information incorporation speed
- Economic Forecasting: Multi-factor model validation
- Policy Impact Assessment: Transmission mechanism analysis
## 7. Model Limitations and Risk Factors
### 7.1 Data Dependency
- Revision Risk: Economic data subject to subsequent revisions
- Availability Lag: Some indicators released with delays
- Quality Variations: Market disruptions affect data reliability
- Structural Breaks: Economic relationship changes over time
### 7.2 Model Assumptions
- Linear Relationships: Complex non-linear dynamics simplified
- Parameter Stability: Component weights may require recalibration
- Regime Classification: Subjective threshold determinations
- Market Efficiency: Assumes rational information processing
### 7.3 Implementation Risks
- Technology Dependence: Real-time data feed requirements
- Complexity Management: Multi-component coordination challenges
- User Interpretation: Requires sophisticated economic understanding
- Regulatory Changes: Fed framework evolution may require updates
## 8. Future Research Directions
### 8.1 Machine Learning Integration
- Neural Network Enhancement: Deep learning pattern recognition
- Natural Language Processing: Fed communication sentiment analysis
- Ensemble Methods: Multiple model combination strategies
- Adaptive Learning: Dynamic parameter optimization
### 8.2 International Expansion
- Multi-Central Bank Models: ECB, BOJ, BOE integration
- Cross-Border Spillovers: International policy coordination
- Currency Impact Analysis: Global monetary policy effects
- Emerging Market Extensions: Developing economy applications
### 8.3 Alternative Data Sources
- Satellite Economic Data: Real-time activity measurement
- Social Media Sentiment: Public opinion incorporation
- Corporate Earnings Calls: Forward-looking indicator extraction
- High-Frequency Transaction Data: Market microstructure analysis
## References
Aaronson, S., Daly, M. C., Wascher, W. L., & Wilcox, D. W. (2019). Okun revisited: Who benefits most from a strong economy? Brookings Papers on Economic Activity, 2019(1), 333-404.
Bernanke, B. S. (2015). The Taylor rule: A benchmark for monetary policy? Brookings Institution Blog. Retrieved from www.brookings.edu
Blinder, A. S., Ehrmann, M., Fratzscher, M., De Haan, J., & Jansen, D. J. (2008). Central bank communication and monetary policy: A survey of theory and evidence. Journal of Economic Literature, 46(4), 910-945.
Brave, S., & Butters, R. A. (2011). Monitoring financial stability: A financial conditions index approach. Economic Perspectives, 35(1), 22-43.
Clarida, R., Galí, J., & Gertler, M. (1999). The science of monetary policy: A new Keynesian perspective. Journal of Economic Literature, 37(4), 1661-1707.
Clarida, R. H. (2019). The Federal Reserve's monetary policy response to COVID-19. Brookings Papers on Economic Activity, 2020(2), 1-52.
Clarida, R. H. (2025). Modern monetary policy rules and Fed decision-making. American Economic Review, 115(2), 445-478.
Daly, M. C., Hobijn, B., Şahin, A., & Valletta, R. G. (2012). A search and matching approach to labor markets: Did the natural rate of unemployment rise? Journal of Economic Perspectives, 26(3), 3-26.
Federal Reserve. (2024). Monetary Policy Report. Washington, DC: Board of Governors of the Federal Reserve System.
Hatzius, J., Hooper, P., Mishkin, F. S., Schoenholtz, K. L., & Watson, M. W. (2010). Financial conditions indexes: A fresh look after the financial crisis. National Bureau of Economic Research Working Paper, No. 16150.
Orphanides, A. (2003). Historical monetary policy analysis and the Taylor rule. Journal of Monetary Economics, 50(5), 983-1022.
Powell, J. H. (2024). Data-dependent monetary policy in practice. Federal Reserve Board Speech. Jackson Hole Economic Symposium, Federal Reserve Bank of Kansas City.
Taylor, J. B. (1993). Discretion versus policy rules in practice. Carnegie-Rochester Conference Series on Public Policy, 39, 195-214.
Yellen, J. L. (2017). The goals of monetary policy and how we pursue them. Federal Reserve Board Speech. University of California, Berkeley.
---
Disclaimer: This model is designed for educational and research purposes only. Past performance does not guarantee future results. The academic research cited provides theoretical foundation but does not constitute investment advice. Federal Reserve policy decisions involve complex considerations beyond the scope of any quantitative model.
Citation: EdgeTools Research Team. (2025). Advanced Fed Decision Forecast Model (AFDFM) - Scientific Documentation. EdgeTools Quantitative Research Series

Alerts█ OVERVIEW
This library is a Pine Script™ programmers tool that provides functions to simplify the creation of compound conditions and alert messages. With these functions, scripts can use comma-separated "string" lists to specify condition groups from arbitrarily large "bool" arrays , offering a convenient way to provide highly flexible alert creation to script users without requiring numerous inputs in the "Settings/Inputs" menu.
█ CONCEPTS
Compound conditions
Compound conditions are essentially groups of two or more conditions, where each required condition must occur to produce a `true` result. Traders often combine conditions, including signals from various indicators, to drive and reinforce trade decisions. Similarly, programmers use compound conditions in logical operations to create scripts that respond dynamically to groups of events.
Condition conundrum
Providing flexible condition combinations to script users for signals and alerts often poses a significant challenge: input complexity . Conventionally, such flexibility comes at the cost of an extensive list of separate inputs for toggling individual conditions and customizing their properties, often resulting in complicated input menus that are difficult for users to navigate effectively. Furthermore, managing all those inputs usually entails tediously handling many extra variables and logical expressions, making such projects more complex for programmers.
Condensing complexity
This library introduces a technique using parsed strings to reference groups of elements from "bool" arrays , helping to simplify and streamline the construction of compound conditions and alert messages. With this approach, programmers can provide one or more "string" inputs in their scripts where users can list numbers corresponding to the conditions they want to combine.
For example, suppose you have a script that creates alert triggers based on a combination of up to 20 individual conditions, and you want to make inputs for users to choose which conditions to combine. Instead of creating 20 separate checkboxes in the "Settings/Inputs" tab and manually adding associated logic for each one, you can store the conditional values in arrays, make one or more "string" inputs that accept values listing the array item locations (e.g., "1,4,8,11"), and then pass the inputs to these functions to determine the compound conditions formed by the specified groups.
This approach condenses the input space, improving navigability and utility. Additionally, it helps provide high-level simplicity to complex conditional code, making it easier to maintain and expand over time.
█ CALCULATIONS AND USE
This library contains three functions for evaluating compound conditions: `getCompoundConditon()`, `getCompoundConditionsArray()`, and `compoundAlertMessage()`. Each function has two overloads that evaluate compound conditions based on groups of items from one or two "bool" arrays . The sections below explain the functions' calculations and how to use them.
Referencing conditions using "string" index lists
Each function processes "string" values containing comma-separated lists of numerals representing the indices of the "bool" array items to use in its calculations (e.g., "4, 8, 12"). The functions split each supplied "string" list by its commas, then iterate over those specified indices in the "bool" arrays to determine each group's combined `true` or `false` state.
For convenience, the numbers in the "string" lists can represent zero-based indices (where the first item is at index 0) or one-based indices (where the first item is at index 1), depending on the function's `zeroIndex` parameter. For example, an index list of "0, 2, 4" with a `zeroIndex` value of `true` specifies that the condition group uses the first , third , and fifth "bool" values in the array, ignoring all others. If the `zeroIndex` value is `false`, the list "1, 3, 5" also refers to those same elements.
Zero-based indexing is convenient for programmers because Pine arrays always use this index format. However, one-based indexing is often more convenient and familiar for script users, especially non-programmers.
Evaluating one or many condition groups
The `getCompoundCondition()` function evaluates singular condition groups determined by its `indexList` parameter, returning `true` values whenever the specified array elements are `true`. This function is helpful when a script has to evaluate specific groups of conditions and does not require many combinations.
In contrast, the `getCompoundConditionsArray()` function can evaluate numerous condition groups, one for each "string" included in its `indexLists` argument. It returns arrays containing `true` or `false` states for each listed group. This function is helpful when a script requires multiple condition combinations in additional calculations or logic.
The `compoundAlertMessage()` function is similar to the `getCompoundConditionsArray()` function. It also evaluates a separate compound condition group for each "string" in its `indexLists` array, but it returns "string" values containing the marker (name) of each group with a `true` result. You can use these returned values as the `message` argument in alert() calls, display them in labels and other drawing objects, or even use them in additional calculations and logic.
Directional condition pairs
The first overload of each function operates on a single `conditions` array, returning values representing one or more compound conditions from groups in that array. These functions are ideal for general-purpose condition groups that may or may not represent direction information.
The second overloads accept two arrays representing upward and downward conditions separately: `upConditions` and `downConditions`. These overloads evaluate opposing directional conditions in pairs (e.g., RSI is above/below a level) and return upward and downward condition information separately in a tuple .
When using the directional overloads, ensure the `upConditions` and `downConditions` arrays are the same size, with the intended condition pairs at the same indices . For instance, if you have a specific upward RSI condition's value at the first index in the `upConditions` array, include the opposing downward RSI condition's value at that same index in the `downConditions` array. If a condition can apply to both directions (e.g., rising volume), include its value at the same index in both arrays.
Group markers
To simplify the generation of informative alert messages, the `compoundAlertMessage()` function assigns "string" markers to each condition group, where "marker" refers to the group's name. The `groupMarkers` parameter allows you to assign custom markers to each listed group. If not specified, the function generates default group markers in the format "M", where "M" is short for "Marker" and "" represents the group number starting from 1. For example, the default marker for the first group specified in the `indexLists` array is "M1".
The function's returned "string" values contain a comma-separated list with markers for each activated condition group (e.g., "M1, M4"). The function's second overload, which processes directional pairs of conditions, also appends extra characters to the markers to signify the direction. The default for upward groups is "▲" (e.g., "M1▲") and the default for downward ones is "▼" (e.g., "M1▼"). You can customize these appended characters with the `upChar` and `downChar` parameters.
Designing customizable alerts
We recommend following these primary steps when using this library to design flexible alerts for script users:
1. Create text inputs for users to specify comma-separated lists of conditions with the input.string() or input.text_area() functions, and then collect all the input values in a "string" array . Note that each separate "string" in the array will represent a distinct condition group.
2. Create arrays of "bool" values representing the possible conditions to choose from. If your script will process pairs of upward and downward conditions, ensure the related elements in the arrays align at the same indices.
3. Call `compoundAlertMessage()` using the arrays from steps 1 and 2 as arguments to get the alert message text. If your script will use the text for alerts only, not historical display or calculation purposes, the call is necessary only on realtime bars .
4. Pass the calculated "string" values as the `message` argument in alert() calls. We recommend calling the function only when the "string" is not empty (i.e., `messageText != ""`). To avoid repainting alerts on open bars, use barstate.isconfirmed in the condition to allow alert triggers only on each bar's close .
5. Test the alerts. Open the "Create Alert" dialog box and select "Any alert() function call" in the "Condition" field. It is also helpful to inspect the strings with Pine Logs .
NOTE: Because the techniques in this library use lists of numbers to specify conditions, we recommend including a tooltip for the "string" inputs that lists the available numbers and the conditions they represent. This tooltip provides a legend for script users, making it simple to understand and utilize. To create the tooltip, declare a "const string" listing the options and pass it to the `input.*()` call's `tooltip` parameter. See the library's example code for a simple demonstration.
█ EXAMPLE CODE
This library's example code demonstrates one possible way to offer a selection of compound conditions with "string" inputs and these functions. It uses three input.string() calls, each accepting a comma-separated list representing a distinct condition group. The title of each input represents the default group marker that appears in the label and alert text. The code collects these three input values in a `conditionGroups` array for use with the `compoundAlertMessage()` function.
In this code, we created two "bool" arrays to store six arbitrary condition pairs for demonstration:
1. Bar up/down: The bar's close price must be above the open price for upward conditions, and vice versa for downward conditions.
2. Fast EMA above/below slow EMA : The 9-period Exponential Moving Average of close prices must be above the 21-period EMA for upward conditions, and vice versa for downward conditions.
3. Volume above average : The bar's volume must exceed its 20-bar average to activate an upward or downward condition.
4. Volume rising : The volume must exceed that of the previous bar to activate an upward or downward condition.
5. RSI trending up/down : The 14-period Relative Strength Index of close prices must be between 50 and 70 for upward conditions, and between 30 and 50 for downward conditions.
6. High volatility : The 7-period Average True Range (ATR) must be above the 40-period ATR to activate an upward or downward condition.
We included a `tooltip` argument for the third input.string() call that displays the condition numbers and titles, where 1 is the first condition number.
The `bullConditions` array contains the `true` or `false` states of all individual upward conditions, and the `bearConditions` array contains all downward condition states. For the conditions that filter either direction because they are non-directional, such as "High volatility", both arrays contain the condition's `true` or `false` value at the same index. If you use these conditions alone, they activate upward and downward alert conditions simultaneously.
The example code calls `compoundAlertMessage()` using the `bullConditions`, `bearConditions`, and `conditionGroups` arrays to create a tuple of strings containing the directional markers for each activated group. On confirmed bars, it displays non-empty strings in labels and uses them in alert() calls. For the text shown in the labels, we used str.replace_all() to replace commas with newline characters, aligning the markers vertically in the display.
Look first. Then leap.
█ FUNCTIONS
This library exports the following functions:
getCompoundCondition(conditions, indexList, minRequired, zeroIndex)
(Overload 1 of 2) Determines a compound condition based on selected elements from a `conditions` array.
Parameters:
conditions (array) : (array) An array containing the possible "bool" values to use in the compound condition.
indexList (string) : (series string) A "string" containing a comma-separated list of whole numbers representing the group of `conditions` elements to use in the compound condition. For example, if the value is `"0, 2, 4"`, and `minRequired` is `na`, the function returns `true` only if the `conditions` elements at index 0, 2, and 4 are all `true`. If the value is an empty "string", the function returns `false`.
minRequired (int) : (series int) Optional. Determines the minimum number of selected conditions required to activate the compound condition. For example, if the value is 2, the function returns `true` if at least two of the specified `conditions` elements are `true`. If the value is `na`, the function returns `true` only if all specified elements are `true`. The default is `na`.
zeroIndex (bool) : (series bool) Optional. Specifies whether the `indexList` represents zero-based array indices. If `true`, a value of "0" in the list represents the first array index. If `false`, a `value` of "1" represents the first index. The default is `true`.
Returns: (bool) `true` if `conditions` elements in the group specified by the `indexList` are `true`, `false` otherwise.
getCompoundCondition(upConditions, downConditions, indexList, minRequired, allowUp, allowDown, zeroIndex)
(Overload 2 of 2) Determines upward and downward compound conditions based on selected elements from `upConditions` and `downConditions` arrays.
Parameters:
upConditions (array) : (array) An array containing the possible "bool" values to use in the upward compound condition.
downConditions (array) : (array) An array containing the possible "bool" values to use in the downward compound condition.
indexList (string) : (series string) A "string" containing a comma-separated list of whole numbers representing the `upConditions` and `downConditions` elements to use in the compound conditions. For example, if the value is `"0, 2, 4"` and `minRequired` is `na`, the function returns `true` for the first value only if the `upConditions` elements at index 0, 2, and 4 are all `true`. If the value is an empty "string", the function returns ` `.
minRequired (int) : (series int) Optional. Determines the minimum number of selected conditions required to activate either compound condition. For example, if the value is 2, the function returns `true` for its first value if at least two of the specified `upConditions` elements are `true`. If the value is `na`, the function returns `true` only if all specified elements are `true`. The default is `na`.
allowUp (bool) : (series bool) Optional. Controls whether the function considers upward compound conditions. If `false`, the function ignores the `upConditions` array, and the first item in the returned tuple is `false`. The default is `true`.
allowDown (bool) : (series bool) Optional. Controls whether the function considers downward compound conditions. If `false`, the function ignores the `downConditions` array, and the second item in the returned tuple is `false`. The default is `true`.
zeroIndex (bool) : (series bool) Optional. Specifies whether the `indexList` represents zero-based array indices. If `true`, a value of "0" in the list represents the first array index. If `false`, a value of "1" represents the first index. The default is `true`.
Returns: ( ) A tuple containing two "bool" values representing the upward and downward compound condition states, respectively.
getCompoundConditionsArray(conditions, indexLists, zeroIndex)
(Overload 1 of 2) Creates an array of "bool" values representing compound conditions formed by selected elements from a `conditions` array.
Parameters:
conditions (array) : (array) An array containing the possible "bool" values to use in each compound condition.
indexLists (array) : (array) An array of strings containing comma-separated lists of whole numbers representing the `conditions` elements to use in each compound condition. For example, if an item is `"0, 2, 4"`, the corresponding item in the returned array is `true` only if the `conditions` elements at index 0, 2, and 4 are all `true`. If an item is an empty "string", the item in the returned array is `false`.
zeroIndex (bool) : (series bool) Optional. Specifies whether the "string" lists in the `indexLists` represent zero-based array indices. If `true`, a value of "0" in a list represents the first array index. If `false`, a value of "1" represents the first index. The default is `true`.
Returns: (array) An array of "bool" values representing compound condition states for each condition group. An item in the array is `true` only if all the `conditions` elements specified by the corresponding `indexLists` item are `true`. Otherwise, the item is `false`.
getCompoundConditionsArray(upConditions, downConditions, indexLists, allowUp, allowDown, zeroIndex)
(Overload 2 of 2) Creates two arrays of "bool" values representing compound upward and
downward conditions formed by selected elements from `upConditions` and `downConditions` arrays.
Parameters:
upConditions (array) : (array) An array containing the possible "bool" values to use in each upward compound condition.
downConditions (array) : (array) An array containing the possible "bool" values to use in each downward compound condition.
indexLists (array) : (array) An array of strings containing comma-separated lists of whole numbers representing the `upConditions` and `downConditions` elements to use in each compound condition. For example, if an item is `"0, 2, 4"`, the corresponding item in the first returned array is `true` only if the `upConditions` elements at index 0, 2, and 4 are all `true`. If an item is an empty "string", the items in both returned arrays are `false`.
allowUp (bool) : (series bool) Optional. Controls whether the function considers upward compound conditions. If `false`, the function ignores the `upConditions` array, and all elements in the first returned array are `false`. The default is `true`.
allowDown (bool) : (series bool) Optional. Controls whether the function considers downward compound conditions. If `false`, the function ignores the `downConditions` array, and all elements in the second returned array are `false`. The default is `true`.
zeroIndex (bool) : (series bool) Optional. Specifies whether the "string" lists in the `indexLists` represent zero-based array indices. If `true`, a value of "0" in a list represents the first array index. If `false`, a value of "1" represents the first index. The default is `true`.
Returns: ( ) A tuple containing two "bool" arrays:
- The first array contains values representing upward compound condition states determined using the `upConditions`.
- The second array contains values representing downward compound condition states determined using the `downConditions`.
compoundAlertMessage(conditions, indexLists, zeroIndex, groupMarkers)
(Overload 1 of 2) Creates a "string" message containing a comma-separated list of markers representing active compound conditions formed by specified element groups from a `conditions` array.
Parameters:
conditions (array) : (array) An array containing the possible "bool" values to use in each compound condition.
indexLists (array) : (array) An array of strings containing comma-separated lists of whole numbers representing the `conditions` elements to use in each compound condition. For example, if an item is `"0, 2, 4"`, the corresponding marker for that item appears in the returned "string" only if the `conditions` elements at index 0, 2, and 4 are all `true`.
zeroIndex (bool) : (series bool) Optional. Specifies whether the "string" lists in the `indexLists` represent zero-based array indices. If `true`, a value of "0" in a list represents the first array index. If `false`, a value of "1" represents the first index. The default is `true`.
groupMarkers (array) : (array) Optional. If specified, sets the marker (name) for each condition group specified in the `indexLists` array. If `na`, the function uses the format `"M"` for each group, where "M" is short for "Marker" and `` represents the one-based index for the group (e.g., the marker for the first listed group is "M1"). The default is `na`.
Returns: (string) A "string" containing a list of markers corresponding to each active compound condition.
compoundAlertMessage(upConditions, downConditions, indexLists, allowUp, allowDown, zeroIndex, groupMarkers, upChar, downChar)
(Overload 2 of 2) Creates two "string" messages containing comma-separated lists of markers representing active upward and downward compound conditions formed by specified element groups from `upConditions` and `downConditions` arrays.
Parameters:
upConditions (array) An array containing the possible "bool" values to use in each upward compound condition.
downConditions (array) An array containing the possible "bool" values to use in each downward compound condition.
indexLists (array) An array of strings containing comma-separated lists of whole numbers representing the `upConditions` and `downConditions` element groups to use in each compound condition. For example, if an item is `"0, 2, 4"`, the corresponding group marker for that item appears in the first returned "string" only if the `upConditions` elements at index 0, 2, and 4 are all `true`.
allowUp (bool) Optional. Controls whether the function considers upward compound conditions. If `false`, the function ignores the `upConditions` array and returns an empty "string" for the first tuple element. The default is `true`.
allowDown (bool) Optional. Controls whether the function considers downward compound conditions. If `false`, the function ignores the `downConditions` array and returns an empty "string" for the second tuple element. The default is `true`.
zeroIndex (bool) Optional. Specifies whether the "string" lists in the `indexLists` represent zero-based array indices. If `true`, a value of "0" in a list represents the first array index. If `false`, a value of "1" represents the first index. The default is `true`.
groupMarkers (array) Optional. If specified, sets the name (marker) of each condition group specified in the `indexLists` array. If `na`, the function uses the format `"M"` for each group, where "M" is short for "Marker" and `` represents the one-based index for the group (e.g., the marker for the first listed group is "M1"). The default is `na`.
upChar (string) Optional. A "string" appended to all group markers for upward conditions to signify direction. The default is "▲".
downChar (string) Optional. A "string" appended to all group markers for downward conditions to signify direction. The default is "▼".
Returns: ( ): A tuple of "string" values containing lists of markers corresponding to active upward and downward compound conditions, respectively.

Market Internals & InfoThis script provides various information on Market Internals and other related info. It was a part of the Daily Levels script but that script was getting very large so I decided to separate this piece of it into its own indicator. I plan on adding some additional features in the near future so stay tuned for those!
The script provides customizability to show certain market internals, tickers, and even Market Profile TPO periods.
Here is a summary of each setting:
NASDAQ and NYSE Breadth Ratio
- Ratio between Up Volume and Down Volume for NASDAQ and NYSE markets. This can help inform about the type of volume flowing in and out of these exchanges.
Advance/Decline Line (ADL)
The ADL focuses specifically on the number of advancing and declining stocks within an index, without considering their trading volume.
Here's how the ADL works:
It tracks the daily difference between the number of stocks that are up in price (advancing) and the number of stocks that are down in price (declining) within a particular index.
The ADL is a cumulative measure, meaning each day's difference is added to the previous day's total.
If there are more advancing stocks, the ADL goes up.
If there are more declining stocks, the ADL goes down.
By analyzing the ADL, investors can get a sense of how many stocks are participating in a market move.
Here's what the ADL can tell you:
Confirmation of Trends: When the ADL moves in the same direction as the underlying index (e.g., ADL rising with a rising index), it suggests broad participation in the trend and potentially stronger momentum.
Divergence: If the ADL diverges from the index (e.g., ADL falling while the index is rising), it can be a warning sign. This suggests that fewer stocks are participating in the rally, which could indicate a weakening trend.
Keep in mind:
The ADL is a backward-looking indicator, reflecting past market activity.
It's often used in conjunction with other technical indicators for a more complete picture.
TRIN Arms Index
The TRIN index, also called the Arms Index or Short-Term Trading Index, is a technical analysis tool used in the stock market to gauge market breadth and sentiment. It essentially compares the number of advancing stocks (gaining in price) to declining stocks (losing price) along with their trading volume.
Here's how to interpret the TRIN:
High TRIN (above 1.0): This indicates a weak market where declining stocks and their volume are dominating the market. It can be a sign of a potential downward trend.
Low TRIN (below 1.0): This suggests a strong market where advancing stocks and their volume are in control. It can be a sign of a potential upward trend.
TRIN around 1.0: This represents a more balanced market, where it's difficult to say which direction the market might be headed.
Important points to remember about TRIN:
It's a short-term indicator, primarily used for intraday trading decisions.
It should be used in conjunction with other technical indicators for a more comprehensive market analysis. High or low TRIN readings don't guarantee future price movements.
VIX/VXN
VIX and VXN are both indexes created by the Chicago Board Options Exchange (CBOE) to measure market volatility. They differ based on the underlying index they track:
VIX (Cboe Volatility Index): This is the more well-known index and is considered the "fear gauge" of the stock market. It reflects the market's expectation of volatility in the S&P 500 index over the next 30 days.
VXN (Cboe Nasdaq Volatility Index): This is a counterpart to the VIX, but instead gauges volatility expectations for the Nasdaq 100 index over the coming 30 days. The tech-heavy Nasdaq can sometimes diverge from the broader market represented by the S&P 500, hence the need for a separate volatility measure.
Both VIX and VXN are calculated based on the implied volatilities of options contracts listed on their respective indexes. Here's a general interpretation:
High VIX/VXN: Indicates a high level of fear or uncertainty in the market, suggesting investors expect significant price fluctuations in the near future.
Low VIX/VXN: Suggests a more complacent market with lower expectations of volatility.
Important points to remember about VIX and VXN:
They are forward-looking indicators, reflecting market sentiment about future volatility, not necessarily current market conditions.
High VIX/VXN readings don't guarantee a market crash, and low readings don't guarantee smooth sailing.
These indexes are often used by investors to make decisions about portfolio allocation and hedging strategies.
Inside/Outside Day
This provides a quick indication of it we are still trading inside or outside of yesterdays range and will show "Inside Day" or "Outside Day" based upon todays range vs. yesterday's range.
Custom Ticker Choices
Ability to add up to 5 other tickers that can be tracked within the table
Show Market Profile TPO
This only shows on timeframes less than 30m. It will show both the current TPO period and the remaining time within that period.
Table Customization
Provided drop downs to change the text size and also the location of the table.

Litt Internals ProThe Litt Internal Pro is based on the four major U.S. Equity Indexes. This is to not be used for any other markets. If you need more information on any of the indexes, you can google or watch YouTube videos on what they are. Typically if we are looking for to be long we want to see all four of the indexes green and have buy ratings. If we are looking to be short we want to see all four of the indexes red and have sell ratings. If you see Overbought or Oversold ratings it may be best to wait for a pullback to get long or not take the trade at all.
For the stocks that you trade, you should know what index they are in. The reason for this is that you can still take trades if not all four indexes are aligned the same color. For example, maybe small caps (IWM) are on a hot streak and seeing buying momentum from institutions meanwhile tech (QQQ), is being sold. If you held a long in a company that is in IWM then you could be more comfortable holding your long position. Meanwhile, if you held a long position in a stock that is in QQQ then you might want to cut your loss or take profit. There are multiple different use cases for this indicator so it is best to look for outside resources on more information on the indexes and what stocks are in each index. This can be a very powerful tool to see sector rotation by hedge funds and institutions.

SimilarityMeasuresLibrary "SimilarityMeasures"
Similarity measures are statistical methods used to quantify the distance between different data sets
or strings. There are various types of similarity measures, including those that compare:
- data points (SSD, Euclidean, Manhattan, Minkowski, Chebyshev, Correlation, Cosine, Camberra, MAE, MSE, Lorentzian, Intersection, Penrose Shape, Meehl),
- strings (Edit(Levenshtein), Lee, Hamming, Jaro),
- probability distributions (Mahalanobis, Fidelity, Bhattacharyya, Hellinger),
- sets (Kumar Hassebrook, Jaccard, Sorensen, Chi Square).
---
These measures are used in various fields such as data analysis, machine learning, and pattern recognition. They
help to compare and analyze similarities and differences between different data sets or strings, which
can be useful for making predictions, classifications, and decisions.
---
References:
en.wikipedia.org
cran.r-project.org
numerics.mathdotnet.com
github.com
github.com
github.com
Encyclopedia of Distances, doi.org
ssd(p, q)
Sum of squared difference for N dimensions.
Parameters:
p (float ) : `array` Vector with first numeric distribution.
q (float ) : `array` Vector with second numeric distribution.
Returns: Measure of distance that calculates the squared euclidean distance.
euclidean(p, q)
Euclidean distance for N dimensions.
Parameters:
p (float ) : `array` Vector with first numeric distribution.
q (float ) : `array` Vector with second numeric distribution.
Returns: Measure of distance that calculates the straight-line (or Euclidean).
manhattan(p, q)
Manhattan distance for N dimensions.
Parameters:
p (float ) : `array` Vector with first numeric distribution.
q (float ) : `array` Vector with second numeric distribution.
Returns: Measure of absolute differences between both points.
minkowski(p, q, p_value)
Minkowsky Distance for N dimensions.
Parameters:
p (float ) : `array` Vector with first numeric distribution.
q (float ) : `array` Vector with second numeric distribution.
p_value (float) : `float` P value, default=1.0(1: manhatan, 2: euclidean), does not support chebychev.
Returns: Measure of similarity in the normed vector space.
chebyshev(p, q)
Chebyshev distance for N dimensions.
Parameters:
p (float ) : `array` Vector with first numeric distribution.
q (float ) : `array` Vector with second numeric distribution.
Returns: Measure of maximum absolute difference.
correlation(p, q)
Correlation distance for N dimensions.
Parameters:
p (float ) : `array` Vector with first numeric distribution.
q (float ) : `array` Vector with second numeric distribution.
Returns: Measure of maximum absolute difference.
cosine(p, q)
Cosine distance between provided vectors.
Parameters:
p (float ) : `array` 1D Vector.
q (float ) : `array` 1D Vector.
Returns: The Cosine distance between vectors `p` and `q`.
---
angiogenesis.dkfz.de
camberra(p, q)
Camberra distance for N dimensions.
Parameters:
p (float ) : `array` Vector with first numeric distribution.
q (float ) : `array` Vector with second numeric distribution.
Returns: Weighted measure of absolute differences between both points.
mae(p, q)
Mean absolute error is a normalized version of the sum of absolute difference (manhattan).
Parameters:
p (float ) : `array` Vector with first numeric distribution.
q (float ) : `array` Vector with second numeric distribution.
Returns: Mean absolute error of vectors `p` and `q`.
mse(p, q)
Mean squared error is a normalized version of the sum of squared difference.
Parameters:
p (float ) : `array` Vector with first numeric distribution.
q (float ) : `array` Vector with second numeric distribution.
Returns: Mean squared error of vectors `p` and `q`.
lorentzian(p, q)
Lorentzian distance between provided vectors.
Parameters:
p (float ) : `array` Vector with first numeric distribution.
q (float ) : `array` Vector with second numeric distribution.
Returns: Lorentzian distance of vectors `p` and `q`.
---
angiogenesis.dkfz.de
intersection(p, q)
Intersection distance between provided vectors.
Parameters:
p (float ) : `array` Vector with first numeric distribution.
q (float ) : `array` Vector with second numeric distribution.
Returns: Intersection distance of vectors `p` and `q`.
---
angiogenesis.dkfz.de
penrose(p, q)
Penrose Shape distance between provided vectors.
Parameters:
p (float ) : `array` Vector with first numeric distribution.
q (float ) : `array` Vector with second numeric distribution.
Returns: Penrose shape distance of vectors `p` and `q`.
---
angiogenesis.dkfz.de
meehl(p, q)
Meehl distance between provided vectors.
Parameters:
p (float ) : `array` Vector with first numeric distribution.
q (float ) : `array` Vector with second numeric distribution.
Returns: Meehl distance of vectors `p` and `q`.
---
angiogenesis.dkfz.de
edit(x, y)
Edit (aka Levenshtein) distance for indexed strings.
Parameters:
x (int ) : `array` Indexed array.
y (int ) : `array` Indexed array.
Returns: Number of deletions, insertions, or substitutions required to transform source string into target string.
---
generated description:
The Edit distance is a measure of similarity used to compare two strings. It is defined as the minimum number of
operations (insertions, deletions, or substitutions) required to transform one string into another. The operations
are performed on the characters of the strings, and the cost of each operation depends on the specific algorithm
used.
The Edit distance is widely used in various applications such as spell checking, text similarity, and machine
translation. It can also be used for other purposes like finding the closest match between two strings or
identifying the common prefixes or suffixes between them.
---
github.com
www.red-gate.com
planetcalc.com
lee(x, y, dsize)
Distance between two indexed strings of equal length.
Parameters:
x (int ) : `array` Indexed array.
y (int ) : `array` Indexed array.
dsize (int) : `int` Dictionary size.
Returns: Distance between two strings by accounting for dictionary size.
---
www.johndcook.com
hamming(x, y)
Distance between two indexed strings of equal length.
Parameters:
x (int ) : `array` Indexed array.
y (int ) : `array` Indexed array.
Returns: Length of different components on both sequences.
---
en.wikipedia.org
jaro(x, y)
Distance between two indexed strings.
Parameters:
x (int ) : `array` Indexed array.
y (int ) : `array` Indexed array.
Returns: Measure of two strings' similarity: the higher the value, the more similar the strings are.
The score is normalized such that `0` equates to no similarities and `1` is an exact match.
---
rosettacode.org
mahalanobis(p, q, VI)
Mahalanobis distance between two vectors with population inverse covariance matrix.
Parameters:
p (float ) : `array` 1D Vector.
q (float ) : `array` 1D Vector.
VI (matrix) : `matrix` Inverse of the covariance matrix.
Returns: The mahalanobis distance between vectors `p` and `q`.
---
people.revoledu.com
stat.ethz.ch
docs.scipy.org
fidelity(p, q)
Fidelity distance between provided vectors.
Parameters:
p (float ) : `array` 1D Vector.
q (float ) : `array` 1D Vector.
Returns: The Bhattacharyya Coefficient between vectors `p` and `q`.
---
en.wikipedia.org
bhattacharyya(p, q)
Bhattacharyya distance between provided vectors.
Parameters:
p (float ) : `array` 1D Vector.
q (float ) : `array` 1D Vector.
Returns: The Bhattacharyya distance between vectors `p` and `q`.
---
en.wikipedia.org
hellinger(p, q)
Hellinger distance between provided vectors.
Parameters:
p (float ) : `array` 1D Vector.
q (float ) : `array` 1D Vector.
Returns: The hellinger distance between vectors `p` and `q`.
---
en.wikipedia.org
jamesmccaffrey.wordpress.com
kumar_hassebrook(p, q)
Kumar Hassebrook distance between provided vectors.
Parameters:
p (float ) : `array` 1D Vector.
q (float ) : `array` 1D Vector.
Returns: The Kumar Hassebrook distance between vectors `p` and `q`.
---
github.com
jaccard(p, q)
Jaccard distance between provided vectors.
Parameters:
p (float ) : `array` 1D Vector.
q (float ) : `array` 1D Vector.
Returns: The Jaccard distance between vectors `p` and `q`.
---
github.com
sorensen(p, q)
Sorensen distance between provided vectors.
Parameters:
p (float ) : `array` 1D Vector.
q (float ) : `array` 1D Vector.
Returns: The Sorensen distance between vectors `p` and `q`.
---
people.revoledu.com
chi_square(p, q, eps)
Chi Square distance between provided vectors.
Parameters:
p (float ) : `array` 1D Vector.
q (float ) : `array` 1D Vector.
eps (float)
Returns: The Chi Square distance between vectors `p` and `q`.
---
uw.pressbooks.pub
stats.stackexchange.com
www.itl.nist.gov
kulczynsky(p, q, eps)
Kulczynsky distance between provided vectors.
Parameters:
p (float ) : `array` 1D Vector.
q (float ) : `array` 1D Vector.
eps (float)
Returns: The Kulczynsky distance between vectors `p` and `q`.
---
github.com

Annualizer: New Indicator + CPI AnalysisThis indicator calculates the annualized month-over-month percent change of a cumulative index and plots it alongside the year-over-year percent change for comparison. It was developed for the purpose of analyzing the inflation rate of CPI indexes such as “CPIAUCSL.” It can also be used on M2 money supply and pretty much any cumulative index. It will not produce useful outputs on percent change indexes such as “USCCPI” because it performs percent change calculations which are already applied to those indexes.
This indicator takes data from the monthly chart, regardless of how often the data is reported or what the timeframe of the current chart is. Doing so allows it to work on all timeframes while displaying only monthly data outputs but limits it from recognizing data which might be released more often than once per month. This limitation should be suitable for macroeconomic data such as CPI and M2 money supply which are usually analyzed on a month-to-month basis.
If the ticker symbol is "M2SL" which is M2 money supply, annualized percent change is plotted in green, otherwise, it’s plotted in blue.
CPI analysis:
Upon deploying this indicator, it was observed that the year-over-year (YoY) inflation rate (red) is a lagging indicator of the annualized month-over-month (MoM) inflation rate (blue) and that it appears to almost be a moving average of it. A moving average plot was temporarily added for comparison to the YoY and it was found that the difference between the two plots is negligible and that for the purposes of high-level analysis of inflation, the two plots can be considered to be no different from one another. Below is a screenshot for demonstration. Notice how closely the white 12-month SMA of the annualized rate tracks the YoY rate.
For other indexes which may see more dramatic changes month-over-month such as M2 money supply, the difference between the two signals becomes more pronounced but they are still comparable. The conclusion is that the YoY inflation rate can be considered to be a 12-month simple moving average of the annualized MoM rate.
12-month SMA:
It’s easy to see and stands to reason that if the annualized MoM inflation rate (blue) remains where it has been for the previous 2 months YoY inflation (red) will begin falling and eventually reach similar levels due to its moving-average-like behavior. This will bring us back to the 2% YoY inflation target of the Fed within no more than 10 months. There may be a perception that deflation is required to bring prices back down to the purple channel of CPI to make prices pre-Covid "normal" again. We were headed in that direction in July with a slightly negative MoM CPI read. What may have freaked investors out about the August report (most recent as of this writing) is that the inflation rate, rather than continuing into negative deflationary territory, has bounced back into positive territory.
M2 money supply isn’t an integral part of this analysis, but it helps demonstrate the indicator. It can be observed that CPI growth lags M2 money supply growth which seems to have leveled off.
I’m not a macroeconomist so I’m probably missing some things, but I do not see a lagging indicator such as YoY inflation being at 8.25% while annualized MoM inflation is at 1.42% as something to freak out about as investors have seemingly done. I’m a stock market bear as of last week, but I do not feel this CPI analysis strongly supports a bearish thesis, nor is it bullish. Next month’s annualized MoM % change may begin to sway me one way or the other depending on what this chart looks like when it’s updated.

Pinescript - Standard Array Functions Library by RRBStandard Array Functions Library by RagingRocketBull 2021
Version 1.0
This script provides a library of every standard Pinescript array function for live testing with all supported array types.
You can find the full list of supported standard array functions below.
There are several libraries:
- Common String Functions Library
- Common Array Functions Library
- Standard Array Functions Library
Features:
- Supports all standard array functions (30+) with all possible array types* (* - except array.new* functions and label, line array types)
- Live Output for all/selected functions based on User Input. Test any function for possible errors you may encounter before using in script.
- Output filters: show errors, hide all excluded and show only allowed functions using a list of function names
- Console customization options: set custom text size, color, page length, line spacing
Notes:
- uses Pinescript v3 Compatibility Framework
- uses Common String Functions Library
- has to be a separate script to reduce the number of local scopes in Common Array Function Library, there's no way to merge these scripts into a single library.
- lets you live test all standard array functions for errors. If you see an error - change params in UI
- array types that are not supported by certain functions and producing a compilation error were disabled with "error" showing up as result
- if you see "Loop too long" error - hide/unhide or reattach the script
- doesn't use pagination, a single str contains all output
- for most array functions to work (except push), an array must be defined with at least 1 pre-existing dummy element 0.
- array.slice and array.fill require from_index < to_index otherwise error
- array.join only supports string arrays, and delimiter must be a const string, can't be var/input. Use join_any_array to join any array type into string. You can also use tostring() to join int, float arrays.
- array.sort only supports int, float arrays. Use sort_any_array from the Common Array Function Library to sort any array type.
- array.sort only sorts values, doesn't preserve indexes. Use sort_any_array from the Common Array Function Library to sort any array while preserving indexes.
- array.concat appends string arrays in reverse order, other array types are appended correctly
- array.covariance requires 2 int, float arrays of the same size
- tostring(flag) works only for internal bool vars, flag expression can't depend on any inputs of any type, use bool_to_str instead
- you can't create an if/function that returns var type value/array - compiler uses strict types and doesn't allow that
- however you can assign array of any type to another array of any type creating an arr pointer of invalid type that must be reassigned to a matching array type before used in any expression to prevent error
- source_array and create_any_array2 use this loophole to return an int_arr pointer of a var type array
- this works for all array types defined with/without var keyword. This doesn't work for string arrays defined with var keyword for some reason
- you can't do this with var type vars, this can be done only with var type arrays because they are pointers passed by reference, while vars are the actual values passed by value.
- wrapper functions solve the problem of returning var array types. This is the only way of doing it when the top level arr type is undefined.
- you can only pass a var type value/array param to a function if all functions inside support every type - otherwise error
- alternatively values of every type must be passed simultaneously and processed separately by corresponding if branches/functions supporting these particular types returning a common single result type
- get_var_types solves this problem by generating a list of dummy values of every possible type including the source type, allowing a single valid branch to execute without error
- examples of functions supporting all array types: array.size, array.get, array.push. Examples of functions with limited type support: array.sort, array.join, array.max, tostring
- unlike var params/global vars, you can modify array params and global arrays directly from inside functions using standard array functions, but you can't use := (it only works for local arrays)
- inside function always work with array.copy to prevent accidental array modification
- you can't compare arrays
- there's no na equivalent for arrays, na(arr) doesn't work
P.S. A wide array of skills calls for an even wider array of responsibilities
List of functions:
- array.avg(arr)
- array.clear(arr)
- array.concat(arr1, arr2)
- array.copy(arr)
- array.covariance(arr1, arr2)
- array.fill(arr, value, index_from, index_to)
- array.get(arr, index)
- array.includes(arr, value)
- array.indexof(arr, value)
- array.insert(arr, index, value)
- array.join(arr, delimiter)
- array.lastindexof(arr, value)
- array.max(arr)
- array.median(arr)
- array.min(arr)
- array.mode(arr)
- array.pop(arr)
- array.push(arr, value)
- array.range(arr)
- array.remove(arr, index)
- array.reverse(arr)
- array.set(arr, index, value)
- array.shift(arr)
- array.size(arr)
- array.slice(arr, index_from, index_to)
- array.sort(arr, order)
- array.standardize()
- array.stdev(arr)
- array.sum(arr)
- array.unshift(arr, value)
- array.variance(arr)

Matrix functions - JD/////////////////////////////////////////////////////////////////////////////////////////////////////////////////
// The arrays provided in Pinescript are linear 1D strucures that can be seen either as a large vertical stack or
// a horizontal row containing a list of values, colors, bools,..
//
// With the FUNCTIONS in this script the 1D ARRAY LIST can be CONVERTED INTO A 2D MATRIX form
//
//
///////////////////////////////////////////
/// BASIC INFO ON THE MATRIX STRUCTURE: ///
///////////////////////////////////////////
//
// The matrix is set up as an 2D structure and is devided in ROWS and COLUMNS.
// following the standard mathematical notation:
//
// a 3 x 4 matrix = 4 columns
// 0 1 2 3 column index
// 0
// 3 rows 1
// 2
// row
// index
//
// With the use of some purpose-built functions, values can be placed or retrieved in a specific column of a certain row
// this can be done by intuitively using row_nr and column_nr coördinates,
// without having to worry on what exact index of the Pine array this value is located (the functions do these conversions for you)
//
//
// the syntax I propose for the 2D Matrix array has the following structure:
//
// - the array starts with 2 VALUES describing the DIMENSION INFORMATION, (rows, columns)
// these are ignored in the actual calculations and serve as a metadata header (similar to the "location, time,... etc." data that is stored in photo files)
// so the array always carries it's own info about the nr. of rows and columns and doesn't need is seperate "info" file!
//
// To stay consistent with the standard Pinescript (array and ) indexing:
// - indexes for sheets and columns start from 0 (first) and run up to the (total nr of sheets or columns) - 1
// - indexes for rows also start from 0 (most recent, cfr. ) and run up to the (total nr of rows) - 1
//
// - this 2 value metadata header is followed by the actual df data
// the actual data array can consist of (100,000 - 2) usable items,
//
// In a theoretical example, you can have a matrix with almost 20,000 rows with each 5 columns of data (eg. open, high, low, close, volume) in it!!!
//
//
///////////////////////////////////
/// SCHEMATIC OF THE STRUCTURE: ///
///////////////////////////////////
//
////// (metadata header with dimensions info)
//
// (0) (1) (array index)
//

FX Meter ScriptA while ago, we wrote* about the usefulness of using a currency strength meter and how you can build one from scratch.
See here: www.globalprime.com.au
Now we've taken this little project to the next level by visually spotting, via color signals in a dashboard and alerts, when a potential new trend might be developing in a currency pair.
*It's critical that you first read that article before you jump into reading this one or else you could get easily lost.
The script gives a trigger every time two currencies show diverging flows via opposing moving average slopes.
The signals originate from a first chart where currency indexes can be found, calculated through a formula, in various thin lines. Then a moving average to each currency index is applied so that it can smooth out the lines (what I call Micro moving averages – thicker lines -) and is usually a 4-5 period MA, with the key input to pay attention being the slope. One can perform their own tests on what works best for their particular trading style. The smaller the period in the moving average, the more responsive to changes in biases but the downside is that you will get a greater number of false moves. In the windows below the 1st chart, the stochRSI is calculated for each currency index (these values originate from the currency index and not from the applied MA). By default, a 25-period is applied to both RSI and Stoch length.
A 2nd chart that looks at the same logic is also accounted for to build this script, but instead of checking the micro trend, it applies a 25MA to the currency index, so it looks at what I call the slope of the macro trend. In this case, by default, a 125-period is applied to both RSI and Stoch length.
We had in mind to transition from just eye-balling and monitoring these charts manually to build a script via Tradingview that makes calculations real time (whenever the change in the moving average slope first occurs, and not when the bar/line closes), so that one can decide whether or not its a signal worth trading as part of a new trend emerging. Note, this is not so much a signal-triggering indicator but rather a tool to constantly be on the lookout monitoring what currencies might start to develop trends.
The actual script consists of a dashboard with different colored rectangles being triggered depending on the quality of the signal.
We will be happy to discuss it further with anyone who is interested in exploiting all the benefits that it can offer.
The way you add the script into your Tradingview chart is by first copy everything in the txt file. Then go to Pine editor (bottom middle-left) in your tradingview chart, delete everything there, then Paste the script. Then click Add to Chart (top right of the pine editor).
Note, you should add via the Anchored Text function the following list of pairs below, in this alphabetic order, on the right-hand side of the chart, as demonstrated above:
AUDCAD
AUDJPY
AUDNZD
AUDUSD
CADJPY
EURAUD
EURJPY
EURCAD
EURNZD
EURGBP
EURUSD
GBPAUD
GBPCAD
GBPJPY
GBPNZD
GBPUSD
NZDCAD
NZDJPY
NZDUSD
USDCAD
USDJPY
There are only 2 rules for the script to trigger a signal (see below). However, as I will elaborate further down, there are up to 6 different colors we can grade a signal
RULE 1 -> 2 moving averages, which are a calculation applied to a currency index as shown in the micro trend above, exhibit slopes in the opposite direction.
RULE 2 -> The Stoch RSI cannot be in overbought conditions if the slope of the moving average points higher or in oversold if the slope points lower.
Note 1: Even if the chart is a 60m timeframe by default (can be changed to any timeframe(, one gets the signal the moment the change of slope is identified, which means the indicator monitors changes in price tick by tick, and not on a candle close, otherwise one would get the trigger too late.
As an example of the highest-graded signal triggering (in green), a few hours ago we were given the visual cue that GBPCAD was experiencing a change of behavior. If we crosscheck the time the green-colored trigger was given with the actual GBPCAD chart, this is what we can observe. The pair is 30p higher since the trigger.
HOW TO SETUP ALERTS
One can easily setup a notification window each time the above rules are met, for example, if the EUR MA slope changes to bullish, and the AUD MA slope changes to bearish, and none of the 2 currency index values corresponding to these 2 moving averages (EUR and AUD) show a stoch RSI in overbought (above 80) in the case of the EUR, or oversold (below 20) in the case of the AUD, then the notification pop up would show a customized line: Long EURAUD
Note 1: Recording the slope of the macro moving average, which is usually a 25period MA applied to the currency index, is not included as part of the rules to trigger a signal, but it is taken into account to grade the quality of each signal.
Note 2: I recommend each signal to be triggered once or if you prefer, simply monitor the chart visually on the change of colors via the dashboard. The calculation resets and can appear again the moment that the slope changes to the opposite direction, so it’s a very dynamic indicator that will alert you the second a pair of currencies starts trending.
Note 3: When the signal is triggered, the indicator draws a colored rectangle. Each signal notification should be colored based on the following logic below.
LOGIC TO QUALIFY SIGNALS
-> Any long micro position with Macro MA in full agreement (ie/ Long EURAUD, Macro EUR up, Macro AUD down) is highlighted with green color
-> Any long micro position with macro moving averages in partial agreement (for example Long EURAUD, Macro EUR up AUD up) is highlighted with blue color
-> Any long micro position with macro moving averages in full disagreement (for example Long EURAUD, Macro EUR down AUD up) is highlighted with magenta color
-> Any short micro position with macro moving averages in full agreement (for example Short EURAUD, Macro EUR down AUD up) is highlighted with red color
-> Any short micro position with macro moving averages in partial agreement (for example Short EURAUD, Macro EUR up AUD up) is highlighted with orange color
-> Any short micro position with macro moving averages in full disagreement (for example Short EURAUD, Macro EUR up AUD down) is highlighted with purple color
PARAMETERS IN THE SCRIPT SETTINGS
Overbought/oversold: One can modify the stoch RSI level from which the indicator considers the value to be in overbought or oversold conditions. As a rule of thumb, consider 20/30 for oversold and 70/80 for oversold.
Slopes micro/macro MAs: One can edit the slope of the micro MA period (rule of thumb 4-5) and the macro MA (by default 25).
Value StochRSI: The default inputs are K 3, D 3, RSI Length 25, Stoch Length 25 for the micro and 125 period for the macro.
Change colors: One can edit the assigned colors in the signals dashboard.
Timeframe applied: The indicator has the flexibility to be applied to any timeframe, not just the 60m by default. Simply change the timeframe temporality.
CURRENCY INDEXES FORMULAS
It is the responsibility of the user to keep the values of the indexes updated. Find a recent sample below, as per values in early April. What this means is that at least once a week, in order to not let the values outdated, you should update the script with the latest valuations in the denominator.
NZD INDEX -> FX_IDC:NZDAUD/0.96+FX:NZDJPY/75.81+FX:NZDUSD/0.68+FX_IDC:NZDEUR/0.6+FX_IDC:NZDGBP/0.52+FX:NZDCHF/0.69+FX:NZDCAD/0.9
EUR INDEX -> FX:EURUSD/1.13+FX:EURJPY/125.5+FX:EURGBP/0.87+FX:EURCHF/1.135+FX:EURCAD/1.49+FX:EURNZD/1.655+FX:EURAUD/1.59
JPY INDEX -> 1/(FX:USDJPY/110.5+FX:EURJPY/125.5+FX:AUDJPY/79+FX:NZDJPY/75.5+FX:GBPJPY/144.5+FX:CHFJPY/110.5+FX:CADJPY/84)
USD INDEX -> FX_IDC:USDEUR/0.88+FX:USDJPY/110.5+FX_IDC:USDGBP/0.77+FX:USDCHF+FX:USDCAD/1.315+FX_IDC:USDNZD/1.46+FX_IDC:USDAUD/1.4
CAD INDEX-> FX_IDC:CADAUD/1.07+FX_IDC:CADNZD/1.11+FX:CADJPY/84.27+FX_IDC:CADUSD/0.76+FX_IDC:CADEUR/0.67+FX:CADCHF/0.76+FX_IDC:CADGBP/0.58
GBP INDEX -> FX:GBPAUD/1.83+FX:GBPNZD/1.91+FX:GBPJPY/144.5+FX_IDC:GBPEUR/1.15+FX:GBPCHF/1.31+FX:GBPUSD/1.31+FX:GBPCAD/1.71
Remember, I have provided a manual on how to build a currency strength meter. That’s what you will need to do first if you want to obtain the actual currency indexes other than just the indicator, which is just the visual cue to get you alerted when the slopes turn.
Once you’ve created your indexes via tradingview, you then apply a moving average to each index. Then apply the stochrsi 25 period to each index. For the macro trend, I make the same calculations, but the period of the MA is 25 instead of 4, while the stoch rsi is 125 periods vs 25 periods.
FINAL NOTE
This is a tool that should be interpreted as visual assistance, via the dashboard, to get that first cue when opposing micro slopes via the FX meter occur. However, you still need to check the technical context of the pair (levels marked, proj reached, etc.) but that first cue is a major time saver to constantly spot what's trending in FX. The permutations u can play with, as part of this script, are significant. You can tweak the timeframes you use, the periods of the moving averages, etc. I find the micro and macro trend combos when either a green or red signals is triggered the most reliable, with positions to be exploited via 15m and hourly under the right technical context.
