Trader Pressure Index (TPX)This is my take on the script by RedK
I kept the algorithm exactly the same, but changed the layout and the default look back period. Most important is that the resulting line, the TPX, is now a histogram with green and red staves.
To put the histogram on a logical place in the graph, I changed the way the control/dominance level is implemented, it now lowers or highers the whole graph, this way the zero level becomes the ‘no interest’ level.
I added two horizontal lines at a distance of 40 because I feel that this is sort of an oversold / overbought indication. In practice not very convincing, but provides a visual comparison.
In this layout I explain that grass is growing on bull hills peaking up behind the foreground and blood is dripping from the bear hills.
Enjoy.
Pesquisar nos scripts por "index"

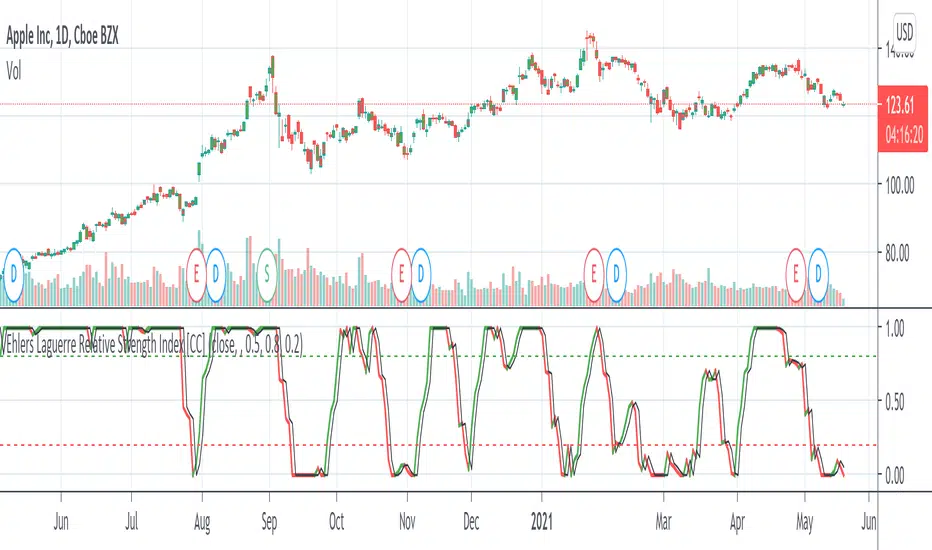
Ehlers Laguerre Relative Strength Index [CC]The Laguerre Relative Strength Index was created by John Ehlers and this is essentially his version of the RSI but I find that the buy and sell signals work better with his version as you can see. Buy when the line turns green and sell when the line turns red.
Let me know if there are any other indicators you want me to publish!
VWMACDV2 w/Intraday Intensity Index Histogram & VBCB Hello traders! In this script i tried to combine Kıvanç Özbilgiç's Volume Based Coloured Bars, Volume Weighted Macd V2 and Intraday Intensity Index developed by Dave Bostian and added to Tradingview by Kıvanç Özbilgiç. Let's see what we got here;
VBCB, Paints candlestick bars according to the volume of that bar. Period is 30 by default. If you're trading stocks, 21 should be better.
Volume Weighted Macd V2, "Here in this version; Exponential Moving Averages used and Weighted by Volume instead of using only vwma (Volume Weighted Moving Averages)." Says, Kıvanç Özbilgiç.
III, "A technical indicator that approximates the volume of trading for a specified security in a given day. It is designed to help track the activity of institutional block traders and is calculated by subtracting the day's high and low from double the closing price, divided by the volume and multiplied by the difference between the high and the low."
*Histogram of vwmacd changes color according to the value of III. (Green if positive, yellow if negative value)*
VWMACD also comes with the values of 21,13,3... Which are fibonacci numbers and that's how i use it. You can always go back to the good old 26,12,9.
Other options according to the fibonacci numbers might be= 21,13,5-13,8,3-13,8,5... (For shorter terms of trading)
Trading combined with the bollinger bands is strongly advised for both VWMACD and III. VBCB is just the candy on top :)
Enjoy!

TDI - Traders Dynamic Index + RSI Divergences + Buy/Sell SignalsTraders Dynamic Index + RSI Divergences + Buy/Sell Signals
Credits to LazyBear (original code author) and JustUncleL (modifications)..
I added some new features:
1- RSI Divergences (Original code from 'Divergence Indicator')
2- Buy/Sell Signals with alerts (Green label 'Buy' - Red label 'Sell')
3- Background colouring when RSI (Green line) crosses above MBL (yellow line)
- Buy and Sell Signals are generated using Dean Malone's method (The Author of the TDI indicator) as mentioned in his PDF: (( www.forexfactory.com )), according to:
** Buy (Green Label) = RSI > 50, Red line, & Yellow line
** Sell (Red Label) = RSI < 50, Red line, & Yellow line
- I found that the best quality long trades generated when RSI crosses above red line, yellow line and they are all above 50, and vice versa for sell trades.
-I figured out another way to generate Buy/Sell Signals when RSI crosses above the yellow line, and you can stay with the trade till RSI crosses under the yellow line (I made a background colouring for that to be easily detected)
Hope you all wonderful trades..
مؤلف المؤشر هو (Dean Malone)
وكتب LazyBear كوده في tradingview
وأضاف JustUncleL بعض التعديلات عليه
أضفت إليه بعض المزايا الأخرى المتمثلة في:
1- رصد انحرافات مؤشر القوة النسبية
2- إشارات بيع وشراء بناء على طريقة مؤلف المؤشر
3- تظليل بالأخضر للمنطقة التي يعبر فيها مؤشر القوة النسبية الخط الأوسط (الخط الأصفر)
إشارات البيع والشراء تكون كالتالي:
** الشراء عندما يكون مؤشر القوة النسبية فوق الخط الأحمر وفوق خط الـ 50 وفوق الخط الأصفر
** البيع عندما يكون مؤشر القوة النسبية تحت الخط الأحمر وتحت خط الـ 50 وتحت الخط الأصفر
** أفضل إشارات الشراء حينما يعبر مؤشر القوة النسبية فوق الخط الأحمر والأصفر، ويكونوا جميعا فوق خط الـ 50، والعكس بالنسبة لإشارات البيع
يمكن استخدام المؤشر في دخول صفقات متوسط المدى، وذلك عندما يعبر مؤشر القوة النسبية فوق الخط الأصفر (قمت بتظليل المنطقة بالأخضر لسهولة رصدها) والخروج من الصفقة إذا نزل مؤشر القوة النسبية عن الخط الأصفر،
يرجى التنبه إلى أن الدخول والخروج يكون بأسباب فنية مدروسة، والمؤشر يدعم قراراتك فقط، ولا يمكن الاعتماد عليه منفردا في تحديد نقاط الدخول أوالخروج.
تجارة موفقة لكم جميعا :)

Combo Backtest 123 Reversal & Perfomance indexThis is combo strategies for get a cumulative signal.
First strategy
This System was created from the Book "How I Tripled My Money In The
Futures Market" by Ulf Jensen, Page 183. This is reverse type of strategies.
The strategy buys at market, if close price is higher than the previous close
during 2 days and the meaning of 9-days Stochastic Slow Oscillator is lower than 50.
The strategy sells at market, if close price is lower than the previous close price
during 2 days and the meaning of 9-days Stochastic Fast Oscillator is higher than 50.
Second strategy
The Performance indicator or a more familiar term, KPI (key performance indicator),
is an industry term that measures the performance. Generally used by organizations,
they determine whether the company is successful or not, and the degree of success.
It is used on a business’ different levels, to quantify the progress or regress of a
department, of an employee or even of a certain program or activity. For a manager
it’s extremely important to determine which KPIs are relevant for his activity, and
what is important almost always depends on which department he wants to measure the
performance for. So the indicators set for the financial team will be different than
the ones for the marketing department and so on.
Similar to the KPIs companies use to measure their performance on a monthly, quarterly
and yearly basis, the stock market makes use of a performance indicator as well, although
on the market, the performance index is calculated on a daily basis. The stock market
performance indicates the direction of the stock market as a whole, or of a specific stock
and gives traders an overall impression over the future security prices, helping them decide
the best move. A change in the indicator gives information about future trends a stock could
adopt, information about a sector or even on the whole economy. The financial sector is the
most relevant department of the economy and the indicators provide information on its overall
health, so when a stock price moves upwards, the indicators are a signal of good news. On the
other hand, if the price of a particular stock decreases, that is because bad news about its
performance are out and they generate negative signals to the market, causing the price to go
downwards. One could state that the movement of the security prices and consequently, the movement
of the indicators are an overall evaluation of a country’s economic trend.
WARNING:
- For purpose educate only
- This script to change bars colors.

Dual Commodity Channel IndexDual Channel Commodity Index comprised of two single CCI indicators with all tweakable parameters: lengths and factoring.
ArtY Money Flow IndexThis is modification of built-in Money Flow Index with painting of oversold and overbought areas.

Volatility Index of Range Verification█ OVERVIEW
This is a volatility indicator created by extending concepts from Tushar Chande's Range Action Verification Index (RAVI).
█ CONCEPTS
This indicator constructs range of the RAVI indicator. It uses this range to build a histogram that represents how fast the range is changing, or a measure of volatility. A line is then constructed, either from a moving average or standard deviation depending on the settings that can serve as an action trigger.
█ INPUTS
• Fast MA Period: the period of the quickest moving average that is used to build the RAVI indicator line
• Slow MA Period: the period of the slowest moving average that is used to build the RAVI indicator line
• MA Type: the type of moving average to use, either Simple or Exponential
• Price Source: the type of price source to use; close, high, low, hlc3, etc.
• Lookback Period: how far back to construct the minimum and maximum of the range
• Standard Range: the standard range of the indicator. a smaller range will exaggerate differences in the columns, and vice-versa
• Volatility Period: the period used for the trigger line moving average
• Std. Deviation Mode?: Whether the trigger line will plot using a moving average or a multiple of Standard Deviation.
• Deviation Multiplier: How many deviations to use if the trigger line is in Std. Deviation Mode
Money Flow Index (MFI)User request. A tuned version of the built-in True Strength Index (TSI) indicator with the following options included:
MFI - Signal Histogram
MFI/Signal Crossovers
MFI/Signal Ribbon
Bands breakouts highlighting
Middle line crossovers background

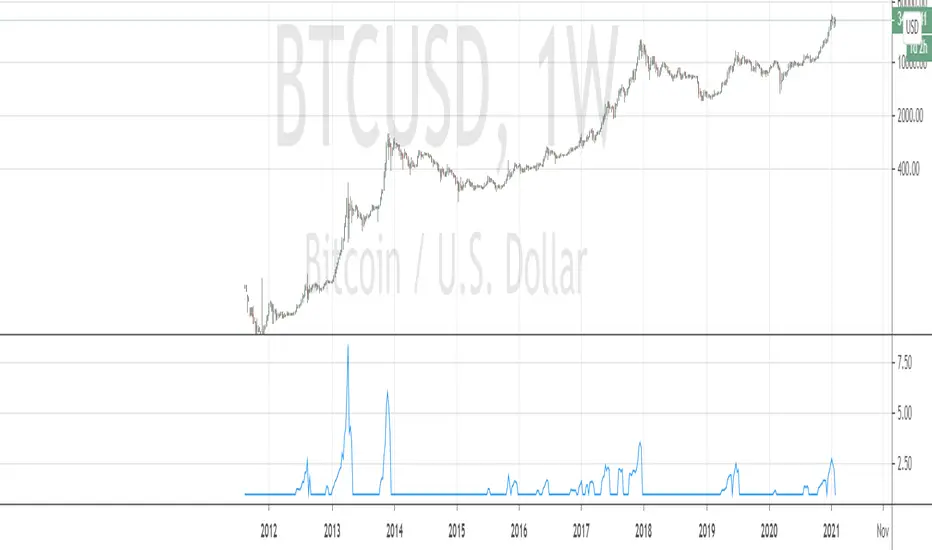
Bitcoin Bubble Strength IndexFor those who interested, here is a Bitcoin Strength Index source code. I used it on weekly chart with params (close,28). And only with Bitcoin . And only during bull run. It shows how far price went off the particular moving average during bubble run (i.e. being above BB). Weekly MA 28 is approximately daily ma 200.
The physical meaning of this indicator is to show current bull rally "speed".
(FINNIFTY) NIFTY Financial Service FreeFloat VolumeThis indicator is build keeping in mind how the Indian Market is formed - the free-float market capitalization concept
1) Considered new FINNIFTY - Nifty Financial Service index stocks according to NSE
2) Multiplied each stock Volume by its Weightage given in NSE Site every month End - means giving importance to volume by its weightage
3) Green Candle - Considered as +Ve Volume , Red Candle - Considered as -Ve Volume
4) Diff of +Ve Volume & -Ve Volume give clear picture market will go up or down
Note:- This Indicator work only for 15 Min time frame
Gives better results good Risk Reward used near Supp/Resistance
Combine with FINNIFTY Advance-Decline Ratio give confidence on the move
Eg:-
Bullish Scenario
Near Support, Volume Turned -Ve to +Ve, Adv /Dec of Fin Nifty >11/15
or combine any candle patterns( Pin Bar ) at Sup/Res or combine with Chart Pattern(Triangle/ Rectangle )
Bearish Scenario - Vice Versa to above

Equity Index Extended HoursHighlights the extended hours/Globex session for US Equity Index Futures.

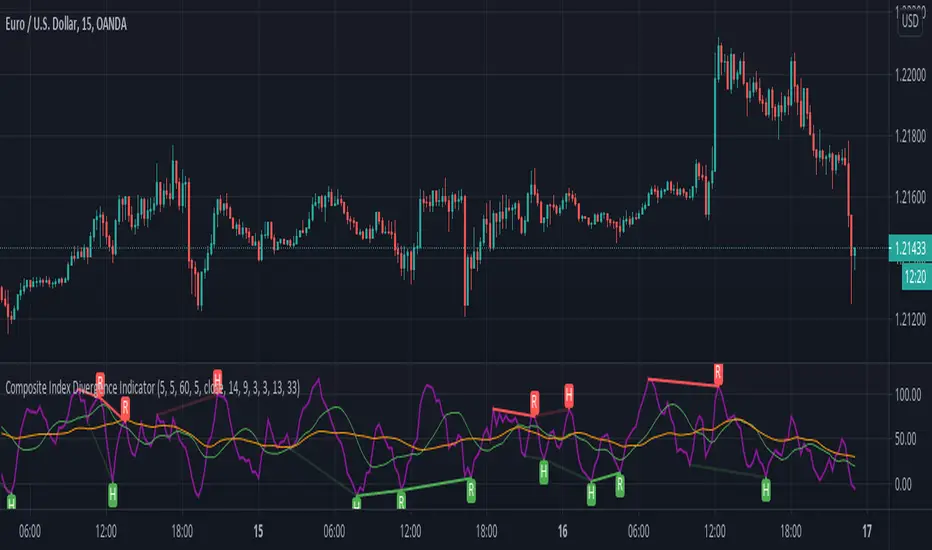
Composite Index Divergence IndicatorComposite Index by Constance Brown mixed with built-ins Divergence Indicator
useful indicator to find divergence
this script find divergence automatically for you
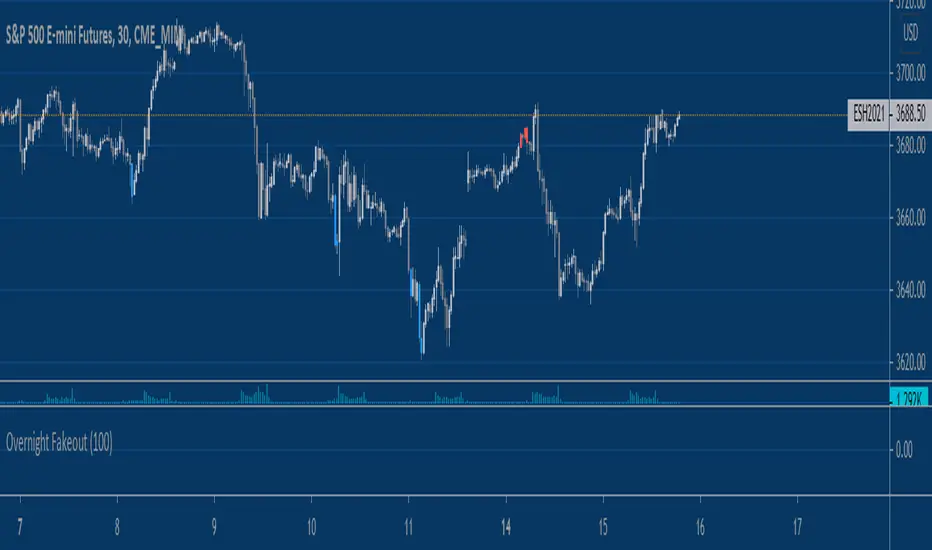
Equity Index Overnight FakeoutThis script highlights when price violates the highest high or lowest low within the user's selected lookback period, with the caveat that it occurs during the GLOBEX session. The script is designed to work exclusively with the trading hours for CME and CBOT Equity Index futures. I'm planning to make a more customizable version down the line.
My reasoning behind this very simple script is that the low liquidity and participation of the overnight session creates a tendency for moves at extremes to mean revert. Let me know what you think.

Probability of ATR Index (On-chart) [racer8]This indicator is an on-chart version of my other indicator called Probability of ATR Index (PAI) that was published on October 16th 2020.
PAI is an indicator I created that tells you the probability of current price moving a specified ATR distance over a specified number of periods into the future. It takes into account 4 variables: the ATR & the standard deviation of price, and the 2 parameters: ATR distance and # bars (time).
The formula is very complex so I will not be able to explain it without confusion arising.
The reason I created this PAI was because the other PAI does not show you levels. This one plots the price levels that correspond to your specified ATR distance. So it makes it easier for options traders to set their strangle or condor.
Enjoy 😀

Money Flow Index %bMoney flow index normalized via bollinger bands and %b, i.e. distance btw datapoints and bands

[blackcat] L2 Ehlers Adaptive Relative Strength IndexLevel: 2
Background
John F. Ehlers introuced Adaptive Relative Strength Index in his "Rocket Science for Traders" chapter 21 on 2001.
Function
The concept of taking a difference of lagging line from the original function to produce a leading function suggests extending the concept to moving averages. There is no direct theory for this, but it seems to work pretty well. If taking a 7-bar WMA of prices, that average lags the prices by 2 bars. If taking a 7-bar WMA of the first average, this second average is delayed another 2 bars. If taking the difference between the two averages and add that difference to the first average, the result should be a smoothed line of the original price function with no lag. Sure, Dr. Ehlers tried to use more lag for the second moving average, which
should produce a better predictive curve. However, remember the lesson of Chapter 3 of the book. An analysis curve cannot precede an event. You cannot predict an event before it occurs. If then taking a 4-bar WMA of the smoothed line to create a 1-bar lag, this lagging line becomes a signal when the lines cross. This is as close to an ideal indicator as we can get.
Key Signal
Predict ---> moving average fast line
Trigger ---> moving average slow line
Pros and Cons
100% John F. Ehlers definition translation of original work, even variable names are the same. This help readers who would like to use pine to read his book. If you had read his works, then you will be quite familiar with my code style.
Remarks
The 17th script for Blackcat1402 John F. Ehlers Week publication.
Readme
In real life, I am a prolific inventor. I have successfully applied for more than 60 international and regional patents in the past 12 years. But in the past two years or so, I have tried to transfer my creativity to the development of trading strategies. Tradingview is the ideal platform for me. I am selecting and contributing some of the hundreds of scripts to publish in Tradingview community. Welcome everyone to interact with me to discuss these interesting pine scripts.
The scripts posted are categorized into 5 levels according to my efforts or manhours put into these works.
Level 1 : interesting script snippets or distinctive improvement from classic indicators or strategy. Level 1 scripts can usually appear in more complex indicators as a function module or element.
Level 2 : composite indicator/strategy. By selecting or combining several independent or dependent functions or sub indicators in proper way, the composite script exhibits a resonance phenomenon which can filter out noise or fake trading signal to enhance trading confidence level.
Level 3 : comprehensive indicator/strategy. They are simple trading systems based on my strategies. They are commonly containing several or all of entry signal, close signal, stop loss, take profit, re-entry, risk management, and position sizing techniques. Even some interesting fundamental and mass psychological aspects are incorporated.
Level 4 : script snippets or functions that do not disclose source code. Interesting element that can reveal market laws and work as raw material for indicators and strategies. If you find Level 1~2 scripts are helpful, Level 4 is a private version that took me far more efforts to develop.
Level 5 : indicator/strategy that do not disclose source code. private version of Level 3 script with my accumulated script processing skills or a large number of custom functions. I had a private function library built in past two years. Level 5 scripts use many of them to achieve private trading strategy.

Delorean TDI - Traders Dynamic IndexTraders Dynamic Index (for the Delorean Strategy)
===============================================================
This indicator helps to decipher and monitor market conditions related to trend direction, market strength, and market volatility.
TDI has the following components:
* Green line = RSI Price line
* Red line = Trade Signal line
* Blue lines = Volatility Bands
* Yellow line = Market Base Line
Trend Direction - Immediate and Overall:
----------------------------------------------------
* Yellow line trends up and down generally between the lines 32 & 68. Watch for Yellow line to bounces off these lines for market reversal. Trade long when price is above the Yellow line, and trade short when price is below.
Market Strength & Volatility - Immediate and Overall:
----------------------------------------------------
* Immediate = Green Line -> Strong = Steep slope up or down.
* Immediate = Green Line -> Weak = Moderate to Flat slope.
* Overall = Blue Lines -> When expanding, market is strong and trending.
* Overall = Blue Lines -> When constricting, market is weak and in a range.
* Overall = Blue Lines -> When the Blue lines are extremely tight in a narrow range, expect an economic announcement or other market condition to spike the market.
Note Credit: LazyBear - altered for the Delorean Strategy

Ehlers Adaptive Commodity Channel Index V1 [CC]The Adaptive Commodity Channel Index V1 was created by John Ehlers (Rocket Science For Traders pgs 236-237) and this is the typical Commodity Channel formula with the introduction of adaptive lengths based on his earlier work with indicators such as the Mother of Adaptive Moving Averages. For longer term signals you would get a bullish signal when CCI is above 0 and a bearish signal when CCI falls below 0. For shorter term signals you would get a bullish signal when crosses over it's overbought level or when it crosses above it's oversold level or vice versa. I have included both signals to make it easier.
Let me know if you want a custom script written or if you have a special request for me

Ehlers Adaptive Relative Vigor Index [CC]The Adaptive Relative Vigor Index was created by John Ehlers (Cybernetic Analysis For Stocks And Futures pgs 140-141) and it does a pretty good job of capturing the peaks and valleys of the underlying data. There are several ways to read this particular indicator so for long term trades then buy when it goes above 0 and sell when it falls below 0 or for shorter term trades then buy when the indicator line turns green and sell when it turns red.
Let me know if there are other indicators you would like to see me publish or if you want something custom done!

[blackcat] L3 Price Positioning IndexLevel: 3
Background
Are you tired of traditional Japanese candlesticks? Do you want to try a new type of candle master chart?
Function
L3 Price Positioning Index is totally brand-new candle chart invented by myself. This main chart can provide effective resistance and support levels, and you can see where the price is running at any time. There are 3 key circle lines. Green circle line is used to indicate oversold support or breakthrough support levels; yellow circle line indicates the midline position where prices may pause; and red circle line indicates overbought resistance or breakthrough resistance levels.
There are two types of candlestick charts.
The first type candles are mid-to-long-term trend candles, navy represents an uptrend and the length of the candle represents a change in intensity; maroon represents a downward trend and the length of the candle represents a change in intensity. This trend candle is the effective support and resistance level of the second type short-term swing candle.
The second type candles are short-term candles fluctuate around the first medium- and long-term trend candles. The second short-term candle is divided into five colors: green means pump; fuchsia means retracement in the ascending process; yellow means bullish reversal signal; red means dump; blue means price rebound in the descending process.
Key Signal
THREE KEY LINES:
htop --> red circle line, overbought resistance or pump breakout threshold
hmid --> yellow circle line, price pause zone, sideways may happen here
hbot --> green circle line, oversold support or dump breakout threshold
MID-LONG TERM CANDLES:
x22,x33 --> navy for up and maroon for down trend, they are important support or resistance for short term price movements
SHORT TERM CANDLES:
1. bearreboun --> rebounce in down trend candle with blue color
2. pump --> up trend pump candle with green color
3. bullreversal --> bullish reversal candle with yellow color
4. dump --> bearish dump candle with red color
5. bullretra --> retracement in up trend candle with fuchsia
Pros and Cons
Pros:
1. Long term trend identification by three lines for overbought, oversold and breakouts
2. Mid term trend support and resistance with navy and maroon candles
3. Short term price behaviors are classified into 5 types of candles in blue, green, yellow, red and fuchsia
Cons:
I invent this to solve traditional JP candlestick shortcomings. If you find anything on Cons, just feedback to me for improvements.
Remarks
Brand-new Candle System invented by myself
Readme
In real life, I am a prolific inventor. I have successfully applied for more than 60 international and regional patents in the past 12 years. But in the past two years or so, I have tried to transfer my creativity to the development of trading strategies. Tradingview is the ideal platform for me. I am selecting and contributing some of the hundreds of scripts to publish in Tradingview community. Welcome everyone to interact with me to discuss these interesting pine scripts.
The scripts posted are categorized into 5 levels according to my efforts or manhours put into these works.
Level 1 : interesting script snippets or distinctive improvement from classic indicators or strategy. Level 1 scripts can usually appear in more complex indicators as a function module or element.
Level 2 : composite indicator/strategy. By selecting or combining several independent or dependent functions or sub indicators in proper way, the composite script exhibits a resonance phenomenon which can filter out noise or fake trading signal to enhance trading confidence level.
Level 3 : comprehensive indicator/strategy. They are simple trading systems based on my strategies. They are commonly containing several or all of entry signal, close signal, stop loss, take profit, re-entry, risk management, and position sizing techniques. Even some interesting fundamental and mass psychological aspects are incorporated.
Level 4 : script snippets or functions that do not disclose source code. Interesting element that can reveal market laws and work as raw material for indicators and strategies. If you find Level 1~2 scripts are helpful, Level 4 is a private version that took me far more efforts to develop.
Level 5 : indicator/strategy that do not disclose source code. private version of Level 3 script with my accumulated script processing skills or a large number of custom functions. I had a private function library built in past two years. Level 5 scripts use many of them to achieve private trading strategy.

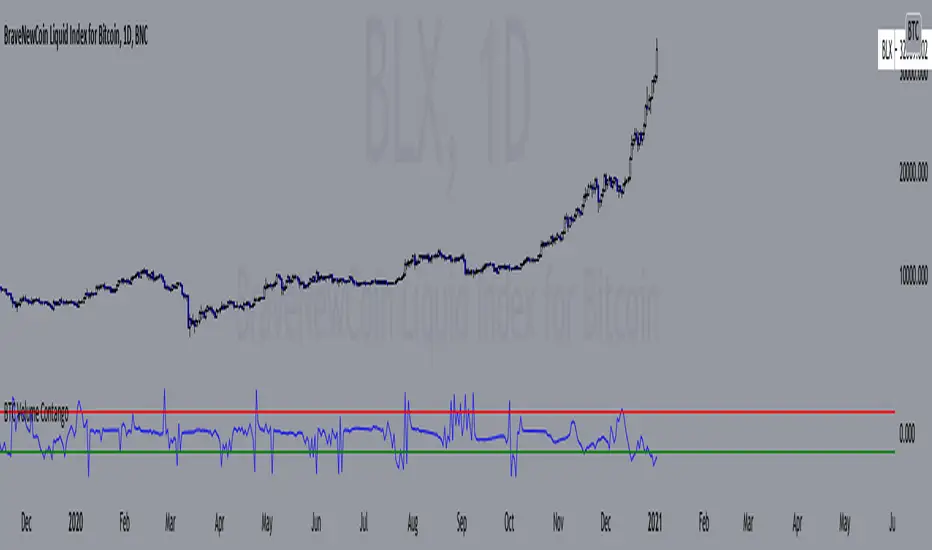
BTC Volume Contango IndexBased on my previous script "BTC Contango Index" which was inspired by a Twitter post by Byzantine General:
This is a script that shows the contango between spot and futures volumes of Bitcoin to identify overbought and oversold conditions. When a market is in contango, the volume of a futures contract is higher than the spot volume. Conversely, when a market is in backwardation, the volume of the futures contract is lower than the spot volume.
The aggregate daily volumes on top exchanges are taken to obtain Total Spot Volume and Total Futures Volume. The script then plots (Total Futures Volume/Total Spot Volume) - 1 to illustrate the percent difference (contango) between spot and futures volumes of Bitcoin. This data by itself is useful, but because aggregate futures volumes are so much larger than spot volumes, no negative values are produced. To correct for this, the Z-score of contango is taken. The Z-score (z) of a data item x measures the distance (in standard deviations StdDev) and direction of the item from its mean (U):
Z-score = (x - U) / StDev
A value of zero indicates that the data item x is equal to the mean U, while positive or negative values show that the data item is above or below the mean (x Values of +2 and -2 show that the data item is two standard deviations above or below the chosen mean, respectively, and over 95.5% of all data items are contained within these two horizontal references). We substitute x with volume contango C, the mean U with simple moving average ( SMA ) of n periods (50), and StdDev with the standard deviation of closing contango for n periods (50), so the above formula becomes: Z-score = (C - SMA (50)) / StdDev(C,50).
When in contango, Bitcoin may be overbought.
When in backwardation, Bitcoin may be oversold.
The current bar calculation will always look incorrect due to TV plotting the Z-score before the bar closes.