5 Day ADR ICT Intraday TrackerPretty self explanatory, this indicator tracks todays current range as a % of the 5 Day ADR.
This is most useful for finding entries and looking for exits intraday, ie: how much hypothetical room is there for a trade to run? looking for entries in yellow and orange zones, exiting in blue once the ADR is reached etc.
Reset variable should be used for the end of day close. For forex on Oanda its 1700. Probably a way to do this programatically, if its obvious let me know and i can update it.
Can be set to clip output above 110% once the daily ADR has been fulfilled - this can be turned on or off.
Experimental mode for finding consolidations, based on the ADR for each day not been fulfilled and contracting. can be good for finding pending range expansion.
Code is pretty ugly, feel free to tweak.
current known issues: Indicator doesnt work for many non forex pairs, due to coding laziness. Indicator does not work on 1 minute timeframe.
Pesquisar nos scripts por "ict"

Sunmool's Silver Bullet Model FinderICT Silver Bullet Model Indicator - Complete Guide
📈 Overview
The ICT Silver Bullet Model indicator is a supplementary tool for utilizing ICT's (Inner Circle Trader) market structure analysis techniques. This indicator detects institutional liquidity hunting patterns and automatically identifies structural levels, helping traders analyze market structure more effectively.
🎯 Core Features
1. Structural Level Identification
STL (Short Term Low): Recent support levels formed in the short term
STH (Short Term High): Recent resistance levels formed in the short term
ITL (Intermediate Term Low): Stronger support levels with more significance
ITH (Intermediate Term High): Stronger resistance levels with more significance
2. Kill Zone Time Display
London Kill Zone: 02:00-05:00 (default)
New York Kill Zone: 08:30-11:00 (default)
These are the most active trading hours for institutional players where significant price movements occur
3. Smart Sweep Detection
Bear Sweep (🔻): Pattern where price sweeps below lows then recovers - Simply indicates sweep occurrence
Bull Sweep (🔺): Pattern where price sweeps above highs then declines - Simply indicates sweep occurrence
Important: Sweep labels only mark liquidity hunting locations, not directional bias.
🔧 Configuration Parameters
Basic Settings
Sweep Detection Lookback: Number of candles for sweep detection (default: 20)
Structure Point Lookback: Number of candles for structural point detection (default: 10)
Sweep Threshold: Percentage threshold for sweep validation (default: 0.1%)
Time Settings
London Kill Zone: Active hours for London session
New York Kill Zone: Active hours for New York session
Visualization Settings
Customizable colors for each level type
Enable/disable alert notifications
📊 How to Use
1. Chart Setup
Most effective on 1-minute to 1-hour timeframes
Recommended for major currency pairs (EUR/USD, GBP/USD, etc.)
Also applicable to cryptocurrencies and indices
2. Signal Interpretation
🔻 Bear Sweep / 🔺 Bull Sweep Labels
Simply indicate liquidity hunting occurrence points
Not directional bias indicators
Reference for understanding overall context on HTF
🟢 Silver Bullet Long (Huge Green Triangle)
After Bear Sweep occurrence
Within Kill Zone timeframe
Current price positioned above swept level
→ Actual BUY entry signal
🔴 Silver Bullet Short (Huge Red Triangle)
After Bull Sweep occurrence
Within Kill Zone timeframe
Current price positioned below swept level
→ Actual SELL entry signal
3. Risk Management
Use swept levels as stop-loss reference points
Approach signals outside Kill Zone hours with caution
Recommended to use alongside other technical analysis tools
💡 Trading Strategies
Silver Bullet Strategy
Preparation Phase: Monitor charts 30 minutes before Kill Zone
Sweep Observation: Identify liquidity hunting points with 🔻🔺 labels (reference only)
Entry: Enter ONLY when huge triangle Silver Bullet signal appears within Kill Zone
Take Profit: Target opposite structural level or 1:2 reward ratio
Stop Loss: Beyond the swept level
Important: Small sweep labels are NOT trading signals!
Multi-Timeframe Approach
Step 1: HTF (Higher Time Frame) Sweep Reference
Observe 🔻🔺 sweep labels on 4-hour and daily charts
Reference only sweeps occurring at major structural levels
HTF sweeps are used to identify liquidity hunting points
Reference only, not for directional bias
Step 2: Transition to LTF (Lower Time Frame)
Move to 15-minute, 5-minute, and 1-minute charts
Analyze LTF with reference to HTF sweep information
Use STL, STH, ITL, ITH for precise entry point identification
Structural levels on LTF are the core of actual trading decisions
Only huge triangle (Silver Bullet) signals are actual entry signals
Recommended Usage
Identify overall sweep occurrence points on HTF (🔻🔺 labels)
Use this indicator on LTF to identify structural levels
Reference only huge triangle signals for actual trading during Kill Zone
Small sweep labels (🔻🔺) are for reference only, not entry signals
📋 Information Table Interpretation
Real-time information in the top-right table:
Kill Zone Status: Current active session status
Level Counts: Number of each structural level type
⚠️ Important Disclaimers
Backtesting results do not guarantee future performance
Exercise caution during high market volatility periods
Always apply proper risk management
Recommend comprehensive analysis with other analytical tools
🎓 Learning Resources
Study original ICT concepts through free YouTube educational content
Research Market Structure analysis techniques
Optimize through backtesting for personal use
🔬 Technical Implementation
Algorithm Logic
Pivot Point Detection: Uses TradingView's built-in pivot functions to identify swing highs and lows
Classification System: Automatically categorizes levels based on recent price action frequency
Sweep Validation: Confirms legitimate sweeps through price action analysis
Time-Based Filtering: Prioritizes signals during institutional active hours
Performance Optimization
Efficient array management prevents memory overflow
Dynamic level cleanup maintains chart clarity
Real-time calculation ensures minimal lag
🛠️ Customization Tips
Adjust lookback periods based on market volatility
Modify kill zone times for different market sessions
Experiment with sweep threshold for different instruments
Color-code levels according to personal preference
📈 Expected Outcomes
When properly implemented, this indicator can help traders:
Identify high-probability reversal points
Time entries with institutional flow
Reduce false signals through kill zone filtering
Improve risk-to-reward ratios
This indicator automates ICT's concepts into a user-friendly tool that can be enhanced through continuous learning and practical application. Success depends on understanding the underlying market structure principles and combining them with proper risk management techniques.

IFVG [#]ICT Concepts by shulktrades
Beginner Concept
IFVG — Inverse Fair Value Gap
Description:
The IFVG indicator identifies and displays Inverse Fair Value Gaps (IFVGs) — price imbalances that have been traded through and closed, representing a complete rebalancing of a prior Fair Value Gap (FVG).
It is designed for traders studying ICT-based market structure and algorithmic delivery concepts, offering a consistent, precise way to visualize these “flipped” gaps directly on their charts.
This indicator does not generate trading signals, alerts, or entries. It serves as a visual confluence and analytical tool, helping traders recognize when a fair value gap has been invalidated and transformed into an IFVG.
How It Works (Conceptually)
Gap Detection
The script tracks consecutive candle structures to identify FVGs — three-candle formations where a price void exists between the first and third candles.
Inverse Confirmation
When price fully closes through a detected FVG (meaning both gap boundaries have been traded and settled), the imbalance is flagged as neutralized, and the script converts it into an Inverse Fair Value Gap (IFVG).
Box Drawing Logic
Each IFVG is displayed as a visual box drawn from the displacement range of the candle that confirmed the closure.
Boxes extend either to the current bar or a user-defined candle limit, providing flexibility for how long historical IFVGs remain visible.
This ensures chart clarity while maintaining accurate visual context of algorithmic rebalancing.
Unique Implementation Features
The IFVG indicator differs from typical open-source FVG tools through its structural logic and visualization method:
Higher-Timeframe Candle Tracking
It can reference higher-timeframe (HTF) candle data to display IFVGs originating from larger structures (for example, showing H1 or H4 inverse gaps on a lower timeframe).
This alignment with HTF context gives traders a broader view of algorithmic delivery behavior.
Specific Timeframe Tracking (Future Integration)
The underlying framework supports selectable timeframe inputs for future updates, allowing users to define which candle data to track for IFVG formation — ensuring full adaptability across multiple timeframe models.
Dynamic End Conditions
Unlike static or persistent zone indicators, each IFVG box can end at the current time or after a custom candle limit.
This avoids overcrowding the chart while maintaining accurate historical context.
Accurate Visual Rendering
The drawing logic ensures that every IFVG box is aligned precisely to candle bodies and wicks, scaling correctly across all chart resolutions.
This eliminates overlap, offset, or visual drift common in generic FVG/IFVG implementations.
How to Use It
Apply the indicator to visualize confirmed Inverse Fair Value Gaps on your chart.
Use the highlighted zones as contextual confluence, not entry triggers.
Adjust settings for box duration and visibility according to your preferred analysis depth.
Integrate with other ICT-based concepts such as liquidity sweeps, order blocks, and displacement analysis for deeper structural insight.
Originality and Purpose
The IFVG indicator is original in its:
Strict focus on confirmed, traded-through FVGs only.
Use of HTF candle tracking for broader algorithmic context.
Dynamic end-of-zone control, determined by user preference or real-time progression.
Accurate visual construction of zones directly tied to candle confirmation logic.
These design choices make it distinct from generic FVG/IFVG indicators and justify its closed-source status, as its logic, rendering precision, and adaptive framework go beyond simple stylistic replication of public scripts.
Important Notes
For educational and analytical use only.
Does not issue alerts, entries, or trade recommendations.
Best suited for traders familiar with ICT delivery and structure concepts.
Always apply personal risk management and confirm bias independently.

Sunmool's NY Lunch Model BacktestingICT NY Lunch Model Backtesting (12:00–13:00 NY) 🗽🍔
This research indicator tests an ICT narrative using the New York lunch window (12:00–13:00 America/New_York). It records that hour’s high/low and measures, during the post-lunch session (default 13:00–16:00), how often:
⬆️ If the afternoon trends up, the Lunch Low gets swept first.
⬇️ If the afternoon trends down, the Lunch High gets swept first.
It reports these as conditional probabilities, not trade signals. 📈
👀 What it shows
🟦 Lunch Range box (toggle): high/low from 12:00–13:00 NY
🔻🔺 Sweep signals (bar-anchored)
Low sweep: triangle below bar + optional “L”
High sweep: triangle above bar + optional “H”
🧱 Optional small box wrapping the swept candle
📊 Stats table (top-right)
P(L-swept | Up) — % of Up-days where Lunch Low was swept
P(H-swept | Down) — % of Down-days where Lunch High was swept
🔁 Contradictions + sample sizes (Up-days / Down-days)
🎯 Direction logic (Up/Down)
Anchor: 13:00 open (pmOpen) ⏰
Threshold: ATR × multiple or % from 13:00
Close ≥ pmOpen + threshold → Up-day
Close ≤ pmOpen − threshold → Down-day
Tiny moves under the threshold are ignored to reduce noise 🧹
⚙️ Inputs
🌐 Timezone: America/New_York (DST handled)
🍽️ Lunch window: 1200–1300
🕓 Post-lunch window: default 1300–1600 (try 17:00/20:00 for sensitivity)
📐 Trend threshold: ATR / Percent (with length/multiple or % level)
📅 Weekdays-only toggle (FX/Equities style)
👁️ Display toggles: Lunch box / sweep arrows / sweep text / sweep candle box / stats table
🔔 TF hint when chart TF > 15m
🧭 How to use
Use 5–15m charts for accurate lunch range capture.
Scroll ~1 year for meaningful samples.
Run sensitivity checks: vary ATR/% thresholds and the post-lunch end time.
For crypto, compare with vs without weekends. 🚀
🧠 Reading the results
High P(L-swept | Up) with a solid Up-day count ⇒ on up afternoons, lunch low is often swept.
High P(H-swept | Down) ⇒ on down afternoons, lunch high is often swept.
Lower Contradictions = cleaner tendency.
Remember: this is a probabilistic tendency, not a rule. 🎲
📝 Notes & limits
All markers (arrows, text, sweep boxes) are bar-anchored; the lunch range box is a research overlay you can toggle.
Real-time vs historical bar building can differ—interpret on bar close. 🔒

ICT Premium/Discount Zones [Exponential-X]Premium/Discount Zones - Visual Market Structure Tool
Overview
This indicator helps traders visualize premium and discount price zones based on recent market structure. It automatically identifies swing highs and lows within a specified lookback period and divides the price range into three key areas: Premium Zone, Equilibrium, and Discount Zone.
What This Indicator Does
The script continuously monitors price action and calculates:
Highest High and Lowest Low within the lookback period
Equilibrium Level - the midpoint between the swing high and low
Premium Zone - the area from equilibrium to the swing high (typically viewed as relatively expensive price levels)
Discount Zone - the area from the swing low to equilibrium (typically viewed as relatively cheap price levels)
Core Calculation Method
The indicator uses pivot point logic to identify significant swing highs and lows based on the pivot strength parameter. It then calculates the highest high and lowest low over the specified lookback period. The equilibrium is computed as the arithmetic mean of these two extremes, creating a fair value reference point.
The zones are dynamically updated as new price data becomes available, ensuring the visualization remains relevant to current market conditions.
Key Features
Dynamic Zone Detection
Automatically adjusts zones based on recent price action
Uses customizable lookback period for flexibility across different timeframes
Employs pivot strength parameter to filter out minor price fluctuations
Visual Clarity
Color-coded zones for easy identification (red for premium, green for discount)
Optional equilibrium line display
Adjustable zone label placement
Customizable color schemes to match your charting preferences
Alert Capabilities
Alerts when price enters the premium zone
Alerts when price enters the discount zone
Alerts when price returns to equilibrium
Helps traders monitor key zone interactions without constant chart watching
Customization Options
Adjustable lookback period (5-500 bars)
Configurable pivot strength for swing detection (1-20 bars)
Control over box extension into the future
Toggle labels and equilibrium line on/off
Full color customization for all visual elements
How to Use This Indicator
Setup
Add the indicator to your chart
Adjust the lookback period to match your trading timeframe (shorter for intraday, longer for swing trading)
Set pivot strength to filter out noise (higher values for major swings, lower for more frequent updates)
Customize colors and labels to your preference
Interpretation
Premium Zone: Price trading here may indicate potential resistance or selling opportunities when aligned with other technical factors
Discount Zone: Price trading here may indicate potential support or buying opportunities when aligned with other technical factors
Equilibrium: Acts as a fair value reference point where price often consolidates or reacts
Trading Applications
This tool works well when combined with other forms of analysis such as:
Trend identification indicators
Volume analysis
Support and resistance levels
Price action patterns
Market structure analysis
Important Considerations
This indicator identifies zones based purely on historical price data
Premium and discount zones are relative to the recent lookback period
The effectiveness varies across different market conditions and timeframes
Should be used as part of a comprehensive trading strategy, not in isolation
Past price structure does not guarantee future price behavior
Technical Details
Calculation Method
Uses Pine Script's ta.pivothigh() and ta.pivotlow() functions for swing detection
Employs ta.highest() and ta.lowest() for range calculation
Updates dynamically with each new bar
Draws zones using box objects for clear visual representation
Performance Optimization
Efficiently manages box and line objects to minimize resource usage
Uses conditional plotting to reduce unnecessary calculations
Limited to essential visual elements for chart clarity
Timeframe Compatibility
This indicator works on all timeframes but the recommended settings vary:
1-5 minute charts: Lookback period 10-20, Pivot strength 3-5
15-60 minute charts: Lookback period 20-50, Pivot strength 5-10
Daily charts: Lookback period 50-100, Pivot strength 10-15
Weekly charts: Lookback period 20-50, Pivot strength 5-10
Adjust these values based on the volatility of your specific instrument.
Limitations and Considerations
What This Indicator Does NOT Do
Does not provide buy or sell signals on its own
Does not predict future price movements
Does not account for fundamental factors or market events
Does not guarantee profitability or accuracy
Market Condition Awareness
In strong trending markets, price may remain in premium or discount zones for extended periods
During ranging conditions, price typically oscillates between zones more predictably
High volatility can cause frequent zone recalculations
Low volatility may result in narrow zones with limited practical use
Risk Considerations
Premium and discount are relative concepts, not absolute values
What appears as a discount zone may continue lower in a downtrend
What appears as a premium zone may continue higher in an uptrend
Always use proper risk management and position sizing
Consider multiple timeframe analysis for context
Version Information
This indicator is written in Pine Script v6, ensuring compatibility with the latest TradingView features and optimal performance.
Final Notes
This tool is designed to enhance your market analysis by providing a clear visual representation of premium and discount price zones. It should be used as one component of a well-rounded trading approach that includes proper risk management, multiple forms of analysis, and realistic expectations about market behavior.
The concept of premium and discount zones is rooted in auction market theory and the idea that price oscillates around fair value. However, traders should understand that these zones are interpretive tools based on historical data and do not constitute trading advice or predictions about future price action.
Remember to backtest any strategy using this indicator on historical data before applying it to live trading, and always trade responsibly within your risk tolerance.
Disclaimer: The information provided by this indicator is for educational and informational purposes only. It does not constitute financial advice, investment advice, trading advice, or any other sort of advice. Always conduct your own research and consult with qualified financial professionals before making trading decisions.

ICT Bias (Dynamic Timeframe By Hayk Trading)This indicator designed to offer context, not signals, helping traders stay aligned with the broader directional flow of the market.
Bias States:
Bullish: Market conditions favor higher prices during the trading day.
Bearish: Market conditions favor lower prices during the trading day.
Neutral: No clear directional advantage is present.
This tool is intended to support:
Directional filtering for intraday trading
Improved trade discipline
Reduced overtrading in unfavorable conditions
The Daily Bias does not predict price, provide entries, or guarantee outcomes. It simply highlights the prevailing directional environment for the session.
Use it as a decision-support tool, not as a standalone trading system.

ICT POIs By DSIndicator to identify POI's like OB/FVG and SCOB. It also have a different ATR based filters and inside bar logic for OB detection


ICT Quant-Core: Liquidity Intelligence [Dual-Engine]🔥 THE ULTIMATE LIQUIDITY FILTERING ENGINE
Most SMC traders lose money because they "catch falling knives" on every local wick. This algorithm solves this problem by using DUAL-CORE logic and a signal quality scoring system.
This is no ordinary pivot indicator.
⚙️ HOW DOES IT WORK? (DUAL-CORE LOGIC)
The algorithm analyzes the market on two levels simultaneously:
1️⃣ MACRO CORE (Lookback 50 - "WHALE 🐋")
Tracks key levels from recent weeks/months.
This is where institutions build their positions.
Signals from this core have the highest priority (Score 10/10).
2️⃣ LOCAL CORE (Lookback 20 - "ROACH 🐟")
Tracks internal market structure and noise.
Signals are filtered by the Main Trend. If the trend is down, Local Longs are marked as "TRAP."
🧠 SMART FILTERS (QUANT LAYERS)
Instead of entering on every line touch, the script requires confirmation:
✅ RECLAIM LOGIC: Price must close back above/below the liquidity level (Swing Failure Pattern).
✅ RVOL FILTER: Requires relative volume > 1.2x the average (institutional track).
✅ SCORING SYSTEM (0-10): Each signal receives a score.
- 10/10: Macro Grab in line with the trend + high volume.
- 3/10: Local Grab against the trend (risky).
📊 ANALYTICAL DASHBOARD
In the lower right corner, you'll find the "Command Center":
- Trend Status (Distribution/Accumulation)
- Whale's Last Move (Price and Direction)
- Current Tactics (e.g., "Ignore Longs, Search for Shorts")
- Filter Status (RSI, Volume, Reclaim)
🚀 HOW TO USE IT?
1. Set the H4 timeframe.
2. Wait for a signal with a rating > 7/10.
3. Ignore "Fish/Local" signals (small icons) if they contradict the Dashboard color.
4. Entry occurs only after the candle closes (Reclaim).


ICT/SMC Holy GrailThe Holy Grail, with its backtesting feature to check win rates, is all you need to do when placing orders!

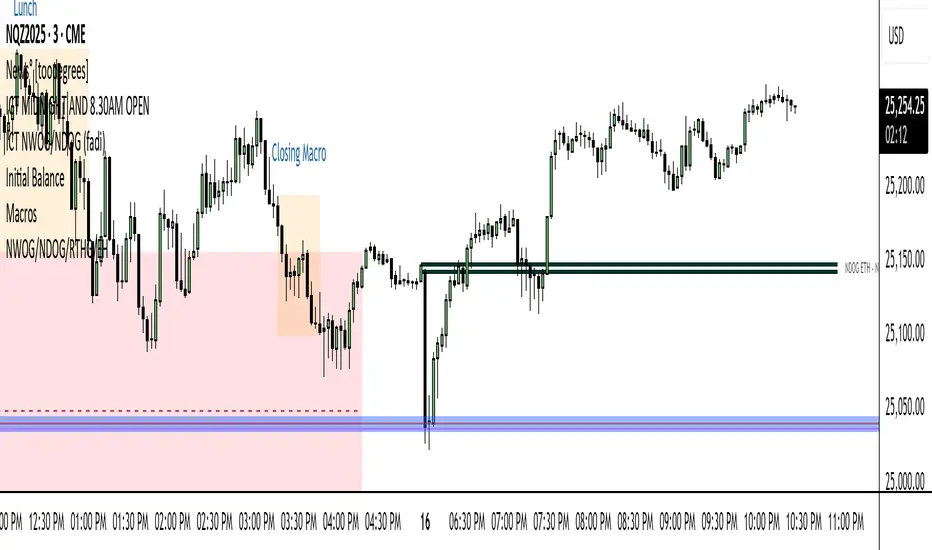
ICT NWOG/NDOG + Key Time and Price LevelsShows new day opening gaps and new week opening gaps, with custom settings to show past gaps
Shows time and price levels of midnight, 7:30am, and 1:30pm

ICT Macro Slot Algo Event📊 Overview
A powerful multi-timeframe trading indicator that combines Institutional Macro Session Tracking identify optimal trading windows throughout the day. This tool helps traders align with institutional flow patterns and algorithmic activity across major sessions.
🎯 Key Features
1. Macro Algo Event Sessions
Tracks 6 key institutional time windows during NY Session:
NY Sweep (08:50-09:10) - Opening balance flows
Silver Bullet #1 (09:50-10:10) - First major macro move
Silver Bullet #2 (10:50-11:10) - Second chance/retest opportunity
Lunch Macro (11:50-12:10) - Mid-day repositioning
Post-Lunch Rebalance (13:10-13:40) - Post-lunch adjustments
NY Closing Macros (15:15-15:45) - End-of-day flows

ICT Macro Slot Algo Event📊 Overview
A powerful multi-timeframe trading indicator that combines Institutional Macro Session Tracking to identify optimal trading windows throughout the day. This tool helps traders align with institutional flow patterns and algorithmic activity across major sessions.
🎯 Key Features
1. Macro Algo Event Sessions
Tracks 6 key institutional time windows during NY Session:
NY Sweep (08:50-09:10) - Opening balance flows
Silver Bullet #1 (09:50-10:10) - First major macro move
Silver Bullet #2 (10:50-11:10) - Second chance/retest opportunity
Lunch Macro (11:50-12:10) - Mid-day repositioning
Post-Lunch Rebalance (13:10-13:40) - Post-lunch adjustments
NY Closing Macros (15:15-15:45) - End-of-day flows

ICT FVG Signal
During the silver bullet window, it clearly highlights when and in which direction to look for FVGs. When a signal appears, nearby FVGs or iFVGs often provide excellent entry opportunities. Feel free to share your thoughts and experiences.

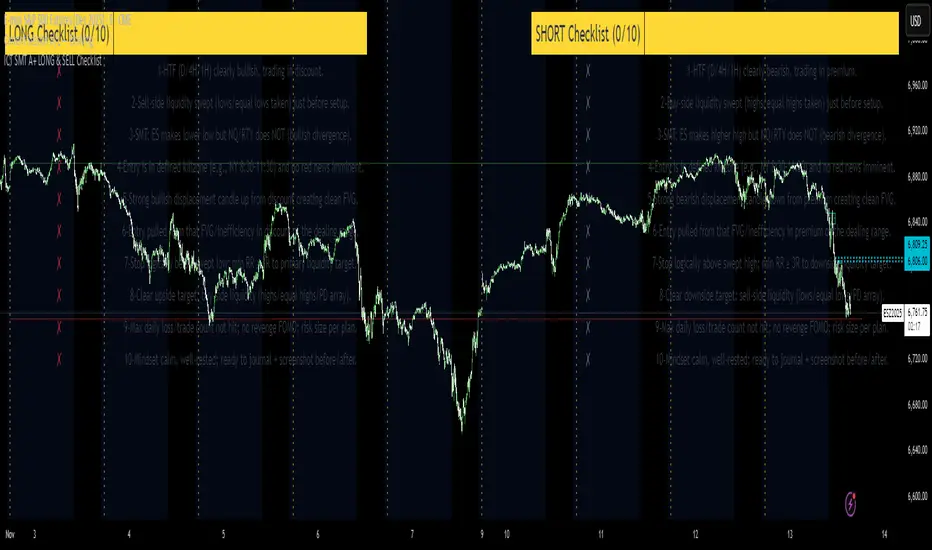
ICT SMT A+ LONG & SELL ChecklistTrade Checklist. Once all items checked color changes from yellow to green.
[ICT V5 HOD/LOD]Adaptive Cutoff Logic:
Automatically adjusts HOD/LOD calculation cutoff based on the instrument type (Forex or Indices).
Gap Correction (1m Base):
Detects and corrects overnight gaps for accurate HOD/LOD levels.
Session Band (Optional):
Visual 09/10:00–12:00 range highlighting, customizable by symbol type.
Smart Reset System:
Automatically resets all drawings and session markers at the start of each new trading day.
Customizable Appearance:
Choose colors, line thickness, transparency, and how many past sessions to keep.
Hide After Noon (Optional):
Clean chart mode that hides daily HOD/LOD lines after 12:00 local time.

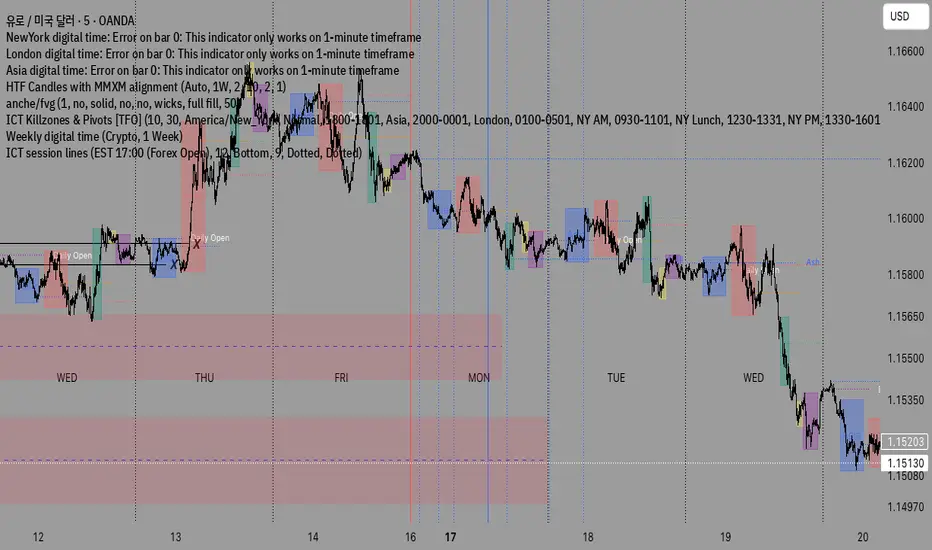
ICT killzones Magic Makers
TIMEZONE (ESSENTIAL)
- Use Exchange Timezone (symbol):
- ON = uses the asset's native timezone (auto DST)
- OFF = uses the fixed timezone set in "Fixed Timezone" (e.g., America/New_York)
- This realigns Midnight, NY 8:30, and Sessions on the chart.
MIDNIGHT & NY 8:30
- Midnight: anchors the day's price (above = buyer bias; below = seller bias, in context).
- NY 8:30: institutional flow/volatility window; often sets the session's pace.
- Optional: enable "History" and "Past-day Labels" to compare days.
SESSIONS
- Enable only what you use (Asia, CBDR, London, NY, LC) and adjust times.
- If the chart gets heavy, temporarily turn "Show Boxes" OFF.
MAKERS LEVELS (VALUE/DECISION REGIONS)
- Turn on "Project Makers Levels (±) " and select per session.
- Projects: key levels x the session's range (both directions).
- Uses: targets, partials, breather/reversal. Note: CBDR-based projections are often well respected.
DEVIATIONS (± MULTIPLES OF THE SESSION RANGE)
How to configure:
- Turn "Show Deviations" ON.
- Set "Number of Deviations" (how many multiples to project).
- Choose which sessions get deviations (Asia, CBDR, London, NY, LC).
Practical read:
- Targets for continuation (range expansion) or breather/fade zones when price is extended.
- Combine with structure (HH/HL/LH/LL), Midnight/NY 8:30, FVGs, OBs, and visible liquidity (equal highs/lows).
Pro tip:
- The more impulsive the break of the session range, the higher the chance of reaching ±1x; ±2x and beyond need flow confirmation.
ROUND NUMBERS & WATERMARK (OPTIONAL)
- Round Numbers: price-step lines (e.g., every 500 ticks).
- Watermark: custom text and/or Ticker+Timeframe.
PERFORMANCE
- If heavy: disable unused sessions, Text/Pips in boxes, or "Show Boxes".
ICT Largest Midnight–00:30 FVG (NY, 1 per day) — FIXEDmarks out the first and largest fvg on the 1 min chart from midnight open until 12:30 am est

HTF Candle Mean ThresholdICT Mean Threshold concept. Any time frame find the center of any Higher Time Frame candle. I made this because I couldn't find one under this name.

ICT Killzones_SAIFKill Zones Shading with High and Low levels highlight for required market sessions
