Sri_Momentum Sri_Momentum - Advanced Oscillator for Market Trends
Description
The Sri_Momentum is a powerful momentum-based oscillator that helps traders analyze price trends and market strength. This indicator utilizes two simple moving averages (SMA) to calculate the Awesome Oscillator (AO) and a signal line for trend confirmation. The histogram dynamically changes color based on the crossover between AO and the signal line, providing clear bullish and bearish signals.
✅ Awesome Oscillator (AO) Calculation - Measures market momentum using a fast and slow SMA.
✅ Signal Line for Confirmation - A smoothed moving average of AO to help traders identify trend shifts.
✅ Dynamic Histogram Color Coding - Easy-to-interpret histogram with four colors indicating trend strength and direction.
✅ Custom Sensitivity Input - Adjusts the AO calculation to fine-tune responsiveness.
✅ Zero Line Reference - A baseline to differentiate bullish and bearish momentum.
How It Works
Fast SMA (default: 5-period) and Slow SMA (default: 34-period) are calculated based on the average of high and low prices.
AO (Awesome Oscillator) = (Fast SMA - Slow SMA) * Sensitivity
Signal Line = Smoothed AO using a 7-period SMA
Histogram Color Logic:
🔵 Strong Bullish → AO > Signal & AO ≥ 0 (Green)
🔴 Weak Bullish → AO > Signal & AO < 0 (Light Red)
🟢 Weak Bearish → AO < Signal & AO ≥ 0 (Light Green)
🔥 Strong Bearish → AO < Signal & AO < 0 (Dark Red)
How to Use the Sri_Momentum Indicator
📌 Bullish Momentum → When AO crosses above the Signal Line, and the histogram turns green.
📌 Bearish Momentum → When AO crosses below the Signal Line, and the histogram turns red.
📌 Trend Strength → Darker colors indicate stronger trends; lighter colors suggest weaker trends.
📌 Zero Line Crossover → If AO moves above zero, it suggests bullish strength; if below zero, bearish control.
Pesquisar nos scripts por "histogram"

Bar Color - Moving Average Convergence Divergence [nsen]The Pine Script you've provided creates a custom indicator that utilizes the MACD (Moving Average Convergence Divergence) and displays various outputs, such as bar color changes based on MACD signals, and a table of data from multiple timeframes. Here's a breakdown of how the script works:
1. Basic Settings (Input)
• The script defines several user-configurable parameters, such as the MACD values, bar colors, the length of the EMA (Exponential Moving Average) periods, and signal smoothing.
• Users can also choose timeframes to analyze the MACD values, like 5 minutes, 15 minutes, 1 hour, 4 hours, and 1 day.
2. MACD Calculation
• It uses the EMA of the close price to calculate the MACD value, with fast_length and slow_length representing the fast and slow periods. The signal_length is used to calculate the Signal Line.
• The MACD value is the difference between the fast and slow EMA, and the Signal Line is the EMA of the MACD.
• The Histogram is the difference between the MACD and the Signal Line.
3. Plotting the Histogram
• The Histogram values are plotted with colors that change based on the value. If the Histogram is positive (rising), it is colored differently than if it's negative (falling). The colors are determined by the user inputs, for example, green for bullish (positive) signals and red for bearish (negative) signals.
4. Bar Coloring
• The bar color changes based on the MACD's bullish or bearish signal. If the MACD is bullish (MACD > Signal), the bar color will change to the color defined for bullish signals, and if it's bearish (MACD < Signal), the bar color will change to the color defined for bearish signals.
5. Multi-Timeframe Data Table
• The script includes a table displaying the MACD trend for different timeframes (e.g., 5m, 15m, 1h, 4h, 1d).
• Each timeframe will show a colored indicator: green (🟩) for bullish and red (🟥) for bearish, with the background color changing based on the trend.
6. Alerts
• The script has alert conditions to notify the user when the MACD shows a bullish or bearish entry:
• Bullish Entry: When the MACD turns bullish (crosses above the Signal Line).
• Bearish Entry: When the MACD turns bearish (crosses below the Signal Line).
• Alerts are triggered with custom messages such as "🟩 MACD Bullish Entry" and "🟥 MACD Bearish Entry."
Key Features:
• Customizable Inputs: Users can adjust the MACD settings, histogram colors, and timeframe options.
• Visual Feedback: The color changes of the histogram and bars provide instant visual cues for bullish or bearish trends.
• Multi-Timeframe Analysis: The table shows the MACD trend across multiple timeframes, helping traders monitor trends in different timeframes.
• Alert Conditions: Alerts notify users when key MACD crossovers occur.

Custom RSI & MACD Momentum Entry SignalsIndicator Explanation: Custom RSI & MACD Momentum Entry Signals
Introduction
The "Custom RSI & MACD Momentum Entry Signals" indicator combines the Relative Strength Index (RSI) and the Moving Average Convergence Divergence (MACD) to generate precise long and short entry signals. This indicator offers a powerful combination of overbought/oversold zones, momentum analysis, and RSI-EMA crossovers to assist traders in making better decisions.
How the Indicator Works
1. RSI Calculation and EMA
The RSI is calculated based on the closing price with an adjustable period (default: 14).
An Exponential Moving Average (EMA) of the RSI (default: 9) is plotted to identify RSI trend changes.
When the RSI crosses its EMA upwards, it signals a bullish impulse. Conversely, a downward cross indicates a bearish impulse.
2. MACD Calculation and Momentum Shifts
The MACD line is derived from the difference between a fast EMA (default: 12) and a slow EMA (default: 26).
The Signal line is the EMA of the MACD line (default: 9).
The MACD histogram represents the difference between the MACD line and the Signal line.
Momentum shifts are detected as follows:
Weakening Bearish: Histogram is negative but increasing (less bearish pressure).
Strengthening Bullish: Histogram is positive and rising.
Weakening Bullish: Histogram is positive but decreasing.
Strengthening Bearish: Histogram is negative and falling.
Signal Generation
Long Signals
A Long signal is triggered when all of the following conditions are met:
The RSI was previously below 30 (oversold condition).
MACD momentum shifts from "strengthening bearish" to "weakening bearish" or turns bullish.
The RSI crosses its EMA upwards.
A green upward arrow is displayed below the bar, and the background is lightly shaded green for additional visualization.
Short Signals
A Short signal is triggered when all of the following conditions are met:
The RSI was previously above 70 (overbought condition).
MACD momentum shifts from "strengthening bullish" to "weakening bullish" or turns bearish.
The RSI crosses its EMA downwards.
A red downward arrow is displayed above the bar, and the background is lightly shaded red for additional visualization.
Visual Elements
RSI and EMA:
The RSI is shown in purple.
The RSI EMA is shown in blue.
Horizontal lines at 30 (oversold) and 70 (overbought) provide additional context.
MACD:
The MACD line is displayed in blue.
The Signal line is displayed in orange.
The zero line is added for easier interpretation.
Signals:
Green arrows: Long signals.
Red arrows: Short signals.
Background color: Light green for long conditions, light red for short conditions.
Use Cases
This indicator is ideal for:
Trend Followers: Combining RSI and MACD allows traders to identify entry points during impulsive trend shifts.
Swing Traders: Long and short signals can be used at reversal points to capture short-term price movements.
Momentum Traders: By considering MACD momentum, the indicator provides additional confidence in signal generation.
Customizable Settings
The indicator provides flexible input options:
RSI Period (default: 14)
RSI EMA Period (default: 9)
MACD Parameters: Fast, slow, and signal EMAs can be adjusted.
Conclusion
The Custom RSI & MACD Momentum Entry Signals indicator is a powerful tool for traders looking to combine RSI and MACD to identify high-probability entry signals. With clear visualization and precise signal generation, traders can make decisions more efficiently and capitalize on market movements.

3 Timeframe MACD3 Timeframe MACD Indicator
This indicator provides a multi-timeframe visualization of the MACD (Moving Average Convergence Divergence), enabling traders to analyze momentum and trend signals effectively across different timeframes.
Key Features:
Multi-Timeframe Capability:
Timeframe 1: Automatically uses the chart's current timeframe and displays the MACD Histogram along with the MACD line and Signal line.
Timeframe 2: A user-defined timeframe (default: 4 hours) displays both the MACD line and Signal line for trend and crossover analysis.
Timeframe 3: Another user-defined timeframe (default: 1 day) also displays the MACD line and Signal line, with increased line thickness for emphasis.
Dynamic Histogram Plot:
Timeframe 1's histogram is color-coded:
Green shades for positive values (brighter for increasing momentum).
Red shades for negative values (darker for increasing negative momentum).
Customizable MACD Parameters:
Adjustable Fast Length, Slow Length, and Signal Length to tailor the MACD calculation to specific trading styles or assets.
Clear and Distinct Visualizations:
Timeframe 1 includes the MACD Histogram with MACD and Signal lines for a detailed momentum view.
Timeframes 2 and 3 highlight the MACD and Signal lines in distinct colors for easy differentiation.
Use Case:
Ideal for traders seeking to monitor momentum changes (via Histogram) and trend/crossover signals (via MACD and Signal lines) across the current and two higher/lower timeframes.
Enhances decision-making by providing multi-timeframe confluence for trend-following or countertrend strategies.
This indicator is particularly useful for traders looking for a streamlined way to incorporate multi-timeframe analysis into their trading workflow.

Price Time Filtering Bar CountThis script is designed to identify and visualize market trends by analyzing price action over a specified aggregation period. Detailed breakdown of its functionality:
Trend Identification
Uptrend Detection:
An uptrend is signaled when the closing price of the previous bar is higher than the high price from two bars ago.
Downtrend Detection:
A downtrend is indicated when the closing price of the previous bar is lower than the low price from two bars ago.
Trend Continuation:
If neither condition is met, the current trend continues from the previous bar.
Trend Counting
Counter Initialization:
A counter (count) keeps track of the number of consecutive bars in the current trend.
Counter Reset:
When a new trend is detected (change from uptrend to downtrend or vice versa), the counter resets to 1.
Counter Increment:
If the trend continues, the counter increments by 1 for each new bar in the same trend.
Visualization
BarCount Plot:
The BarCount variable represents the current count of trend bars.
Positive Values: Indicate the number of bars in an uptrend.
Negative Values: Indicate the number of bars in a downtrend.
Zero or na: Represents no clear trend or initialization phase.
Histogram Style:
The BarCount is plotted as a histogram, providing a visual representation of trend strength and duration.
Color Coding
Uptrend Color:
Bars and histogram columns are colored teal (or the color assigned to UptrendColor) when in an uptrend.
Downtrend Color:
Bars and histogram columns are colored orange (or the color assigned to DowntrendColor) when in a downtrend.
Customizable Coloring:
The paintBars input allows users to enable or disable the coloring of price bars according to the current trend.
Aggregation Period
User Input:
The aggregationPeriod input lets users specify a timeframe for the indicator's calculations.
If left empty, the indicator uses the chart's current timeframe.
Data Fetching:
The indicator retrieves close, high, and low prices based on the specified aggregation period using the request.security function.
How It Works Together
Data Retrieval:
The indicator fetches the necessary price data (secAggClose, secAggHigh, secAggLow) based on the chosen timeframe.
Trend Calculation:
It compares the previous closing price to the high and low prices from two bars ago to determine the current trend.
Trend Counting:
The counter tracks how many consecutive bars the market has been in the current trend.
Visualization and Coloring:
The BarCount is plotted as a histogram, with colors indicating the trend direction.
Optionally, the price bars on the chart are colored to match the trend for easier visualization.
Practical Use Cases
Trend Strength Assessment:
Traders can gauge the strength of a trend by observing the magnitude of the BarCount. A higher absolute value indicates a stronger, more prolonged trend.
Trend Reversals:
A reset in the counter (switch from positive to negative or vice versa) can signal a potential trend reversal, providing entry or exit points.
Momentum Trading:
By visualizing the duration of trends, momentum traders can identify optimal times to join a prevailing trend or anticipate its exhaustion.
Customization Options
Enable/Disable Bar Coloring:
Users can toggle the paintBars option to switch between a clean price chart and one that highlights trends with color.
Aggregation Period Adjustment:
Adjusting the aggregationPeriod allows analysis over different timeframes without changing the chart's main settings, offering flexibility in strategy development.
Conclusion
This indicator serves as a powerful tool for trend analysis by:
Quantifying Trend Duration: Helps understand how long a trend has persisted.
Visual Trend Representation: Offers immediate visual cues through histogram bars and color-coded price bars.
Flexible Configuration: Provides options to customize the timeframe and visual aspects to suit individual trading styles.
By integrating this indicator into your trading strategy, you can enhance your ability to identify trend patterns, assess their strength, and make more informed trading decisions based on trend dynamics.

Time Change Indicator-AYNETDetailed Scientific Explanation of the Time Change Indicator Code
This Pine Script code implements a financial indicator designed to measure and visualize the percentage change in the closing price of an asset over a specified timeframe. It uses historical data to calculate changes and displays them as a histogram for intuitive analysis. Below is a comprehensive scientific breakdown of the code:
1. User Inputs
The script begins by defining user-configurable parameters, enabling flexibility in analysis:
timeframe: The user selects the timeframe for measuring price changes (e.g., 1 hour, 1 day). This determines the granularity of the analysis.
positive_color and negative_color: Users choose the colors for positive and negative changes, enhancing visual interpretation.
2. Data Retrieval
The script employs request.security to fetch closing price data (close) for the specified timeframe. This function ensures that the indicator adapts to different timeframes, providing consistent results regardless of the chart's base timeframe.
Current Closing Price (current_close):
current_close
=
request.security(syminfo.tickerid, timeframe, close)
current_close=request.security(syminfo.tickerid, timeframe, close)
Retrieves the closing price for the defined timeframe.
Previous Closing Price (prev_close): The script uses a variable (prev_close) to store the previous closing price. This variable is updated dynamically as new data is processed.
3. Price Change Calculation
The script calculates both the absolute and percentage change in closing price:
Absolute Price Change (price_change):
price_change
=
current_close
−
prev_close
price_change=current_close−prev_close
Measures the difference between the current and previous closing prices.
Percentage Change (percent_change):
percent_change
=
price_change
prev_close
×
100
percent_change=
prev_close
price_change
×100
Normalizes the change relative to the previous closing price, making it easier to compare changes across different assets or timeframes.
4. Conditional Logic for Visualization
The script uses a conditional statement to determine the color of each histogram bar:
Positive Change: If price_change > 0, the bar is assigned the user-defined positive_color.
Negative Change: If price_change < 0, the bar is assigned the negative_color.
This differentiation provides a clear visual cue for understanding price movement direction.
5. Visualization
The script visualizes the percentage change using a histogram and enhances the chart with dynamic labels:
Histogram (plot.style_histogram):
Each bar represents the percentage change for a given timeframe.
Bars above the zero line indicate positive changes, while bars below the zero line indicate negative changes.
Zero Line (hline(0)): A reference line at zero provides a baseline for interpreting changes.
Dynamic Labels (label.new):
Each bar is annotated with its exact percentage change value.
The label's position and color correspond to the bar, improving clarity.
6. Algorithmic Flow
Data Fetching: Retrieve the current and previous closing prices for the specified timeframe.
Change Calculation: Compute the absolute and percentage changes between the two prices.
Bar Coloring: Determine the color of the histogram bar based on the change's direction.
Plotting: Visualize the changes as a histogram and add labels for precise data representation.
7. Applications
This indicator has several practical applications in financial analysis:
Volatility Analysis: By visualizing percentage changes, traders can assess the volatility of an asset over specific timeframes.
Trend Identification: Positive and negative bars highlight periods of upward or downward momentum.
Cross-Asset Comparison: Normalized percentage changes enable the comparison of price movements across different assets, regardless of their nominal values.
Market Sentiment: Persistent positive or negative changes may indicate prevailing bullish or bearish sentiment.
8. Scientific Relevance
This script applies fundamental principles of data visualization and time-series analysis:
Statistical Normalization: Percentage change provides a scale-invariant metric for comparing price movements.
Dynamic Data Processing: By updating the prev_close variable with real-time data, the script adapts to new market conditions.
Visual Communication: The use of color and labels improves the interpretability of quantitative data.
Conclusion
This indicator combines advanced Pine Script functions with robust financial analysis techniques to create an effective tool for evaluating price changes. It is highly adaptable, providing users with the ability to tailor the analysis to their specific needs. If additional features, such as smoothing or multi-timeframe analysis, are required, the code can be further extended.

Multifactor Buy/Sell Strategy V2 | RSI, MACD, ATR, EMA, Boll.BITGET:1INCHUSDT
This Pine Script code for TradingView is a multifactor Buy/Sell indicator that combines several technical factors to generate trading signals based on trend, volatility, and volume conditions. Here’s a breakdown of the main components and functionality:
Indicator Name
- Multifactor Buy/Sell Strategy V2 — an overlay indicator applied directly on the price chart.
### Input Parameters
The script includes multiple customizable parameters:
- RSI, EMA, MACD parameters — for setting periods and signals of MACD and RSI.
- ATR and Bollinger Bands — used for volatility analysis and level determination.
- Minimum Volatility Threshold — sets a minimum Bollinger Band width threshold for determining high volatility.
Core Indicators
1. RSI — calculated to identify oversold (below 30) and overbought (above 70) conditions.
2. EMA and MACD — calculates exponential moving averages and MACD histogram to determine trend direction.
3. ATR and Bollinger Bands — used to assess current volatility and establish dynamic upper and lower bands.
Volatility and Volume Analysis
- Determines the current ATR level and Bollinger Band width to evaluate high volatility.
- Calculates the volume moving average to track periods of increased volume during high volatility.
Trend Analysis
The script uses the difference between fast and slow EMAs to define strong trends:
- Uptrend — when the fast EMA is above the slow EMA, the price is above the fast EMA, and the trend is strong.
- Downtrend — when the fast EMA is below the slow EMA, the price is below the fast EMA, and the trend is strong.
Momentum Filter
- Based on the price change over the last three bars and compared against the minimum volatility threshold to identify strong momentum.
Buy and Sell Signal Generation
- Buy Signal: Uptrend with RSI oversold, positive MACD histogram, high volatility and volume, strong momentum, and sufficient Bollinger Band width.
- Sell Signal: Downtrend with RSI overbought, negative MACD histogram, high volatility and volume, strong momentum, and sufficient Bollinger Band width.
Visualization
- Buy and sell signals are displayed as green and red triangles on the chart.
- Plots for fast and slow EMAs, upper and lower bands, and Bollinger Bands.
Alerts
The script includes alert conditions for buy and sell signals, allowing notifications to be sent via email or mobile app.
Information Panel
A small table on the chart displays current volatility dataThis Pine Script code for TradingView is a multifactor Buy/Sell indicator that combines several technical factors to generate trading signals based on trend, volatility, and volume conditions. Here’s a breakdown of the main components and functionality:
Indicator Name
- Multifactor Buy/Sell Strategy V2 — an overlay indicator applied directly on the price chart.
Input Parameters
The script includes multiple customizable parameters:
- **RSI, EMA, MACD parameters** — for setting periods and signals of MACD and RSI.
- **ATR and Bollinger Bands** — used for volatility analysis and level determination.
- **Minimum Volatility Threshold** — sets a minimum Bollinger Band width threshold for determining high volatility.
Core Indicators
1. RSI — calculated to identify oversold (below 30) and overbought (above 70) conditions.
2. EMA and MACD — calculates exponential moving averages and MACD histogram to determine trend direction.
3. ATR and Bollinger Bands — used to assess current volatility and establish dynamic upper and lower bands.
Volatility and Volume Analysis
- Determines the current ATR level and Bollinger Band width to evaluate high volatility.
- Calculates the volume moving average to track periods of increased volume during high volatility.
Trend Analysis
The script uses the difference between fast and slow EMAs to define strong trends:
- Uptrend — when the fast EMA is above the slow EMA, the price is above the fast EMA, and the trend is strong.
- Downtrend — when the fast EMA is below the slow EMA, the price is below the fast EMA, and the trend is strong.
Momentum Filter
- Based on the price change over the last three bars and compared against the minimum volatility threshold to identify strong momentum.
Buy and Sell Signal Generation
- Buy Signal: Uptrend with RSI oversold, positive MACD histogram, high volatility and volume, strong momentum, and sufficient Bollinger Band width.
- Sell Signal: Downtrend with RSI overbought, negative MACD histogram, high volatility and volume, strong momentum, and sufficient Bollinger Band width.
Visualization
- Buy and sell signals are displayed as green and red triangles on the chart.
- Plots for fast and slow EMAs, upper and lower bands, and Bollinger Bands.
Alerts
The script includes alert conditions for buy and sell signals, allowing notifications to be sent via email or mobile app.
Information Panel
A small table on the chart displays current volatility
- Volatility Status — indicates high or low volatility.
- Bollinger Band Width — current width as a percentage.
- ATR Ratio — ratio of current ATR to long-term average ATR.
This script is suitable for trading in high-volatility conditions, combining multiple filters and factors to generate precise buy and sell signals.

MACD+RSI+BBDESCRIPTION
The MACD + RSI + Bollinger Bands Indicator is a comprehensive technical analysis tool designed for traders and investors to identify potential market trends and reversals. This script combines three indicators: the Moving Average Convergence Divergence (MACD), the Relative Strength Index (RSI), and Bollinger Bands. Each of these indicators provides unique insights into market behavior.
FEATURES
MACD (Moving Average Convergence Divergence)
The MACD is a trend-following momentum indicator that shows the relationship between two moving averages of a security’s price.
The script calculates the MACD line, the signal line, and the histogram, which visually represents the difference between the MACD line and the signal line.
RSI (Relative Strength Index)
The RSI is a momentum oscillator that measures the speed and change of price movements. It ranges from 0 to 100 and is typically used to identify overbought or oversold conditions.
The script allows users to set custom upper and lower thresholds for the RSI, with default values of 70 and 30, respectively.
Bollinger Bands
Bollinger Bands consist of a middle band (EMA) and two outer bands (standard deviations away from the EMA). They help traders identify volatility and potential price reversals.
The script allows users to customize the length of the Bollinger Bands and the multiplier for the standard deviation.
Color-Coding Logic
The histogram color changes based on the following conditions:
Black: If the RSI is above the upper threshold and the closing price is above the upper Bollinger Band, or if the RSI is below the lower threshold and the closing price is below the lower Bollinger Band.
Green (#4caf50): If the RSI is above the upper threshold but the closing price is not above the upper Bollinger Band.
Light Green (#a5d6a7): If the histogram is positive and the RSI is not above the upper threshold.
Red (#f23645): If the RSI is below the lower threshold but the closing price is not below the lower Bollinger Band.
Light Red (#faa1a4): If the histogram is negative and the RSI is not below the lower threshold.
Inputs
Bollinger Bands Settings
Length: The number of periods for the moving average.
Basis MA Type: The type of moving average (SMA, EMA, SMMA, WMA, VWMA).
Source: The price source for the Bollinger Bands calculation.
StdDev: The multiplier for the standard deviation.
RSI Settings
RSI Length: The number of periods for the RSI calculation.
RSI Upper: The upper threshold for the RSI.
RSI Lower: The lower threshold for the RSI.
Source: The price source for the RSI calculation.
MACD Settings
Fast Length: The length for the fast moving average.
Slow Length: The length for the slow moving average.
Signal Smoothing: The length for the signal line smoothing.
Oscillator MA Type: The type of moving average for the MACD calculation.
Signal Line MA Type: The type of moving average for the signal line.
Usage
This indicator is suitable for various trading strategies, including day trading, swing trading, and long-term investing.
Traders can use the MACD histogram to identify potential buy and sell signals, while the RSI can help confirm overbought or oversold conditions.
The Bollinger Bands provide context for price volatility and potential breakout or reversal points.
Example:
From the example, it can clearly see that the Selling Climax and Buying Climax, marked as orange circle when a black histogram occurs.
Conclusion
The MACD + RSI + Bollinger Bands Indicator is a versatile tool that combines multiple technical analysis methods to provide traders with a comprehensive view of market conditions. By utilizing this script, traders can enhance their analysis and improve their decision-making process.

BRT MACD CustomBRT MACD Custom — Adaptive and Flexible MACD for Multi-Timeframe Analysis
The BRT MACD Custom is an advanced version of the traditional MACD indicator, offering additional flexibility and adaptability for multi-timeframe trading. This custom script allows traders to adjust the calculation parameters for MACD to suit their specific trading strategy, timeframe, and market conditions.
Key Features
Multi-Timeframe Support
Unlike the standard MACD, this indicator lets you choose a specific timeframe (different from the chart timeframe) for calculating MACD values. This feature provides more flexibility in analyzing market trends on multiple timeframes without changing the main chart.
Example: You can analyze MACD on a 15-minute timeframe even when your chart is set to 1-minute, giving you broader market insights.
Customizable EMA and Signal Settings
Users can adjust the fast and slow EMA lengths as well as the signal smoothing to better align with their preferred trading strategies. The script allows switching between the two popular types of moving averages — SMA or EMA — for both the MACD and the signal line.
Volatility-Based Adaptive EMA
The script includes an adaptive mechanism for EMA calculation. When the selected timeframe closes, the indicator dynamically adjusts the calculation, ensuring the MACD values respond quickly to market volatility. This makes the indicator more reactive compared to static MACD implementations.
Shift Options for MACD, Signal, and Histogram
The indicator allows shifting the MACD, signal line, and histogram values by one or more bars. This can be useful for backtesting and simulating strategies where you anticipate future price movements.
Signal Alerts for Long and Short Trades
The script generates visual signals when certain conditions are met, indicating potential long or short trade opportunities. These signals are based on MACD and histogram crossovers:
Long Signal: Triggered when MACD is above the signal line and both are rising.
Short Signal: Triggered when MACD is below the signal line and both are falling.
Custom Plotting
The MACD line, signal line, and histogram are plotted on the chart for easy visualization. The histogram changes colors to reflect positive or negative momentum:
Green shades when MACD is above the signal line.
Red shades when MACD is below the signal line.
Applications in Trading
The BRT MACD Custom is ideal for traders who need flexibility in their technical analysis. Its multi-timeframe capabilities and customizable moving averages make it suitable for day trading, swing trading, and long-term investing across a variety of markets.
Scalping: Use the 1-minute or 5-minute timeframe to identify short-term trends while calculating MACD on a higher timeframe such as 15 or 30 minutes.
Swing Trading: Apply the indicator on 1-hour or 4-hour charts to detect mid-term trends.
Long-Term Investing: Analyze daily or weekly charts with longer EMA periods to confirm market direction before making large investments.

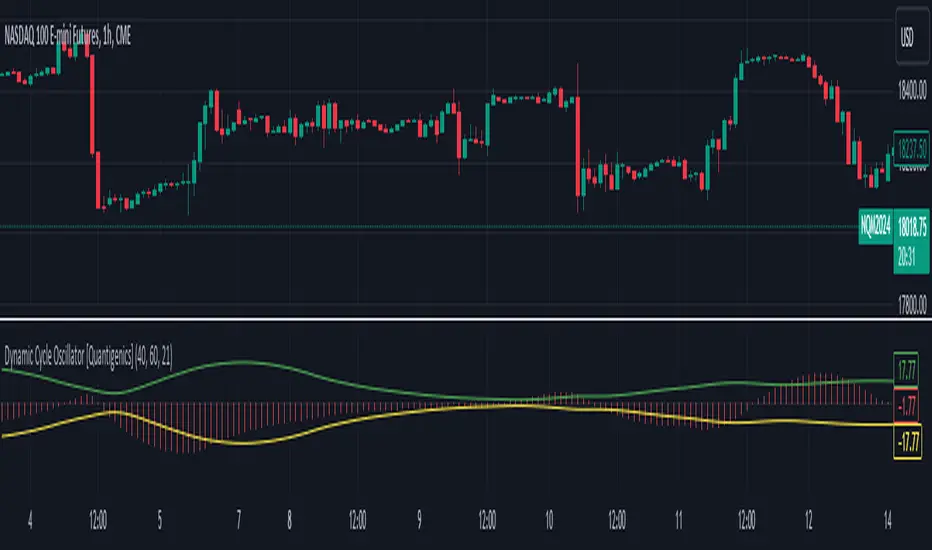
Dynamic Cycle Oscillator [Quantigenics]This script is designed to navigate through the ebbs and flows of financial markets. At its core, this script is a sophisticated yet user-friendly tool that helps you identify potential market turning points and trend continuations.
How It Works:
The script operates by plotting two distinct lines and a central histogram that collectively form a band structure: a center line and two outer boundaries, indicating overbought and oversold conditions. The lines are calculated based on a blend of exponential moving averages, which are then refined by a root mean square (RMS) over a specified number of bars to establish the cyclic envelope.
The input parameters:
Fast and Slow Periods:
These determine the sensitivity of the script. Shorter periods react quicker to price changes, while longer periods offer a smoother view.
RMS Length:
This parameter controls the range of the cyclic envelope, influencing the trigger levels for trading signals.
Using the Script:
On your chart, you’ll notice how the Dynamic Cycle Oscillator’s lines and histogram weave through the price action. Here’s how to interpret the movements.
Breakouts and Continuations:
Buy Signal: Consider a long position when the histogram crosses above the upper boundary. This suggests a possible strong bullish run.
Sell Signal: Consider a short position when the histogram crosses below the lower boundary. This suggests a possible strong bearish run.
Reversals:
Buy Signal: Consider a long position when the histogram crosses above the lower boundary. This suggests an oversold market turning bullish.
Sell Signal: Consider a short position when the histogram crosses below the upper boundary. This implies an overbought market turning bearish.
The script’s real-time analysis can serve as a robust addition to your trading strategy, offering clarity in choppy markets and an edge in trend-following systems.
Thanks! Hope you enjoy!
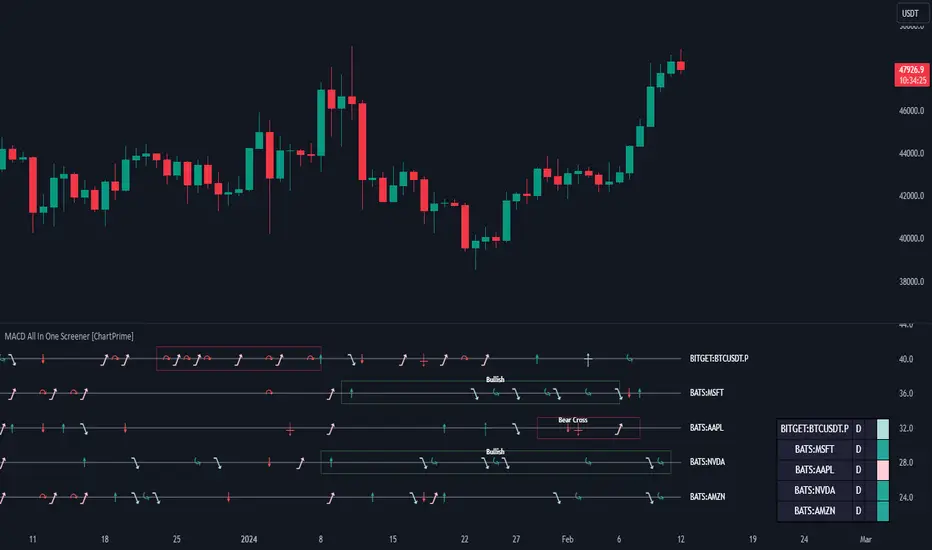
MACD All In One Screener [ChartPrime]INTRODUCTION
MACD All In One Screener (ChartPrime) is a multi instrument, multi timeframe indicator designed to provide traders with a comprehensive solution to monitoring the market. This indicator is designed to be easy to use and visually appealing while also being highly flexible and feature rich. Users can pick up to 10 symbols not including the chart's symbol and set up alerts for many different signals that the MACD produces. One standout feature of this indicator is its ability to display not only each symbol individually as a MACD but you can also view its chart from within this indicator. This removes the need to flip between symbols to see the price action for your basket.
On top of that we have designed this indicator to be friendly with "indicator on indicator" by providing outputs for all of the standards of price that users may want. Included is an overview section that shows all of the symbols signals symbolically over time. Additionally we have included a table for easy monitoring. This table includes the symbol, its timeframe, the current alert, and its histogram state. To make things as user friendly as possible we have also included rich error handling that tells you exactly what is wrong with your configuration.
HOW TO USE
To use this indicator, simply add it to your chart and navigate to the settings. From there select the symbols you want to monitor and the timeframes you want to use. Next you want to navigate down to the alerts section to select the what alerts you want to receive, and what symbols you want to get alerts for. Finally, you wan to create your alert using "Any alert() function call". Now your screener is all set up!
OVERVIEW OF INPUTS
View allows you to select what the indicator currently displays. You can pick from any one of the selected symbols, an overview of all of the symbols, or simply nothing. If you want to only use the table, "None" is provided so you can move the indicator into the chart panel.
View Toggle lets you pick from displaying the MACD for the selected symbol or the Price Action as a candle chart. To see your "indicator on indicator" you will have to select a symbol from the view list. There is a bug where if you select "Overview" while you are using "indicator on indicator" your added indicator will see the last symbol you viewed. To fix this, simply change the setting of your overlaid indicator and it will correct its self.
History Length is the number of historical bars to calculate over. This feature is here to prevent the indicator from breaking due to uneven historical data between the symbols.
Show Price Line toggles a dotted line that follows the current symbols closing price when "Price" is selected under the "View Toggle" dropdown.
Show Symbol Label toggles a label that displays the current symbols name and timeframe. This only impacts the single symbol view.
Overview Label Color adjusts the color of the symbol labels for both overview and single symbol view.
MA Type lets you pick what kind of moving average you want to use for the oscillator or signal. You can pick from the standard SMA or EMA.
Fast Length is a standard input for MACD. This lets you pick the period of the fast MA.
Slow Length , just like Fast Lenght, is a standard input for MACD. This lets you pick the period of the slow MA.
Signal Length is another standard input for MACD. This lets you configure the period of the signal MA.
MACD Cross Overlay Icon is a toggle to display MACD crosses when viewing a single symbol's MACD. When the MACD has a bullish cross it will plot a bullish dot, and when it has a bearish cross it will plot a bearish dot. This is purely visual.
Regular Bullish and Bearish toggles the visual display of the divergences on the single symbol view. This does not effect the indicators ability do send alerts.
Divergence Look Right adjusts the number of bars into the future to look for confirmation of a signal. This directly impacts lag but enhances stability.
Divergence Look Left adjusts the number of bars into the past to check for a signal. A longer period will filter out smaller moves
Maximum Lookback adjusts the maximum size of a divergence.
Minimum Lookback adjusts the minimum size of a divergence.
Divergence Drawings picks how you want to visualize the divergence. You can pick from displaying it as a line, a label, or both.
Enable Table toggles the overview table. When enabled it will show you the enabled symbols and their current state. From left to right: symbol name, timeframe, current alert, and histogram state.
Position picks where on the chart you want the table to be.
Text Color adjusts the text color of the table.
BG Color adjusts the background color of the table.
Frame Color adjust the frame color of the table.
Current Symbol Time Frame adjusts the timeframe of the chart's symbol.
Symbol 1 - 10 pick "Symbol's" symbol and timeframe. To use higher timeframes, the symbol's have to be the same type. You can't have a crypto and a stock using HTF at the same time as they don't have the same sessions and will result in an error. You can use unsafe mode (as described below) to potentially get around this.
Enable Symbol when enabled it will give you alerts for the symbol. This also enables the symbol in the overview. If this is disabled it won't send alerts, and it will not show up in overview, or the table.
Wait for Close enables waiting for the bar to close before printing an alert.
Alert Symbol Size picks what size you want the overview symbols to be.
Enable Cross Over 0 Alert: MACD crosses over the 0 line.
Enable Cross Under 0 Alert: MACD crosses under the 0 line.
Enable MACD Cross Bullish Alert: Bullish MACD cross.
Enable MACD Cross Bearish Alert: Bearish MACD cross.
Enable Histogram Bullish Turn Alert: MACD begins to turn bullish but hasn't crossed.
Enable Histogram Bearish Turn Alert: MACD begins to turn bearish but hasn't crossed.
Enable Histogram Bullish Continuation Alert: MACD is in a bullish cross state and it was declining but began rising again.
Enable Histogram Bearish Continuation Alert: MACD is in a bearish cross state and it was rising but began falling again.
Enable Bullish/Bearish Divergence Alert enables divergence alerts. Divergences are lagging, especially on a higher timeframe. These alerts will also tell you the time in the past when the divergence occurred.
Color Section is provided to allow for personalization of the indicator. Everything can be adjusted here.
Disable Error Checking: Only enable this if you want to bypass the built in error checking. This will enable 'Safe Requesting'. Safe Requesting will only request enabled symbols and you will not be able to view symbols that are not enabled in this mode. Only use this if you want to mix symbol types and you know it will work. (An example would be viewing stocks and SPY at the same time.)
CONCLUSION
The MACD All In One Screener (ChartPrime) is a versatile indicator designed to monitor multiple symbols across various timeframes. The flexibility in customization, from MACD settings to visual alerts and table presentations, allows users to tailor the screener to their needs and preferences. We hope you find this as useful and interesting as we do and wish you good luck in the market!
Enjoy
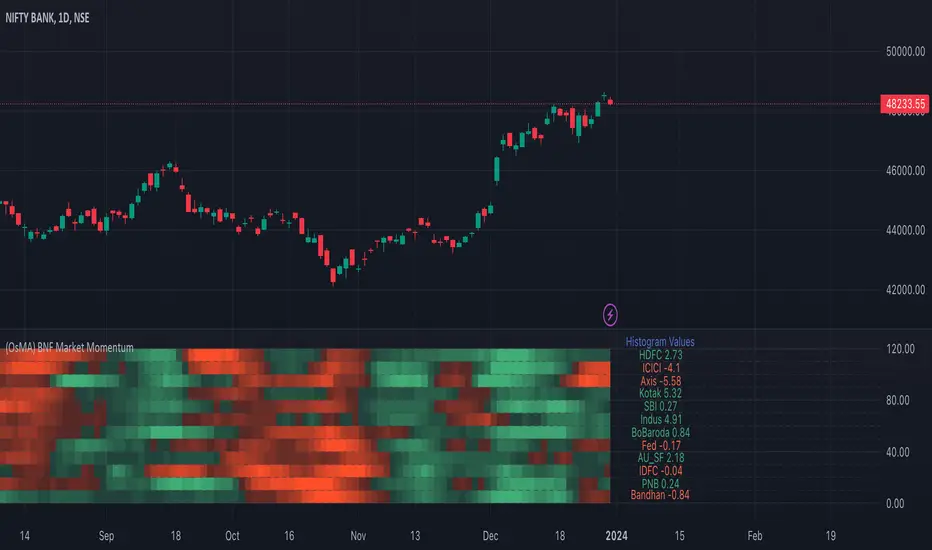
Bank Nifty Market Breadth (OsMA)This indicator is the market breadth for Bank Nifty (NSE:BANKNIFTY) index calculated on the histogram values of MACD indicator. Each row in this indicator is a representation of the histogram values of the individual stock that make up Bank Nifty. Components are listed in order of its weightage to Bank nifty index (Highest -> Lowest).
When you see Bank Nifty is on an uptrend on daily timeframe for the past 10 days, you can see what underlying stocks support that uptrend. The brighter the plot colour, the higher the momentum and vice versa. Looking at the individual rows that make up Bank Nifty, you can have an understanding if there is still enough momentum in the underlying stocks to go higher or are there many red plots showing up indicating a possible pullback or trend reversal.
The plot colours are shown as a percentage of the current histogram value taken from MACD from the highest histogram value of the previous 200 bars shown on the current timeframe. Look back value of 200 bars was chosen as it provided a better representation of the current value from its peak over the recent past(previous 200 bars), on all timeframes. Histogram value do grow/fall along with the underlying stock price, so choosing the chart's all-time high/low value as peak was not ideal. Labels on the right show the current histogram value.
Base Code taken from @fengyu05's S&P 500 Market Breadth indicator.
Webby's Tight IndicatorWebby's Tight Indicator is used to measure a securities volatility relative to itself over time. This is achieved by taking the average of three short term ATR's (average true range) and creating a ratio versus three longer term ATR's.
Mike Webster recently stated he is using the 3,5,8 for the short term ATR's and the 55,89,144 for the long term ATR's. All of the ATR lengths are part of the Fibonacci sequence.
The ratio of the ATR's is then calculated and plotted as a histogram with 0 representing the ATR's being equal. As a stocks short term ATR contracts the histogram will rise above 0 meaning volatility in the short term is contracting relative to long term volatility. On the other hand if the short ATR's are expanding versus the long term ATR's the histogram will fall below 0 and turn red, signifying short term volatility is greater than long term volatility.
The easy visualization of this indicator allows you to quickly see when a stock is in a tight range and could be ready for a potential breakout to the long side or breakdown to the short side.
In this example we see tight price action with a blue histogram followed by volatility to the upside coinciding with a breakout.
In this example we see volatility expanding as a stock continues to fall.
To help differentiate between trending contraction or expansion and just short term blips 5-day exponential moving average of the ratio is also plotted on the histogram and dynamically changes colors as it rises and falls.
Indicator options include:
Change histogram colors
Choose ema line width

REVE Cohorts - Range Extension Volume Expansion CohortsREVE Cohorts stands for Range Extensions Volume Expansions Cohorts.
Volume is divided in four cohorts, these are depicted in the middle band with colors and histogram spikes.
0-80 percent i.e. low volumes; these get a green color and a narrow histogram bar
80-120 percent, normal volumes, these get a blue color and a narrow histogram bar
120-200 percent, high volume, these get an orange color and a wide histogram bar
200 and more percent is extreme volume, maroon color and wide bar.
All histogram bars have the same length. They point to the exact candle where the volume occurs.
Range is divided in two cohorts, these are depicted as candles above and below the middle band.
0-120 percent: small and normal range, depicted as single size, square candles
120 percent and more, wide range depicted as double size, rectangular candles.
The range candles are placed and colored according to the Advanced Price Algorithm (published script). If the trend is up, the candles are in the uptrend area, which is above the volume band, , downtrend candles below in the downtrend area. Dark blue candles depict a price movement which confirms the uptrend, these are of course in the uptrend area. In this area are also light red candles with a blue border, these depict a faltering price movement countering the uptrend. In the downtrend area, which is below the volume band, are red candles which depict a price movement confirming the downtrend and light blue candles with a red border depicting price movement countering the downtrend. A trend in the Advanced Price Algorithm is in equal to the direction of a simple moving average with the same lookback. The indicator has the same lagging.as this SMA.
Signals are placed in the vacated spaces, e.g. during an uptrend the downtrend area is vacated.
There are six signals, which arise as follows:
1 Two blue triangles up on top of each other: high or extreme volume in combination with wide range confirming uptrend. This indicates strong and effective up pressure in uptrend
2 Two pink tringles down on top of each other: high or extreme volume in combination with wide range down confirming downtrend. This indicates strong and effective down pressure in downtrend
3 Blue square above pink down triangle down: extreme volume in combination with wide range countering uptrend. This indicates a change of heart, down trend is imminent, e.g. during a reversal pattern. Down Pressure in uptrend
4 Pink square below blue triangle up: extreme volume in combination with wide range countering downtrend. This indicates a change of heart, reversal to uptrend is imminent. Up Pressure in downtrend
5 single blue square: a. extreme volume in combination with small range confirming uptrend, b. extreme volume in combination with small range countering downtrend, c. high volume in combination with wide range countering uptrend. This indicates halting upward price movement, occurs often at tops or during distribution periods. Unresolved pressure in uptrend
6 Single pink square: a extreme volume in combination with small range confirming downtrend, b extreme volume in combination with small range countering uptrend, c high volume in combination with wide range countering downtrend. This indicated halting downward price movement. Occurs often at bottoms or during accumulation periods. Unresolved pressure in downtrend.
The signals 5 and 6 are introduced to prevent flipping of signals into their opposite when the lookback is changed. Now signals may only change from unresolved in directional or vice versa. Signals 3 and 4 were introduced to make sure that all occurrences of extreme volume will result in a signal. Occurrences of wide volume only partly lead to a signal.
Use of REVE Cohorts.
This is the indicator for volume-range analyses that I always wanted to have. Now that I managed to create it, I put it in all my charts, it is often the first part I look at, In my momentum investment system I use it primarily in the layout for following open positions. It helps me a lot to decide whether to close or hold a position. The advantage over my previous attempts to create a REVE indicator (published scripts), is that this version is concise because it reports and classifies all possible volumes and ranges, you see periods of drying out of volume, sequences of falter candles, occurrences of high morning volume, warning and confirming signals.. The assessment by script whether some volume should be considered low, normal, high or extreme gives an edge over using the standard volume bars.
Settings of REVE Cohorts
The default setting for lookback is ‘script sets lookback’ I put this in my indicators because I want them harmonized, the script sets lookback according to timeframe. The tooltip informs which lookback will be set at which timeframe, you can enable a feedback label to show the current lookback. If you switch ‘script sets lookback’ off, you can set your own preferred user lookback. The script self-adapts its settings in such a way that it will show up from the very first bar of historical chart data, it adds volume starting at the fourth bar.
You can switch off volume cohorts, only range candles will show while the middle band disappears. Signals will remain if volume is present in the data. Some Instruments have no volume data, e.g. SPX-S&P 500 Index,, then only range candles will be shown.
Colors can be adapted in the inputs. Because the script calculates matching colors with more transparency it is advised to use 100 percent opacity in these settings.
Take care, Eykpunter

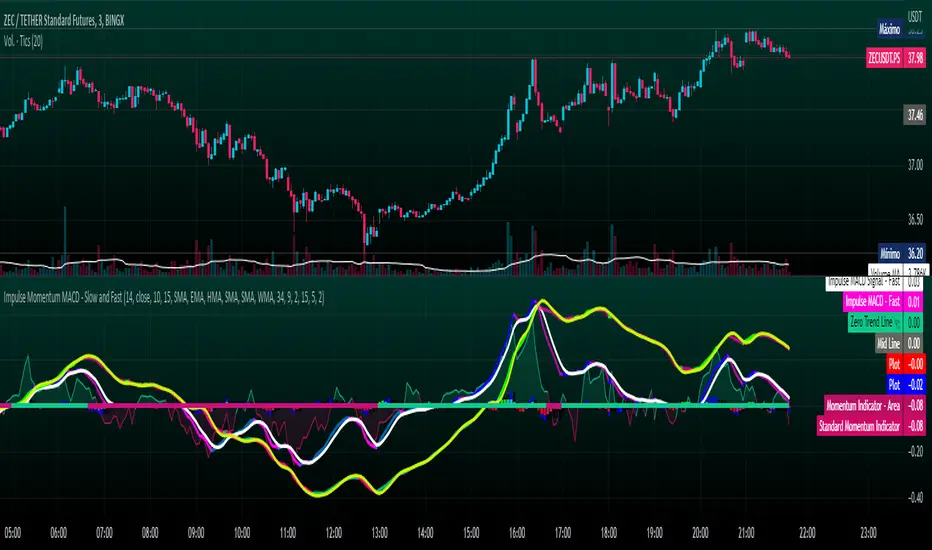
Impulse Momentum MACD - Slow and FastImpulse Momentum MACD - Slow and Fast
The Momentum indicator is a technical indicator that measures the speed and strength of the price movement of a financial asset. This indicator is used to identify the underlying strength of a trend and predict potential changes in price direction, when the indicator crosses the zero line, it can signal a change of direction in the price trend.
On the other hand, the MACD is an indicator used to identify the trend and strength of the market and shows the difference between two exponential moving averages ( EMA ) of different periods. The MACD is commonly used to determine the direction of an asset's price trend.
COPOSITION AND USE OF THE INDICATOR
This script is an implementation of the Impulse Momentum MACD indicator with two variations: slow and fast. It uses a combination of the Momentum indicator and the Moving Average Convergence/Divergence (MACD) indicator to identify trend reversals and momentum changes in an asset's price.
The combination of both indicators can help traders identify market entry and exit opportunities. The Impulse Momentum MACD is a Modified MACD, it is formed by filtering the values in a range of Modifiable Moving Averages by calculating their high and low ranges,This indicator has two parts: a slow part and a fast part. The slow part uses input values for the lengths of the moving averages and the length of the signal for the MACD indicator. The fast part uses different input values for the lengths of the moving averages. Also, each part has its own set of line colors and histogram colors for easy visualization.
The script also includes inputs to choose the type of moving average to use (SMA, EMA, etc.), the lookback period, the colors for the histogram lines and bars, and a zero trend line (also known as a horizontal trend line). ).
* Highest performing custom settings for the zero trend line. For Operations of:
- One Minute: Trend Line Time Frame = Five Minutes.
- Three Minutes: Trend Line Time Frame = Fifteen Minutes.
- Five Minutes: Trend Line Time Frame = Thirty Minutes.
- Fifteen Minutes: Trend Line Time Frame = Sixty Minutes.
Rules For Trading
🔹 Bullish:
* The Zero Horizontal Trend Line should be in Green Color.
* The Slow Histogram Bar should be in Green Color.
* The Fast Histogram Bar must be in Blue or Black Color or No Bar Appears.
* The Momentum Line or Momentum Area must be in Green Color.
crosses:
- When the Impulse Momentum MACD Slow line crosses the Impulse Momentum MACD Slow signal line upwards.
- When the Impulse Momentum MACD Fast line crosses the Impulse Momentum MACD Fast signal line upwards.
- Note 1: A Position is Opened when the condition of any of the aforementioned crossovers is met.
- Note 2: If the two aforementioned crossings anticipate the condition of the Zero Horizontal Tendency Line because it is in Red; A position is only opened immediately when the Zero Horizontal Trend line turns Green.
🔹 Bearish:
* The Zero Horizontal Trend Line should be in Red Color.
* The Slow Histogram Bar should be in Red Color.
* The Fast Histogram Bar must be in Blue or Black Color or No Bar Appears.
* The Momentum Line or Momentum Area must be in Red Color.
crosses:
- When the Impulse Momentum MACD Slow line crosses the Impulse Momentum MACD Slow signal line downwards.
- When the Impulse Momentum MACD Fast line crosses the Impulse Momentum MACD Fast signal line downwards.
- Note 1: A Position is Opened when the condition of any of the aforementioned crossovers is met.
- Note 2: If the two aforementioned crossings anticipate the condition of the Zero Horizontal Tendency Line because it is Green, an immediate position is only opened when the Zero Horizontal Tendency line turns Red.
This script can be used in different markets such as forex, indices and cryptocurrencies for analysis and trading. However, it is important to note that no trading strategy is guaranteed to be profitable, and traders should always conduct their own research and risk management.
VWAP filtered MACD Bars with positive MACD histogram value and closing above VWAP are colored, long positions should be taken in areas made of those bars.
Similarly, bars with negative MACD histogram value and closing below VWAP are also colored, short positions should be taken there.
This indicator by default should be a part of your trend following trading system.
In the setting you can change colors
Above grow: positive and rising MACD histogram value
Above fall: positive and falling MACD histogram value
Below fall: negative and falling MACD histogram value
Below grow: negative and rising MACD histogram value
Coral Trend Pullback Strategy (TradeIQ)Description:
Strategy is taken from the TradeIQ YouTube video called "I Finally Found 80% Win Rate Trading Strategy For Crypto".
Check out the full video for further details/clarification on strategy entry/exit conditions.
The default settings are exactly as TradeIQ described in his video.
However I found some better results by some tweaking settings, increasing R:R ratio and by turning off confirmation indicators.
This would suggest that perhaps the current confirmation indicators are not the best options. I'm happy to try add some other optional confirmation indicators if they look to be more effective.
Recommended timeframe: 1H
Strategy incorporates the following features:
Risk management:
Configurable X% loss per stop loss
Configurable R:R ratio
Trade entry:
Based on strategy conditions below
Trade exit:
Based on strategy conditions below
Backtesting:
Configurable backtesting range by date
Trade drawings:
Each entry condition indicator can be turned on and off
TP/SL boxes drawn for all trades. Can be turned on and off
Trade exit information labels. Can be turned on and off
NOTE: Trade drawings will only be applicable when using overlay strategies
Alerting:
Alerts on LONG and SHORT trade entries
Debugging:
Includes section with useful debugging techniques
Strategy conditions
Trade entry:
LONG
C1: Coral Trend is bullish
C2: At least 1 candle where low is above Coral Trend since last cross above Coral Trend
C3: Pullback happens and price closes below Coral Trend
C4: Coral Trend colour remains bullish for duration of pullback
C5: After valid pullback, price then closes above Coral Trend
C6: Optional confirmation indicators (choose either C6.1 or C6.2 or NONE):
C6.1: ADX and DI (Single indicator)
C6.1.1: Green line is above red line
C6.1.2: Blue line > 20
C6.1.3: Blue trending up over last 1 candle
C6.2: Absolute Strengeh Histogram + HawkEye Volume Indicator (Two indicators combined)
C6.2.1: Absolute Strengeh Histogram colour is blue
C6.2.2: HawkEye Volume Indicator colour is green
SHORT
C1: Coral Trend is bearish
C2: At least 1 candle where high is below Coral Trend since last cross below Coral Trend
C3: Pullback happens and price closes above Coral Trend
C4: Coral Trend colour remains bearish for duration of pullback
C5: After valid pullback, price then closes below Coral Trend
C6: Optional confirmation indicators (choose either C6.1 or C6.2 or NONE):
C6.1: ADX and DI (Single indicator)
C6.1.1: Red line is above green line
C6.1.2: Blue line > 20
C6.1.3: Blue trending up over last 1 candle
C6.2: Absolute Strengeh Histogram + HawkEye Volume Indicator (Two indicators combined)
C6.2.1: Absolute Strengeh Histogram colour is red
C6.2.2: HawkEye Volume Indicator colour is red
NOTE: All the optional confirmation indicators cannot be overlayed with Coral Trend so feel free to add each separately to the chart for visual purposes
Trade exit:
Stop Loss: Calculated by recent swing low over previous X candles (configurable with "Local High/Low Lookback")
Take Profit: Calculated from R:R multiplier * Stop Loss size
Credits
Strategy origin: TradeIQ's YouTube video called "I Finally Found 80% Win Rate Trading Strategy For Crypto"
It combines the following indicators for trade entry conditions:
Coral Trend Indicator by @LazyBear (Main indicator)
Absolute Strength Histogram | jh by @jiehonglim (Optional confirmation indicator)
Indicator: HawkEye Volume Indicator by @LazyBear (Optional confirmation indicator)
ADX and DI by @BeikabuOyaji (Optional confirmation indicator)

MACD DEMA by ToffMACD DEMA by Toff
converted to version 5
Changed Histogram formatting
Changed MACD plot to indicate macd direction change
//@version=5
//by ToFFF converted to version 5, changed histogram formating changed macd plot to show macd direction changed with lighter color
indicator('MACD DEMA', timeframe = "", timeframe_gaps=true)
sma = input(12,title='DEMA Short')
lma = input(26,title='DEMA Long')
tsp = input(9,title='Signal')
lines = input(true,title="Lines")
col_grow_above = input(#26A69A, "Above Grow", group="Histogram", inline="Above")
col_fall_above = input(#B2DFDB, "Fall", group="Histogram", inline="Above")
col_grow_below = input(#FFCDD2, "Below Grow", group="Histogram", inline="Below")
col_fall_below = input(#FF5252, "Fall", group="Histogram", inline="Below")
col_macd = input(#2962FF, "MACD Line ", group="Color Settings", inline="MACD")
col_signal = input(#FF6D00, "Signal Line ", group="Color Settings", inline="Signal")
col_macd_i = #0000FF
col_macd_d = #66FFFF
slowa = ta.ema(close,lma)
slowb = ta.ema(slowa,lma)
DEMAslow = ((2 * slowa) - slowb)
fasta = ta.ema(close,sma)
fastb = ta.ema(fasta,sma)
DEMAfast = ((2 * fasta) - fastb)
MACD = (DEMAfast - DEMAslow)
signala = ta.ema(MACD, tsp)
signalb = ta.ema(signala, tsp)
signal = ((2 * signala) - signalb)
hist = (MACD - signal)
//swap1 = MACDZeroLag>0?green:red
plot(hist,style=plot.style_columns, color=(hist>=0 ? (hist < hist ? col_grow_above : col_fall_above) : (hist < hist ? col_grow_below : col_fall_below)),title='HIST')
p1 = plot(lines?MACD:na,style = plot.style_line, color=(MACD < MACD) ? col_macd_i : col_macd_d , linewidth =3,title='MACD')
p2 = plot(lines?signal:na, color=col_signal, linewidth =2,title='Signal')
hline(0)

Parabolic SAR MARSI, Adaptive MACD [Loxx]Parabolic SAR MARSI, Adaptive MACD is a trend following indicator that combines MACD, Parabolic SAR, and RSI into a signal indicator.
What is Parabolic SAR?
The parabolic stop and reverse, more commonly known as the "Parabolic SAR," or "PSAR" is a trend-following indicator developed by J. Welles Wilder. It is displayed as a single parabolic line (or dots) underneath the price bars in an uptrend, and above the price bars in a downtrend.
What is MACD?
Moving average convergence divergence (MACD) is a trend-following momentum indicator that shows the relationship between two moving averages of a security’s price. The MACD is calculated by subtracting the 26-period exponential moving average (EMA) from the 12-period EMA.
What is RSI?
The relative strength index (RSI) is a momentum indicator used in technical analysis that measures the magnitude of recent price changes to evaluate overbought or oversold conditions in the price of a stock or other asset. The RSI is displayed as an oscillator (a line graph that moves between two extremes) and can have a reading from 0 to 100. The indicator was originally developed by J. Welles Wilder Jr. and introduced in his seminal 1978 book, “New Concepts in Technical Trading Systems.”
How to combine PSAR, MACD, and RSI into one:
1. Create a new type of moving average called MARSI. MARSI is like a typical moving average but it flexes to RSI sensitivities
2. Calculate MACD for the MARSI of High/Low values
3. Calculate the midpoint MACD between the High/Low MACDs created in step 2
4. Create a final MACD by calculating the MARSI for the midpoint MACD created in step 3
5. Finally, Inject these values into a customized Parabolic SAR function
Results:
-A unique spin on three different indicators that identifies trends of both RSI, MACD, and price of the underlying asset
-Entry, exit, and reversal points in price, RSI, and MACD
-A MACD that adapts to RSI
What's Included?
-Customization of all variables
-A variety of moving averages to smooth the signal line
-Customizable colors
-Alerts for MACD zero-line and signal crosses, and PSAR trend direction changes
Things to know:
-The histogram in this indicator is NOT the normal histogram found in the classic MACD indicator. The histogram here is a histogram of MACD itself. The classic histogram has questionable utility but the histogram in this indicator is very important and useful
-Parabolic SAR is calculated on the MARSI of High/Low values
Future releases:
-Divergences
-Regular, continuation, and exit signals
Happy trading!
Vertical LinesThis script plots vertical lines on charts or indicators. Unfortunately pinescript is lacking a vertical line plotting function. Vertical lines are useful to mark events, such as crossover of levels, indicators signals or as a time marker.
After searching the internet for a long time and trying different scripts, this script is the simplest and visually the best. You would think that plotting a vertical line would be relatively easy, it is not! I thank the unknow author for sharing this solution and now I will share it on tradingview to make it readily available to anybody that needs it.
RSI crossover signals are used as an example in this script. When the RSI crosses over 70 or below 30, the script plots a red or green vertical line.
The script plots a vertical line as a histogram bar. The histogram bar must have a height.
Setting the height near infinity like 1e20 will cover all the ranges from top to bottom in most charts, but doesn't work all the time. If the chart range is small in values, the line is not plotted or the chart is visually compressed because the top of the bar is also a data point in the chart. Another solution is to find the highest point in the chart and multiply it by a number from 2 to 10 to set the top of the histogram bar. But this solution doesn't work if the line is drawn in the indicator window. additionally if the chart or indicator includes negative values, a histogram bar with a negative height must be concatenated to the histogram bar with a positive height to cover the positive and negative range.
It would seem intuitive to include a vertical plot function since it is very useful and pinescript already has a horizontal line plot function called Hline. But pinescript is becoming less intuitive, and redundant. A case in point is Version 4 variable declaration and naming, it less intuitive and more redundant than previous versions. I beg Tradingview to adopt a more refined scripting language such as Matlab or Python for charting purposes. These languages can be easily ported to other analysis programs for AI or statistical analysis.
MACD - STOCH - RSI This indicator combines the
- MACD w/ Volume Conditions
- STOCHASTIC
- RSI
All into one place, to help find confluences between popular convergence / divergence indicators.
It's primary use is the histogram of the MACD.
The colors change whether or not the current bar is higher or lower than the previous.
Lighter shade signifies the bars are getting smaller.
You can also enable a feature which will change the color of the histogram depending on the volume.
There are 2 conditions which can be met which signify ' Increasing Volume ' and ' Above Average Volume '.
If the MACD is above 0,
Light Blue signifies increasing volume.
Dark Blue signifies above average volume
If the MACD is below 0,
Light Purple signifies increasing volume.
Dark Purple signifies above average volume.
Having volume conditions within the histogram are meant to act as confluence. For example, if the histogram is
rising and light blue or dark blue bars are shown, this could hint towards a larger move to the upside if previous
upswings on the histogram were only green.
Increased volume near the peak of a move can also signify lots of orders coming into the market in hopes
of reversing the current trend or starting a correction.
formula:
Avg of volume over past 10 bars * 1.5 = increasing volume
Avg of volume over past 10 bars * 2 = Above Average Volume
--
The RSI and STOCHASTIC have been run through a custom function which moves the values. The middle line is now 0.
Where on most RSI and STOCHASTIC indicators the middle line can be considered 50, with overbought levels nearing 70
and oversold levels around 30.
On the M.S.R , the RSI overbought levels are by default 20, and oversold -20.
I've done this because for myself it was easier to understand RSI was becoming oversold if it went below 0, not 50.
The same function also applies to the STOCHASTIC indicator.
The RSI and STOCHASTIC can also be displayed together to help see the conditions of both indicators at once.
--
ADX/DI Trend Strengthpink line = directional with price, bull strength
black line = counter-directional with price, bear strength
histogram = trend strength confirmation
high pink + high histogram = strong bull
high pink + low histogram = weak bull
high black+ high histogram = strong bear
high black + low histogram = weak bear

MACD Color Trawler (by ChartArt)This version of the MACD indicator is 'trawling' (checking) if the MACD histogram and the zero line crossing with the MACD line are both positive or negative. The idea behind this is to show areas with higher or lower risk.
Features:
1. Enable the bar color
2. Enable the background color
3. Change zero line value
FYI:
"The MACD-Histogram is an indicator of an indicator. In fact, MACD is also an indicator of an indicator. This means that the MACD-Histogram is the fourth derivative of price."
First derivative: 12-day EMA and 26-day EMA
Second derivative: MACD (12-day EMA less the 26-day EMA)
Third derivative: MACD signal line (9-day EMA of MACD)
Fourth derivative: MACD-Histogram (MACD less MACD signal line)
Source: stockcharts.com
