Major Session Highs/LowsThis indicator creates horizontal lines at major session high/lows (US, London, and Asian). The script updates the lines automatically, on session close.
For instance, when viewing during the US session, after the London overlap, horizontal lines will be displayed at the following levels.
The high/low of the most recent London session.
The high/low of the most recent Asian session.
The high/low of the last full US session, i.e. the session of the day prior.
When the current US session closes, the US levels automatically update.
Pesquisar nos scripts por "high low"

Break Close High/Low ExtendedBreak Close High/Low Extended
This indicator highlights momentum breakout candles by marking when the candle's close breaks above the previous high (bullish) or below the previous low (bearish). It's designed to help traders quickly identify strong directional intent and potential continuation zones.
🔍 Key Features:
Bullish break candles: Close above the previous candle's high
Bearish break candles: Close below the previous candle's low
Custom bar coloring to visually emphasize breakout candles
Toggleable shapes to mark break candles
Optional shaded boxes that extend a customizable number of bars to the right
Breakout levels displayed as horizontal lines from candle highs/lows
Special highlight for two consecutive breakout candles, capturing extended momentum and volatility
Fully customizable: color pickers, transparency, and extension length
⚙️ Ideal For:
Trend continuation setups
Momentum trading
Breakout confirmation
Scalping and intraday analysis

Exact High/Low IndicatorThis indicator identifies exact equal highs and lows between consecutive candles. If the current candle’s high matches the previous candle’s high (or low matches low), an arrow is plotted on the chart. The arrows disappear if any future candle break the identified high/low, thereby indicating that it is not an unmitigated liquidity pool any longer
Customizable options include:
Arrow size and color
Line thickness and color
Enable/disable plotting of arrows and lines
Offset the arrow so there is space between arrow and candle

Enhanced HHLL Time Confirmation with EMAStrong recommendation , remove the green and red circle , or leave it how it is ;)
To be used on 1 minute chart MSTR , Stock
other time frames are good , ;)
How to Use
HHLL Signals: Look for green triangles (buy) below bars or red triangles (sell) above bars to identify confirmed HH/LL setups with trend alignment.
EMA Signals: Watch for lime circles (buy) below bars or maroon circles (sell) above bars when price crosses the EMA 400 in a trending market.
Trend Context: Use the EMA 400 as a dynamic support/resistance level and the SMA trend filter to gauge market direction.
Enable alerts to get notified of signals in real-time.
Best Practices
Adjust the Lookback Period and Confirmation Minutes to suit your timeframe (e.g., shorter for scalping, longer for swing trading).
Combine with other indicators (e.g., volume, RSI) for additional confirmation.
Test on your preferred market and timeframe to optimize settings.
Indicator Description: Enhanced HHLL Time Confirmation with EMA
Overview
The "Enhanced HHLL Time Confirmation with EMA" is a versatile trading indicator designed to identify key reversal and continuation signals based on Higher Highs (HH), Lower Lows (LL), and a 400-period Exponential Moving Average (EMA). It incorporates time-based confirmation and trend filters to reduce noise and improve signal reliability. This indicator is ideal for traders looking to spot trend shifts or confirm momentum with a combination of price structure and moving average crossovers.
Key Features
Higher High / Lower Low Detection:
Identifies HH and LL based on a customizable lookback period (default: 30 bars).
Signals are confirmed only after a user-defined time period (in minutes, default: 60) has passed since the last HH or LL, ensuring stability.
Trend Filter:
Uses a fast (10-period) and slow (30-period) Simple Moving Average (SMA) crossover to confirm bullish or bearish trends.
Buy signals require a bullish trend (Fast SMA > Slow SMA), and sell signals require a bearish trend (Fast SMA < Slow SMA).
EMA 400 Integration:
Plots a 400-period EMA (customizable) as a long-term trend reference.
Generates additional buy/sell signals when price crosses above (buy) or below (sell) the EMA 400, filtered by trend direction.
Visualizations:
Optional dashed lines for HH and LL levels (toggleable).
Debug markers (diamonds) to visualize HH/LL detection points.
Distinct signal shapes: triangles for HHLL signals (green/red) and circles for EMA signals (lime/maroon).
Alerts:
Built-in alert conditions for HHLL Buy/Sell and EMA Buy/Sell signals, making it easy to stay informed of key events.
Input Parameters
Lookback Period (default: 30): Number of bars to look back for HH/LL detection.
Confirmation Minutes (default: 60): Time (in minutes) required to confirm HH/LL signals.
High/Low Source: Select the price source for HH (default: high) and LL (default: low).
Show HH/LL Lines (default: true): Toggle visibility of HH/LL dashed lines.
Show Debug Markers (default: true): Toggle HH/LL detection markers.
EMA Period (default: 400): Adjust the EMA length.

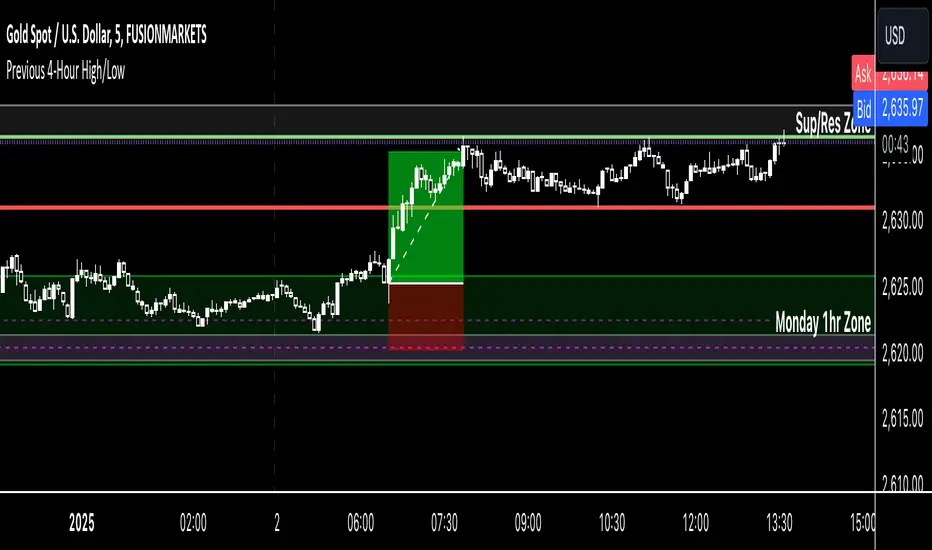
Previous 4-Hour High/Low Indicator Name: Previous 4-Hour High/Low Lines
Description:
This indicator highlights the high and low levels of the previous candle from a user-defined timeframe (default: 4 hours) and extends these levels both to the left and right across the chart. It allows traders to visualize key support and resistance levels from higher timeframes while analyzing lower timeframe charts.
Key Features:
• Customizable Timeframe: Select any timeframe (e.g., 4-hour, daily) to track the high and low of the previous candle.
• Dynamic Updates: The high and low levels update automatically with each new candle.
• Extended Levels: Lines extend both left and right, providing a clear reference for past and future price action.
• Overlay on Chart: The indicator works seamlessly on any timeframe, making it ideal for multi-timeframe analysis.
Use Case:
This tool is perfect for traders who rely on higher timeframe levels for setting entry/exit points, identifying potential breakout zones, or managing risk. By visualizing these levels directly on lower timeframe charts, traders can make informed decisions without switching between charts.
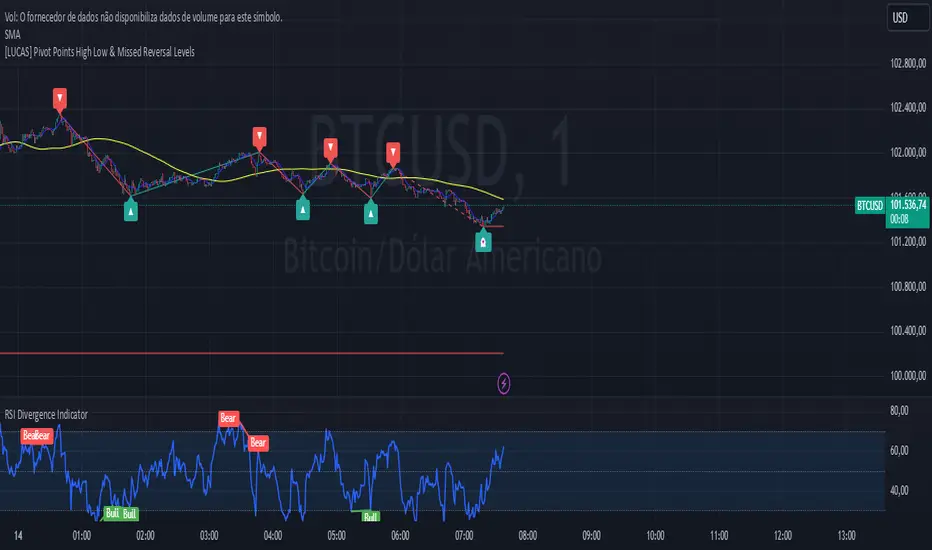
[LUCAS] Pivot Points High Low & Missed Reversal Levels English:
Pivot Points High Low & Missed Reversal Levels Indicator
This TradingView indicator is designed to identify and highlight significant pivot points on the price chart, focusing on high and low levels that might indicate key price levels for potential reversals. It uses historical price data to calculate the pivot points based on high and low values, which traders can use to spot market turning points and make informed trading decisions.
The indicator also includes "Missed Reversal Levels," which are levels where the market previously reversed, but the price didn’t fully reach these levels again, indicating potential future reversal points. These levels are important for identifying price zones that may become support or resistance in the future.
Key Features:
Calculation of pivot points based on high and low levels.
Identification of missed reversal levels, which are critical for predicting future price movements.
Visual markers on the chart to highlight these significant levels for easier analysis.
Português:
Indicador Pontos de Pivô Alta Baixa e Níveis de Reversão Perdidos
Este indicador do TradingView foi desenvolvido para identificar e destacar pontos de pivô significativos no gráfico de preços, com foco nos níveis altos e baixos que podem indicar níveis-chave de preço para possíveis reversões. Ele usa dados históricos de preços para calcular os pontos de pivô com base nos valores máximos e mínimos, o que os traders podem usar para identificar pontos de reversão do mercado e tomar decisões de negociação informadas.
O indicador também inclui "Níveis de Reversão Perdidos", que são níveis onde o mercado reverteu anteriormente, mas o preço não atingiu completamente esses níveis novamente, indicando potenciais pontos de reversão futuros. Esses níveis são importantes para identificar zonas de preço que podem se tornar suporte ou resistência no futuro.
Principais Características:
Cálculo dos pontos de pivô com base nos níveis altos e baixos.
Identificação de níveis de reversão perdidos, críticos para prever futuros movimentos de preço.
Marcadores visuais no gráfico para destacar esses níveis significativos para facilitar a análise.
Español:
Indicador Puntos de Pivote Alto Bajo y Niveles de Reversión Perdidos
Este indicador de TradingView está diseñado para identificar y resaltar puntos de pivote significativos en el gráfico de precios, enfocándose en los niveles altos y bajos que podrían indicar puntos clave de precio para posibles reversiones. Utiliza datos históricos de precios para calcular los puntos de pivote basados en los valores altos y bajos, que los traders pueden usar para detectar puntos de reversión del mercado y tomar decisiones comerciales informadas.
El indicador también incluye los "Niveles de Reversión Perdidos", que son niveles en los que el mercado se invirtió previamente, pero el precio no alcanzó completamente esos niveles nuevamente, indicando puntos de reversión futuros potenciales. Estos niveles son importantes para identificar zonas de precio que pueden convertirse en soporte o resistencia en el futuro.
Características Principales:
Cálculo de puntos de pivote basados en los niveles altos y bajos.
Identificación de niveles de reversión perdidos, cruciales para predecir futuros movimientos de precios.
Marcadores visuales en el gráfico para resaltar estos niveles significativos para un análisis más fácil.
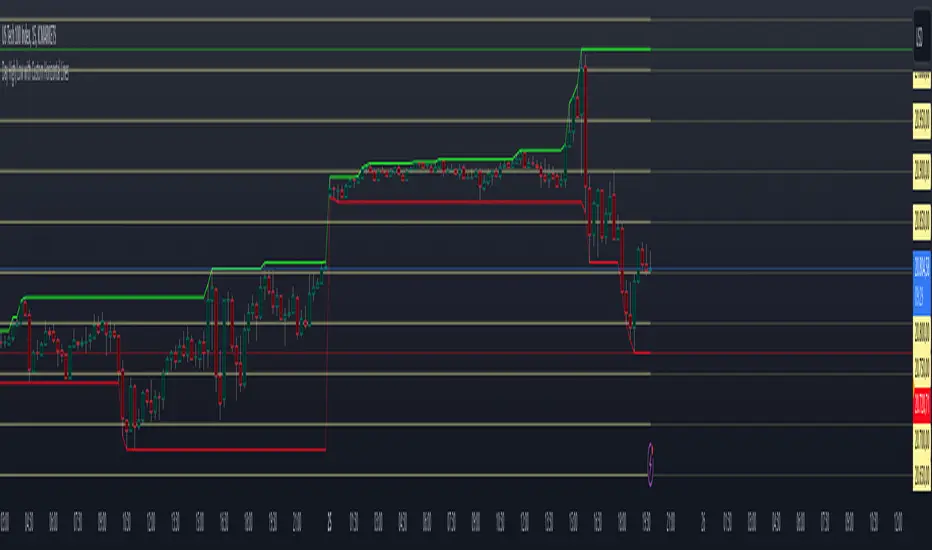
Day High/Low and Horizontal Lines with Custom Increments How It Works:
Day High and Day Low: The indicator tracks and displays the highest and lowest prices of the current trading day. These values are updated dynamically throughout the day.
Custom Horizontal Lines: The user specifies a starting price and an increment value. The indicator then plots multiple horizontal lines above and below the starting price, spaced at the given increment. Up to 15 lines can be drawn in both directions (above and below).
Alerts: Alerts are triggered when the price crosses any of the horizontal lines, helping traders monitor potential breakouts or reversals.
Use Case:
This indicator is useful for traders who want to:
Track the Day High/Low: Easily reference the high and low of the current day as key price levels.
Monitor Key Price Levels: Draw and observe custom horizontal levels above and below a specific price, such as support/resistance levels or price targets.
Set Alerts: Receive notifications when the price crosses these key levels, helping identify potential breakout or breakdown points in the market.
Why Use This Indicator:
Day Trading: Traders can monitor the high and low of the current trading day to see if the price breaks through key levels.
Breakout Strategy: The custom horizontal lines provide reference points for potential breakout levels, with alerts helping traders act in real-time.
Support and Resistance: The plotted lines can represent predefined support or resistance levels, allowing traders to plan their entries and exits effectively.
The indicator gives a structured way to visualize price movements, highlight important price levels, and react quickly with alerts when the price crosses those levels.
2024 - Median High-Low % Change - Monthly, Weekly, DailyDescription:
This indicator provides a statistical overview of Bitcoin's volatility by displaying the median high-to-low percentage changes for monthly, weekly, and daily timeframes. It allows traders to visualize typical price fluctuations within each period, supporting range and volatility-based trading strategies.
How It Works:
Calculation of High-Low % Change: For each selected timeframe (monthly, weekly, and daily), the script calculates the percentage change from the high to the low price within the period.
Median Calculation: The median of these high-to-low changes is determined for each timeframe, offering a robust central measure that minimizes the impact of extreme price swings.
Table Display: At the end of the chart, the script displays a table in the top-right corner with the median values for each selected timeframe. This table is updated dynamically to show the latest data.
Usage Notes:
This script includes input options to toggle the visibility of each timeframe (monthly, weekly, and daily) in the table.
Designed to be used with Bitcoin on daily and higher timeframes for accurate statistical insights.
Ideal for traders looking to understand Bitcoin's typical volatility and adjust their strategies accordingly.
This indicator does not provide specific buy or sell signals but serves as an analytical tool for understanding volatility patterns.

ka66: FX Sessions High/LowThis indicator is specific to the 24-hour Forex Market. It provides 2 features:
Demarcating forex sessions with open and close lines. Note that looking at various sources online, we use the convention that the Asia session starts with the Tokyo market open, rather than the earlier Sydney session. Presumably this is better since we then have more liquidity in the market. Note that we have three sessions: Asia, London, New York.
At the end of each session, we begin plotting that (closed) session's high and low, which acts as a natural support and resistance for the Forex market. This is the key feature it provides. The first feature is mainly there for a visual guide, which can be turned off via the UI settings, but it certainly helps verifying the logic!
For more background, we are taking the idea of Previous Day High/Low (PDH/PDL), but adjusting it to a multi-session market like Forex. In essence, this is is a "Previous Session High/Low" indicator.
PDH/PDL works fine when you have a market with Regular Trading Hours, ignoring Extended Hours. However, in the Forex market, each session can have differing sentiments, e.g. we often see say London bringing prices up, and New York bringing them back down.
The break of session high/lows (or bouncing off them) can reflect where the potential direction price is going to take.
I also categorised this as a Sentiment indicator, because support and resistance areas where prices react do provide the sentiment of the market. They aren't just lines, they are prices of interest to major players.

Cumulative Volume Price (Candle Body, High-Low)Indicator Description: Cumulative Volume Price (Candle Body, High Low)
This indicator features three cumulative plots that continuously accumulate values over time.
Cumulative Volume Plot:
The first plot displays the cumulative volume, calculated by continuously adding the volume values from zero.
Cumulative Candle Body Width Plot:
The second plot displays the cumulative width of the candle bodies, obtained by continuously adding the actual body widths from zero.
Cumulative Candle High-Low Width Plot:
The third plot displays the cumulative width of the candle high-low ranges, calculated by continuously adding the widths between the high and low prices from zero.
Usage Guidelines:
Due to the different orders of magnitude in value range used for volume and candlesticks, it is advisable to typically select and display any single plot.
説明
このインジケーターは、時間の経過とともに値を累積し続ける3つのプロットを備えています。
累積ボリューム:
ボリュームの値をゼロから累積的に加算しています。
ローソク足の累積実体幅:
ローソク足の実体幅の値をゼロから累積的に加算しています。
ローソク足の累積高安幅:
ローソク足の高安の幅の値をゼロから累積的に表示しています。
使用ガイドライン:
ボリュームとローソク足で使用する数値のオーダーが異なるため、通常は任意の一本を選択して表示することを想定しています。

BTC Log High/Low ChartThis indicator calculates the logarithmic values of the high and low prices of BTC based on a mathematical formula and plots them on the chart. The code uses the current time and width of the chart to calculate the logarithmic values of the high and low prices. It defines functions to convert a timestamp to the number of days since January 1st, 2009.
You can use it with BTC Log High/Low:

Typical Sweeps: Pivot high/low boxes. Grade sweeps, Handles/PipsTool to show typical pip-grade/ handle-grade sweep distance above pivot highs and pivot lows
-In consolidation/ranging periods (i.e. most of the time); Highs/Lows may by swept by fairly consistent distances in typical stop raids.
-Idea is from ICT teaching on typical Pip-grade sweeps in FX (10,20,30pips). Designed to work on FX, Indices, Commodities, Bitcoin.
-Above chart shows S&P; sweeping below and then above by 5 handles.
///inputs///
~choose sweep distance handles ($) or pips: will auto-calculate depending on the asset: FX= pips; Indices/stocks/commodities = handles ($)
--(2,5,10,20,30,50,100, 500, 1000)
~choose pivot lookback: larger number for more significant swing highs/lows
~choose number of historical boxes to display
~toggle on/off Pivot high boxes and Pivot low boxes independently
~extend boxes fully to the right (default is not extend)
~toggle on/off text
~text & box formatting options
Bitcoin, hourly chart; Pivot lookback = 15; $100 sweep boxes:
Eur/Usd; 15m chart; Pivot lookback = 30; 10pip sweep boxes; Boxes extended fully to the right:

Net New Highs/Lows (With visible code)Basically the same script than Carusolnsights but without hidding the lines of code...
"This indicator displays the net number of stocks on the Nasdaq Composite making 52-week highs or lows. For instance, if there are 60 new 52-week highs and 20 new 52-week lows, the net number will display 40 net new 52 week highs. This indicator is particularty useful in gauging what the breadth is of the Nasdaq.
Three days of net 52-week highs show a healthy market which is conducive to increasing exposure. This condition is highlighted with a green background.
Three days of net 52-week lows show an unhealthy market which is conducive to reducing exposure. This condition is high|lighted with a red background."

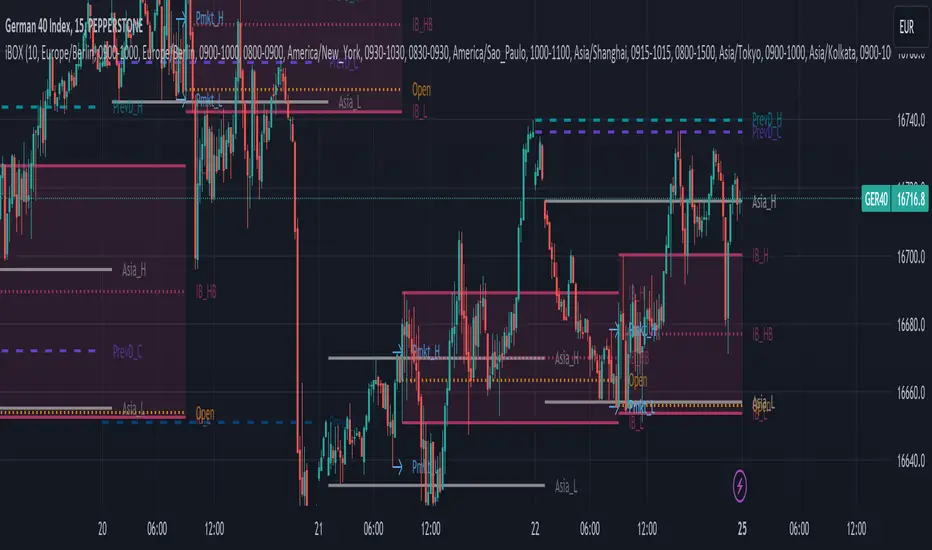
iBox, Initial Balance | IB High, Low, Midpoint | OpeningThis Indicator will print basically 4 lines.
You have to understand the importance of the "Initial Balance" the first trading hour of Cash session is very important in trading stocks and indizes.
So you will get 4 lines:
Opening
Initial Balance High
Initial Balance Low
Initial Balance Midpoint/Halfback
Most indicators for Range Box, Opening Trade, Opening Range, Initial Balance, iBOX and "Ultimate Lines" will only use the timezone of the exchange or your own timezone. I'm living in europe and we have this daylight saving time change in Summer/Winter - which will cause problems with most of the existing indicators or at least will push you to change the times regularly.
Another important point: I really like to switch the indizes when trading on my mobile. So what will happen when you set up opening range for DAX at 09:00 and then switch to S&P500? All indicators I tried failed here - they will just draw a wrong line for SPX, NDX, DJI, FTSE, ASX etc. I fixed that and hard coded stock exchanges and ticker symbols into 3 main groups Initial Balance EU/US/Asia
For example we take DAX - XETRA DAX is opening at 09:00 MEZ (Europe/Berlin)
The Initial Balance is set during the H1 Candle from 09:00 - 09:59
Please be aware, that some cash indizes only deliver data to TradingView after the "opening auction" - so for Xetra DAX you have to book live data and often you will only see data at 09:02/09:03 after the opening auction.
So you will get different opening lines compared from cash to future or your CFD provider. Future and CFD should fit for 99%
The Opening Line will be drawn at exactly 09:00
IB High on the highest price during the H1 candle
IB Low on the lowest price during the H1 candle
IB Halfback is simple: (IB High + IB Low) / 2
The lines will be drawn from cash start until next day and will end 2 minutes before the next cash session will start again. Please make your own experience! Activate the indicator for a CFD or Future switch to M15 and watch the wicks around the 4 lines. Even in the night or the next morning before the next Initial Balance will be set.
For me the lines are valid for around 24 hours and often longer. That's why it's good to have the old lines on the chart too.
To-do:
Yesterday high / low / close / halfback (also for last week and month)
Labels for the lines - sometimes only the colors will confuse you - a simple label should be a benefit (IB_h, IB_l, IB_1/2, 1D_o)
Range Lines for Asia Range and Premarket Range - additionaly a parameter to disable premarket lines when premarket is trading in asia range.
Add Alert condition to get alerts after IB is set
If you have and thoughts, ideas or improvements, please send me an message or leave an comment!
Like i said, the stock exchanges and ticker symbols are hard coded and can be extended for all relevant assets.
Have fun and i really hope this indicator will help improving your trading experience!
Pre Market \ Opening Range High LowGreen vertical lines are showing pre market open and then the opening range as the first hour of market NYSE market open
Pre market high and low are blue lines | intraday opening range high low are in white
Trades are taken in the current direction above | below range breaks with the direction of price action using the moving averages
Price breaking through moving averages and a range is the optimal trade to enter - exit at next range for target - stop loss below the lower | higher moving average depending on short or long
A break above or below the intraday high or low and pre market high or low can give massive profits trailing your stop loss as price runs
Using MA 5 and 12 to filter out entries and exits above or below the ranges short or long is also another strategy to implement
BEST TIME FRAME TO USE IS 5 MINUTE

HTF Liquidity Levels█ OVERVIEW
The indicator introduces a new representation of the previous days, weeks, and months highs & lows ( DWM HL ) with a focus on untapped levels.
█ CONCEPTS
Untapped Levels
It is popularly known that the liquidity is located behind swing points or beyond higher time frames highs/lows (in a sense, an intraday swing point is a day high/low). These key areas are said "liquid" because of the accumulation of resting orders, mainly in the form of stop-loss orders. And this more significantly on higher time frames which have more time for stacking orders. As the result, the indicator aims to keep track of untapped levels that have their liquidity states intact.
Liquidity Pools
Once a liquidity level identified, or better, a cluster of liquidity levels work as magnets for the market. The price is more likely to make its way towards heavier pockets of liquidity, by proximity (the closest liquidity pool), and by difficulty (path with less obstacles). This phenomenon is referred as liquidity run, raid, purge, grab, hunt, sweep, you name it. Consequently, the indicator can help you frame a directional bias during your trading session.
█ NOTES
Drawings
Once a level is tapped, it is highlighted. At the end of each day, all tapped levels are cleared.

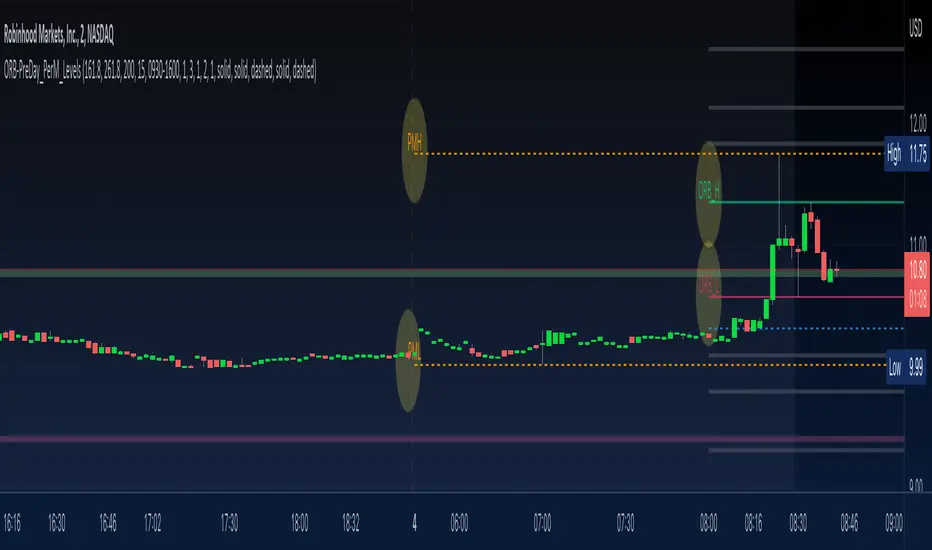
ORB-PreDay_PerM_LevelsThis script provides following levels:
1. ORB Level - You can adjust the timeframe of Opening Range (plots from 9am to 4pm)
2. ORB Fib Extension - 1.618 and 2.618 Fibonacci Extension of ORB High and Low (plots from 9am to 4pm)
3. Previous Day High/Low/Close - You can adjust color/thickness of the lines (plots from two days ago so that you can clearly see the levels)
4. Previous Two Days High/Low (plots from two days ago so that you can clearly see the levels)
5. Pre-Market High/Low (plots from 6:30am to 11am)
All in one indicator gives much better clarity of where current instrument is trading in relation to ORB, Previous Day Levels and Previous Two Days Levels along with Pre Market Levels.
You could combine these levels with your favorite EMA or EMA Cloud to create a trading system.
You could combine these levels with MA Cloud and ATR vs DTR script to gauge the move.
Look at the TWTR Chart today and see how these levels are respected.
Initial Balance (IB) and Previous Day / Week High, Low & ClosePlots Historical key levels for volume profile idea.
Plots the following:
- Previous Day High
- Previous Day Low
- Previous Day Close
- Previous Day IB High
- Previous Day IB Low
- Current Days IB High
- Current Days IB Low
IB is based on first hour of trading.
Made specifically for ASX stocks, have not tested it on other exchanges or assets.
Swing Highs/Lows & Candle Patterns [LuxAlgo]This script labels swing highs and swing lows as well as the candle pattern that occurred at that precise point. The script can detect the following 6 candle patterns: hammer, inverse hammer, bullish engulfing, hanging man, shooting star, and bearish engulfing.
This indicator by its very nature backpaints by default, meaning that the displayed components are offset in the past.
🔶 USAGE
It can be interesting to see if a top or bottom is associated with a specific candle pattern, this allows us to study the potential of such a pattern to indicate a reversal. You can hover on a label with a specific pattern to see more details about it.
The notations HH, HL, LH, and LL you can see on the labels are defined as follows:
HH : Higher high
HL : Higher low
LH : Lower high
LL : Lower low
🔶 SETTING
Length: Sensitivity of the swing high/low detection, with lower values returning the maximum/minimum of shorter-term price variations.

swing high low extension multi time frame MTFThis is the Multi time frame MTF version of our swing high low extension indicator.
Now you can use this indicator to plot the swing high low extension lines from higher time frames on current chart.
For example, if you input 60 as the Timeframe and your current chart timeframe is 5 minute, it will plot 60 minutes swing high low extension lines on the 5 minute chart.
Features and inputs:
Using different input value for swing high strength and swing low strength.
Input higher time frame by number as minute, such as 120 means 2 hours. You can also use 35, 100 or 48.
Set different type of alerts:
Close crosses below the swing low.
Close crosses above the swing high.
Close is above the swing high.
Close is below the swing low.
Please purchase the indicator access from our website.

Japanese Correlation CoefficientIntroduction
This indicator was asked and named by a trading meetup participant in Sevilla. The original question was "How to estimate the correlation between the price and a line as easy as possible", a question who got little attention. I previously proposed a correlation estimate using a modification of the standard score (see at the end of the post) for the estimation of a Savitzky-Golay moving average (LSMA) of order 1, however something faster could maybe be done and this is why i accepted the challenge.
Japanese Correlation
Correlation is defined as the linear relationship between two variables x and y , if x and y follow the same direction then the correlation increase else decrease. The correlation coefficient is always equal or below 1 and equal or above -1, it also have to be taken into account that this coefficient is quite smooth. Smoothing is not a problem, scaling however require more attention, high price > closing price > low price, therefore scaling can be done. First we smooth the closing/high/low price with a simple moving average of period p/2 , then we take the difference of the smoothed close with the smoothed close p/2 bars back, this result is then divided by the difference between the highest smoothed high's with the lowest smoothed low's over period p/2 .
Since we use information provided by candlesticks (close/high/low) i have been asked to publish this estimator with the name Japanese correlation coefficient , this name don't imply the use of data from Japanese markets, "Japanese" is used because of the candlestick method coming from Japan.
Comparison
I compare this estimation with the correlation coefficient provided in pinescript by the correlation function.
The estimation in orange with the original correlation coefficient using n as independent variable in blue with both length = 50.
comparison with length = 200.
Conclusion
I have shown that it is possible to roughly estimate the correlation coefficient between price and a linear function by using different price information. Correlation can be further estimated by using homogeneous bridge OHLC volatility estimators thus making able the use of different independent variables. I really hope you like this indicator and thanks to the meetup participant asking the question, i had a lot of fun making the indicator.
An alternative method

52 Week & Daily & Current High/LowThis Indicator Plots a 52 Week High and Low equal or below daily.
A 52 Daily High and Low on timeframes below daily.
A 52 Bars High and Low on timeframes on any timeFrame.
Based on 52 Week High/Low by BacktestRookies

Pivots High/Low 3bar No Period w/ Signals -Tom1traderwww.tradingview.com
This price action indicator calculated on the relationship of 3 adjacent bars/candles adds an extra dimension to my indicator mix and with
a different perspective can help confirm or question an opinion formed by other indications (volume related, momentum, the chart itself and etc.).
Further, I have traded with it a bit now and like it. So much for comfort - I have seen no clear evidence that the movement of the next bar is paying any
attention to indicators, lines or patterns on charts. They are all based on the same historical data whether that data is run through an indicator algorithm
or used to draw (chart style) on a chart. But they make me feel better about my trades and I prefer them to a coin flip. :-)
Pivot High Definition - (Pivot Low is reversed): A three-bar pivot high represents resistance and is formed when sellers turn price from up to down. It is seen where a price bar with a lower high closes below the previous bar's low, where the previous bar's high is higher than the bar that preceded it.
Read more: Price Pivots Circle Big Profits www.investopedia.com
Follow us: Investopedia on Facebook
I see some n period high/low indicators named pivots. This indicator has no period and is based on the relationship of 3 bars usually referred to as Pivots High Low.
Also no relationship to daily calculated "Pivot Points". As such this is a PRICE ACTION indicator. It works the same on ALL TIME FRAMES.
These pivots sometimes do not occur very often and usually are not at tops or bottoms.
This is why I used a combination of most recent PHs and PLs along with
the price to derive the signal.
