Harmonic Pattern Detection [LuxAlgo]Harmonic patterns make up a major part of the many patterns traders use to make investment decisions. The following tool aims to automatically categorize which XABCD harmonic pattern is highlighted by the user and to alert when the price reaches the PRZ or D point.
The tool can categorize Bat, Gartley, Butterfly, and Crab patterns.
Settings
XA Precision: The Gartley and Butterfly patterns require precise ratios for the XA segment, this setting allows giving some headroom for the detection of these patterns. For example, the Gartley pattern requires a ratio for the XA segment of 0.618, using an XA precision of 0.01 will allow the segment to be considered correct if above 0.608 and under 0.628.
Bullish: Color of a bullish pattern
Bearish: Color of a bearish pattern
The X, A, B, C, D settings determine the location of the harmonic pattern vertices. The user does not need to change them from the settings, instead only requiring adjusting their location on the chart like with a regular drawing tool. Setting these vertices is required when adding the indicator to your chart.
Usage
Upon setting the harmonic pattern vertices, the segments, as well as each ratio and PRZ, will be displayed. A dashboard in the top right displays which harmonic pattern has been detected.
Detected bearish crab pattern on BTCUSD15.
Bullish butterfly pattern on MATICUSD15. It is important not to use an XA precision value that would return overlapping ranges between the Gartley/Harmonic and other patterns. Using the default value is recommended.
The upper limit of the PRZ is determined as vertex D plus 38.2% of segment DX, while the lower limit is the vertex D minus 38.2% of segment DX. Various methods exist for the determination of the PRZ, this one is general but the user can use one proper to the detected harmonic pattern.
Finally hovering on the label highlighting the segment ratios return the proper ratio used by each harmonic pattern for that precise segment.
Pesquisar nos scripts por "harmonic"

Harmonic Liquidity Waves [JOAT]Harmonic Liquidity Waves
Overview
Harmonic Liquidity Waves is an open-source oscillator indicator that combines multiple volume-based analysis techniques into a unified liquidity flow framework. It integrates VWAP calculations, Chaikin Money Flow (CMF), Money Flow Index (MFI), and Klinger Volume Oscillator (KVO) with custom harmonic wave calculations to provide a comprehensive view of volume dynamics and money flow.
What This Indicator Does
The indicator calculates and displays:
Liquidity Flow - Volume-weighted price movement accumulated over a lookback period
Harmonic Wave - Multi-depth smoothed oscillator derived from liquidity flow
Chaikin Money Flow (CMF) - Classic accumulation/distribution indicator
Money Flow Index (MFI) - Volume-weighted RSI showing buying/selling pressure
Klinger Volume Oscillator (KVO) - Trend-volume relationship indicator
Wave Interference - Combined constructive/destructive wave patterns
Volume Profile POC - Point of Control from simplified volume distribution
How It Works
The core liquidity flow calculation tracks volume-weighted price changes:
calculateLiquidityFlow(series float vol, series float price, simple int period) =>
float priceChange = ta.change(price)
float volumeFlow = vol * math.sign(priceChange)
// Accumulated over period using buffer array
float avgFlow = flowSum / period
avgFlow
The harmonic oscillator applies multi-depth smoothing:
harmonicOscillator(series float flow, simple int depth, simple int period) =>
float harmonic = 0.0
for i = 1 to depth
float wave = ta.ema(flow, period * i) / i
harmonic += wave
harmonic / depth
CMF measures accumulation/distribution using the Money Flow Multiplier:
float mfm = ((close - low) - (high - close)) / (high - low)
float mfv = mfm * vol
float cmf = ta.sum(mfv, period) / ta.sum(vol, period) * 100
Signal Generation
Liquidity shift signals occur when:
Bullish Shift: Smoothed wave crosses above signal line
Bearish Shift: Smoothed wave crosses below signal line
Strong signals require volume indicator confirmation:
Strong Bull: Bullish shift + CMF > 0 + MFI > 50 + KVO > 0
Strong Bear: Bearish shift + CMF < 0 + MFI < 50 + KVO < 0
Divergence detection compares price pivots with liquidity wave pivots to identify potential reversals.
Dashboard Panel (Bottom-Right)
Wave Strength - Normalized wave magnitude
Volume Pressure - Current volume vs average percentage
Flow Direction - BUYING or SELLING based on wave sign
Histogram - Wave minus signal line value
CMF - Chaikin Money Flow reading
MFI - Money Flow Index value (0-100)
KVO - Klinger oscillator value
Vol Confluence - Combined volume indicator score
Signal - Current actionable status
Visual Elements
Liquidity Wave - Main oscillator line
Wave Signal - Smoothed signal line for crossover detection
Wave Histogram - Difference between wave and signal
Wave Interference - Area plot showing combined wave patterns
CMF/KVO/MFI Lines - Individual volume indicator plots
Divergence Labels - BULL DIV / BEAR DIV markers
Shift Markers - Triangles for basic shifts, labels for strong shifts
Input Parameters
Wave Period (default: 21) - Base period for liquidity calculations
Volume Weight (default: 1.5) - Multiplier for volume emphasis
Harmonic Depth (default: 3) - Number of smoothing layers
Smoothing (default: 3) - Final wave smoothing period
Suggested Use Cases
Identify accumulation/distribution phases using CMF and wave direction
Confirm momentum with MFI overbought/oversold readings
Watch for divergences between price and liquidity flow
Use strong signals when multiple volume indicators align
Timeframe Recommendations
Best on 15m to Daily charts. Volume-based indicators require sufficient trading activity for meaningful readings.
Limitations
Volume data quality varies by exchange and instrument
Divergence detection uses pivot-based lookback and may lag
Volume Profile POC is simplified and not a full profile analysis
Open-Source and Disclaimer
This script is published as open-source under the Mozilla Public License 2.0 for educational purposes. It does not constitute financial advice. Past performance does not guarantee future results. Always use proper risk management.
- Made with passion by officialjackofalltrades

Harmonic Pattern Table Inputs█ OVERVIEW
This indicator was intended as educational purpose only based on Harmonic Pattern Table (Source Code) .
Some user have different ratios in mind, thus I add input to allow user to change those ratios.
█ CREDITS
Scott M Carney, Trading Volume 3: Reaction vs. Reversal
█ CREDITS
1. List Harmonic Patterns.
2. Font size small for mobile app and font size normal for desktop.
3. Font color does automatically change follow dark / light chart theme.
4. Inputs to change ratio values.
█ USAGE / EXAMPLES
harmonicpatternsLibrary "harmonicpatterns"
harmonicpatterns: methods required for calculation of harmonic patterns. These are customised to be used in my scripts. But, also simple enough for others to make use of :)
isGartleyPattern(xabRatio, abcRatio, bcdRatio, xadRatio, err_min, err_max) isGartleyPattern: Checks for harmonic pattern Gartley
Parameters:
xabRatio : AB/XA
abcRatio : BC/AB
bcdRatio : CD/BC
xadRatio : AD/XA
err_min : Minumum error threshold
err_max : Maximum error threshold
Returns: True if the pattern is Gartley. False otherwise.
isBatPattern(xabRatio, abcRatio, bcdRatio, xadRatio, err_min, err_max) isBatPattern: Checks for harmonic pattern Bat
Parameters:
xabRatio : AB/XA
abcRatio : BC/AB
bcdRatio : CD/BC
xadRatio : AD/XA
err_min : Minumum error threshold
err_max : Maximum error threshold
Returns: True if the pattern is Bat. False otherwise.
isButterflyPattern(xabRatio, abcRatio, bcdRatio, xadRatio, err_min, err_max) isButterflyPattern: Checks for harmonic pattern Butterfly
Parameters:
xabRatio : AB/XA
abcRatio : BC/AB
bcdRatio : CD/BC
xadRatio : AD/XA
err_min : Minumum error threshold
err_max : Maximum error threshold
Returns: True if the pattern is Butterfly. False otherwise.
isCrabPattern(xabRatio, abcRatio, bcdRatio, xadRatio, err_min, err_max) isCrabPattern: Checks for harmonic pattern Crab
Parameters:
xabRatio : AB/XA
abcRatio : BC/AB
bcdRatio : CD/BC
xadRatio : AD/XA
err_min : Minumum error threshold
err_max : Maximum error threshold
Returns: True if the pattern is Crab. False otherwise.
isDeepCrabPattern(xabRatio, abcRatio, bcdRatio, xadRatio, err_min, err_max) isDeepCrabPattern: Checks for harmonic pattern DeepCrab
Parameters:
xabRatio : AB/XA
abcRatio : BC/AB
bcdRatio : CD/BC
xadRatio : AD/XA
err_min : Minumum error threshold
err_max : Maximum error threshold
Returns: True if the pattern is DeepCrab. False otherwise.
isCypherPattern(xabRatio, axcRatio, xadRatio, err_min, err_max) isCypherPattern: Checks for harmonic pattern Cypher
Parameters:
xabRatio : AB/XA
axcRatio : XC/AX
xadRatio : AD/XA
err_min : Minumum error threshold
err_max : Maximum error threshold
Returns: True if the pattern is Cypher. False otherwise.
isSharkPattern(xabRatio, abcRatio, bcdRatio, xadRatio, err_min, err_max) isSharkPattern: Checks for harmonic pattern Shark
Parameters:
xabRatio : AB/XA
abcRatio : BC/AB
bcdRatio : CD/BC
xadRatio : AD/XA
err_min : Minumum error threshold
err_max : Maximum error threshold
Returns: True if the pattern is Shark. False otherwise.
isNenStarPattern(xabRatio, abcRatio, bcdRatio, xadRatio, err_min, err_max) isNenStarPattern: Checks for harmonic pattern Nenstar
Parameters:
xabRatio : AB/XA
abcRatio : BC/AB
bcdRatio : CD/BC
xadRatio : AD/XA
err_min : Minumum error threshold
err_max : Maximum error threshold
Returns: True if the pattern is Nenstar. False otherwise.
isAntiNenStarPattern(xabRatio, abcRatio, bcdRatio, xadRatio, err_min, err_max) isAntiNenStarPattern: Checks for harmonic pattern Anti NenStar
Parameters:
xabRatio : - AB/XA
abcRatio : - BC/AB
bcdRatio : - CD/BC
xadRatio : - AD/XA
err_min : - Minumum error threshold
err_max : - Maximum error threshold
Returns: True if the pattern is Anti NenStar. False otherwise.
isAntiSharkPattern(xabRatio, abcRatio, bcdRatio, xadRatio, err_min, err_max) isAntiSharkPattern: Checks for harmonic pattern Anti Shark
Parameters:
xabRatio : AB/XA
abcRatio : BC/AB
bcdRatio : CD/BC
xadRatio : AD/XA
err_min : Minumum error threshold
err_max : Maximum error threshold
Returns: True if the pattern is Anti Shark. False otherwise.
isAntiCypherPattern(xabRatio, abcRatio, bcdRatio, xadRatio, err_min, err_max) isAntiCypherPattern: Checks for harmonic pattern Anti Cypher
Parameters:
xabRatio : AB/XA
abcRatio : BC/AB
bcdRatio : CD/BC
xadRatio : AD/XA
err_min : Minumum error threshold
err_max : Maximum error threshold
Returns: True if the pattern is Anti Cypher. False otherwise.
isAntiCrabPattern(xabRatio, abcRatio, bcdRatio, xadRatio, err_min, err_max) isAntiCrabPattern: Checks for harmonic pattern Anti Crab
Parameters:
xabRatio : AB/XA
abcRatio : BC/AB
bcdRatio : CD/BC
xadRatio : AD/XA
err_min : Minumum error threshold
err_max : Maximum error threshold
Returns: True if the pattern is Anti Crab. False otherwise.
isAntiBatPattern(xabRatio, abcRatio, bcdRatio, xadRatio, err_min, err_max) isAntiBatPattern: Checks for harmonic pattern Anti Bat
Parameters:
xabRatio : AB/XA
abcRatio : BC/AB
bcdRatio : CD/BC
xadRatio : AD/XA
err_min : Minumum error threshold
err_max : Maximum error threshold
Returns: True if the pattern is Anti Bat. False otherwise.
isAntiGartleyPattern(xabRatio, abcRatio, bcdRatio, xadRatio, err_min, err_max) isAntiGartleyPattern: Checks for harmonic pattern Anti Gartley
Parameters:
xabRatio : AB/XA
abcRatio : BC/AB
bcdRatio : CD/BC
xadRatio : AD/XA
err_min : Minumum error threshold
err_max : Maximum error threshold
Returns: True if the pattern is Anti Gartley. False otherwise.
isNavarro200Pattern(xabRatio, abcRatio, bcdRatio, xadRatio, err_min, err_max) isNavarro200Pattern: Checks for harmonic pattern Navarro200
Parameters:
xabRatio : AB/XA
abcRatio : BC/AB
bcdRatio : CD/BC
xadRatio : AD/XA
err_min : Minumum error threshold
err_max : Maximum error threshold
Returns: True if the pattern is Navarro200. False otherwise.
isHarmonicPattern(x, a, c, c, d, flags, errorPercent) isHarmonicPattern: Checks for harmonic patterns
Parameters:
x : X coordinate value
a : A coordinate value
c : B coordinate value
c : C coordinate value
d : D coordinate value
flags : flags to check patterns. Send empty array to enable all
errorPercent : Error threshold
Returns: Array of boolean values which says whether valid pattern exist and array of corresponding pattern names

AL-Ghamdi Table Harmonic
AL-Ghamdi Table Harmonic
A simple note showing the proportions of the harmonic models
With correction, target and stop loss

Harmonic Patterns Library [TradingFinder]🔵 Introduction
Harmonic patterns blend geometric shapes with Fibonacci numbers, making these numbers fundamental to understanding the patterns.
One person who has done a lot of research on harmonic patterns is Scott Carney.Scott Carney's research on harmonic patterns in technical analysis focuses on precise price structures based on Fibonacci ratios to identify market reversals.
Key patterns include the Gartley, Bat, Butterfly, and Crab, each with specific alignment criteria. These patterns help traders anticipate potential market turning points and make informed trading decisions, enhancing the predictability of technical analysis.
🟣 Understanding 5-Point Harmonic Patterns
In the current library version, you can easily draw and customize most XABCD patterns. These patterns often form M or W shapes, or a combination of both. By calculating the Fibonacci ratios between key points, you can estimate potential price movements.
All five-point patterns share a similar structure, differing only in line lengths and Fibonacci ratios. Learning one pattern simplifies understanding others.
🟣 Exploring the Gartley Pattern
The Gartley pattern appears in both bullish (M shape) and bearish (W shape) forms. In the bullish Gartley, point X is below point D, and point A surpasses point C. Point D marks the start of a strong upward trend, making it an optimal point to place a buy order.
The bearish Gartley mirrors the bullish pattern with inverted Fibonacci ratios. In this scenario, point D indicates the start of a significant price drop. Traders can place sell orders at this point and buy at lower prices for profit in two-way markets.
🟣 Analyzing the Butterfly Pattern
The Butterfly pattern also manifests in bullish (M shape) and bearish (W shape) forms. It resembles the Gartley pattern but with point D lower than point X in the bullish version.
The Butterfly pattern involves deeper price corrections than the Gartley, leading to more significant price fluctuations. Point D in the bullish Butterfly indicates the beginning of a sharp price rise, making it an entry point for buy orders.
The bearish Butterfly has inverted Fibonacci ratios, with point D marking the start of a sharp price decline, ideal for sell orders followed by buying at lower prices in two-way markets.
🟣 Insights into the Bat Pattern
The Bat pattern, appearing in bullish (M shape) and bearish (W shape) forms, is one of the most precise harmonic patterns. It closely resembles the Butterfly and Gartley patterns, differing mainly in Fibonacci levels.
The bearish Bat pattern shares the Fibonacci ratios with the bullish Bat, with an inverted structure. Point D in the bearish Bat marks the start of a significant price drop, suitable for sell orders followed by buying at lower prices for profit.
🟣 The Crab Pattern Explained
The Crab pattern, found in both bullish (M shape) and bearish (W shape) forms, is highly favored by analysts. Discovered in 2000, the Crab pattern features a larger final wave correction compared to other harmonic patterns.
The bearish Crab shares Fibonacci ratios with the bullish version but in an inverted form. Point D in the bearish Crab signifies the start of a sharp price decline, making it an ideal point for sell orders followed by buying at lower prices for profitable trades.
🟣 Understanding the Shark Pattern
The Shark pattern appears in bullish (M shape) and bearish (W shape) forms. It differs from previous patterns as point C in the bullish Shark surpasses point A, with unique level measurements.
The bearish Shark pattern mirrors the Fibonacci ratios of the bullish Shark but is inverted. Point D in the bearish Shark indicates the start of a sharp price drop, ideal for placing sell orders and buying at lower prices to capitalize on the pattern.
🟣 The Cypher Pattern Overview
The Cypher pattern is another that appears in both bullish (M shape) and bearish (W shape) forms. It resembles the Shark pattern, with point C in the bullish Cypher extending beyond point A, and point D forming within the XA line.
The bearish Cypher shares the Fibonacci ratios with the bullish Cypher but in an inverted structure. Point D in the bearish Cypher marks the start of a significant price drop, perfect for sell orders followed by buying at lower prices.
🟣 Introducing the Nen-Star Pattern
The Nen-Star pattern appears in both bullish (M shape) and bearish (W shape) forms. In the bullish Nen-Star, point C extends beyond point A, and point D, the final point, forms outside the XA line, making CD the longest wave.
The bearish Nen-Star has inverted Fibonacci ratios, with point D indicating the start of a significant price drop. Traders can place sell orders at point D and buy at lower prices to profit from this pattern in two-way markets.
The 5-point harmonic patterns, commonly referred to as XABCD patterns, are specific geometric price structures identified in financial markets. These patterns are used by traders to predict potential price movements based on historical price data and Fibonacci retracement levels.
Here are the main 5-point harmonic patterns :
Gartley Pattern
Anti-Gartley Pattern
Bat Pattern
Anti-Bat Pattern
Alternate Bat Pattern
Butterfly Pattern
Anti-Butterfly Pattern
Crab Pattern
Anti-Crab Pattern
Deep Crab Pattern
Shark Pattern
Anti- Shark Pattern
Anti Alternate Shark Pattern
Cypher Pattern
Anti-Cypher Pattern
🔵 How to Use
To add "Order Block Refiner Library", you must first add the following code to your script.
import TFlab/Harmonic_Chart_Pattern_Library_TradingFinder/1 as HP
🟣 Parameters
XABCD(Name, Type, Show, Color, LineWidth, LabelSize, ShVF, FLPC, FLPCPeriod, Pivot, ABXAmin, ABXAmax, BCABmin, BCABmax, CDBCmin, CDBCmax, CDXAmin, CDXAmax) =>
Parameters:
Name (string)
Type (string)
Show (bool)
Color (color)
LineWidth (int)
LabelSize (string)
ShVF (bool)
FLPC (bool)
FLPCPeriod (int)
Pivot (int)
ABXAmin (float)
ABXAmax (float)
BCABmin (float)
BCABmax (float)
CDBCmin (float)
CDBCmax (float)
CDXAmin (float)
CDXAmax (float)
🟣 Genaral Parameters
Name : The name of the pattern.
Type: Enter "Bullish" to draw a Bullish pattern and "Bearish" to draw an Bearish pattern.
Show : Enter "true" to display the template and "false" to not display the template.
Color : Enter the desired color to draw the pattern in this parameter.
LineWidth : You can enter the number 1 or numbers higher than one to adjust the thickness of the drawing lines. This number must be an integer and increases with increasing thickness.
LabelSize : You can adjust the size of the labels by using the "size.auto", "size.tiny", "size.smal", "size.normal", "size.large" or "size.huge" entries.
🟣 Logical Parameters
ShVF : If this parameter is on "true" mode, only patterns will be displayed that they have exact format and no noise can be seen in them. If "false" is, the patterns displayed that maybe are noisy and do not exactly correspond to the original pattern.
FLPC : if Turned on, you can see this ability of patterns when their last pivot is formed. If this feature is off, it will see the patterns as soon as they are formed. The advantage of this option being clear is less formation of fielded patterns, and it is accompanied by the lateest pattern seeing and a sharp reduction in reward to risk.
FLPCPeriod : Using this parameter you can determine that the last pivot is based on Pivot period.
Pivot : You need to determine the period of the zigzag indicator. This factor is the most important parameter in pattern recognition.
ABXAmin : Minimum retracement of "AB" line compared to "XA" line.
ABXAmax : Maximum retracement of "AB" line compared to "XA" line.
BCABmin : Minimum retracement of "BC" line compared to "AB" line.
BCABmax : Maximum retracement of "BC" line compared to "AB" line.
CDBCmin : Minimum retracement of "CD" line compared to "BC" line.
CDBCmax : Maximum retracement of "CD" line compared to "BC" line.
CDXAmin : Minimum retracement of "CD" line compared to "XA" line.
CDXAmax : Maximum retracement of "CD" line compared to "XA" line.
🟣 Function Outputs
This library has two outputs. The first output is related to the alert of the formation of a new pattern. And the second output is related to the formation of the candlestick pattern and you can draw it using the "plotshape" tool.
Candle Confirmation Logic :
Example :
import TFlab/Harmonic_Chart_Pattern_Library_TradingFinder/1 as HP
PP = input.int(3, 'ZigZag Pivot Period')
ShowBull = input.bool(true, 'Show Bullish Pattern')
ShowBear = input.bool(true, 'Show Bearish Pattern')
ColorBull = input.color(#0609bb, 'Color Bullish Pattern')
ColorBear = input.color(#0609bb, 'Color Bearish Pattern')
LineWidth = input.int(1 , 'Width Line')
LabelSize = input.string(size.small , 'Label size' , options = )
ShVF = input.bool(false , 'Show Valid Format')
FLPC = input.bool(false , 'Show Formation Last Pivot Confirm')
FLPCPeriod =input.int(2, 'Period of Formation Last Pivot')
//Call function
= HP.XABCD('Bullish Bat', 'Bullish', ShowBull, ColorBull , LineWidth, LabelSize ,ShVF, FLPC, FLPCPeriod, PP, 0.382, 0.50, 0.382, 0.886, 1.618, 2.618, 0.85, 0.9)
= HP.XABCD('Bearish Bat', 'Bearish', ShowBear, ColorBear , LineWidth, LabelSize ,ShVF, FLPC, FLPCPeriod, PP, 0.382, 0.50, 0.382, 0.886, 1.618, 2.618, 0.85, 0.9)
//Alert
if BearAlert
alert('Bearish Harmonic')
if BullAlert
alert('Bulish Harmonic')
//CandleStick Confirm
plotshape(BearCandleConfirm, style = shape.arrowdown, color = color.red)
plotshape(BullCandleConfirm, style = shape.arrowup, color = color.green, location = location.belowbar )

Harmonic Rolling VWAP (Zeiierman)█ Overview
The Harmonic Rolling VWAP (Zeiierman) indicator combines the concept of the Rolling Volume Weighted Average Price (VWAP) with advanced harmonic analysis using Discrete Fourier Transform (DFT). This innovative indicator aims to provide traders with a dynamic view of price action, capturing both the volume-weighted price and underlying harmonic patterns. By leveraging this combination, traders can gain deeper insights into market trends and potential reversal points.
█ How It Works
The Harmonic Rolling VWAP calculates the rolling VWAP over a specified window of bars, giving more weight to periods with higher trading volume. This VWAP is then subjected to harmonic analysis using the Discrete Fourier Transform (DFT), which decomposes the VWAP into its frequency components.
Key Components:
Rolling VWAP (RVWAP): A moving average that gives more weight to higher volume periods, calculated over a user-defined window.
True Range (TR): Measures volatility by comparing the current high and low prices, considering the previous close price.
Discrete Fourier Transform (DFT): Analyzes the harmonic patterns within the RVWAP by decomposing it into its frequency components.
Standard Deviation Bands: These bands provide a visual representation of price volatility around the RVWAP, helping traders identify potential overbought or oversold conditions.
█ How to Use
Identify Trends: The RVWAP line helps in identifying the underlying trend by smoothing out short-term price fluctuations and focusing on volume-weighted prices.
Assess Volatility: The standard deviation bands around the RVWAP give a clear view of price volatility, helping traders identify potential breakout or breakdown points.
Find Entry and Exit Points: Traders can look for entries when the price is near the lower bands in an uptrend or near the upper bands in a downtrend. Exits can be considered when the price approaches the opposite bands or shows harmonic divergence.
█ Settings
VWAP Source: Defines the price data used for VWAP calculations. The source input defines the price data used for calculations. This setting affects the VWAP calculations and the resulting bands.
Window: Sets the number of bars used for the rolling calculations. The window input sets the number of bars used for the rolling calculations. A larger window smooths the VWAP and standard deviation bands, making the indicator less sensitive to short-term price fluctuations. A smaller window makes the indicator more responsive to recent price changes.
-----------------
Disclaimer
The information contained in my Scripts/Indicators/Ideas/Algos/Systems does not constitute financial advice or a solicitation to buy or sell any securities of any type. I will not accept liability for any loss or damage, including without limitation any loss of profit, which may arise directly or indirectly from the use of or reliance on such information.
All investments involve risk, and the past performance of a security, industry, sector, market, financial product, trading strategy, backtest, or individual's trading does not guarantee future results or returns. Investors are fully responsible for any investment decisions they make. Such decisions should be based solely on an evaluation of their financial circumstances, investment objectives, risk tolerance, and liquidity needs.
My Scripts/Indicators/Ideas/Algos/Systems are only for educational purposes!

Harmonic Sine Waves model plot Hey,
Here is another tool that I created. I could not find anything similar.
This script is creating a sine wave, based on the given length, amplitude, horizontal vertical offset.
After this it plots also nearest harmonics to the base sine wave and draws it on the chart.
At the last step it sums up the value for base sine wave with its harmonics.
This is a great way to experience how 4 basic sine waves, when summed up, are creating more complex chart.
This shows that the 'chaotic' chart can be built on just a few most important factors.
You do not have to "know every single fact" about the asset to make a proper forecast.
You just need those most important.
It is crucial though, to offset the chart in a correct way, so it is in phase with the asset that we work on.

Shark Harmonic Pattern [TradingFinder] Shark Detector Indicator🔵 Introduction
The Shark harmonic pattern, first introduced by Scott Carney in 2011, is a recognized tool in technical analysis. Since its inception, it has been widely adopted by traders as an essential market analysis tool.
Due to its complexity, the Shark pattern can be challenging for novice traders. Therefore, we have developed the Harmonic Pattern Indicator to help analysts and traders easily identify these patterns.
🟣 Understanding the Types of Shark Pattern
In technical analysis, the Shark harmonic pattern forms at the end of trends and is categorized into two types: Bullish and Bearish Shark Patterns.
Bullish Shark Pattern : This pattern appears at the end of a downtrend, indicating a potential reversal to an uptrend. Traders can use this pattern to identify buy entry points. The image below illustrates the core components of the Bullish Shark Pattern.
Bearish Shark Pattern : Conversely, the Bearish Shark Pattern forms at the end of an uptrend, signaling a possible reversal to a downtrend. This pattern prompts traders to shift their positions from buying to selling. The image below showcases the characteristics of the Bearish Shark Pattern.
🔵 How to Use
🟣 Trading with the Bullish Shark Pattern
The Bullish Shark Pattern acts as a reversal pattern, helping traders identify the end of a downtrend and the beginning of an uptrend. It consists of five key points that indicate alternating bullish and bearish movements.
Upon the complete formation of this pattern, traders can look for opportunities to enter buy trades. To manage risk effectively, it is advisable to set a stop-loss below the lowest price point within the pattern.
🟣 Trading with the Bearish Shark Pattern
Similarly, the Bearish Shark Pattern functions as a reversal pattern but in the opposite direction. It helps traders identify the end of an uptrend and the onset of a downtrend.
After the pattern fully forms, traders can seek sell entry opportunities. As with the bullish pattern, placing a stop-loss above the highest price point within the pattern is recommended for risk management.
🔵 Setting
🟣 Logical Setting
ZigZag Pivot Period : You can adjust the period so that the harmonic patterns are adjusted according to the pivot period you want. This factor is the most important parameter in pattern recognition.
Show Valid Format : If this parameter is on "On" mode, only patterns will be displayed that they have exact format and no noise can be seen in them. If "Off" is, the patterns displayed that maybe are noisy and do not exactly correspond to the original pattern.
Show Formation Last Pivot Confirm : if Turned on, you can see this ability of patterns when their last pivot is formed. If this feature is off, it will see the patterns as soon as they are formed. The advantage of this option being clear is less formation of fielded patterns, and it is accompanied by the latest pattern seeing and a sharp reduction in reward to risk.
Period of Formation Last Pivot : Using this parameter you can determine that the last pivot is based on Pivot period.
🟣 Genaral Setting
Show : Enter "On" to display the template and "Off" to not display the template.
Color : Enter the desired color to draw the pattern in this parameter.
LineWidth : You can enter the number 1 or numbers higher than one to adjust the thickness of the drawing lines. This number must be an integer and increases with increasing thickness.
LabelSize : You can adjust the size of the labels by using the "size.auto", "size.tiny", "size.smal", "size.normal", "size.large" or "size.huge" entries.
🟣 Alert Setting
Alert : On / Off
Message Frequency : This string parameter defines the announcement frequency. Choices include: "All" (activates the alert every time the function is called), "Once Per Bar" (activates the alert only on the first call within the bar), and "Once Per Bar Close" (the alert is activated only by a call at the last script execution of the real-time bar upon closing). The default setting is "Once per Bar".
Show Alert Time by Time Zone : The date, hour, and minute you receive in alert messages can be based on any time zone you choose. For example, if you want New York time, you should enter "UTC-4". This input is set to the time zone "UTC" by default.
🔵 Conclusion
The Shark harmonic pattern is a potent analytical tool in technical analysis that aids traders in identifying critical reversal points in financial markets. Whether in a bullish or bearish context, this pattern provides clear trend change signals, allowing traders to enter trades with greater precision and optimize their strategies.
However, as with all analytical methods, it is essential to supplement the Shark pattern with additional analyses and strict risk management to avoid potential losses. Incorporating this pattern into a comprehensive trading strategy can lead to better trade outcomes and more opportunities for success

Manual Harmonic Projections - With interactive inputsThis is another script involving interactive inputs. This is similar to Manual-Harmonic-Patterns-With-interactive-inputs . But, instead of taking XABCD and verifying if it confirms to any pattern, here we only take XABC and project all PRZs.
Example, upon adding the script to chart, it will prompt to select 4 points on chart by clicking on it. if we select X, A, B, C as shown in the chart below, we can see the projection of multiple PRZs. Mid of nearest PRZ is considered as D and rest of the pattern is drawn based on this. However, the pattern can have multiple PRZs. All overlapping PRZs are combined together and shown as one along with merged pattern labels. But, if there is gap between PRZs, they are shown separately.
If no projections found, then patterns and projections are not drawn. However, you can still see XABC lines on the chart.
Harmonic Patterns [kingthies]Harmonic Patterns
This indicator scans price swings for classic X-A-B-C-D harmonic patterns and plots the structure plus a PRZ (Potential Reversal Zone) to help you frame areas where reactions are statistically more likely. It supports both bullish and bearish setups and can trigger alerts when a new D pivot confirms a pattern.
What it does
Builds a pivot-based swing map (ZigZag-style) using a configurable Pivot Length .
Evaluates the most recent 5 swing points (X, A, B, C, D) against harmonic ratio rules with a user-defined tolerance .
Detects: Gartley, Bat, Butterfly, Crab, Deep Crab, Cypher, Shark (loose) .
Draws the pattern legs (X-A-B-C-D), labels the detection with ratio readouts, and projects a PRZ using 3 target levels (derived from XA/BC logic per pattern).
Offers two rendering modes:
Best only : picks the closest match (lowest score) to reduce clutter.
Show all : plots every valid match (uses filled PRZ boxes to keep object usage under control).
PRZ (Potential Reversal Zone)
PRZ is built from three target levels and expanded into a zone.
Optional padding uses ATR (ATR multiplier) to widen/narrow the zone for volatility.
Display modes: Off, Box, Lines, Both .
Zones can be extended forward by a configurable number of bars to keep the area visible as price develops.
How to use
Start with Confirm only when D pivot forms enabled (recommended) to reduce false positives while patterns are still forming.
Adjust Pivot Length based on timeframe:
Lower values = more swings, more signals, more noise.
Higher values = cleaner structures, fewer signals.
Use Ratio Tolerance to control strictness:
Lower tolerance = fewer, higher-confidence matches.
Higher tolerance = more matches, potentially lower quality.
Treat harmonics as context , not a standalone entry system:
Look for confluence (HTF levels, structure, volume, momentum/RSI divergence, etc.).
Use your own confirmation and risk plan (invalidations beyond PRZ / beyond D).
Settings overview
Swings (Pivot ZigZag)
Pivot Length: pivot sensitivity.
Use Wicks: uses High/Low; if off, uses Close.
Max Stored Swings: limits stored pivots for performance/object control.
Harmonic Detection
Ratio Tolerance (%): allowed deviation around ideal ratios.
Confirm only when D pivot forms: reduces repaint-like behavior.
When multiple match: Best only vs Show all.
Pattern Filters enable/disable each pattern type.
PRZ
PRZ Display: Off / Box / Lines / Both.
PRZ Padding (ATR multiplier): volatility-adjusted zone padding.
PRZ Extend (bars): how far to project the zone.
Visuals
Draw Legs: draws X-A-B-C-D.
Show Pattern Label: prints pattern name, direction, ratios, and score.
Label Offset: shift label forward if you want more space.
Alerts
“Bullish/Bearish Harmonic (Any)” triggers on any detected pattern.
Per-pattern alerts are included for each supported pattern type.
Notes
This indicator is educational and intended to assist with pattern recognition and confluence mapping.
Harmonic patterns do not guarantee reversals—always manage risk and confirm with your own process.

Deep Crab Harmonic Pattern [TradingFinder] Reversal Zones🔵 Introduction
The Deep Crab pattern is a 5-point extension harmonic structure (X-A-B-C-D) used in technical analysis to identify potential reversal points in financial markets. Like the original Crab pattern, it heavily relies on a 1.618 XA projection to form the Potential Reversal Zone (PRZ).
However, the key difference lies in the B point, which must be an 0.886 retracement of the XA leg. The D point in this pattern typically extends beyond the X point, signaling a strong potential reversal in price movement.
Bullish Deep Crab :
The Bullish Deep Crab is a pattern used in technical analysis to spot potential trend reversals. It signals a shift from a downtrend to an uptrend. Traders enter a buy position at the D point and set a stop-loss below point X, anticipating a price increase.
Bearish Deep Crab :
The Bearish Deep Crab is a reversal pattern that indicates the potential end of an uptrend. Traders enter a sell position at point D and set a stop-loss above point X, expecting the price to fall afterward.
🟣 Crab Vs Deep Crab
The Crab and Deep Crab patterns are both used to identify reversal points in technical analysis, but they differ in terms of correction depth :
Crab : The B point retraces between 38.2% to 61.8% of the XA leg, and point D extends beyond X, indicating a price reversal after a smaller correction.
Deep Crab : The B point retraces more deeply, around 88.6% of the XA leg, and point D has a stronger extension, signaling a reversal after a deeper correction.
The Deep Crab is more suited for identifying stronger price movements.
🔵 How to Use
To effectively use the Deep Crab pattern, it’s essential to correctly identify its five key points (X, A, B, C, and D) based on Fibonacci retracements and extensions. Traders look for a deep retracement at point B, followed by an extended move to point D, which typically signals a strong price reversal.
Once these points are established, traders can strategically enter positions at point D with appropriate stop-loss and take-profit levels, capitalizing on the anticipated market reversal. Proper use of Fibonacci tools is crucial for accurate pattern identification.
🟣 Bullish Deep Crab
To use the Bullish Deep Crab pattern, a trader identifies point D as the key price reversal point in a downtrend. Using Fibonacci tools, points X, A, B, and C are identified, with point B showing an 88.6% retracement of XA, and CD extending 1.618% of XA.
The trader enters a buy position at point D and sets a stop-loss below X, expecting a reversal from a downtrend to an uptrend.
🟣 Bearish Deep Crab
In the Bearish Deep Crab pattern, point D acts as the reversal point in an uptrend. After identifying points X, A, B, and C, D extends 1.618% of XA. Point B retraces 88.6% of XA. Traders enter a sell position at point D and place a stop-loss above X, anticipating a drop in price.
🔵 Setting
🟣 Logical Setting
ZigZag Pivot Period : You can adjust the period so that the harmonic patterns are adjusted according to the pivot period you want. This factor is the most important parameter in pattern recognition.
Show Valid Forma t: If this parameter is on "On" mode, only patterns will be displayed that they have exact format and no noise can be seen in them. If "Off" is, the patterns displayed that maybe are noisy and do not exactly correspond to the original pattern.
Show Formation Last Pivot Confirm : if Turned on, you can see this ability of patterns when their last pivot is formed. If this feature is off, it will see the patterns as soon as they are formed. The advantage of this option being clear is less formation of fielded patterns, and it is accompanied by the latest pattern seeing and a sharp reduction in reward to risk.
Period of Formation Last Pivot : Using this parameter you can determine that the last pivot is based on Pivot period.
🟣 Genaral Setting
Show : Enter "On" to display the template and "Off" to not display the template.
Color : Enter the desired color to draw the pattern in this parameter.
LineWidth : You can enter the number 1 or numbers higher than one to adjust the thickness of the drawing lines. This number must be an integer and increases with increasing thickness.
LabelSize : You can adjust the size of the labels by using the "size.auto", "size.tiny", "size.smal", "size.normal", "size.large" or "size.huge" entries.
🟣 Alert Setting
Alert : On / Off
Message Frequency : This string parameter defines the announcement frequency. Choices include: "All" (activates the alert every time the function is called), "Once Per Bar" (activates the alert only on the first call within the bar), and "Once Per Bar Close" (the alert is activated only by a call at the last script execution of the real-time bar upon closing). The default setting is "Once per Bar".
Show Alert Time by Time Zone : The date, hour, and minute you receive in alert messages can be based on any time zone you choose. For example, if you want New York time, you should enter "UTC-4". This input is set to the time zone "UTC" by default.
🔵 Conclusion
The Deep Crab pattern is a valuable reversal tool in technical analysis, known for its deep retracement and extended price movements.
Unlike other harmonic patterns, it emphasizes identifying critical points where price action is likely to reverse sharply. This pattern works well in both bullish and bearish market scenarios, offering clear signals for entry and exit points.
However, successful application requires a deep understanding of market behavior and precise use of technical tools like Fibonacci retracement. Overall, mastering this pattern can enhance trading strategies and risk management.

Harmonic Patterns (Experimental) [Kodexius]Harmonic Patterns (Experimental) is a multi pattern harmonic geometry scanner that automatically detects, validates, and draws classic harmonic structures directly on your chart. The script continuously builds a pivot map (swing highs and swing lows), then evaluates the most recent pivot sequence against a library of harmonic ratio templates such as Gartley, Bat, Deep Bat, Butterfly, Crab, Deep Crab, Cypher, Shark, Alt Shark, 5-0, AB=CD, and 3 Drives.
Unlike simple “pattern exists / pattern doesn’t exist” indicators, this version scores candidates by accuracy . Each pattern includes “ideal” ratio targets, and the script computes a total error score by measuring how far the observed ratios deviate from the ideal. When multiple patterns could match the same pivot structure, the script selects the best match (lowest total error) and displays that one. This reduces clutter and makes the output more practical in real market conditions where many ratio ranges overlap.
The end result is a clean, information rich visualization of harmonic opportunities that is:
-Pivot based and swing aware
-Ratio validated with configurable tolerance
-Direction filtered (bullish, bearish, or both)
-Ranked by accuracy to prefer higher quality matches
Note: This is an experimental pattern engine intended for research, confluence and chart study. Harmonic patterns are probabilistic and can fail often. Always combine with your own risk management and confirmation tools.
🔹 Features
🔸Pivot Detection
The script uses pivot functions to detect structural turning points:
-Pivot Left Bars controls how many bars must exist on the left of the pivot
-Pivot Right Bars controls confirmation delay on the right (smaller value reacts faster)
Additionally, a Min Swing Distance (%) filter can ignore tiny swings to reduce noise. Pivots are stored separately for highs and lows and capped by Max Pivots to Store to keep the script efficient.
🔸Pattern Library (XABCD and Beyond)
Supported structures include:
-Gartley, Bat, Deep Bat, Butterfly, Crab, Deep Crab
-Cypher (uses XC extension and CD retracement logic)
-Shark and Alt Shark (0-X-A-B-C mapping)
-5-0 (AB and BC extensions with CD retracement)
-AB=CD (symmetry and proportionality checks)
-3 Drives (6 point structure, drive and retracement ratios)
Each pattern is defined by ratio ranges and also “ideal” ratio targets used for scoring.
🔸 Pattern Fibonacci Rules (Detailed Ratio Definitions)
This script validates each harmonic template by measuring a small set of Fibonacci relationships between the legs of the pattern. All measurements are computed using absolute price distance (so the ratios are direction independent), and then a directional sanity check ensures the geometry is positioned correctly for bullish or bearish cases.
How ratios are measured
Most patterns in this script use the standard X A B C D harmonic structure. Four ratios are evaluated:
1) XB retracement of XA
This measures how much price retraces from A back toward X when forming point B .
xbRatio = |B - A| / |A - X|
2) AC retracement of AB
This measures how much point C retraces the AB leg.
acRatio = |C - B| / |B - A|
3) BD extension of BC
This measures the “drive” from C into D relative to the BC leg.
bdRatio = |D - C| / |C - B|
4) XD retracement of XA
This is the most important “completion” ratio in many patterns. It measures where D lands relative to the original XA swing.
xdRatio = |D - A| / |A - X|
Important: the script applies a user defined Fibonacci Tolerance to each accepted range, meaning the pattern can still pass even if ratios are slightly off from the textbook values.
🔸 XABCD Pattern Ratio Templates
Below are the exact ratio rules used by the templates in this script.
Gartley
-XB must be ~0.618 of XA
-AC must be between 0.382 and 0.886 of AB
-BD must be between 1.272 and 1.618 extension of BC
-XD must be ~0.786 of XA
In practice, Gartley is a “non extension” structure, meaning D usually remains inside the X boundary .
Bat
-XB between 0.382 and 0.50 of XA
-AC between 0.382 and 0.886 of AB
-BD between 1.618 and 2.618 of BC
-XD ~0.886 of XA
Bat patterns typically complete deeper than Gartley and often create a sharper reaction at D.
Deep Bat
-XB ~0.886 of XA
-AC between 0.382 and 0.886 of AB
-BD between 1.618 and 2.618 of BC
-XD ~0.886 of XA
Deep Bat uses the same completion zone as Bat, but requires a much deeper B point.
Butterfly
-XB ~0.786 of XA
-AC between 0.382 and 0.886 of AB
-BD between 1.618 and 2.618 of BC
-XD between 1.272 and 1.618 of XA
Butterfly is an extension pattern . That means D is expected to break beyond X (in the completion direction).
Crab
-XB between 0.382 and 0.618 of XA
-AC between 0.382 and 0.886 of AB
-BD between 2.24 and 3.618 of BC
-XD ~1.618 of XA
Crab is also an extension pattern . It often produces a very deep D completion and a strong reaction zone.
Deep Crab
-XB ~0.886 of XA
-AC between 0.382 and 0.886 of AB
-BD between 2.0 and 3.618 of BC
-XD ~1.618 of XA
Deep Crab combines a deep B point with a strong XA extension completion.
🔸 Cypher Fibonacci Rules (XC Based)
Cypher is not validated with the same four ratios as XABCD patterns. Instead it uses an XC based completion model:
1) B as a retracement of XA
xb = |B - A| / |A - X| // AB/XA
Must be between 0.382 and 0.618 .
2) C as an extension from X relative to XA
xc = |C - X| / |A - X| // XC/XA
Must be between 1.272 and 1.414 .
3) D as a retracement of XC
xd = |D - C| / |C - X| // CD/XC
Must be ~ 0.786 .
This makes Cypher structurally different: the “completion” is defined as a retracement of the entire XC leg, not XA.
🔸 Shark and Alt Shark Fibonacci Rules (0-X-A-B-C Mapping)
Shark patterns are commonly defined as 0 X A B C . In this script the pivots are mapped like this:
0 = pX, X = pA, A = pB, B = pC, C = pD
So the final pivot (stored as pD) is labeled as C on the chart.
Three ratios are validated:
1) AB relative to XA
ab_xa = |B - A| / |A - X|
Must be between 1.13 and 1.618 .
2) BC relative to AB
bc_ab = |C - B| / |B - A|
Must be between 1.618 and 2.24 .
3) OC relative to OX
oc_ox = |C - 0| / |X - 0|
For Shark it must be between 0.886 and 1.13 .
For Alt Shark it must be between 1.13 and 1.618 (a deeper / more extended completion).
🔸 5-0 Fibonacci Rules
5-0 is validated as a sequence of extensions and then a fixed retracement:
1) AB extension of XA
ab_xa = |B - A| / |A - X|
Must be between 1.13 and 1.618 .
2) BC extension of AB
bc_ab = |C - B| / |B - A|
Must be between 1.618 and 2.24 .
3) CD retracement of BC
cd_bc = |D - C| / |C - B|
Must be approximately 0.50 .
Note that for 5-0 the script does not rely on an XA completion ratio like 0.786 or 1.618. The defining completion is the 0.5 retracement of BC.
🔸 AB=CD Fibonacci Rules
AB=CD is a symmetry pattern and is treated differently from the harmonic templates:
1) AB and CD length symmetry
The script checks if CD is approximately equal to AB within tolerance.
2) BC proportion
BC/AB is expected to fall in a common Fibonacci retracement zone:
-approximately 0.618 to 0.786 (with a looser tolerance in code)
3) CD/BC expansion
CD/BC is expected to be an expansion ratio:
-approximately 1.272 to 1.618 (also with a looser tolerance)
This allows the script to capture both classic equal leg AB=CD and common “expanded” variations.
🔸 3 Drives Fibonacci Rules (6 Point Structure)
3 Drives is a 6 point structure and is validated using retracement ratios and extension ratios:
Retracement rules
Retracement 1 must be between 0.618 and 0.786 of Drive 1
Retracement 2 must be between 0.618 and 0.786 of Drive 2
Extension rules
Drive 2 must be between 1.272 and 1.618 of Retracement 1
Drive 3 must be between 1.272 and 1.618 of Retracement 2
This pattern is meant to capture rhythm and proportional repetition rather than a single XA completion ratio.
🔸 Why the script can show “ratio labels” on legs
If you enable Show Fibonacci Values on Legs , the script prints the measured ratios near the midpoint of each leg (or diagonal, depending on pattern type). This makes it easy to visually confirm:
-Which ratios caused the pattern to pass
-How close the structure is to ideal harmonic values
-Why one template was preferred over another via the accuracy score
🔸 Fibonacci Tolerance Control
All ratio checks use a single tolerance input (percentage). This tolerance expands or contracts the acceptable ratio ranges, letting you decide whether you want:
-Tight, high precision matches (lower tolerance)
-Broader, more frequent matches (higher tolerance)
🔸 Direction Filter (Bullish Only / Bearish Only / Both)
You can restrict scanning to bullish patterns, bearish patterns, or allow both. This is useful if you are aligning with higher timeframe bias or only trading one side of the market.
🔸 Best Match Selection (Anti Clutter Logic)
When a new pivot confirms, the script evaluates all enabled patterns against the latest pivot sequence and keeps the one with the smallest total error score. This is especially helpful because many harmonic templates overlap in real time. Instead of drawing multiple conflicting labels, you get one “most accurate” candidate.
🔸 Clean Visual Rendering and Optional Details
The drawing system can display:
-Main structure lines (X-A-B-C-D or special mappings)
-Dashed diagonals for geometric context (XB, AC, BD, XD)
-Pattern fill to visually highlight the structure zone
-Point labels (X,A,B,C,D or 0..5 for 3 Drives, 0-X-A-B-C for Shark)
-Leg Fibonacci labels placed around midpoints for fast ratio reading
All colors (bullish and bearish line and fill) are configurable.
🔸 Pattern Spacing and Display Limits
To keep charts readable, the script includes:
-Max Patterns to Display to limit on-chart drawings
-Min Bars Between Patterns to avoid repeated signals too close together in the same direction
Older patterns are automatically deleted once the display limit is exceeded.
🔸 Alerts
When enabled, alerts trigger on new confirmed detections:
-Bullish Pattern Detected
-Bearish Pattern Detected
Alerts fire once per bar when a new pattern is confirmed by a fresh pivot.
🔹 Calculations
This section summarizes the core logic used under the hood.
1) Pivot Detection and Swing Filtering
The script confirms pivots using right side confirmation, then optionally filters them by minimum swing distance relative to the last opposite pivot.
// Pivot detection
float pHigh = ta.pivothigh(high, pivotLeftBars, pivotRightBars)
float pLow = ta.pivotlow(low, pivotLeftBars, pivotRightBars)
// Example swing distance filter (conceptual)
abs(newPivot - lastOppPivot) / lastOppPivot >= minSwingPercent
Pivots are stored in capped arrays (high pivots and low pivots), ensuring performance and stable memory usage.
2) Ratio Measurements (Retracement and Extension)
The engine measures harmonic ratios using two core helpers:
Retracement measures how much the third point retraces the previous leg.
Extension measures how much the next leg extends relative to the previous leg.
// Retracement: (p3 - p2) compared to (p2 - p1)
calcRetracement(p1, p2, p3) =>
float leg = math.abs(p2.price - p1.price)
float retr = math.abs(p3.price - p2.price)
leg != 0 ? retr / leg : na
// Extension: (p4 - p3) compared to (p3 - p2)
calcExtension(p2, p3, p4) =>
float leg = math.abs(p3.price - p2.price)
float ext = math.abs(p4.price - p3.price)
leg != 0 ? ext / leg : na
For a standard XABCD pattern the script evaluates:
-XB retracement of XA
-AC retracement of AB
-BD extension of BC
-XD retracement of XA
3) Tolerance Based Range Check
Ratio validation uses a flexible range check that expands min and max by the tolerance percent:
isInRange(value, minVal, maxVal, tolerance) =>
float tolMin = minVal * (1.0 - tolerance)
float tolMax = maxVal * (1.0 + tolerance)
value >= tolMin and value <= tolMax
This means even “fixed” ratios (like 0.786) still allow a user controlled deviation.
4) Positional Sanity Check for D (Beyond X or Not)
Some harmonic patterns require D to remain within X (non extension patterns), while others require D to break beyond X (extension patterns). The script enforces that using a boolean flag in each template.
Conceptually:
-If the pattern is an extension type, D should cross beyond X in the expected direction
-If the pattern is not extension type, D should stay on the correct side of X
This prevents visually incorrect “ratio matches” that violate the intended geometry.
5) Template Definitions (Ranges + Ideal Targets)
Every pattern includes ratio ranges plus ideal values. The ideal values are used only for scoring quality, not for pass/fail. Example concept:
-Ranges determine validity
-Ideal targets determine ranking
6) Accuracy Scoring (Total Error)
When a candidate passes all validity checks, the script computes an accuracy score by summing absolute deviations from ideal ratios:
calcError(value, ideal) =>
math.abs(value - ideal)
// Total error is the sum of the four leg errors (as available for the pattern)
totalError =
calcError(xbRatio, xbIdeal) +
calcError(acRatio, acIdeal) +
calcError(bdRatio, bdIdeal) +
calcError(xdRatio, xdIdeal)
Lower score means closer to the “textbook” harmonic proportions.
7) Best Match Resolution (Choosing One Winner)
When multiple enabled patterns match the same pivot structure, the script selects the one with the lowest totalError:
updateBest(currentBest, newCandidate) =>
result = currentBest
if not na(newCandidate)
if na(currentBest) or newCandidate.totalError < currentBest.totalError
result := newCandidate
result
This is a major practical feature because it reduces clutter and highlights the highest quality interpretation.
8) Bullish and Bearish Scanning Logic
The scanner runs when pivots confirm:
-Bullish patterns are evaluated on a newly confirmed pivot low (potential D)
-Bearish patterns are evaluated on a newly confirmed pivot high (potential D)
From that D pivot, the script searches backward through stored pivots to build a valid pivot sequence (X,A,B,C,D). If 3 Drives is enabled, it also attempts to find the extra preceding point needed for the 6 point structure.
9) Rendering: Lines, Fill, Labels, and Leg Fib Text
After detection the script draws:
-Primary legs with thicker lines
-Geometric diagonals with dashed lines (for XABCD types)
-Optional fill between selected legs to emphasize the structure area
-A summary label showing direction, pattern name, and ratios
-Optional point labels and leg ratio labels placed near midpoints
To avoid overlapping with candles, the script offsets labels using ATR:
float yOff = math.max(ta.atr(14) * 0.15, syminfo.mintick * 10)
10) Pattern Lifecycle and Cleanup
To respect chart limits and keep visuals clean, the script deletes old drawings once the maximum visible patterns threshold is exceeded. This includes lines, fills, and labels.

Dragon Harmonic Pattern [TradingFinder] Dragon Detector🔵 Introduction
The Dragon Harmonic Pattern is one of the technical analysis tools that assists traders in identifying Potential Reversal Zones (PRZ). Resembling an "M" or "W" shape, this pattern is recognized in financial markets as a method for predicting bullish and bearish trends. By leveraging precise Fibonacci ratios and measuring price movements, traders can use this pattern to forecast market trends with high accuracy.
The Dragon Harmonic Pattern is built on the XABCD structure, where each point plays a significant role in shaping and forecasting price movements. Point X marks the beginning of the trend, representing the initial price movement. Point A indicates the first retracement, usually falling within the 0.380 to 0.620 range of the XA wave.
Next, point B signals the second retracement, which lies within 0.200 to 0.400 of the AB wave. Point C, acting as the hump of the pattern, is generally located within 0.800 to 1.100 of the XA wave. Finally, point D represents the endpoint of the pattern and the Potential Reversal Zone (PRZ), where the primary price reversal occurs.
In bullish scenarios, the Dragon Pattern indicates a reversal from a downtrend to an uptrend, where prices move upward from point D. Conversely, in bearish scenarios, prices decline after reaching point D. Accurate identification of this pattern through Fibonacci ratio analysis and PRZ examination can significantly increase the success rate of trades, enabling traders to adjust their strategies based on key market levels such as 0.618 or 1.100.
Due to its high accuracy in identifying Potential Reversal Zones (PRZ) and its alignment with Fibonacci ratios, the Dragon Harmonic Pattern is considered one of the most popular tools in technical analysis. Traders can use this pattern to pinpoint entry and exit points with greater confidence while minimizing trading risks.
Bullish :
Bearish :
🔵 How to Use
The Dragon Harmonic Pattern indicator helps traders identify bullish and bearish patterns in the market, allowing them to capitalize on available trading opportunities. By analyzing Fibonacci ratios and the XABCD structure, the indicator highlights Potential Reversal Zones (PRZ).
🟣 Bullish Dragon Pattern
In the Bullish Dragon Pattern, the price transitions from a downtrend to an uptrend after reaching point D. At this stage, points X, A, B, C, and D must be carefully identified.
Fibonacci ratios for these points are as follows: Point A should fall within 0.380 to 0.620 of the XA wave, point B within 0.200 to 0.400 of the AB wave, and point C within 0.800 to 1.100 of the XA wave.
When the price reaches point D, traders should look for bullish signals such as reversal candlesticks or increased trading volume to enter a buy position. The take-profit level can be set near the previous price high or based on the 1.272 Fibonacci ratio of the XA wave, while the stop-loss should be placed slightly below point D.
🟣 Bearish Dragon Pattern
In the Bearish Dragon Pattern, the price shifts from an uptrend to a downtrend after reaching point D. In this pattern, points X, A, B, C, and D must also be identified. Fibonacci ratios for these points are as follows: Point A should fall within 0.380 to 0.620 of the XA wave, point B within 0.200 to 0.400 of the AB wave, and point C within 0.800 to 1.100 of the XA wave.
Upon reaching point D, bearish signals such as reversal candlesticks or decreasing trading volume indicate the opportunity to enter a sell position. The take-profit level can be set near the previous price low or based on the 1.272 Fibonacci ratio of the XA wave, while the stop-loss should be placed slightly above point D.
By combining the Dragon Harmonic Pattern indicator with precise Fibonacci ratio analysis, traders can identify key opportunities while minimizing risks and improving their decision-making in both bullish and bearish market conditions.
🔵 Setting
🟣 Logical Setting
ZigZag Pivot Period : You can adjust the period so that the harmonic patterns are adjusted according to the pivot period you want. This factor is the most important parameter in pattern recognition.
Show Valid Forma t: If this parameter is on "On" mode, only patterns will be displayed that they have exact format and no noise can be seen in them. If "Off" is, the patterns displayed that maybe are noisy and do not exactly correspond to the original pattern.
Show Formation Last Pivot Confirm : if Turned on, you can see this ability of patterns when their last pivot is formed. If this feature is off, it will see the patterns as soon as they are formed. The advantage of this option being clear is less formation of fielded patterns, and it is accompanied by the latest pattern seeing and a sharp reduction in reward to risk.
Period of Formation Last Pivot : Using this parameter you can determine that the last pivot is based on Pivot period.
🟣 Genaral Setting
Show : Enter "On" to display the template and "Off" to not display the template.
Color : Enter the desired color to draw the pattern in this parameter.
LineWidth : You can enter the number 1 or numbers higher than one to adjust the thickness of the drawing lines. This number must be an integer and increases with increasing thickness.
LabelSize : You can adjust the size of the labels by using the "size.auto", "size.tiny", "size.smal", "size.normal", "size.large" or "size.huge" entries.
🟣 Alert Setting
Alert : On / Off
Message Frequency : This string parameter defines the announcement frequency. Choices include: "All" (activates the alert every time the function is called), "Once Per Bar" (activates the alert only on the first call within the bar), and "Once Per Bar Close" (the alert is activated only by a call at the last script execution of the real-time bar upon closing). The default setting is "Once per Bar".
Show Alert Time by Time Zone : The date, hour, and minute you receive in alert messages can be based on any time zone you choose. For example, if you want New York time, you should enter "UTC-4". This input is set to the time zone "UTC" by default.
🔵 Conclusion
The Dragon Harmonic Pattern is an advanced and practical technical analysis tool that aids traders in accurately predicting bullish and bearish trends by identifying Potential Reversal Zones (PRZ) and utilizing Fibonacci ratios. Built on the XABCD structure, this pattern stands out for its flexibility and precision in identifying price movements, making it a valuable resource among technical analysts. One of its key advantages is its compatibility with other technical tools such as trendlines, support and resistance levels, and Fibonacci retracements.
By using the Dragon Harmonic Pattern indicator, traders can accurately determine entry and exit points for their trades. The indicator analyzes key Fibonacci ratios—0.380 to 0.620, 0.200 to 0.400, and 0.800 to 1.100—to identify critical levels such as price highs and lows, offering precise trading strategies. In bullish scenarios, traders can profit from rising prices, while in bearish scenarios, they can capitalize on price declines.
In conclusion, the Dragon Harmonic Pattern is a highly reliable tool for identifying trading opportunities with exceptional accuracy. However, for optimal results, it is recommended to combine this pattern with other analytical tools and thoroughly assess market conditions. By utilizing this indicator, traders can reduce their trading risks while achieving higher profitability and confidence in their trading strategies.

Harmonic Pattern Detector (75 patterns)Harmonic Pattern Detector offers a record amount of "Harmonic Patterns" in one script, with 75 different patterns detected, together with up to 99 different swing lengths.
🔶 USAGE
Harmonic Patterns are detected from several different ZigZag lines, derived from Swings with different lengths (shorter - longer term)
Depending on the settings ' Minimum/Maximum Swing Length ', the user will see more or less patterns from shorter and/or longer-term swing points.
🔹 Fibonacci Ratio
Certain patterns have only one ratio for a specific retrace/extension instead of one upper and one lower limit. In this case, we add a ' Tolerance ', which adds a percentage tolerance below/above the ratio, creating two limits.
A higher number may show more patterns but may become less valid.
Hoovering over points B, C, and D will show a tooltip with the concerning limits; adjusted limits will be seen if applicable.
Tooltips in settings will also show which patterns the Fibonacci Ratio applies to.
🔹 Triangle Area Ratio
Using Heron's formula , the triangle area is calculated after the X-Y axis is normalized.
Users can filter patterns based on the ratio of the smallest triangle to the largest triangle.
A lower Triangle Area Ratio number leads to more symmetrical patterns but may appear less frequently.
🔶 DETAILS
Harmonic patterns are based on geometric patterns, where the retracement/extension of a swing point must be located between specific Fibonacci ratios of the previous swing/leg. Different Harmonic Patterns require unique ratios to become valid patterns.
In the above example there is a valid 'Max Butterfly' pattern where:
Point B is located between 0.618 - 0.886 retracement level of the X-A leg
Point C is located between 0.382 - 0.886 retracement level of the A-B leg
Point D is located between 1.272 - 2.618 extension level of the B-C leg
Point D is located between 1.272 - 1.618 extension level of the X-A leg
Harmonic Pattern Detector uses ZigZag lines, where swing highs and swing lows alternate. Each ZigZag line is checked for valid Harmonic Patterns . When multiple types of Harmonic Patterns are valid for the same sequence, the pattern will be named after the first one found.
Different swing lengths form different ZigZag lines.
By evaluating different ZigZag lines (up to 99!), shorter—and longer-term patterns can be drawn on the same chart.
🔹 Blocks
The patterns are organized into blocks that can be toggled on or off with a single click.
When a block is enabled, the user can still select which specific patterns within that block are enabled or disabled.
🔹 Visuals
Besides color settings, labels can show pattern names or arrows at point D of the pattern.
Note this will happen 1 bar after validation because one extra bar is needed for confirmation.
An option is included to show only arrows without the patterns.
🔹 Updated Patterns
When a Swing Low is followed by a lower low or a Swing High followed by a higher high , triggering a pattern identical to a previous one except with a different point D, the pattern will be updated. The previous C-D line will be visible as a dashed line to highlight the event. Only the last dashed line is shown when this happens more than once.
🔹 Optimization
The script only verifies the last leg in the initial phase, significantly reducing the time spent on pattern validation. If this leg doesn't align with a potential Harmonic Pattern , the pattern is immediately disregarded. In the subsequent phase, the remaining patterns are quickly scrutinized to ensure the next leg is valid. This efficient process continues, with only valid patterns progressing to the next phase until all sequences have been thoroughly examined.
This process can check up to 99 ZigZag lines for 75 different Harmonic Patterns , showcasing its high capacity and versatility.
🔹 Ratios
The following table shows the different ratios used for each Harmonic Pattern .
' min ' and ' max ' are used when only one limit is provided instead of 2. This limit is given a percentage tolerance above and below, customizable by the setting ' Tolerance - Fibonacci Ratio '.
For example a ratio of 0.618 with a tolerance of 1% would result in:
an upper limit of 0.624
a lower limit of 0.612
|-------------------|------------------------|------------------------|-----------------------|-----------------------|
| NAME PATTERN | BCD (BD) | ABC (AC) | XAB (XB) | XAD (XD) |
| | min max | min max | min max | min max |
|-------------------|------------------------|------------------------|-----------------------|-----------------------|
| 'ABCD' | 1.272 - 1.618 | 0.618 - 0.786 | | |
| '5-0' | 0.5 *min - 0.5 *max | 1.618 - 2.24 | 1.13 - 1.618 | |
| 'Max Gartley' | 1.128 - 2.236 | 0.382 - 0.886 | 0.382 - 0.618 | 0.618 - 0.786 |
| 'Gartley' | 1.272 - 1.618 | 0.382 - 0.886 | 0.618*min - 0.618*max | 0.786*min - 0.786*max |
| 'A Gartley' | 1.618*min - 1.618*max | 1.128 - 2.618 | 0.618 - 0.786 | 1.272*min - 1.272*max |
| 'NN Gartley' | 1.128 - 1.618 | 0.382 - 0.886 | 0.618*min - 0.618*max | 0.786*min - 0.786*max |
| 'NN A Gartley' | 1.618*min - 1.618*max | 1.128 - 2.618 | 0.618 - 0.786 | 1.272*min - 1.272*max |
| 'Bat' | 1.618 - 2.618 | 0.382 - 0.886 | 0.382 - 0.5 | 0.886*min - 0.886*max |
| 'Alt Bat' | 2.0 - 3.618 | 0.382 - 0.886 | 0.382*min - 0.382*max | 1.128*min - 1.128*max |
| 'A Bat' | 2.0 - 2.618 | 1.128 - 2.618 | 0.382 - 0.618 | 1.128*min - 1.128*max |
| 'Max Bat' | 1.272 - 2.618 | 0.382 - 0.886 | 0.382 - 0.618 | 0.886*min - 0.886*max |
| 'NN Bat' | 1.618 - 2.618 | 0.382 - 0.886 | 0.382 - 0.5 | 0.886*min - 0.886*max |
| 'NN Alt Bat' | 2.0 - 4.236 | 0.382 - 0.886 | 0.382*min - 0.382*max | 1.128*min - 1.128*max |
| 'NN A Bat' | 2.0 - 2.618 | 1.128 - 2.618 | 0.382 - 0.618 | 1.128*min - 1.128*max |
| 'NN A Alt Bat' | 2.618*min - 2.618*max | 1.128 - 2.618 | 0.236 - 0.5 | 0.886*min - 0.886*max |
| 'Butterfly' | 1.618 - 2.618 | 0.382 - 0.886 | 0.786*min - 0.786*max | 1.272 - 1.618 |
| 'Max Butterfly' | 1.272 - 2.618 | 0.382 - 0.886 | 0.618 - 0.886 | 1.272 - 1.618 |
| 'Butterfly 113' | 1.128 - 1.618 | 0.618 - 1.0 | 0.786 - 1.0 | 1.128*min - 1.128*max |
| 'A Butterfly' | 1.272*min - 1.272*max | 1.128 - 2.618 | 0.382 - 0.618 | 0.618 - 0.786 |
| 'Crab' | 2.24 - 3.618 | 0.382 - 0.886 | 0.382 - 0.618 | 1.618*min - 1.618*max |
| 'Deep Crab' | 2.618 - 3.618 | 0.382 - 0.886 | 0.886*min - 0.886*max | 1.618*min - 1.618*max |
| 'A Crab' | 1.618 - 2.618 | 1.128 - 2.618 | 0.276 - 0.446 | 0.618*min - 0.618*max |
| 'NN Crab' | 2.236 - 4.236 | 0.382 - 0.886 | 0.382 - 0.618 | 1.618*min - 1.618*max |
| 'NN Deep Crab' | 2.618 - 4.236 | 0.382 - 0.886 | 0.886*min - 0.886*max | 1.618*min - 1.618*max |
| 'NN A Crab' | 1.128 - 2.618 | 1.128 - 2.618 | 0.236 - 0.447 | 0.618*min - 0.618*max |
| 'NN A Deep Crab' | 1.128*min - 1.128*max | 1.128 - 2.618 | 0.236 - 0.382 | 0.618*min - 0.618*max |
| 'Cypher' | 1.272 - 2.00 | 1.13 - 1.414 | 0.382 - 0.618 | 0.786*min - 0.786*max |
| 'New Cypher' | 1.272 - 2.00 | 1.414 - 2.14 | 0.382 - 0.618 | 0.786*min - 0.786*max |
| 'Anti New Cypher' | 1.618 - 2.618 | 0.467 - 0.707 | 0.5 - 0.786 | 1.272*min - 1.272*max |
| 'Shark 1' | 1.618 - 2.236 | 1.128 - 1.618 | 0.382 - 0.618 | 0.886*min - 0.886*max |
| 'Shark 1 Alt' | 1.618 - 2.618 | 0.618 - 0.886 | 0.446 - 0.618 | 1.128*min - 1.128*max |
| 'Shark 2' | 1.618 - 2.236 | 1.128 - 1.618 | 0.382 - 0.618 | 1.128*min - 1.128*max |
| 'Shark 2 Alt' | 1.618 - 2.618 | 0.618 - 0.886 | 0.446 - 0.618 | 0.886*min - 0.886*max |
| 'Leonardo' | 1.128 - 2.618 | 0.382 - 0.886 | 0.5*min - 0.5*max | 0.786*min - 0.786*max |
| 'NN A Leonardo' | 2.0*min - 2.0*max | 1.128 - 2.618 | 0.382 - 0.886 | 1.272*min - 1.272*max |
| 'Nen Star' | 1.272 - 2.0 | 1.414 - 2.14 | 0.382 - 0.618 | 1.272*min - 1.272*max |
| 'Anti Nen Star' | 1.618 - 2.618 | 0.467 - 0.707 | 0.5 - 0.786 | 0.786*min - 0.786*max |
| '3 Drives' | 1.272 - 1.618 | 0.618 - 0.786 | 1.272 - 1.618 | 1.618 - 2.618 |
| 'A 3 Drives' | 0.618 - 0.786 | 1.272 - 1.618 | 0.618 - 0.786 | 0.13 - 0.886 |
| '121' | 0.382 - 0.786 | 1.128 - 3.618 | 0.5 - 0.786 | 0.382 - 0.786 |
| 'A 121' | 1.272 - 2.0 | 0.5 - 0.786 | 1.272 - 2.0 | 1.272 - 2.618 |
| '121 BG' | 0.618 - 0.707 | 1.128 - 1.733 | 0.5 - 0.577 | 0.447 - 0.786 |
| 'Black Swan' | 1.128 - 2.0 | 0.236 - 0.5 | 1.382 - 2.618 | 1.128 - 2.618 |
| 'White Swan' | 0.5 - 0.886 | 2.0 - 4.237 | 0.382 - 0.786 | 0.238 - 0.886 |
| 'NN White Swan' | 0.5 - 0.886 | 2.0 - 4.236 | 0.382 - 0.724 | 0.382 - 0.886 |
| 'Sea Pony' | 1.618 - 2.618 | 0.382 - 0.5 | 0.128 - 3.618 | 0.618 - 3.618 |
| 'Navarro 200' | 0.886 - 3.618 | 0.886 - 1.128 | 0.382 - 0.786 | 0.886 - 1.128 |
| 'May-00' | 0.5 - 0.618 | 1.618 - 2.236 | 1.128 - 1.618 | 0.5 - 0.618 |
| 'SNORM' | 0.9 - 1.1 | 0.9 - 1.1 | 0.9 - 1.1 | 0.618 - 1.618 |
| 'COL Poruchik' | 1.0 *min - 1.0 *max | 0.382 - 2.618 | 0.128 - 3.618 | 0.618 - 3.618 |
| 'Henry – David' | 0.618 - 0.886 | 0.44 - 0.618 | 0.128 - 2.0 | 0.618 - 1.618 |
| 'DAVID VM 1' | 1.618 - 1.618 | 0.382*min - 0.382*max | 0.128 - 1.618 | 0.618 - 3.618 |
| 'DAVID VM 2' | 1.618 - 1.618 | 0.382*min - 0.382*max | 1.618 - 3.618 | 0.618 - 7.618 |
| 'Partizan' | 1.618*min - 1.618*max | 0.382*min - 0.382*max | 0.128 - 3.618 | 0.618 - 3.618 |
| 'Partizan 2' | 1.618 - 2.236 | 1.128 - 1.618 | 0.128 - 3.618 | 1.618 - 3.618 |
| 'Partizan 2.1' | 1.618*min - 1.618*max | 1.128*min - 1.128*max | 0.128 - 3.618 | 0.618 - 3.618 |
| 'Partizan 2.2' | 2.236*min - 2.236*max | 1.128*min - 1.128*max | 0.128 - 3.618 | 0.618 - 3.618 |
| 'Partizan 2.3' | 1.618*min - 1.618*max | 0.618 - 1.618 | 0.128 - 3.618 | 0.618 - 3.618 |
| 'Partizan 2.4' | 2.236*min - 2.236*max | 1.618*min - 1.618*max | 0.128 - 3.618 | 0.618 - 3.618 |
| 'TOTAL' | 1.272 - 3.618 | 0.382 - 2.618 | 0.276 - 0.786 | 0.618 - 1.618 |
| 'TOTAL NN' | 1.272 - 4.236 | 0.382 - 2.618 | 0.236 - 0.786 | 0.618 - 1.618 |
| 'TOTAL 1' | 1.272 - 2.618 | 0.382 - 0.886 | 0.382 - 0.786 | 0.786 - 0.886 |
| 'TOTAL 2' | 1.618 - 3.618 | 0.382 - 0.886 | 0.382 - 0.786 | 1.128 - 1.618 |
| 'TOTNN 2NN' | 1.618 - 4.236 | 0.382 - 0.886 | 0.382 - 0.786 | 1.128 - 1.618 |
| 'TOTAL 3' | 1.272 - 2.618 | 1.128 - 2.618 | 0.276 - 0.618 | 0.618 - 0.886 |
| 'TOTNN 3NN' | 1.272 - 2.618 | 1.128 - 2.618 | 0.236 - 0.618 | 0.618 - 0.886 |
| 'TOTAL 4' | 1.618 - 2.618 | 1.128 - 2.618 | 0.382 - 0.786 | 1.128 - 1.272 |
| 'BG 1' | 2.618*min - 2.618*max | 0.382*min - 0.382*max | 0.128 - 0.886 | 1.0 *min - 1.0 *max |
| 'BG 2' | 2.237*min - 2.237*max | 0.447*min - 0.447*max | 0.128 - 0.886 | 1.0 *min - 1.0 *max |
| 'BG 3' | 2.0 *min - 2.0 *max | 0.5 *min - 0.5 *max | 0.128 - 0.886 | 1.0 *min - 1.0 *max |
| 'BG 4' | 1.618*min - 1.618*max | 0.618*min - 0.618*max | 0.128 - 0.886 | 1.0 *min - 1.0 *max |
| 'BG 5' | 1.414*min - 1.414*max | 0.707*min - 0.707*max | 0.128 - 0.886 | 1.0 *min - 1.0 *max |
| 'BG 6' | 1.272*min - 1.272*max | 0.786*min - 0.786*max | 0.128 - 0.886 | 1.0 *min - 1.0 *max |
| 'BG 7' | 1.171*min - 1.171*max | 0.854*min - 0.854*max | 0.128 - 0.886 | 1.0 *min - 1.0 *max |
| 'BG 8' | 1.128*min - 1.128*max | 0.886*min - 0.886*max | 0.128 - 0.886 | 1.0 *min - 1.0 *max |
|-------------------|------------------------|------------------------|-----------------------|-----------------------|
🔶 SETTINGS
🔹 Swings
Minimum Swing Length: Minimum length used for the swing detection.
Maximum Swing Length: Maximum length used for the swing detection.
🔹 Patterns
Toggle Pattern Block
Toggle separate pattern in each Pattern Block
🔹 Tolerance
Fibonacci Ratio: Adds a percentage tolerance below/above the ratio when only one ratio applies, creating two limits.
Triangle Area Ratio: Filters patterns based on the ratio of the smallest triangle to the largest triangle.
🔹 Display
Labels: Display Pattern Names, Arrows or nothing
Patterns: Display or not
Last Line: Display previous C-D line when updated
🔹 Style
Colors: Pattern Lines/Names/Arrows - background color of patterns
Text Size: Text Size of Pattern Names/Arrows
🔹 Calculation
Calculated Bars: Allows the usage of fewer bars for performance/speed improvement
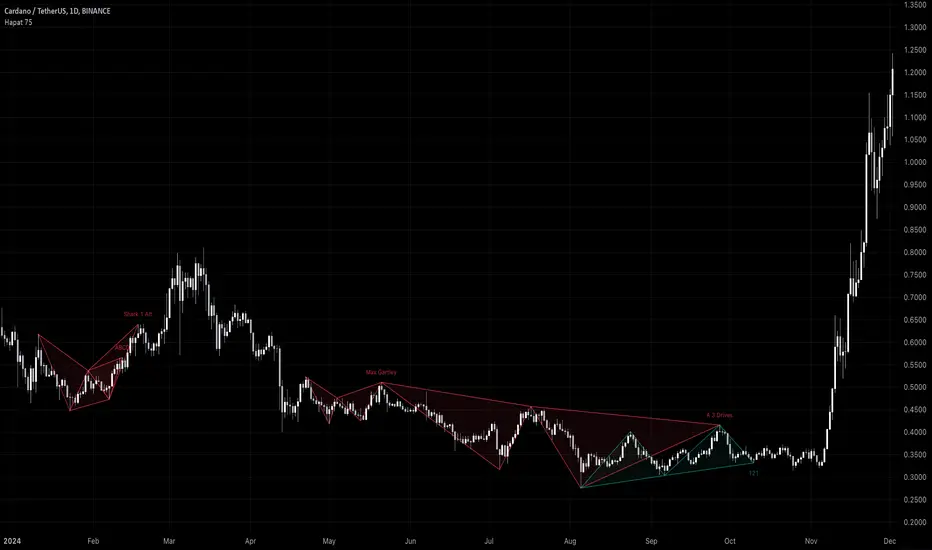
5-0 Harmonic Pattern [TradingFinder] 0XABCD 50 Harmonic Detector🔵 Introduction
Harmonic patterns are a powerful tool in technical analysis, widely used to detect reversal points and trend changes. Among these, the 5-0 Harmonic Pattern stands out due to its reliance on specific Fibonacci ratios—1.13, 1.618, 2.24, and 0.45 to 0.55—anchored at points 0, X, A, B, C, and D. This pattern provides a structured approach for identifying critical buy and sell points, helping traders achieve optimal entry and exit levels in volatile markets.
This 5-0 Harmonic Pattern indicator automatically detects and marks bullish and bearish formations on the chart, offering precise trading signals based on established harmonic ratios. With its dynamic signals, the 5-0 pattern enables traders to anticipate market movements and capitalize on favorable price trends.
Especially in fast-moving markets, harmonic patterns, particularly the 5-0 Harmonic Pattern, equip traders with an essential framework for identifying reversal opportunities and refining their trading strategies.
Bullish 5-0 Pattern :
Bearish 5-0 Pattern :
🔵 How to Use
The 5-0 Harmonic Pattern indicator is designed to automatically mark the key levels of the harmonic structure: 0, X, A, B, C, and D. By doing so, it detects both bullish and bearish patterns and helps traders recognize optimal entry and exit points.
Formed through specific Fibonacci levels, this pattern signals potential shifts in trend direction, giving traders critical insights for managing entries and exits effectively. The tool proves valuable in high-volatility settings, enabling traders to leverage these signals for refined decision-making.
🟣 Bullish 5-0 Pattern
A bullish 5-0 pattern materializes when Fibonacci levels indicate a potential price reversal to the upside. With points 0, X, A, B, C, and D in alignment, the indicator highlights this upward momentum by displaying a green arrow as a buy signal on the chart. This marking provides a clear entry point, indicating that prices are likely to rise, making it a prime moment for traders to enter long positions.
Additionally, the bullish 5-0 pattern is equipped with tools for traders to set stop-loss and take-profit points based on harmonic lines within the pattern, which represent support and resistance levels. Using these dynamic points, traders can create a more effective risk-reward setup while following the bullish signals in a standalone harmonic strategy.
🟣 Bearish 5-0 Pattern
The bearish 5-0 pattern functions similarly but signals a likely downturn. This pattern emerges when Fibonacci ratios align at points 0, X, A, B, C, and D, predicting a reversal downward. The indicator generates a sell signal, marked by a red arrow, prompting traders to exit long positions or initiate short trades to capitalize on falling prices.
Traders can utilize this bearish pattern for defining exit strategies and setting key levels for stop-loss and take-profit orders. The bearish 5-0 pattern enhances traders’ abilities to gauge critical price levels and manage trade risk effectively, especially in volatile markets. For traders focused on profiting from downward trends, this indicator serves as a powerful tool for timely entries and exits.
🔵 Setting
🟣 Logical Setting
ZigZag Pivot Period : You can adjust the period so that the harmonic patterns are adjusted according to the pivot period you want. This factor is the most important parameter in pattern recognition.
Show Valid Forma t: If this parameter is on "On" mode, only patterns will be displayed that they have exact format and no noise can be seen in them. If "Off" is, the patterns displayed that maybe are noisy and do not exactly correspond to the original pattern.
Show Formation Last Pivot Confirm : if Turned on, you can see this ability of patterns when their last pivot is formed. If this feature is off, it will see the patterns as soon as they are formed. The advantage of this option being clear is less formation of fielded patterns, and it is accompanied by the latest pattern seeing and a sharp reduction in reward to risk.
Period of Formation Last Pivot : Using this parameter you can determine that the last pivot is based on Pivot period.
🟣 Genaral Setting
Show : Enter "On" to display the template and "Off" to not display the template.
Color : Enter the desired color to draw the pattern in this parameter.
LineWidth : You can enter the number 1 or numbers higher than one to adjust the thickness of the drawing lines. This number must be an integer and increases with increasing thickness.
LabelSize : You can adjust the size of the labels by using the "size.auto", "size.tiny", "size.smal", "size.normal", "size.large" or "size.huge" entries.
🟣 Alert Setting
Alert : On / Off
Message Frequency : This string parameter defines the announcement frequency. Choices include: "All" (activates the alert every time the function is called), "Once Per Bar" (activates the alert only on the first call within the bar), and "Once Per Bar Close" (the alert is activated only by a call at the last script execution of the real-time bar upon closing). The default setting is "Once per Bar".
Show Alert Time by Time Zone : The date, hour, and minute you receive in alert messages can be based on any time zone you choose. For example, if you want New York time, you should enter "UTC-4". This input is set to the time zone "UTC" by default.
Conclusion
The 5-0 Harmonic Pattern indicator serves as a robust solution for technical analysts and traders looking to pinpoint market reversal points. By automatically recognizing 5-0 patterns and generating buy and sell signals based on Fibonacci ratios, this tool supports precise trend analysis and entry/exit timing. The indicator’s adjustable alerts, color themes, and pattern toggles allow for comprehensive customization, ensuring alignment with individual trading strategies.
Harmonic patterns, especially the 5-0 Harmonic Pattern, guide traders in identifying high-accuracy entry and exit points, thus aiding in more informed trading decisions. By combining Fibonacci ratio analysis with real-time signal updates, this indicator provides a well-rounded approach for risk management and capitalizing on trading opportunities. Professional traders can harness this tool to enhance technical analysis precision and capitalize on price trends effectively, maximizing profitability in both bullish and bearish markets.

Harmonic PatternsHarmonic Patterns
Harmonic Pattern utilizes the recognition of specific structures that possess distinct and consecutive Fibonacci ratio alignments that quantify and validate harmonic patterns. These patterns calculate the Fibonacci aspects of these price structures to identify highly probable reversal points in the financial markets. This methodology assumes that harmonic patterns, like many patterns and cycles in life, continually repeat.
Input Parameters:
Zigzag Setup:
These group of parameters are used to identify the swing points. The script also draws the Zigzag line and swing labels based on these parameters.
Harmonic Pattern Setup:
Ignore XD leg calculations – Optionally one can choose to ignore the XD leg calculation.
Fixed value leg offset % - Fixed value leg parameters are such parameters where single value Fibonacci value is used. This makes pattern identification very rare. To overcome this one can input % value which would be used to derive the range of Fibonacci numbers for pattern identification. E.g. XD leg in Bat pattern has fixed leg of 88.6%, If we input 5% as fixed value leg offset % then instead of fixed value of 88.6%, script calculates range as 88.6% + 5% (Value 1) and 88.6% - 5% (Value 2) and uses the same for pattern identification.
The script plots a diamond shape label on the last candle of the chart. The label has been enabled with a tooltip which shows number of patterns of each type along with the time where latest pattern is located.
This script covers harmonic patterns listed in the table below. Each harmonic pattern has bullish and bearish variants. All these patterns have 4 legs known as XABCD.
The Patterns have been configured as specified in the table below. Refer to Figure 1 and Figure 2 to understand how to read and interpret the table.
Figure 1
Figure 2

Harmonic Pattern Detection, Prediction, and Backtesting ToolOverview:
The ultimate harmonic XABCD pattern identification, prediction, and backtesting system.
Harmonic patterns are among the most accurate of trading signals, yet they're widely underutilized because they can be difficult to spot and tedious to validate. If you've ever come across a pattern and struggled with questions like "are these retracement ratios close enough to the harmonic ratios?" or "what are the Potential Reversal levels and are they confluent with point D?", then this tool is your new best friend. Or, if you've never traded harmonic patterns before, maybe it's time to start. Put away your drawing tools and calculators, relax, and let this indicator do the heavy lifting for you.
- Identification -
An exhaustive search across multiple pivot lengths ensures that even the sneakiest harmonic patterns are identified. Each pattern is evaluated and assigned a score, making it easy to differentiate weak patterns from strong ones. Tooltips under the pattern labels show a detailed breakdown of the pattern's score and retracement ratios (see the Scoring section below for details).
- Prediction -
After a pattern is identified, paths to potential targets are drawn, and Potential Reversal Zone (PRZ) levels are plotted based on the retracement ratios of the harmonic pattern. Targets are customizable by pattern type (e.g. you can specify one set of targets for a Gartley and another for a Bat, etc).
- Backtesting -
A table shows the results of all the patterns found in the chart. Change your target, stop-loss, and % error inputs and observe how it affects your success rate.
//------------------------------------------------------
// Scoring
//------------------------------------------------------
A percentage-based score is calculated from four components:
(1) Retracement % Accuracy - this measures how closely the pattern's retracement ratios match the theoretical values (fibs) defined for a given harmonic pattern. You can change the "Allowed fib ratio error %" in Settings to be more or less inclusive.
(2) PRZ Level Confluence - Potential Reversal Zone levels are projected from retracements of the XA and BC legs. The PRZ Level Confluence component measures the closeness of the closest XA and BC retracement levels, relative to the total height of the PRZ.
(3) Point D / PRZ Confluence - this measures the closeness of point D to either of the closest two PRZ levels (identified in the PRZ Level Confluence component above), relative to the total height of the PRZ. In theory, the closer together these levels are, the higher the probability of a reversal.
(4) Leg Length Symmetry - this measures the ΔX symmetry of each leg. You can change the "Allowed leg length asymmetry %" in settings to be more or less inclusive.
So, a score of 100% would mean that (1) all leg retracements match the theoretical fib ratios exactly (to 16 decimal places), (2) the closest XA and BC PRZ levels are exactly the same, (3) point D is exactly at the confluent PRZ level, and (4) all legs are exactly the same number of bars. While this is theoretically possible, you have better odds of getting struck by lightning twice on a sunny day.
Calculation weights of all four components can be changed in Settings.
//------------------------------------------------------
// Targets
//------------------------------------------------------
A hard-coded set of targets are available to choose from, and can be applied to each pattern type individually:
(1) .618 XA = .618 retracement of leg XA, measured from point D
(2) 1.272 XA = 1.272 retracement of leg XA, measured from point D
(3) 1.618 XA = 1.618 retracement of leg XA, measured from point D
(4) .618 CD = .618 retracement of leg CD, measured from point D
(5) 1.272 CD = 1.272 retracement of leg CD, measured from point D
(6) 1.618 CD = 1.618 retracement of leg CD, measured from point D
(7) A = point A
(8) B = point B
(9) C = point C
//------------------------------------------------------
// Stops
//------------------------------------------------------
Stop-loss levels are also user-defined, in one of three ways:
(1) % beyond the furthest PRZ level (below the PRZ level for bullish patterns, and above for bearish)
(2) % beyond point D
(3) % of distance to Target 1, beyond point D. This method allows for a proper Risk:Reward approach by defining your potential losses as a percentage of the potential gains. This is the default.
//------------------------------------------------------
// Results Table / Backtesting Statistics
//------------------------------------------------------
To properly assess the effectiveness of a specific pattern type, a time limit is enforced for a completed pattern to reach the targets or the stop level. When this time limit expires, the pattern has "timed out", and is no longer considered in the Success Rate statistics. During the time limit period, if price reaches Target 1 before reaching the Stop level, the pattern is considered successful. Conversely, if price reaches the Stop level before reaching Target 1, the pattern is considered a failure. The time limit can be changed in Settings, and is defined in terms of the total pattern length (point X to point D). It is set to 1.5 by default.
Increasing the time limit value will give you more realistic Success Rate values, but will less accurately represent the success rate of the harmonic patterns (i.e. the more time that elapses after a pattern completes, the less likely it is that the price action is related to that pattern).
//------------------------------------------------------
// Coming soon...
//------------------------------------------------------
I have a handful of other features in development, including:
(1) Drawing incomplete patterns as they develop. This will allow you more time to plan entries and stops, or potentially trade reversals from point C to point D PRZ levels.
(2) Support for the Shark and Cypher patterns
(3) Alerts
Please report any bugs, runtime errors, other issues or enhancement suggestions.
I also welcome any feedback from experienced harmonic pattern traders, especially regarding your strategy for setting targets and stop-losses.
@reees

Alternate Bat Harmonic Pattern [TradingFinder] ALT Bat Indicator🔵 Introduction
The Alternate Bat harmonic pattern is one of the most precise and practical tools in technical analysis, introduced by Scott Carney in 2003. This pattern focuses on specific Fibonacci ratios, such as 0.382 at point B and 1.13XA at point D, to identify Potential Reversal Zones (PRZ) where price is likely to reverse.
The Alternative Bat pattern emerged as a result of repeated failures observed in the standard Bat pattern. Traders entering trades near the 0.886XA level of the standard Bat often encountered losses. In the Alternate Bat, point D extends beyond 0.886XA, typically reversing at 1.13XA, offering a more accurate identification of the reversal zone.
A key characteristic of this pattern is its M- or W-shaped structure, where the midpoint B retraces 0.382XA or less. Additionally, the CD leg requires an extension of 2.0 to 3.618 to complete the pattern. Due to its accuracy and the predictable behavior of price near the PRZ, the Alternate Bat pattern is recognized as a powerful tool for forecasting price reversals.
In the bullish Alternative Bat pattern, an M-shaped structure forms. After an initial upward movement (XA), price undergoes a short correction at point B (0.382XA) and then declines toward point D (1.13XA and an extension of 2.0 to 3.618BC), where a potential upward reversal is expected.
In the bearish Alternate Bat pattern, a W-shaped structure forms. After an initial downward movement (XA), price retraces slightly at point B (0.382XA) and then rises toward point D (1.13XA and an extension of 2.0 to 3.618BC), where a potential downward reversal is anticipated.
🔵 How to Use
The Alternate Bat harmonic pattern is a key tool for identifying potential reversal zones (PRZ) in the market. By leveraging the 0.382 retracement at point B and the 1.13XA extension at point D, along with symmetrical price structures, this pattern offers precise reversal opportunities in both bullish and bearish market conditions.
🟣 Bullish Alternate Bat Pattern
The bullish Alternate Bat pattern forms during a downtrend, signaling a potential reversal to the upside. This pattern consists of three downward movements with two corrective waves, ultimately reaching point D, which marks the PRZ.
At the PRZ, the convergence of Fibonacci levels—1.13XA and extensions ranging from 2.0 to 3.618BC—creates a strong support zone where price is likely to reverse upward.
🟣 Bearish Alternative Bat Pattern
The bearish Alternate Bat pattern develops during an uptrend, indicating a potential reversal to the downside. This pattern features three upward price movements with two retracements, ending at point D, where the PRZ forms.
Point D is defined by the 1.13XA extension and the 2.0 to 3.618BC projection, creating a strong resistance zone where price is expected to reverse downward.
🔵 Setting
🟣 Logical Setting
ZigZag Pivot Period : You can adjust the period so that the harmonic patterns are adjusted according to the pivot period you want. This factor is the most important parameter in pattern recognition.
Show Valid Format : If this parameter is on "On" mode, only patterns will be displayed that they have exact format and no noise can be seen in them. If "Off" is, the patterns displayed that maybe are noisy and do not exactly correspond to the original pattern.
Show Formation Last Pivot Confirm : if Turned on, you can see this ability of patterns when their last pivot is formed. If this feature is off, it will see the patterns as soon as they are formed. The advantage of this option being clear is less formation of fielded patterns, and it is accompanied by the latest pattern seeing and a sharp reduction in reward to risk.
Period of Formation Last Pivot : Using this parameter you can determine that the last pivot is based on Pivot period.
🟣 Genaral Setting
Show : Enter "On" to display the template and "Off" to not display the template.
Color : Enter the desired color to draw the pattern in this parameter.
LineWidth : You can enter the number 1 or numbers higher than one to adjust the thickness of the drawing lines. This number must be an integer and increases with increasing thickness.
LabelSize : You can adjust the size of the labels by using the "size.auto", "size.tiny", "size.smal", "size.normal", "size.large" or "size.huge" entries.
🟣 Alert Setting
Alert : On / Off
Message Frequency : This string parameter defines the announcement frequency. Choices include: "All" (activates the alert every time the function is called), "Once Per Bar" (activates the alert only on the first call within the bar), and "Once Per Bar Close" (the alert is activated only by a call at the last script execution of the real-time bar upon closing). The default setting is "Once per Bar".
Show Alert Time by Time Zone : The date, hour, and minute you receive in alert messages can be based on any time zone you choose. For example, if you want New York time, you should enter "UTC-4". This input is set to the time zone "UTC" by default.
🔵 Conclusion
The Alternate Bat harmonic pattern, with its precise Fibonacci ratios like 0.382 and 1.13XA, is a reliable tool for identifying Potential Reversal Zones (PRZ) in financial markets. By recognizing symmetrical price structures and focusing on both bullish and bearish scenarios, traders can identify optimal entry and exit points with high accuracy.
The key strength of this pattern lies in its ability to define strong support and resistance zones near the PRZ, increasing the probability of price reversals. Combining the pattern with candlestick confirmations and volume analysis enhances its effectiveness.
Ultimately, incorporating the Alternative Bat pattern with proper risk management and Fibonacci-based targets allows traders to enter the market confidently and capitalize on potential price reversals.

ABCD Harmonic Pattern [TradingFinder] ABCD Pattern indicator🔵 Introduction
The ABCD harmonic pattern is a tool for identifying potential reversal zones (PRZ) by using Fibonacci ratios to pinpoint critical price reversal points on price charts.
This pattern consists of four key points, labeled A, B, C, and D. In this structure, the AB and CD waves move in the same direction, while the BC wave acts as a corrective wave in the opposite direction.
The ABCD pattern follows specific Fibonacci ratios that enhance its accuracy in identifying PRZ. Typically, point C lies within the 0.382 to 0.886 Fibonacci retracement of the AB wave, indicating the correction extent of the BC wave.
Subsequently, the CD wave, as the final wave in this pattern, reaches point D with a Fibonacci extension between 1.13 and 2.618 of the BC wave. Point D, which marks the PRZ, is where a potential price reversal is likely to occur.
The ABCD pattern appears in both bullish and bearish forms. In the bullish ABCD pattern, prices tend to increase at point D, which defines the PRZ; in the bearish ABCD pattern, prices typically decrease upon reaching the PRZ at point D.
These characteristics make the ABCD pattern a popular tool for identifying PRZ and price reversal points in financial markets, including forex, cryptocurrencies, and stocks.
Bullish Pattern :
Beaish Pattern :
🔵 How to Use
🟣 Bullish ABCD Pattern
The bullish ABCD pattern is another harmonic structure used to identify a potential reversal zone (PRZ) where the price is likely to rise after a downward movement. This pattern includes four main points A, B, C, and D. In the bullish ABCD, the AB and CD waves move downward, and the BC wave acts as a corrective, upward wave. This setup creates a PRZ at point D, where the price may reverse and move upward.
To identify a bullish ABCD pattern, begin with the downward AB wave. The BC wave retraces upward between 0.382 and 0.886 of the AB wave, indicating the extent of the correction.
After the BC retracement, the CD wave forms and extends from point C down to point D, with an extension of around 1.13 to 2.618 of the BC wave. Point D, as the PRZ, represents the area where the price may reverse upwards, making it a strategic level for potential buy positions.
When the price reaches point D in the bullish ABCD pattern, traders look for upward reversal signals. This can include bullish candlestick formations, such as hammer or morning star patterns, near the PRZ to confirm the trend reversal. Entering a long position after confirmation near point D provides a calculated entry point.
Additionally, placing a stop loss slightly below point D helps protect against potential loss if the reversal does not occur. The ABCD pattern, with its precise Fibonacci structure and PRZ identification, gives traders a disciplined approach to spotting bullish reversals in markets, particularly in forex, cryptocurrency, and stock trading.
Bullish Pattern in COINBASE:BTCUSD :
🟣 Bearish ABCD Pattern
The bearish ABCD pattern is a harmonic structure that indicates a potential reversal zone (PRZ) where price may shift downward after an initial upward movement. This pattern consists of four main points A, B, C, and D. In a bearish ABCD, the AB and CD waves move upward, while the BC wave acts as a corrective wave in the opposite, downward direction. This reversal zone (PRZ) can be identified with specific Fibonacci ratios.
To identify a bearish ABCD pattern, start by observing the AB wave, which forms as an upward price movement. The BC wave, which follows, typically retraces between 0.382 to 0.886 of the AB wave. This retracement indicates how far the correction goes and sets the foundation for the next wave.
Finally, the CD wave extends from point C to reach point D with a Fibonacci extension of approximately 1.13 to 2.618 of the BC wave. Point D represents the PRZ where the potential reversal may occur, making it a critical area for traders to consider short positions.
Once point D in the bearish ABCD pattern is reached, traders can anticipate a downward price movement. At this potential reversal zone (PRZ), traders often wait for additional bearish signals or candlestick patterns, such as engulfing or evening star formations, to confirm the price reversal.
This confirmation around the PRZ enhances the accuracy of the entry point for a bearish position. Setting a stop loss slightly above point D can help manage risk if the price doesn’t reverse as anticipated. The ABCD pattern, with its reliance on Fibonacci ratios and clearly defined points, offers a strategic approach for traders looking to capitalize on potential bearish reversals in financial markets, including forex, stocks, and cryptocurrencies.
Bearish Pattern in OANDA:XAUUSD :
🔵 Setting
🟣 Logical Setting
ZigZag Pivot Period : You can adjust the period so that the harmonic patterns are adjusted according to the pivot period you want. This factor is the most important parameter in pattern recognition.
Show Valid Forma t: If this parameter is on "On" mode, only patterns will be displayed that they have exact format and no noise can be seen in them. If "Off" is, the patterns displayed that maybe are noisy and do not exactly correspond to the original pattern.
Show Formation Last Pivot Confirm : if Turned on, you can see this ability of patterns when their last pivot is formed. If this feature is off, it will see the patterns as soon as they are formed. The advantage of this option being clear is less formation of fielded patterns, and it is accompanied by the latest pattern seeing and a sharp reduction in reward to risk.
Period of Formation Last Pivot : Using this parameter you can determine that the last pivot is based on Pivot period.
🟣 Genaral Setting
Show : Enter "On" to display the template and "Off" to not display the template.
Color : Enter the desired color to draw the pattern in this parameter.
LineWidth : You can enter the number 1 or numbers higher than one to adjust the thickness of the drawing lines. This number must be an integer and increases with increasing thickness.
LabelSize : You can adjust the size of the labels by using the "size.auto", "size.tiny", "size.smal", "size.normal", "size.large" or "size.huge" entries.
🟣 Alert Setting
Alert : On / Off
Message Frequency : This string parameter defines the announcement frequency. Choices include: "All" (activates the alert every time the function is called), "Once Per Bar" (activates the alert only on the first call within the bar), and "Once Per Bar Close" (the alert is activated only by a call at the last script execution of the real-time bar upon closing). The default setting is "Once per Bar".
Show Alert Time by Time Zone : The date, hour, and minute you receive in alert messages can be based on any time zone you choose. For example, if you want New York time, you should enter "UTC-4". This input is set to the time zone "UTC" by default.
🟣 Conclusion
The ABCD harmonic pattern offers a structured approach in technical analysis, helping traders accurately identify potential reversal zones (PRZ) where price movements may shift direction. By leveraging the relationships between points A, B, C, and D, alongside specific Fibonacci ratios, traders can better anticipate points of market reversal and make more informed decisions.
Both the bearish and bullish ABCD patterns enable traders to pinpoint ideal entry points that align with anticipated market shifts. In a bearish ABCD, point D within the PRZ often signals a downward trend reversal, while in a bullish ABCD, this same point typically suggests an upward reversal. The adaptability of the ABCD pattern across different markets, such as forex, stocks, and cryptocurrencies, further highlights its utility and reliability.
Integrating the ABCD pattern into a trading strategy provides a methodical and calculated approach to entry and exit decisions. With accurate application of Fibonacci ratios and confirmation of the PRZ, traders can enhance their trading precision, reduce risks, and boost overall performance. The ABCD harmonic pattern remains a valuable resource for traders aiming to leverage structured patterns for consistent results in their technical analysis.

Cypher Harmonic Pattern [TradingFinder] Cypher Pattern Detector🔵 Introduction
The Cypher Pattern is one of the most accurate and advanced harmonic patterns, introduced by Darren Oglesbee. The Cypher pattern, utilizing Fibonacci ratios and geometric price analysis, helps traders identify price reversal points with high precision. This pattern consists of five key points (X, A, B, C, and D), each playing an important role in determining entry and exit points in the financial markets.
The reversal point typically occurs in the XD region, with the Fibonacci ratio ranging between 0.768 and 0.886. This zone is referred to as the Potential Reversal Zone (PRZ), where traders anticipate price changes to occur.
The Cypher harmonic pattern is popular among professional traders due to its high accuracy in identifying market trends and reversal points. The pattern appears in two forms: bullish Cypher pattern and bearish Cypher pattern.
In the bullish Cypher pattern, after a price correction, the price moves upward, while in the bearish Cypher pattern, the price moves downward after a temporary increase. These patterns help traders use technical analysis to identify strong reversal points in the PRZ and execute more optimal trades.
Bullish Cypher Pattern :
Bearish Cypher Pattern :
🔵 How to Use
The Cypher pattern is one of the most complex and precise harmonic patterns, leveraging Fibonacci ratios to help traders identify price reversals. This pattern is comprised of five key points, each playing a critical role in determining entry and exit points.
The Cypher pattern appears in two main types :
Bullish Cypher pattern : This pattern appears as an M shape on the chart and indicates a trend reversal to the upside after a price correction. Traders can prepare for buying after identifying this pattern in technical analysis.
Bearish Cypher pattern : This pattern appears as a W shape and signals the start of a downtrend after a temporary price increase. Traders can use this pattern to enter short positions.
🟣 How to Identify the Cypher Pattern on a Chart
Identifying the Cypher pattern requires precision and the use of advanced technical analysis tools. The pattern consists of four main legs, each identified using Fibonacci ratios and geometric analysis.
To spot the Cypher pattern on a chart, first, identify the five key points : X, A, B, C, and D.
XA leg : The initial move from point X to A.
AB leg : The first correction after the XA move, where the price moves to point B.
BC leg : After the correction, the price moves upwards to point C.
CD leg : The final price move that reaches point D, where a price reversal is expected.
In a bullish Cypher pattern, point D indicates the start of a new uptrend, while in a bearish Cypher pattern, point D signals the beginning of a downtrend. Correctly identifying these points helps traders determine the best time to enter a trade.
🟣 How to Trade Using the Cypher Pattern
Once the Cypher pattern is identified on the chart, traders can use it to set entry and exit points. Point D is the key point for trade entry. In the bullish Cypher pattern, the trader can enter a long position after point D forms, while in the bearish Cypher pattern, point D serves as the ideal point for entering a short position.
🟣 Entering a Buy Trade with the Bullish Cypher Pattern
In a bullish Cypher pattern, traders wait for the price to reach point D, after which they can enter a buy position. At this point, the price is expected to start rising.
🟣 Entering a Sell Trade with the Bearish Cypher Pattern
In a bearish Cypher pattern, the trader enters a sell position at point D, expecting the price to move downward after reaching this point. For additional confirmation, traders can use technical indicators such as RSI or MACD.
🟣 Risk Management in Cypher Pattern Trades
Risk management is one of the most critical aspects of any trade, and this holds true for trading the Cypher pattern. Traders should always use stop-loss orders to prevent larger losses in case the pattern fails.
In the bullish Cypher pattern, the stop-loss is usually placed slightly below point D to exit the trade if the price continues to drop.
In the bearish Cypher pattern, the stop-loss is placed above point D to limit losses if the price rises unexpectedly.
🟣 Combining the Cypher Pattern with Other Technical Tools
The Cypher pattern is a powerful tool in technical analysis, but combining it with other methods such as price action and technical indicators can improve trading accuracy.
🟣 Combining with Price Action
Traders can use price action to confirm the Cypher pattern. Candlestick patterns like reversal candlesticks can provide additional confirmation for price reversals at point D.
🟣 Using Technical Indicators
Incorporating technical indicators such as RSI and MACD can also help traders receive stronger signals for entering trades based on the Cypher pattern. These indicators help identify overbought or oversold conditions, allowing traders to make more informed decisions.
🟣 Advantages and Disadvantages of the Cypher Pattern in Technical Analysis
Advantages :
High accuracy : The Cypher pattern, using Fibonacci ratios and geometric analysis, provides high precision in identifying reversal points.
Applicable in various markets : This pattern can be used in a wide range of financial markets, including forex, stocks, and cryptocurrencies.
Disadvantages :
Rarit y: The Cypher pattern appears less frequently on charts compared to other harmonic patterns.
Complexity : Accurately identifying this pattern requires significant experience, which may be challenging for novice traders.
🔵 Setting
🟣 Logical Setting
ZigZag Pivot Period : You can adjust the period so that the harmonic patterns are adjusted according to the pivot period you want. This factor is the most important parameter in pattern recognition.
Show Valid Forma t: If this parameter is on "On" mode, only patterns will be displayed that they have exact format and no noise can be seen in them. If "Off" is, the patterns displayed that maybe are noisy and do not exactly correspond to the original pattern.
Show Formation Last Pivot Confirm : if Turned on, you can see this ability of patterns when their last pivot is formed. If this feature is off, it will see the patterns as soon as they are formed. The advantage of this option being clear is less formation of fielded patterns, and it is accompanied by the latest pattern seeing and a sharp reduction in reward to risk.
Period of Formation Last Pivot : Using this parameter you can determine that the last pivot is based on Pivot period.
🟣 Genaral Setting
Show : Enter "On" to display the template and "Off" to not display the template.
Color : Enter the desired color to draw the pattern in this parameter.
LineWidth : You can enter the number 1 or numbers higher than one to adjust the thickness of the drawing lines. This number must be an integer and increases with increasing thickness.
LabelSize : You can adjust the size of the labels by using the "size.auto", "size.tiny", "size.smal", "size.normal", "size.large" or "size.huge" entries.
🟣 Alert Setting
Alert : On / Off
Message Frequency : This string parameter defines the announcement frequency. Choices include: "All" (activates the alert every time the function is called), "Once Per Bar" (activates the alert only on the first call within the bar), and "Once Per Bar Close" (the alert is activated only by a call at the last script execution of the real-time bar upon closing). The default setting is "Once per Bar".
Show Alert Time by Time Zone : The date, hour, and minute you receive in alert messages can be based on any time zone you choose. For example, if you want New York time, you should enter "UTC-4". This input is set to the time zone "UTC" by default.
🔵 Conclusion
The Cypher harmonic pattern is one of the most powerful and accurate patterns used in technical analysis. Its high precision in identifying price reversal points, particularly within the Potential Reversal Zone (PRZ), has made it a popular tool among professional traders. The PRZ, located between the Fibonacci ratios of 0.768 and 0.886 in the XD region, offers traders a clear indication of where price reversals are likely to occur.
However, to use this pattern successfully, traders must employ proper risk management and combine it with supplementary tools like technical indicators and price action. By understanding how to utilize the PRZ, traders can enhance the accuracy of their trade entries and exits.
Ultimately, the Cypher pattern, when used in conjunction with the PRZ, helps traders make more precise decisions in the financial markets, leading to more successful and well-informed trades.
