FX Sessions by m_cptForex Intraday Sessions Indicator, config time in UTC-4. Support 4 main sessions, smooth end-to-start candles mode, without gaps if your sessions has config like:
1) 19:00 - 03:00
2) 02:00 - 03:00
3) 03:00 -11:00
No excluded last candles issue on all TFs.
Working on LTF up to 1h TF since its intraday sessions indicator.
Pesquisar nos scripts por "forex"

Forex Session HighlighterSet the session start and stop time for one single session. Allows a trader to easily see their preferred trading times at a glance. Especially helpful during bar replay.

Forex Session Levels + Dashboard (AEST)This is a script showing all the key levels you will ever need for the breakout and retest strategy.
Follow my IG:
@liviupircalabu10

TrinityBar**TrinityBar Strategy Description**
The TrinityBar strategy is a price‐action based trading model that leverages Bill Williams’ bar thirds concept to generate entry signals and execute market orders automatically. Here’s how it works:
1. **Bar Thirds Calculation:**
The strategy calculates the range of both the current fully formed bar and the previous fully formed bar. It then divides each bar’s range into three equal parts (thirds).
- For the current bar, the lower third and upper third levels are computed.
- The same is done for the previous bar.
2. **Bar Type Classification:**
Each bar is classified into one of several types based on where its open and close fall relative to its thirds:
- **Bullish Patterns:**
- *1‑3 Bar:* Opens in the lower third and closes in the upper third.
- *2‑3 Bar:* Opens in the middle third and closes in the upper third.
- *3‑3 Bar:* Both open and close are in the upper third.
- **Bearish Patterns:**
- *3‑1 Bar:* Opens in the upper third and closes in the lower third.
- *2‑1 Bar:* Opens in the middle third and closes in the lower third.
- *1‑1 Bar:* Both open and close are in the lower third.
3. **Signal Generation:**
- **Bullish Signal:** A valid buy is generated when the previous bar exhibits any bullish pattern (1‑3, 2‑3, or 3‑3) and the current bar is either a 1‑3 or a 3‑3 bar.
- **Bearish Signal:** A valid sell is generated when the previous bar shows any bearish pattern (1‑1, 2‑1, or 3‑1) and the current bar is either a 1‑1 or a 3‑1 bar.
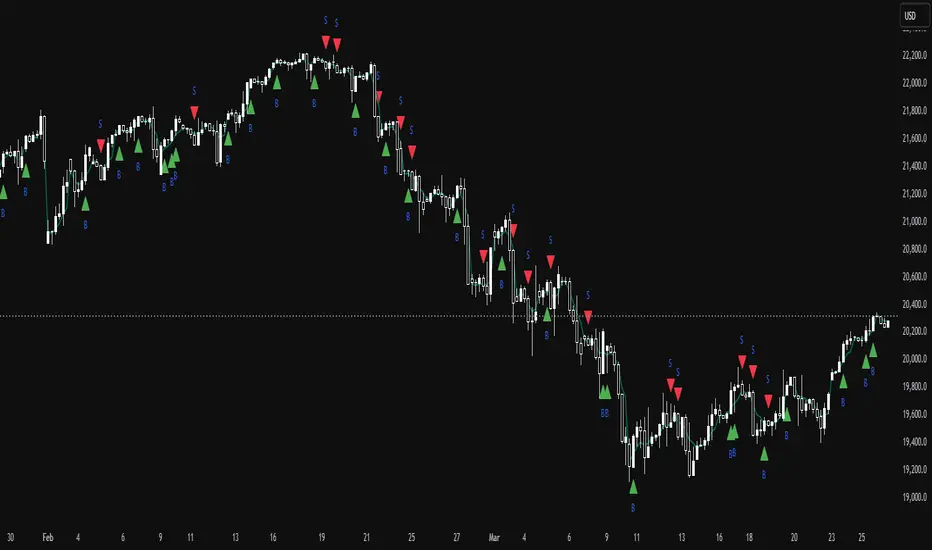
4. **Visual Alerts:**
When a valid signal is identified, the strategy plots a small triangle below the bar for a buy signal (labeled “B” in green) and a triangle above the bar for a sell signal (labeled “S” in red).
5. **Trade Execution:**
Once a signal is confirmed:
- If a bullish signal is generated, any short positions are closed, and if there is no existing long position, a market long order is entered.
- Conversely, if a bearish signal occurs, any long positions are closed, and a market short order is entered if not already in a short position.
This strategy is designed to capture significant price expansions by relying solely on price action and bar structure, without relying on lagging indicators. It provides a mechanical, systematic approach that removes emotional bias from trading decisions.
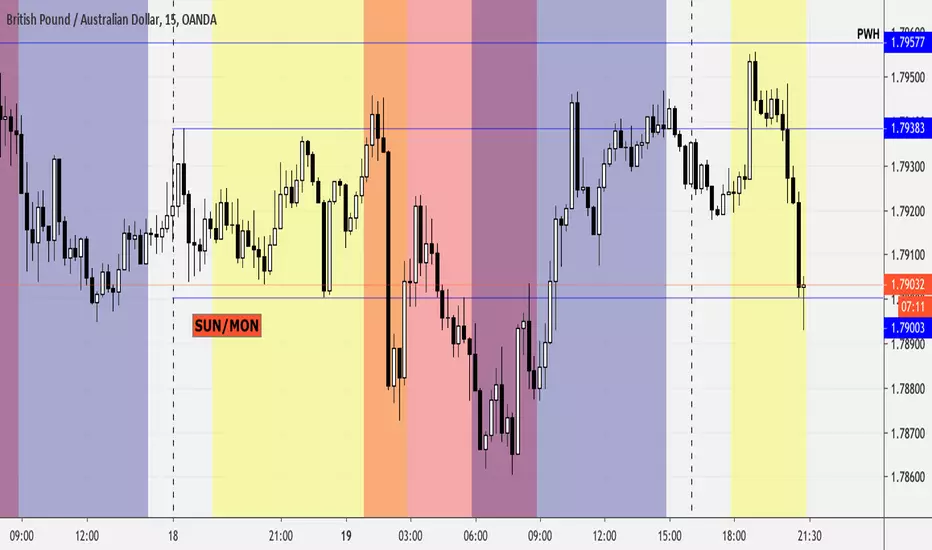
ICT Killzones and Sessions W/ Silver Bullet + MacrosForex and Equity Session Tracker with Killzones, Silver Bullet, and Macro Times
This Pine Script indicator is a comprehensive timekeeping tool designed specifically for ICT traders using any time-based strategy. It helps you visualize and keep track of forex and equity session times, kill zones, macro times, and silver bullet hours.
Features:
Session and Killzone Lines:
Green: London Open (LO)
White: New York (NY)
Orange: Australian (AU)
Purple: Asian (AS)
Includes AM and PM session markers.
Dotted/Striped Lines indicate overlapping kill zones within the session timeline.
Customization Options:
Display sessions and killzones in collapsed or full view.
Hide specific sessions or killzones based on your preferences.
Customize colors, texts, and sizes.
Option to hide drawings older than the current day.
Automatic Updates:
The indicator draws all lines and boxes at the start of a new day.
Automatically adjusts time-based boxes according to the New York timezone.
Killzone Time Windows (for indices):
London KZ: 02:00 - 05:00
New York AM KZ: 07:00 - 10:00
New York PM KZ: 13:30 - 16:00
Silver Bullet Times:
03:00 - 04:00
10:00 - 11:00
14:00 - 15:00
Macro Times:
02:33 - 03:00
04:03 - 04:30
08:50 - 09:10
09:50 - 10:10
10:50 - 11:10
11:50 - 12:50
Latest Update:
January 15:
Added option to automatically change text coloring based on the chart.
Included additional optional macro times per user request:
12:50 - 13:10
13:50 - 14:15
14:50 - 15:10
15:50 - 16:15
Usage:
To maximize your experience, minimize the pane where the script is drawn. This minimizes distractions while keeping the essential time markers visible. The script is designed to help traders by clearly annotating key trading periods without overwhelming their charts.
Originality and Justification:
This indicator uniquely integrates various time-based strategies essential for ICT traders. Unlike other indicators, it consolidates session times, kill zones, macro times, and silver bullet hours into one comprehensive tool. This allows traders to have a clear and organized view of critical trading periods, facilitating better decision-making.
Credits:
This script incorporates open-source elements with significant improvements to enhance functionality and user experience.
Forex and Equity Session Tracker with Killzones, Silver Bullet, and Macro Times
This Pine Script indicator is a comprehensive timekeeping tool designed specifically for ICT traders using any time-based strategy. It helps you visualize and keep track of forex and equity session times, kill zones, macro times, and silver bullet hours.
Features:
Session and Killzone Lines:
Green: London Open (LO)
White: New York (NY)
Orange: Australian (AU)
Purple: Asian (AS)
Includes AM and PM session markers.
Dotted/Striped Lines indicate overlapping kill zones within the session timeline.
Customization Options:
Display sessions and killzones in collapsed or full view.
Hide specific sessions or killzones based on your preferences.
Customize colors, texts, and sizes.
Option to hide drawings older than the current day.
Automatic Updates:
The indicator draws all lines and boxes at the start of a new day.
Automatically adjusts time-based boxes according to the New York timezone.
Killzone Time Windows (for indices):
London KZ: 02:00 - 05:00
New York AM KZ: 07:00 - 10:00
New York PM KZ: 13:30 - 16:00
Silver Bullet Times:
03:00 - 04:00
10:00 - 11:00
14:00 - 15:00
Macro Times:
02:33 - 03:00
04:03 - 04:30
08:50 - 09:10
09:50 - 10:10
10:50 - 11:10
11:50 - 12:50
Latest Update:
January 15:
Added option to automatically change text coloring based on the chart.
Included additional optional macro times per user request:
12:50 - 13:10
13:50 - 14:15
14:50 - 15:10
15:50 - 16:15
ICT Sessions and Kill Zones
What They Are:
ICT Sessions: These are specific times during the trading day when market activity is expected to be higher, such as the London Open, New York Open, and the Asian session.
Kill Zones: These are specific time windows within these sessions where the probability of significant price movements is higher. For example, the New York AM Kill Zone is typically from 8:30 AM to 11:00 AM EST.
How to Use Them:
Identify the Session: Determine which trading session you are in (London, New York, or Asian).
Focus on Kill Zones: Within that session, focus on the kill zones for potential trade setups. For instance, during the New York session, look for setups between 8:30 AM and 11:00 AM EST.
Silver Bullets
What They Are:
Silver Bullets: These are specific, high-probability trade setups that occur within the kill zones. They are designed to be "one shot, one kill" trades, meaning they aim for precise and effective entries and exits.
How to Use Them:
Time-Based Setup: Look for these setups within the designated kill zones. For example, between 10:00 AM and 11:00 AM for the New York AM session .
Chart Analysis: Start with higher time frames like the 15-minute chart and then refine down to 5-minute and 1-minute charts to identify imbalances or specific patterns .
Macros
What They Are:
Macros: These are broader market conditions and trends that influence your trading decisions. They include understanding the overall market direction, seasonal tendencies, and the Commitment of Traders (COT) reports.
How to Use Them:
Understand Market Conditions: Be aware of the macroeconomic factors and market conditions that could affect price movements.
Seasonal Tendencies: Know the seasonal patterns that might influence the market direction.
COT Reports: Use the Commitment of Traders reports to understand the positioning of large traders and commercial hedgers .
Putting It All Together
Preparation: Understand the macro conditions and review the COT reports.
Session and Kill Zone: Identify the trading session and focus on the kill zones.
Silver Bullet Setup: Look for high-probability setups within the kill zones using refined chart analysis.
Execution: Execute the trade with precision, aiming for a "one shot, one kill" outcome.
By following these steps, you can effectively use ICT sessions, kill zones, silver bullets, and macros to enhance your trading strategy.
Usage:
To maximize your experience, shrink the pane where the script is drawn. This minimizes distractions while keeping the essential time markers visible. The script is designed to help traders by clearly annotating key trading periods without overwhelming their charts.
Originality and Justification:
This indicator uniquely integrates various time-based strategies essential for ICT traders. Unlike other indicators, it consolidates session times, kill zones, macro times, and silver bullet hours into one comprehensive tool. This allows traders to have a clear and organized view of critical trading periods, facilitating better decision-making.
Credits:
This script incorporates open-source elements with significant improvements to enhance functionality and user experience. All credit goes to itradesize for the SB + Macro boxes

Forex Session by PThis session indicator is set according to UTC+5:30 (Kolkata, India)
L = London
N = New York
T= Tokyo
FF = Frankfurt
NYSE = New York Stock Exchange
Square in Bottom
With characters are Start of the Session
Without Characters are End of the Session specified with the color.


Forex/Crypto/Custom Market SessionsCredit goes to TradeMasterSavis for providing the original code
I merge the 2 sessions together allowing you to toggle between the two. I also add a 3rd custom session type and the ability to change the duration of each trading session. This would solve any problems ran into the case of Daylight savings time switch or if you just want different session duration.

Forex - Candle Price Info PanelInfo Panel that displays difference in ticks between current candle open value and highest/lowest wick values in past "X" number of candles
Quickly glance at a simple and recent price action range.
Put together as a learning project with help, code and advice from @jhanson107, @Zekis.

Forex Sessions (Asian, London, New York)This script lines up the different sessions for New York, Asian, and London. It also have overlap between the sessions and the colors have been adjusted to make it easier to read.
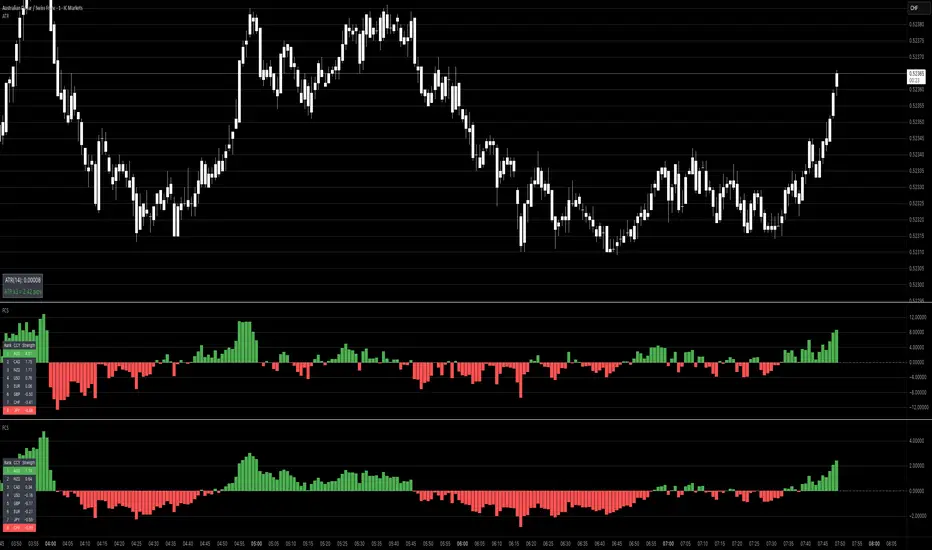
forex rsi volume Here are major currency and the strength of RSI volume compare to each other
example of break shown by arrow
choose the one that you want and highlight it

ForexSignals TV's Scapling Strategyhere is way to use
www.youtube.com
design for use on 5 min time frame only
green candle is trigger bar
green background is buy trends only
red background is sell trends only
use fibo retranchement from drawingtool to manage SL and TP by yourself

Forex SessionsModified from ChrisMoody
Using UTC times (So set your clocks in TV to UTC time)
and double check times at
forex.timezoneconverter.com

Fx SessionsThis script displays a lower strip to be aware of Fx Sessions (London, NY and Tokyo). Please pay attention to the pre London "Kill Zone" which comprehends the Gap between the Tokyo close (End of Yellow Strip) and the London open (Beginning of Aqua Strip).
Courtesy from Kevin Prudhom from Octopus Fx Academy.

Forex Buy and SellI'm trying to make this send me an alert when it would normally have a buy or sell strategy indicator. Can anyone help? Thanks.

Forex Fisher 2 Moving AveragesThe original script was posted on ProRealCode by user Nicolas.
This indicator is made of a recent highest and lowest (10 periods default) passed into a fisher transform filter. Then a simple moving average is set other this value to generate signals like a MACD. Another weighted moving average smooth the whole value to act like an overall trend.
Of course because of average smoothing, signals maybe too late. You can play with period of highest/lowest looback, as well of the 2 moving average.

Sarina - 6 EMA Smart Signals - Colored AreasAdvanced 6 EMA system with smart MACD-based color coding. Features triple EMA pairs, dual signal types (MACD-only & FULL), real-time dashboard, and customizable displays. Perfect for multi-timeframe trend analysis with clear visual signals.
# 6 EMA Smart Signals with Colored Areas
## Overview
A sophisticated multi-timeframe indicator featuring three independent EMA systems with intelligent color coding based on MACD momentum. Perfect for traders who want clear visual signals and comprehensive trend analysis.
## Key Features
✅ **Triple EMA System** - 6 EMAs total (3 fast + 3 slow)
✅ **Smart Color Coding** - 4-color system based on MACD strength
✅ **Dual Signal Types** - MACD-only & FULL (EMA crossover) signals
✅ **Real-time Dashboard** - Compact table with all vital statistics
✅ **Fully Customizable** - Adjust every color, period, and display option
## How It Works
The indicator plots three pairs of EMAs, each representing different time horizons. The area between each fast/slow EMA pair is colored based on the corresponding MACD histogram's strength and direction. This creates an intuitive visual representation of momentum across multiple timeframes.
## Signal Interpretation
- **🟢 Green Triangles (Below Bar):** Buy signals
- **🔴 Red Triangles (Above Bar):** Sell signals
- **Faint Triangles:** MACD-only signals (quicker, more sensitive)
- **Bright Triangles:** FULL signals (EMA crossover + MACD, more reliable)
## Best Practices
1. **Start with defaults** - The preset periods (9/13, 21/34, 55/89) work well across most markets
2. **Use multi-system confirmation** - Wait for at least 2 systems to agree before entering
3. **Watch color alignment** - When all three areas turn the same color, the trend is strongest
4. **Combine with price action** - Use support/resistance levels for better entries
## Compatibility
- Works on all markets (Forex, Stocks, Crypto, Commodities)
- Suitable for all timeframes (1 minute to monthly)
- Compatible with other indicators
## Settings Guide
### EMA Systems
- **System 1 (Blue):** Short-term signals
- **System 2 (Green):** Medium-term trend
- **System 3 (Orange):** Long-term direction
### Display Options
- Toggle individual systems on/off
- Choose between MACD colors or solid fills
- Adjust signal visibility independently
## Disclaimer
This indicator is for educational and research purposes only. Past performance does not guarantee future results. Always practice proper risk management and consult with a financial advisor before trading.

Algomist.app v1.0🚀 WMA Crossover Momentum Scalper: Algomist.app AUTO-EXECUTION
This strategy is a momentum-based trend-following system optimized for fully automated, high-frequency trade execution via algomist.app webhooks. It systematically enters trades based on a powerful moving average crossover, confirmed by both volume and volatility filters.
⚙️ Core Strategy Logic
This script is designed to capture short- to medium-term moves in trending markets by combining three key indicators:
Trend Confirmation (WMA Crossover): The primary signal is generated when a Fast WMA (50-period) crosses the Slow WMA (100-period). This crossover confirms the shift in the prevailing trend direction.
Volume Filter (VWAP): The trade is only taken if the price is trading above the VWAP for Long entries, or below the VWAP for Short entries. This ensures the trade is aligned with the asset's average price relative to trading volume.
Volatility Filter (ATR): A minimum Average True Range (ATR) filter is applied. This is critical for avoiding entries during periods of extreme low volatility ("chop"), ensuring the market has enough movement to justify the trade.
🔗 Algomist.app Automation Ready
This is the most important feature. The script contains custom-coded alert() functions that output a perfect JSON payload, making it 100% compatible with the algomist.app webhook infrastructure.
Seamless Execution: The strategy instantly transmits all required parameters—symbol, side, entry_price, dynamic stop_loss, and dynamic take_profit—directly to your MT5 terminal through the algomist.app connector.
Simple Setup: To enable live automation, you only need to configure a TradingView alert using the provided webhook URL and the {{strategy.order.alert_message}} placeholder on the bar's close.
Default Asset: The webhook is pre-configured to trade the ETHUSDC symbol. This can be easily adapted to other crypto or Forex pairs within the algomist.app settings.
🛡️ Dynamic Risk Management (ATR-Based)
Risk management is dynamic, ensuring the Stop Loss and Take Profit levels automatically adapt to current market volatility:
Stop Loss (SL): Placed at a customizable (x) * ATR distance from the entry price. The default setting is 3.0x ATR.
Take Profit (TP): Placed at a customizable (x) * ATR distance from the entry price. The default setting is 9.0x ATR, offering a fixed Reward-to-Risk ratio of 3:1 (9.0 / 3.0).
Position Sizing: The script uses strategy.percent_of_equity = 10% for backtesting, but the algomist.app execution is based on an internal calculation using a small percentage (e.g., 5%) of a leveraged notional value for illustrative purposes. Users must set their risk size within the algomist.app platform.
Disclaimer: This script is provided as an example for Algomist.app users and is NOT financial advice. Backtest thoroughly across various assets and timeframes. Past performance is not indicative of future results. The user assumes all responsibility for live trading risk.

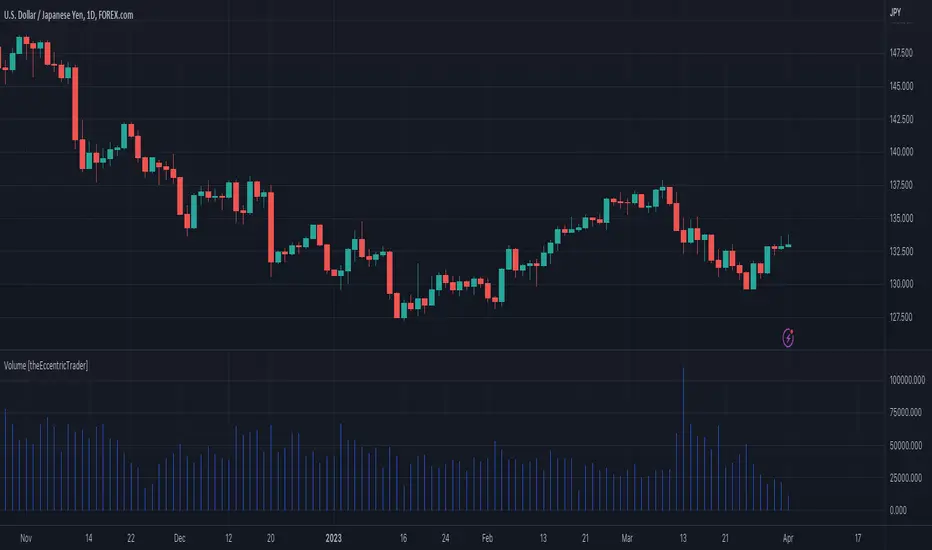
Volume [theEccentricTrader]OVERVIEW
This indicator simply bridges the gap between symbols from brokers that provide volume data and symbols from brokers that do not provide volume data. Users can select any symbol that provides volume data from the settings menu and the volume data will be displayed in histogram form on their current chart. The default volume symbol is CURRENCYCOM:US500.
CONCEPTS
Volume
Volume refers to the total number of shares or contracts that are traded during a given period of time. It is a measure of the amount of activity in the market and can be used to gauge the strength or weakness of a particular trend.
Volume is typically displayed as a histogram on trading charts, with each bar representing the total volume for a particular time period. High volume bars indicate a lot of trading activity, while low volume bars indicate relatively little trading activity.
Traders use volume in a number of ways. For example, they may use it to confirm a trend. If a stock is trending up and the volume is also increasing, this can be seen as a sign that the trend is strong and likely to continue. Conversely, if a stock is trending down and the volume is also increasing, this can be seen as a sign that the trend is weak and may be coming to an end. Volume can similarly be used to identify potential reversals. If a stock is trending up but the volume starts to decrease, this could indicate that the trend is losing momentum and that a reversal may be imminent.
FEATURES
Inputs
• Volume Symbol
Style
Users can change plot color and style from the default Style menu if so required.
NOTES
For 24-hour markets and forex volume I use the broker currency.com. As can be seen in the example above, I am using CURRENCYCOM:USDJPY to pull volume to a FOREXCOM:USDJPY chart, which otherwise would not show volume data as forex.com do not provide it.